
Abstract
We assessed the co-expression of cell cycle-related biomarkers in a series of 121 consecutive cases of high-grade ductal carcinoma in situ (DCIS), pure or associated with invasive carcinoma, and their associations with the different immunoprofiles of DCIS. Cases were identified from the histopathology files of the Breast Pathology Laboratory, Federal University of Minas Gerais, Brazil, from 2003 to 2008. The expression of estrogen receptor, progesterone receptor, HER2 overexpression, cytokeratin 5, epidermal growth factor receptor 1, cyclooxygenase-2, p16 and Ki67 were assessed. Tumors were placed into five subgroups according to their immunohistochemical profile: luminal A, luminal B, HER2, basal-like and “not classified”. We found that the basal phenotype was associated with a higher frequency of p16-positive cases (83%) and the luminal A phenotype showed a higher frequency of p16-negative cases (93%; p=0.000). The association of biomarkers p16+/Ki67+/COX2+ was expressed in 02/06 cases (33.3%) of the basal phenotype but in only 01/70 cases (1.4%) of the luminal A phenotype (p=0.01). The co-expression of p16+/Ki67+/COX2- was associated with a basal phenotype (p=0.004). P16 expression, p16+/Ki67+/COX2+ and p16+/Ki67+/COX2- co-expression showed significant associations with the basal phenotype and these profiles could be used to guide more aggressive treatment strategies in patients with high-grade DCIS.
Introduction
Ductal carcinoma in situ (DCIS) of the breast is a heterogeneous group of pre-invasive lesions characterized by varying degrees of risk for transformation into invasive carcinoma. With the introduction of screening mammography programs in developed countries, the incidence of DCIS has increased in recent years (Burstein et al. 2004; O’Sullivan and Morrow 2007). DCIS constitutes 20% of all newly diagnosed breast cancer cases and 30% to 40% of breast cancers diagnosed mammographically in the United States of America (Siziopikou 2013). In Brazil, where there were no well-established screening programs during the period of this study, opportunistic screening prevails and breast cancer is still diagnosed in the advanced stages. It is estimated that DCIS represents less than 10% of breast cancer diagnoses in Brazil (Tipos de câncer… c1996-2015; Controle de câncer… c2015).
In order to investigate the risk factors associated with the progression from DCIS to invasive carcinoma, genetic and molecular studies have been conducted (Siziopikou 2013; Ross et al. 2013). However, we are still unable to predict an individual patient’s risk of developing invasive breast cancer.
A biomarker is a molecular feature that can be objectively measured and serves as an indicator of a normal biological response, a pathogenic process, or the likelihood of a response to an existing or novel pharmacologic therapy (Lari and Kuerer 2011). For DCIS, the perfect biomarker or combination of biomarkers would establish which cases were highly associated with progression to invasive breast cancer and thus determine which patients needed further therapy (Lari and Kuerer 2011).
Currently, estrogen receptor is the only biomarker validated for routine clinical use in DCIS (Lakhani et al. 2012). There is a controversy regarding whether routine progesterone receptor testing is necessary in DCIS. Other biomarkers expressed in invasive breast cancers have been evaluated in DCIS, although the prevalence of the expression of these markers differs in invasive carcinoma and DCIS (Bryan et al. 2006; Dabbs et al. 2006; Livasy et al. 2007; Paredes et al. 2007; Tamimi et al. 2008; Perez et al. 2013). Furthermore, all of the molecular subtypes found in invasive cancer, such as luminal A, luminal B, HER2 and basal-like, are identified in DCIS (Lakhani et al. 2012).
High-grade DCIS has been associated with an increased risk of recurrence and progression to invasive carcinoma (Lakhani et al. 2012). However, current management strategies are based only on conventional histopathology, host factors, and estrogen receptor status. Additional molecular characterization of high-grade DCIS would provide more information about both patient prognosis and the benefit of adjuvant treatments.
The purpose of this study was to evaluate the co-expression of cell cycle-related biomarkers in a series of cases of high-grade DCIS, pure or associated with invasive carcinoma, and their association with the different immunoprofiles of DCIS.
Material & Methods
Specimen Selection
We evaluated 121 cases of high-grade DCIS, pure or associated with invasive mammary carcinoma (IMC), consecutively identified from the histopathology files of the Breast Pathology Laboratory, School of Medicine, Federal University of Minas Gerais, Brazil, from 2003 to 2008. The original hematoxylin and eosin-stained sections were reviewed to confirm the diagnosis of high-grade DCIS and select a representative block for additional immunostaining. The criteria defined by the World Health Organization were used for the histopathological diagnosis and grading of DCIS (Lakhani et al. 2012).
Immunohistochemistry
Estrogen receptor (ER), progesterone receptor (PR), human epidermal growth factor receptor 2 (HER2), cytokeratin 5 (CK5), epidermal growth factor receptor 1 (EGRF), cyclooxygenase-2 (COX-2), tumor suppressor protein p16 and nuclear antigen Ki67 were assessed. The reactions were performed using automated BenchMark XT / LT TM and the UltraView Universal REF 760-500 DAB kit (Ventana; Tucson, AZ) according to the manufacturer’s instructions. The sources and dilutions of the primary antibodies are listed in Table 1. All antibodies used in the study were previously tested in our laboratory using normal tissues and tumoral samples known to contain the antigens (Table 2). Positivity was confirmed by the presence of a sharp reaction in cellular binding sites that are known to express the markers used in the study. We did not observe nonspecific staining in cells where the antibodies should not be expressed. Antibodies specificity was also evaluated by its sharpness of staining and cell or tissue localization.
Primary Antibody Sources and Dilutions Used in this Study.
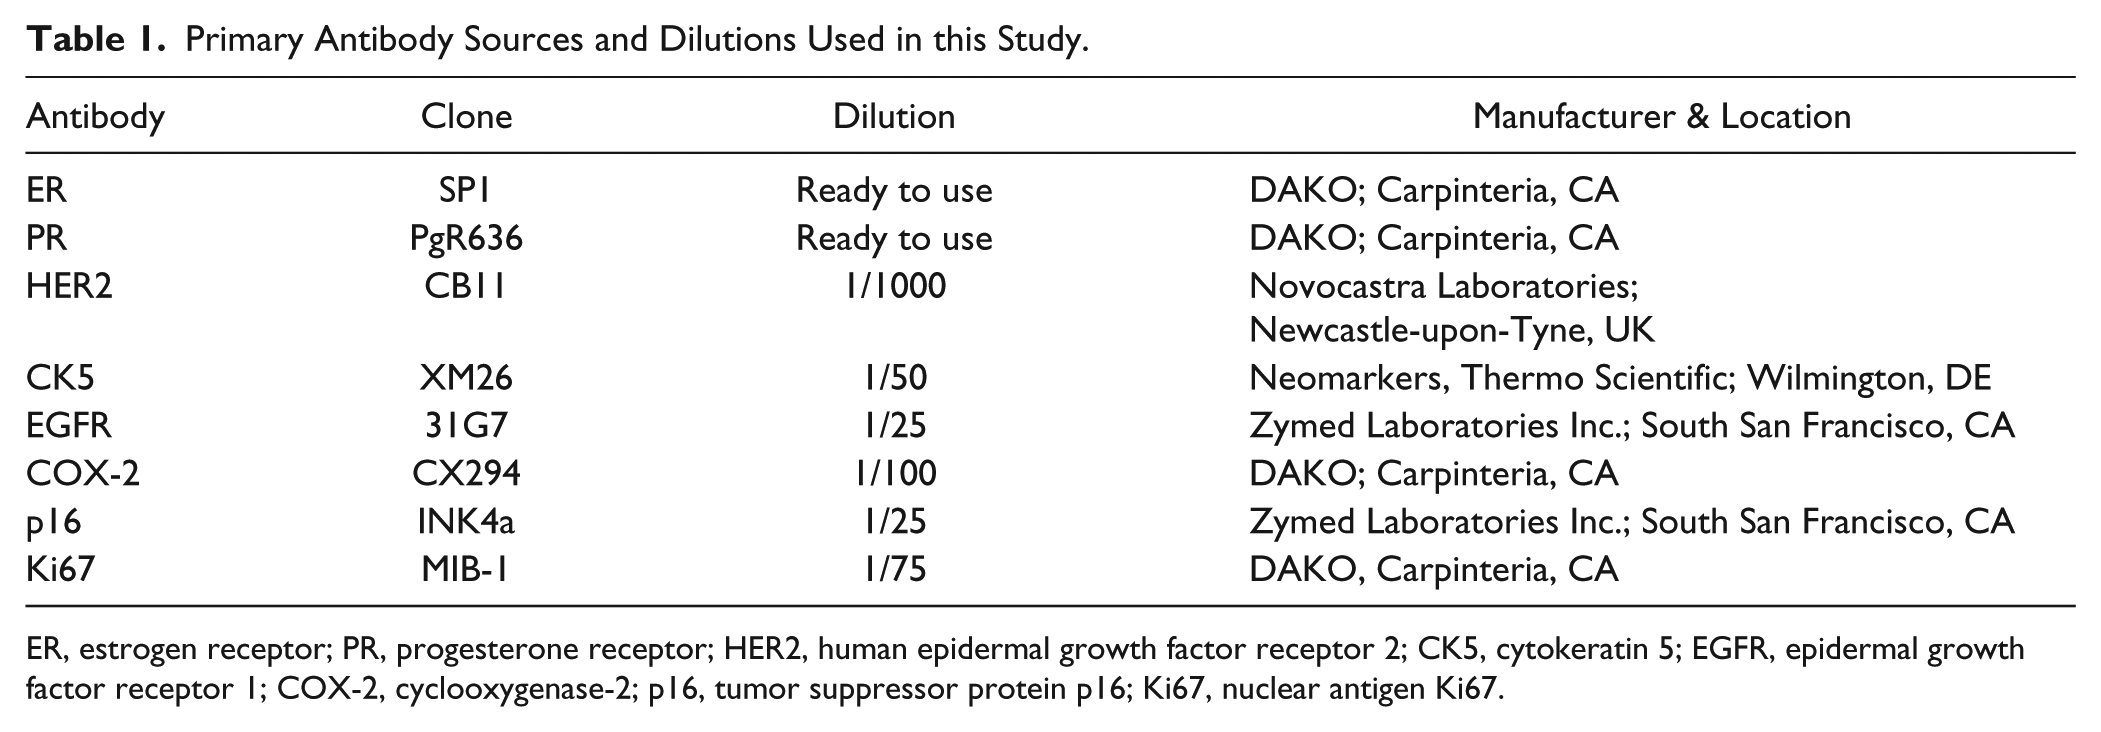
ER, estrogen receptor; PR, progesterone receptor; HER2, human epidermal growth factor receptor 2; CK5, cytokeratin 5; EGFR, epidermal growth factor receptor 1; COX-2, cyclooxygenase-2; p16, tumor suppressor protein p16; Ki67, nuclear antigen Ki67.
Positive and Negative Controls Used in the Study.
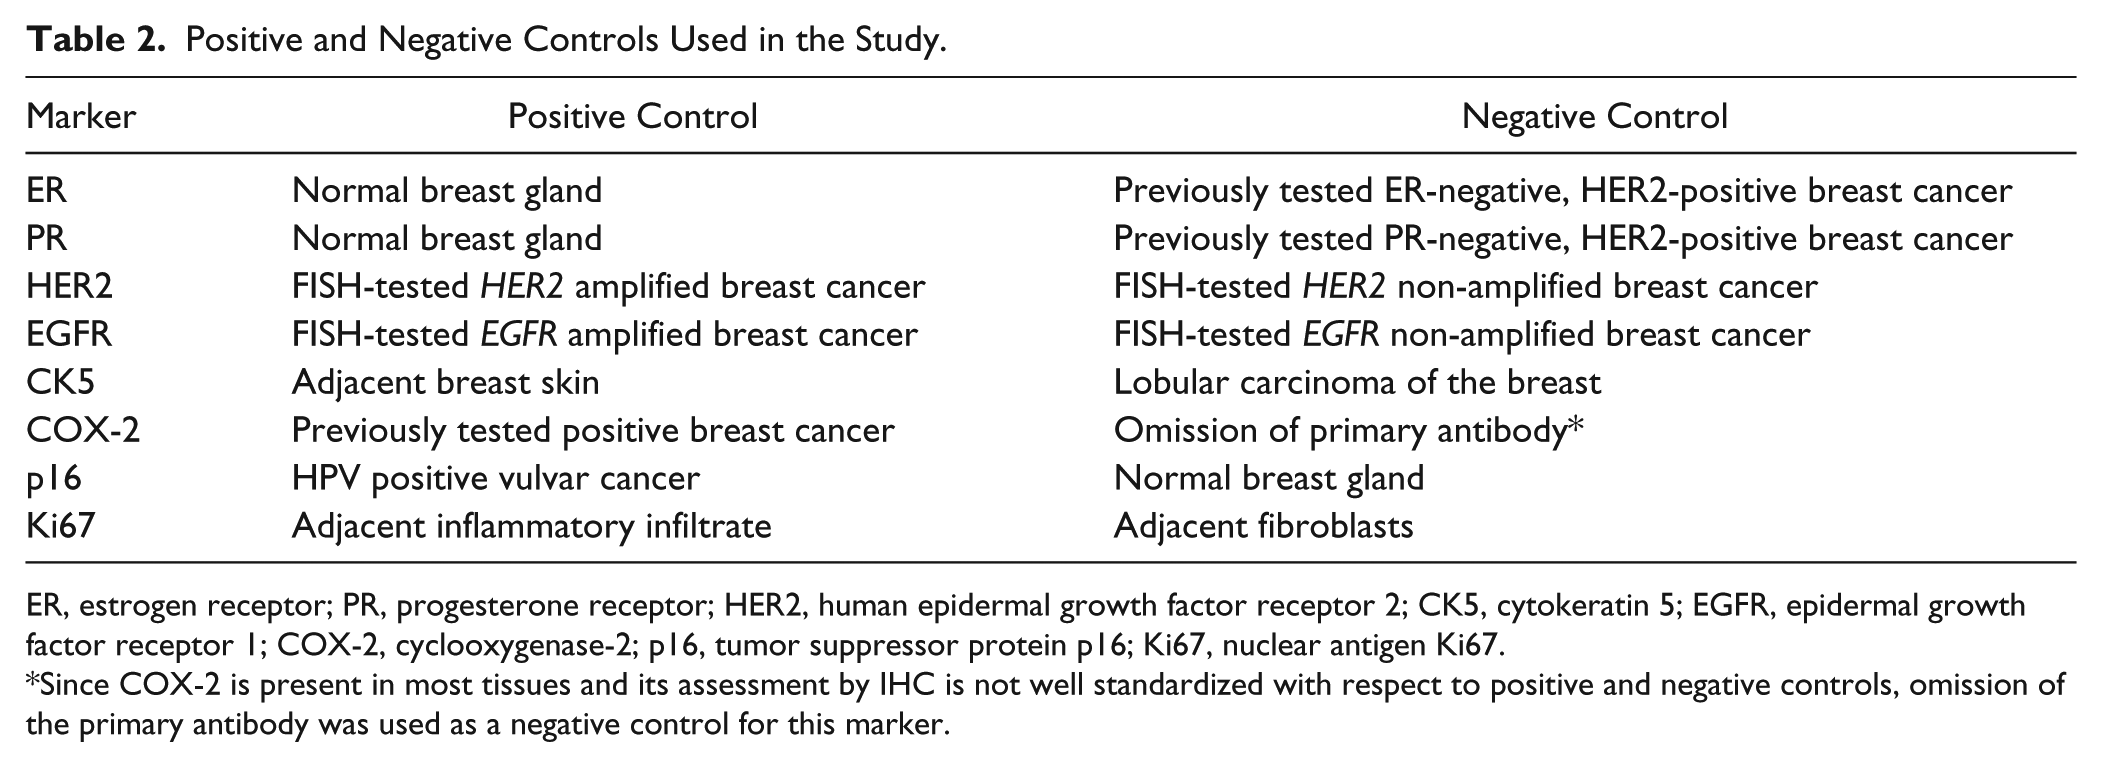
ER, estrogen receptor; PR, progesterone receptor; HER2, human epidermal growth factor receptor 2; CK5, cytokeratin 5; EGFR, epidermal growth factor receptor 1; COX-2, cyclooxygenase-2; p16, tumor suppressor protein p16; Ki67, nuclear antigen Ki67.
Since COX-2 is present in most tissues and its assessment by IHC is not well standardized with respect to positive and negative controls, omission of the primary antibody was used as a negative control for this marker.
Allred’s scoring system was used to evaluate estrogen and progesterone receptor status; cases were considered positive when more than 1% of neoplastic cells showed moderate or strong nuclear staining (Hammond et al. 2010). HER2 overexpression was analyzed according to the American Society of Clinical Oncology and College of American Pathologists recommendations: HER2-positive staining was considered if circumferential membrane staining was complete, intense, and within more than 10% of tumor cells (Wolff et al. 2013). Any degree of cytoplasmic staining for CK5 and any degree of distinct membranous staining for EGFR were considered positive expression for these markers (Livasy et al. 2007). COX-2 expression was evaluated according to the criteria described by Ristimäki et al. (2002): 0, no staining; 1+, weak diffuse cytoplasmic staining (may contain stronger intensity in less than 10% of the cancer cells); 2+, moderate to strong granular cytoplasmic staining in 10% to 90% of cancer cells; 3+, over 90% of the tumor cells stained with strong intensity. Scores 2+ and 3+ were considered COX-2 positive. For p16, staining was graded as 0 (no cells staining), 1+ (diffuse weak nuclear or cytoplasmic blush or <25% cell showing strong staining), 2+ (25% to 75% of cells with strong staining), and 3+ (>75% cells showing strong staining). Score 3+ was considered high p16 expression (Witkiewicz et al. 2011). The Ki67 labeling index was determined by counting ≥500 nuclei in areas of the section with the highest labeling rates and a threshold of ≥20% was indicative of a high proliferation index (Goldhirsch et al. 2013).
Immunohistochemical profile
Both components (in situ and invasive) of tumors were categorized into five subgroups according to their immunohistochemical profiles: luminal A (ER+/HER2-), luminal B (ER+/HER2+), HER2 (ER-/HER2+), basal-like (ER-/HER2-/EGFR+ and/or CK5+), and “not classified” (all markers negative) (Nielsen et al. 2004; Carey et al. 2006; Livasy et al. 2007).
Statistical analysis
The Pearson’s Chi-square test and Fisher’s exact test were used to evaluate the expression of the molecular markers. A p value <0.05 was considered statistically significant. This study was approved by the Research Ethics Committee of the Federal University of Minas Gerais (protocol 655/08).
Results
Pure DCIS was detected in 42/121 cases (35% of the total), whereas 79/121 cases (65% of the total) were associated with invasive mammary carcinoma. The mean age at diagnosis was 53.4 years (SD ± 11.9 years). Among all age groups, luminal A was the most common phenotype. There was a significant difference between luminal A and HER2 subtypes in relation to age (p=0.026). The luminal A phenotype was more frequently identified in younger patients and HER2 immunophenotype in women older than 50 years.
The frequencies of the expression of biomarkers in high-grade DCIS are shown in Table 3. We identified a high Ki67 proliferation index (28/40 cases, 70% for pure DCIS and 51/71 cases, 71.8% for IMC-associated DCIS; Fig. 1A) and high ER positivity (29/42 cases, 69% for pure DCIS and 56/79 cases, 70.9% for IMC-associated DCIS; Fig. 1B) in the majority of cases. There was no significant difference in frequency between biomarkers in pure and IMC-associated DCIS samples (p>0.05).
Expression of Biomarkers in High-Grade Ductal Carcinoma In Situ (Pure or Associated With Invasive Carcinoma).
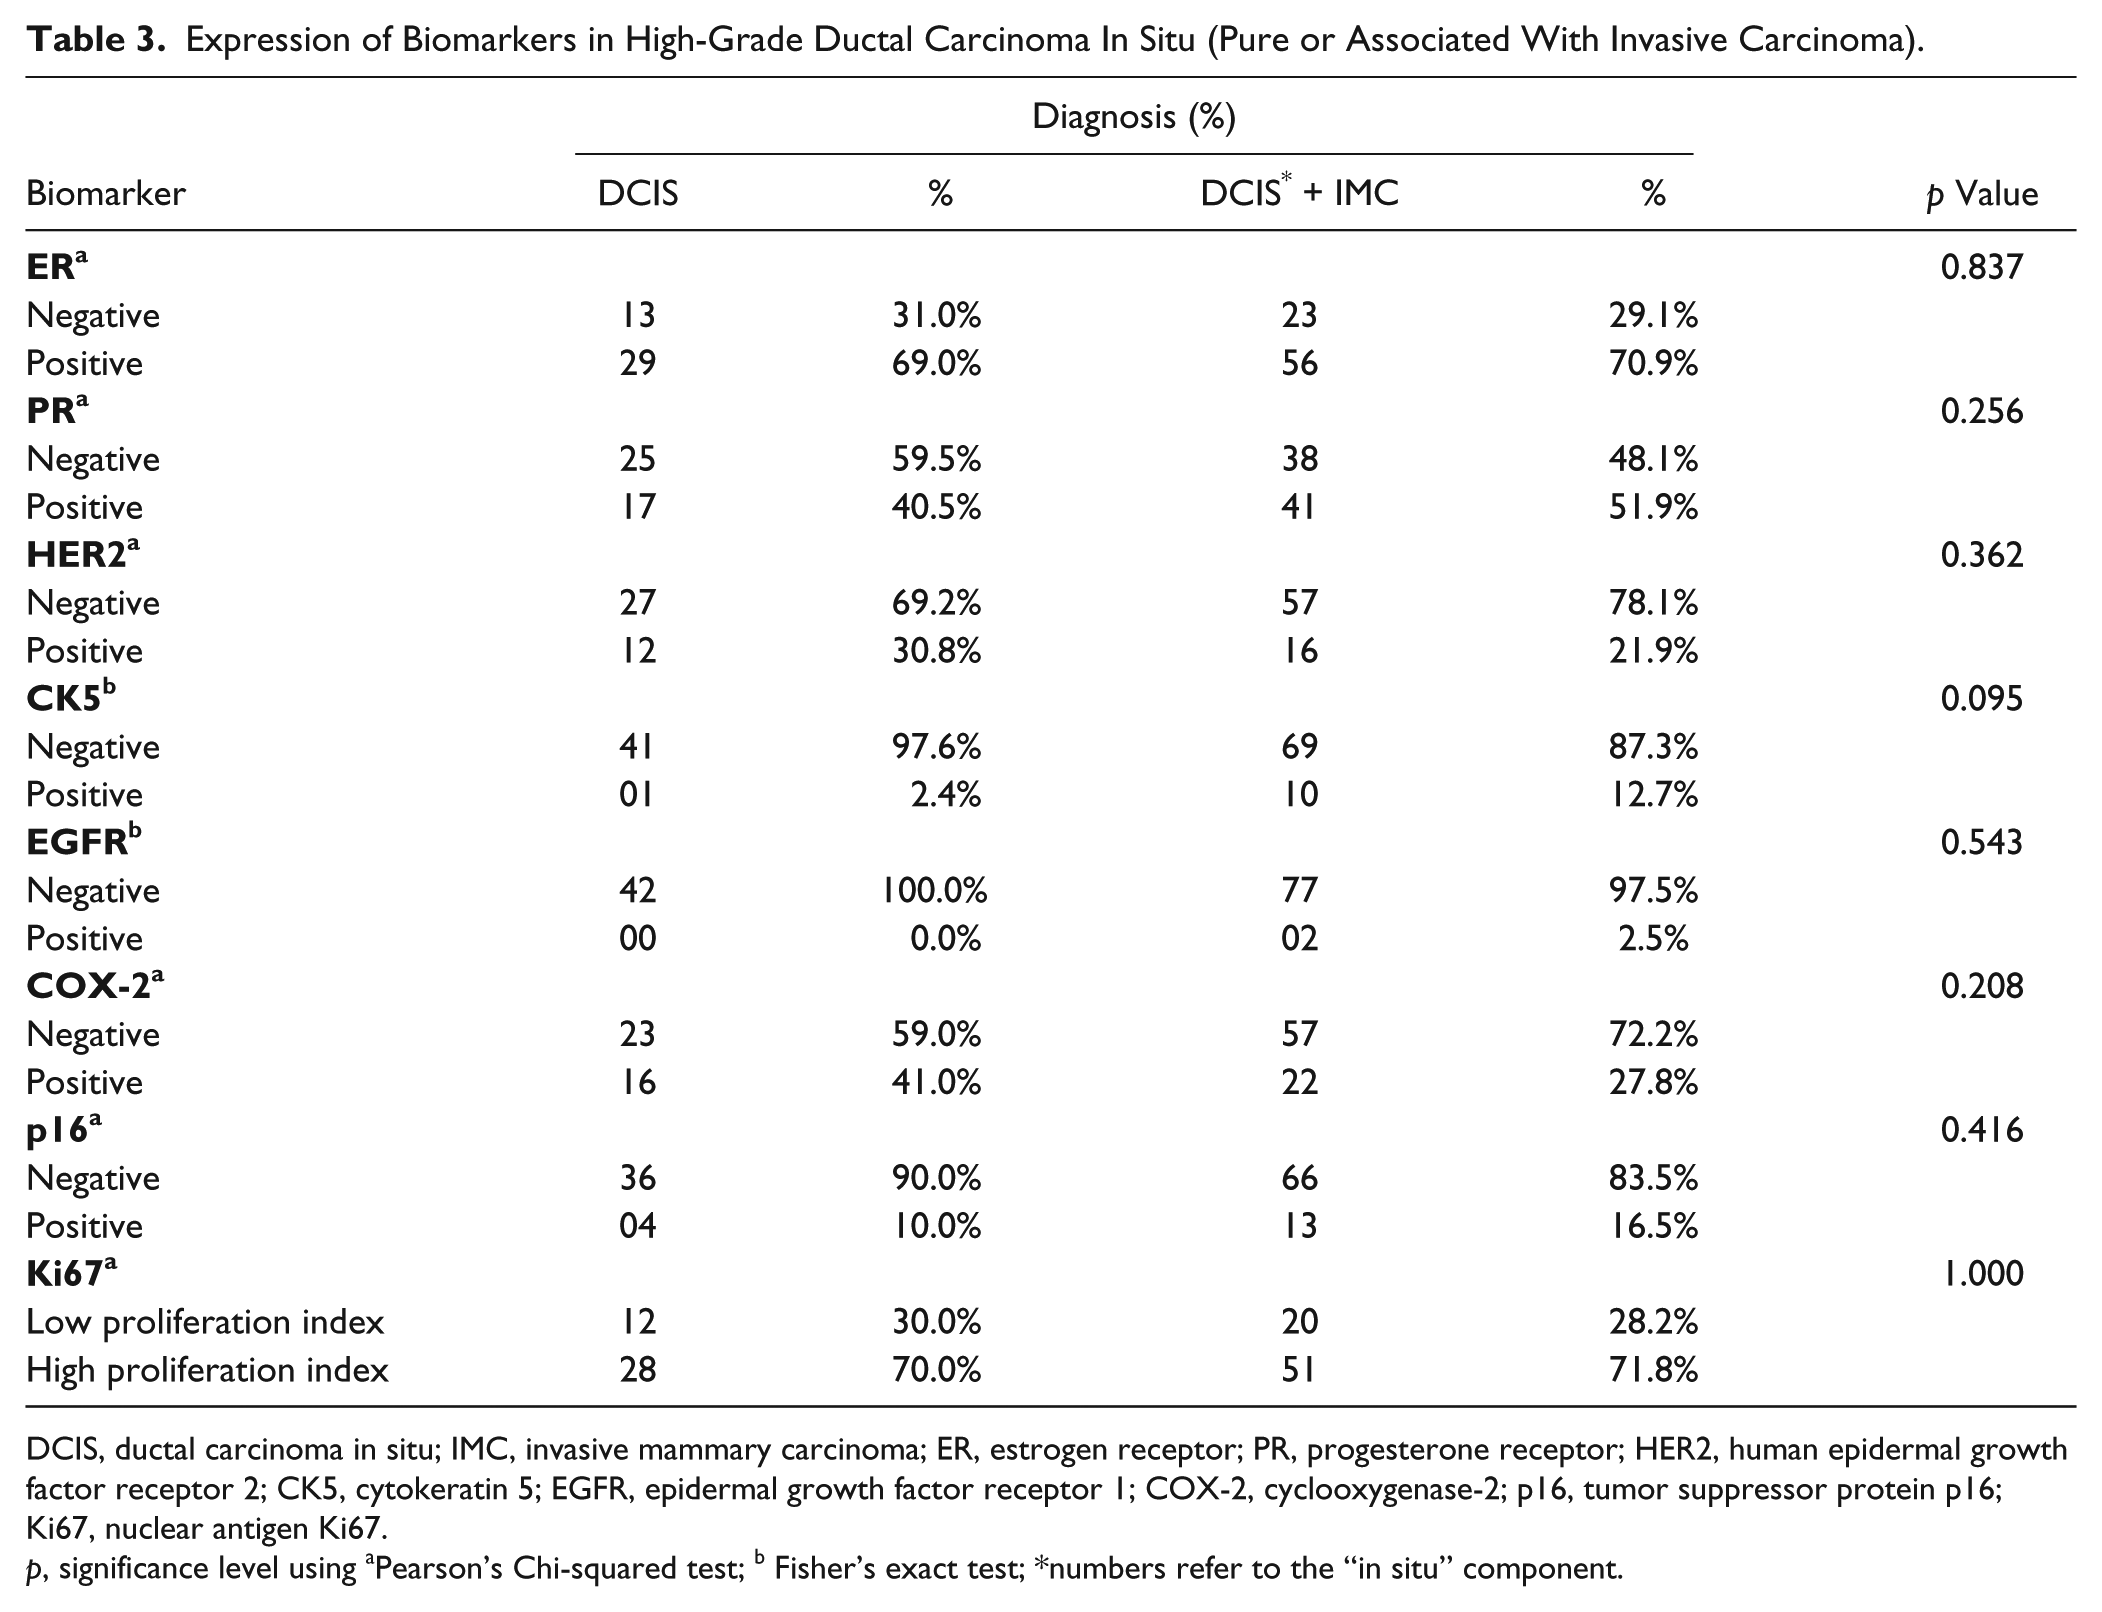
DCIS, ductal carcinoma in situ; IMC, invasive mammary carcinoma; ER, estrogen receptor; PR, progesterone receptor; HER2, human epidermal growth factor receptor 2; CK5, cytokeratin 5; EGFR, epidermal growth factor receptor 1; COX-2, cyclooxygenase-2; p16, tumor suppressor protein p16; Ki67, nuclear antigen Ki67.
p, significance level using aPearson’s Chi-squared test; b Fisher’s exact test; *numbers refer to the “in situ” component.
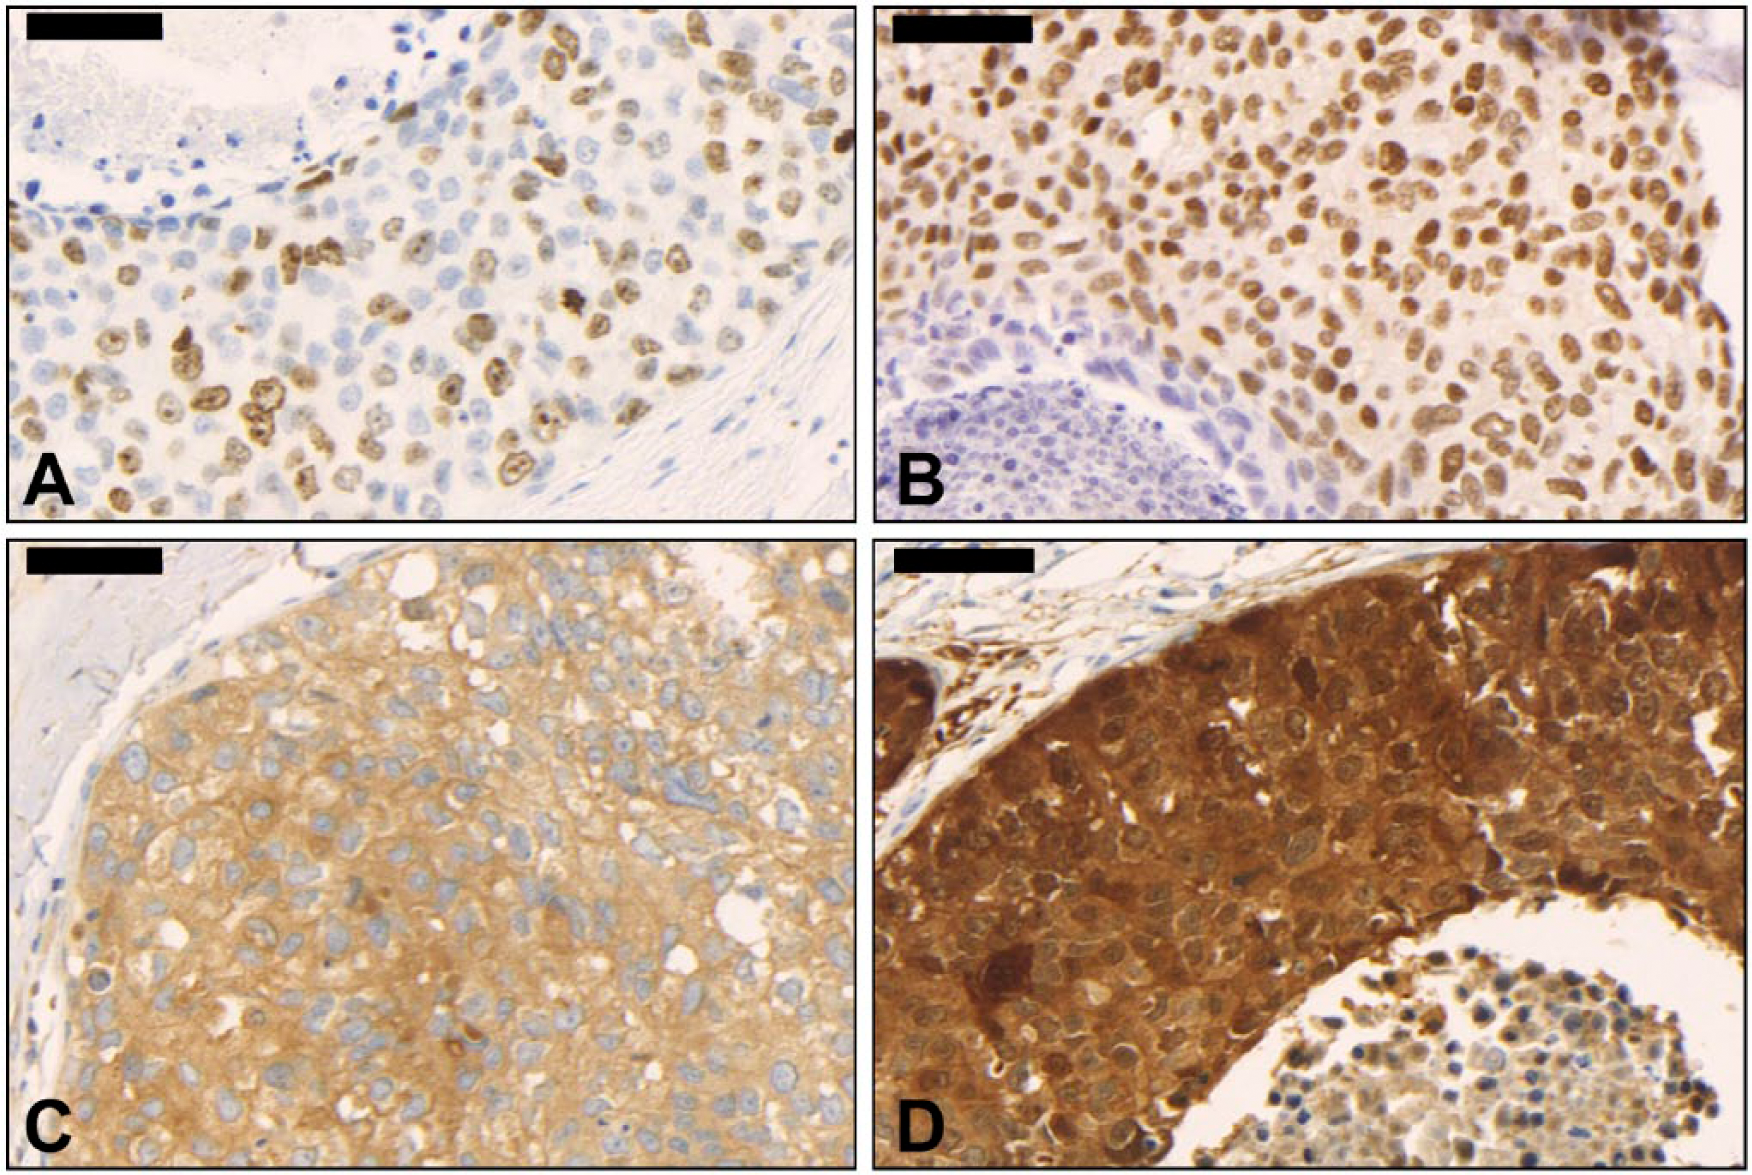
High-grade ductal carcinoma in situ of the breast. (A) High Ki67 proliferation index (400×); (B) Estrogen receptor positivity (400×); (C) Cyclooxygenase-2 (COX-2) positivity (400×); D: p16 positivity (400×). Scale, 50 µm.
COX-2 was evaluated in 118/121 cases (97.5% of the total); DCIS was absent in three slides stained for COX-2 (2.5% of the total). COX-2 immunostaining was negative in 80/118 cases (68%) and positive in 38/118 cases (32%; Fig. 1C; Table 3). COX-2 staining was positive in 23% of ER-positive cases (27/118), 11% of HER-positive cases (12/109), 2% of CK5-positive cases (02/118), and 21% of cases with high Ki67 expression (23/110). There was no significant association between COX-2 expression and the biomarkers ER, HER2, Ki67 and CK5 (p>0.05; data not shown).
Ki67 was evaluated in 111/121 cases (92% of the total); DCIS was absent in 10 slides stained for Ki67 (8% of the total). High proliferative activity was identified in 48% of ER-positive cases (53/111), 20% of HER2-positive cases (21/103) and 7% of CK5-positive cases (08/111). There was no significant association between proliferative index and the expression of ER, HER2 and CK5 (p>0.05; data not shown).
P16 was evaluated in 119/121 cases (98% of the total); DCIS was absent in two slides stained for p16 (2% of the cases). P16 was positive (Fig. 1D) in 76/119 (64%) of ER-negative cases but only in 08/119 (7%) of ER-positive cases (p=0.040; Table 4). P16 was positive in 07/119 (6%) of CK5-positive cases and only in 04/119 (3%) of CK5-negative cases (p=0.000; Table 4).
Associations among p16, ER, HER2 and CK5 in High-Grade Ductal Carcinoma In Situ.
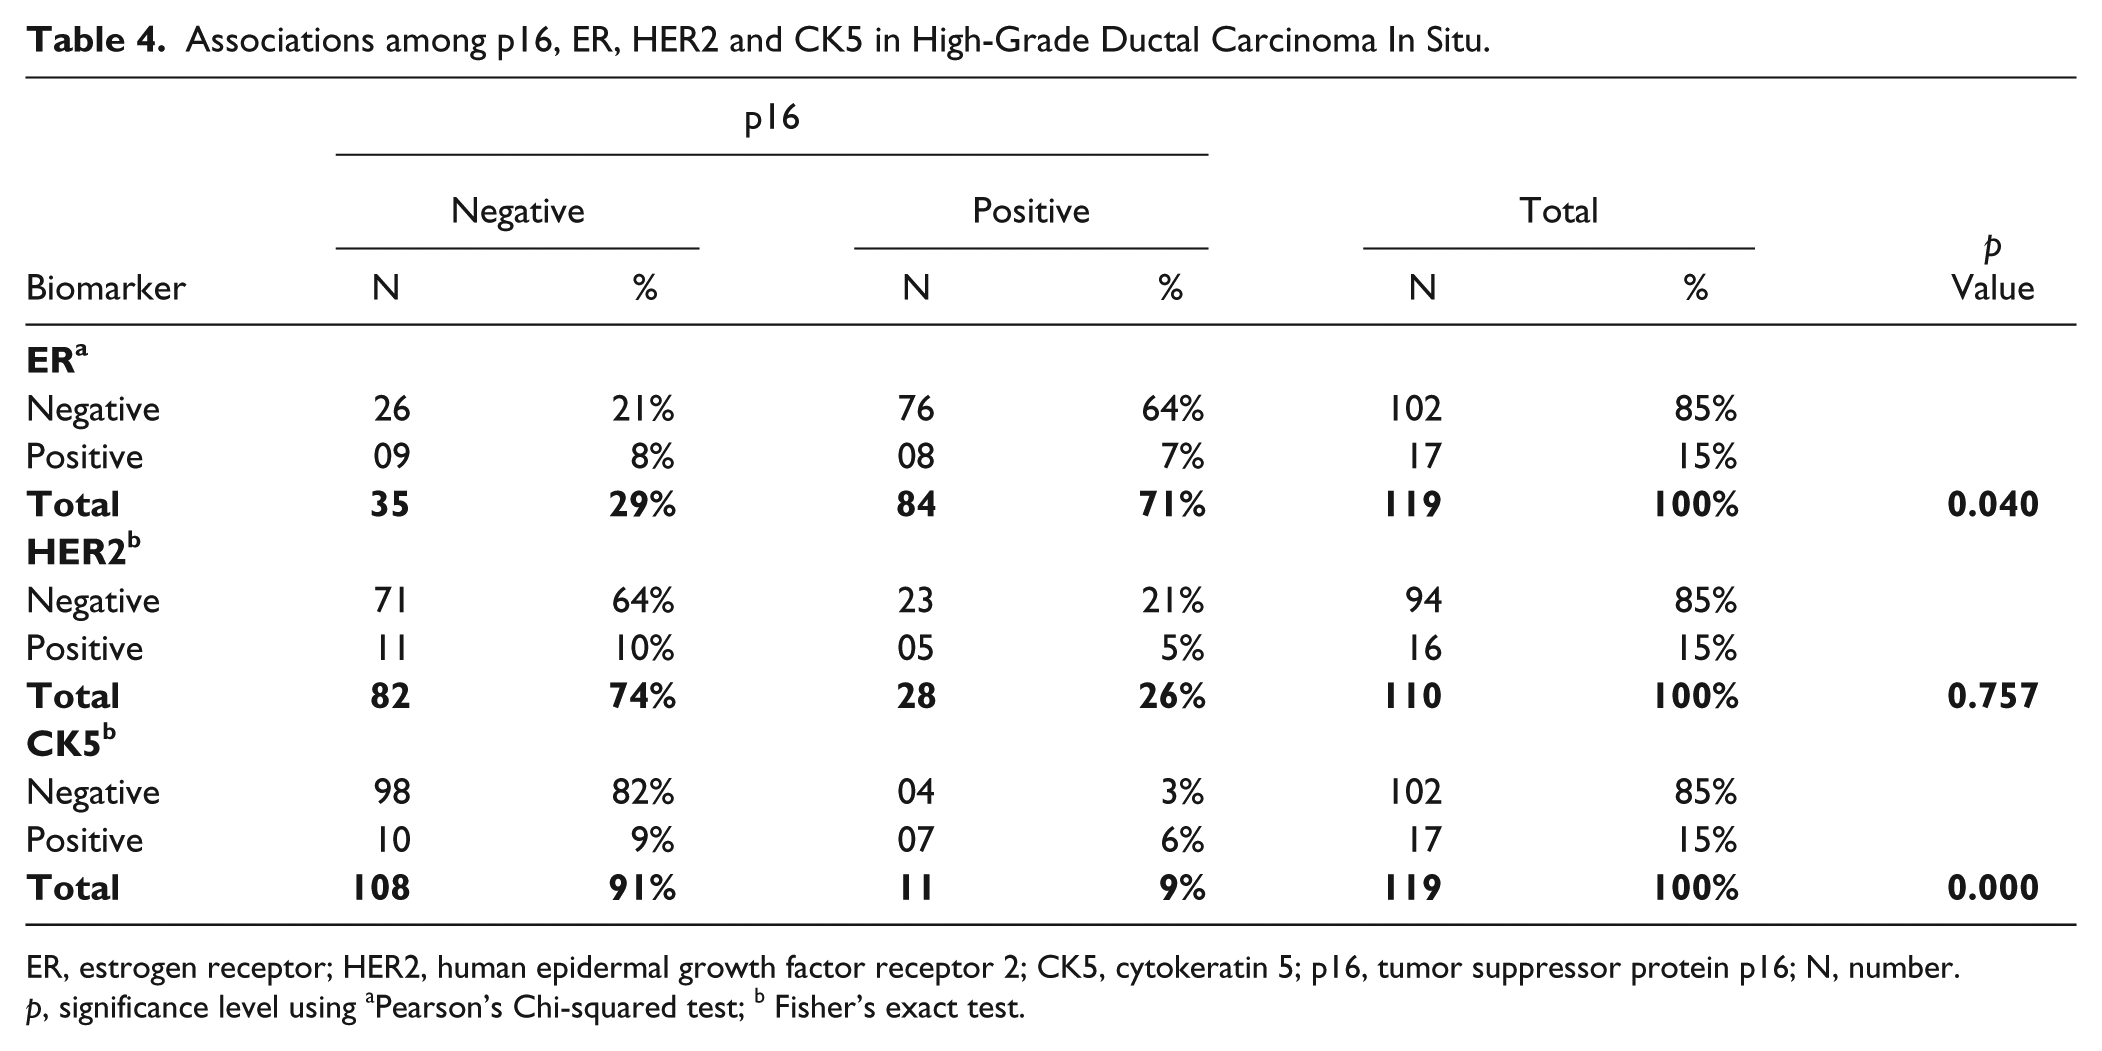
ER, estrogen receptor; HER2, human epidermal growth factor receptor 2; CK5, cytokeratin 5; p16, tumor suppressor protein p16; N, number.
p, significance level using aPearson’s Chi-squared test; b Fisher’s exact test.
Basal phenotype was associated with a higher expression of p16 (83%) and luminal A phenotype was associated with negative p16 expression (93%; p=0.000; Table 5).
Expression of Biomarkers COX-2, p16, Ki67 and Molecular Phenotypes in High-Grade Ductal Carcinoma In Situ.
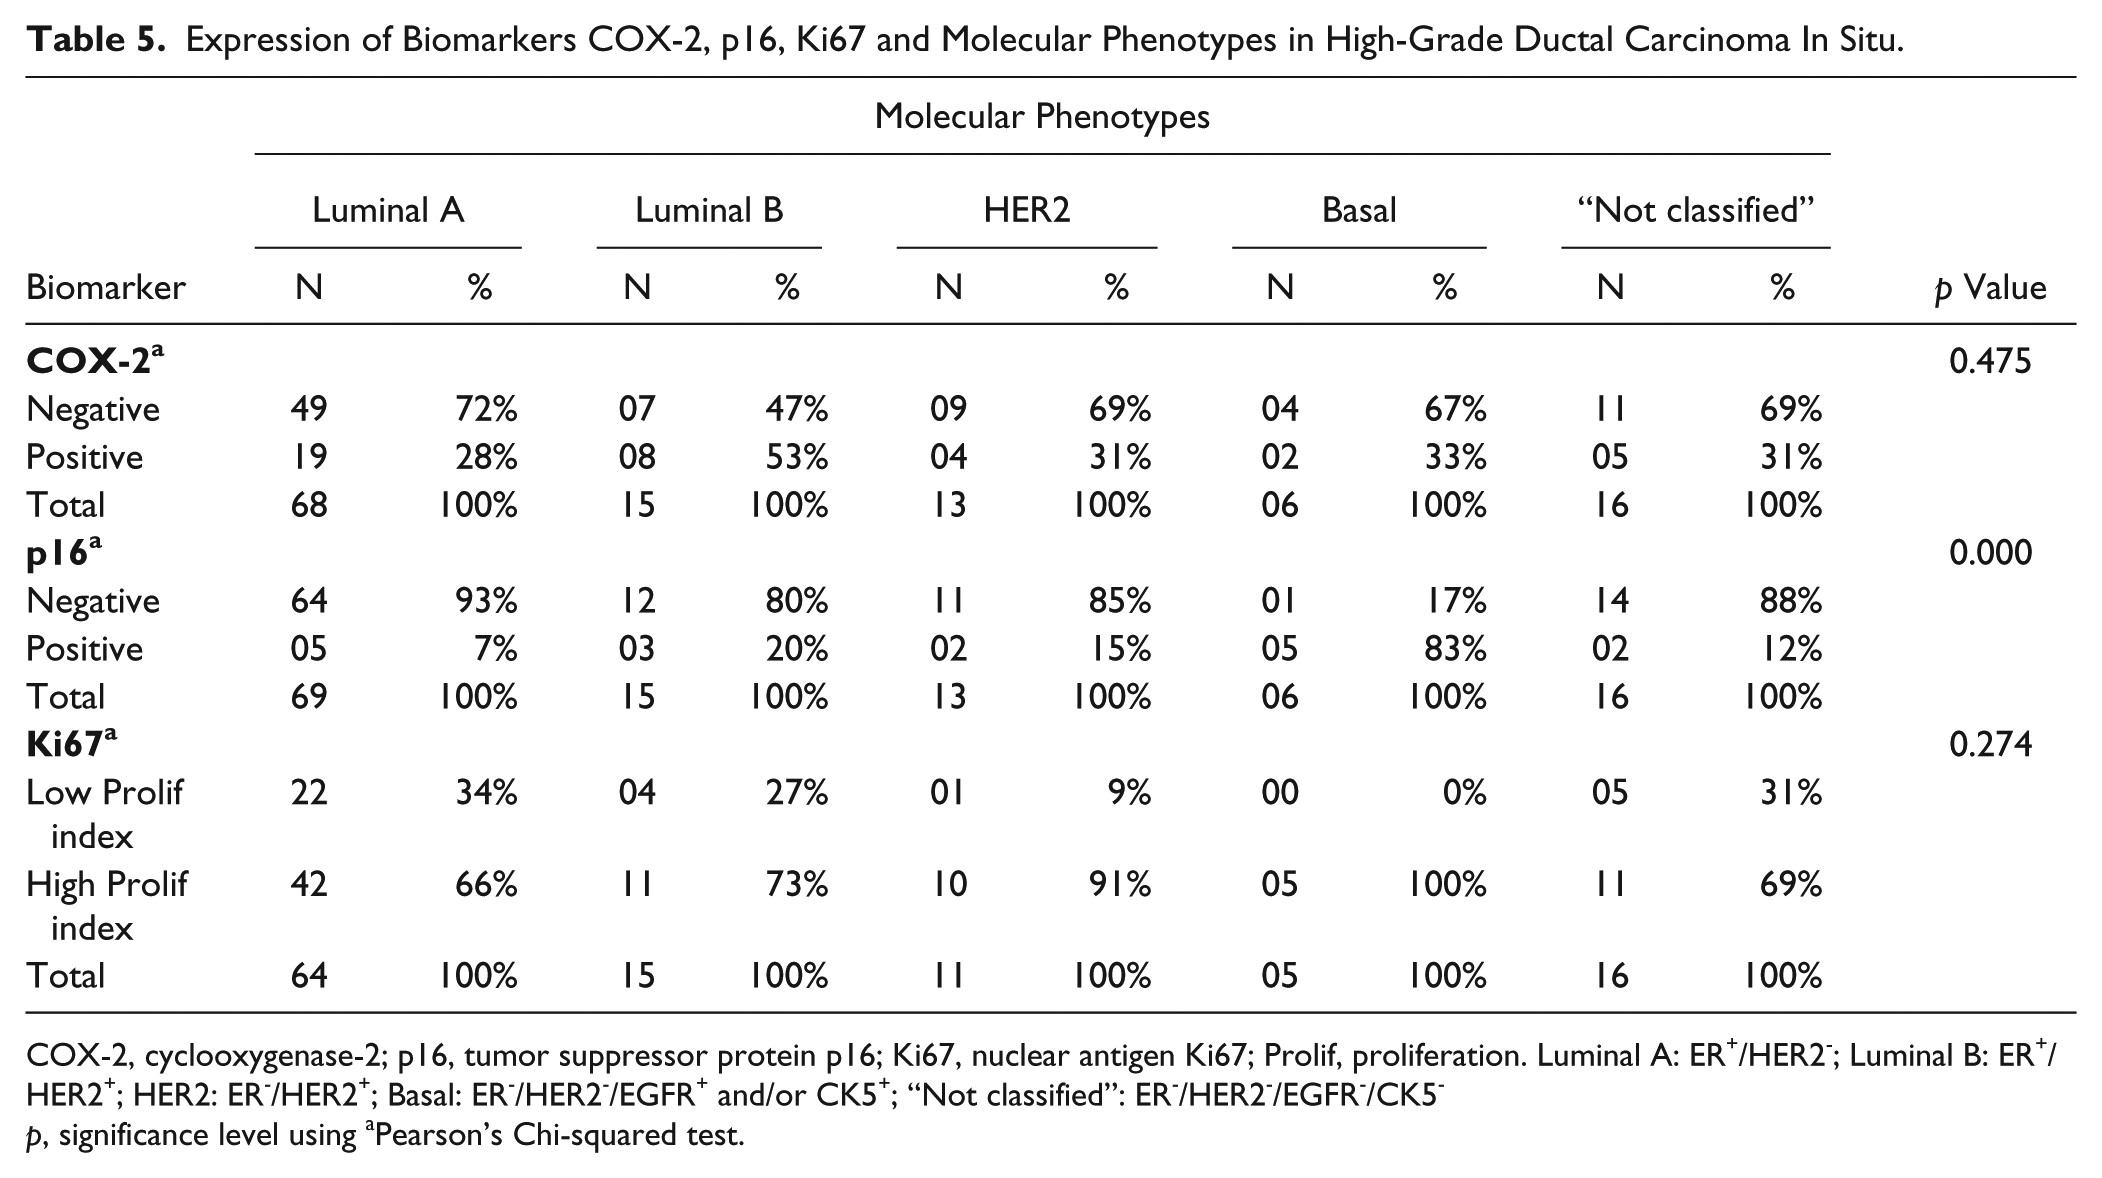
COX-2, cyclooxygenase-2; p16, tumor suppressor protein p16; Ki67, nuclear antigen Ki67; Prolif, proliferation. Luminal A: ER+/HER2-; Luminal B: ER+/HER2+; HER2: ER-/HER2+; Basal: ER-/HER2-/EGFR+ and/or CK5+; “Not classified”: ER-/HER2-/EGFR-/CK5-
p, significance level using aPearson’s Chi-squared test.
The associations between molecular subtypes and the co-expression of biomarkers COX-2, p16 and Ki67 are shown in Table 6. The co-expression of biomarkers was not evaluated in eleven cases because of the absence of tumor in the immunostained slide for one of the markers. P16 was positive in 05/06 cases (83%) of basal phenotype but only in 05/70 cases (7%) of luminal A phenotype (p=0.0004; Table 6). The association of biomarkers p16+/Ki67+/COX2+ was expressed in 02/06 cases (33.3%) of basal phenotype but only in 01/70 cases (1.4%) of luminal A phenotype (p=0.01; Table 6). The co-expression of p16+/Ki67+/COX2- was associated with basal phenotype (03/06 cases, 50%, p= 0.004; Table 6).
High-Grade Ductal Carcinoma In Situ: Associations between Molecular Phenotype and Biomarker(s) Expression (COX-2, p16, Ki67).
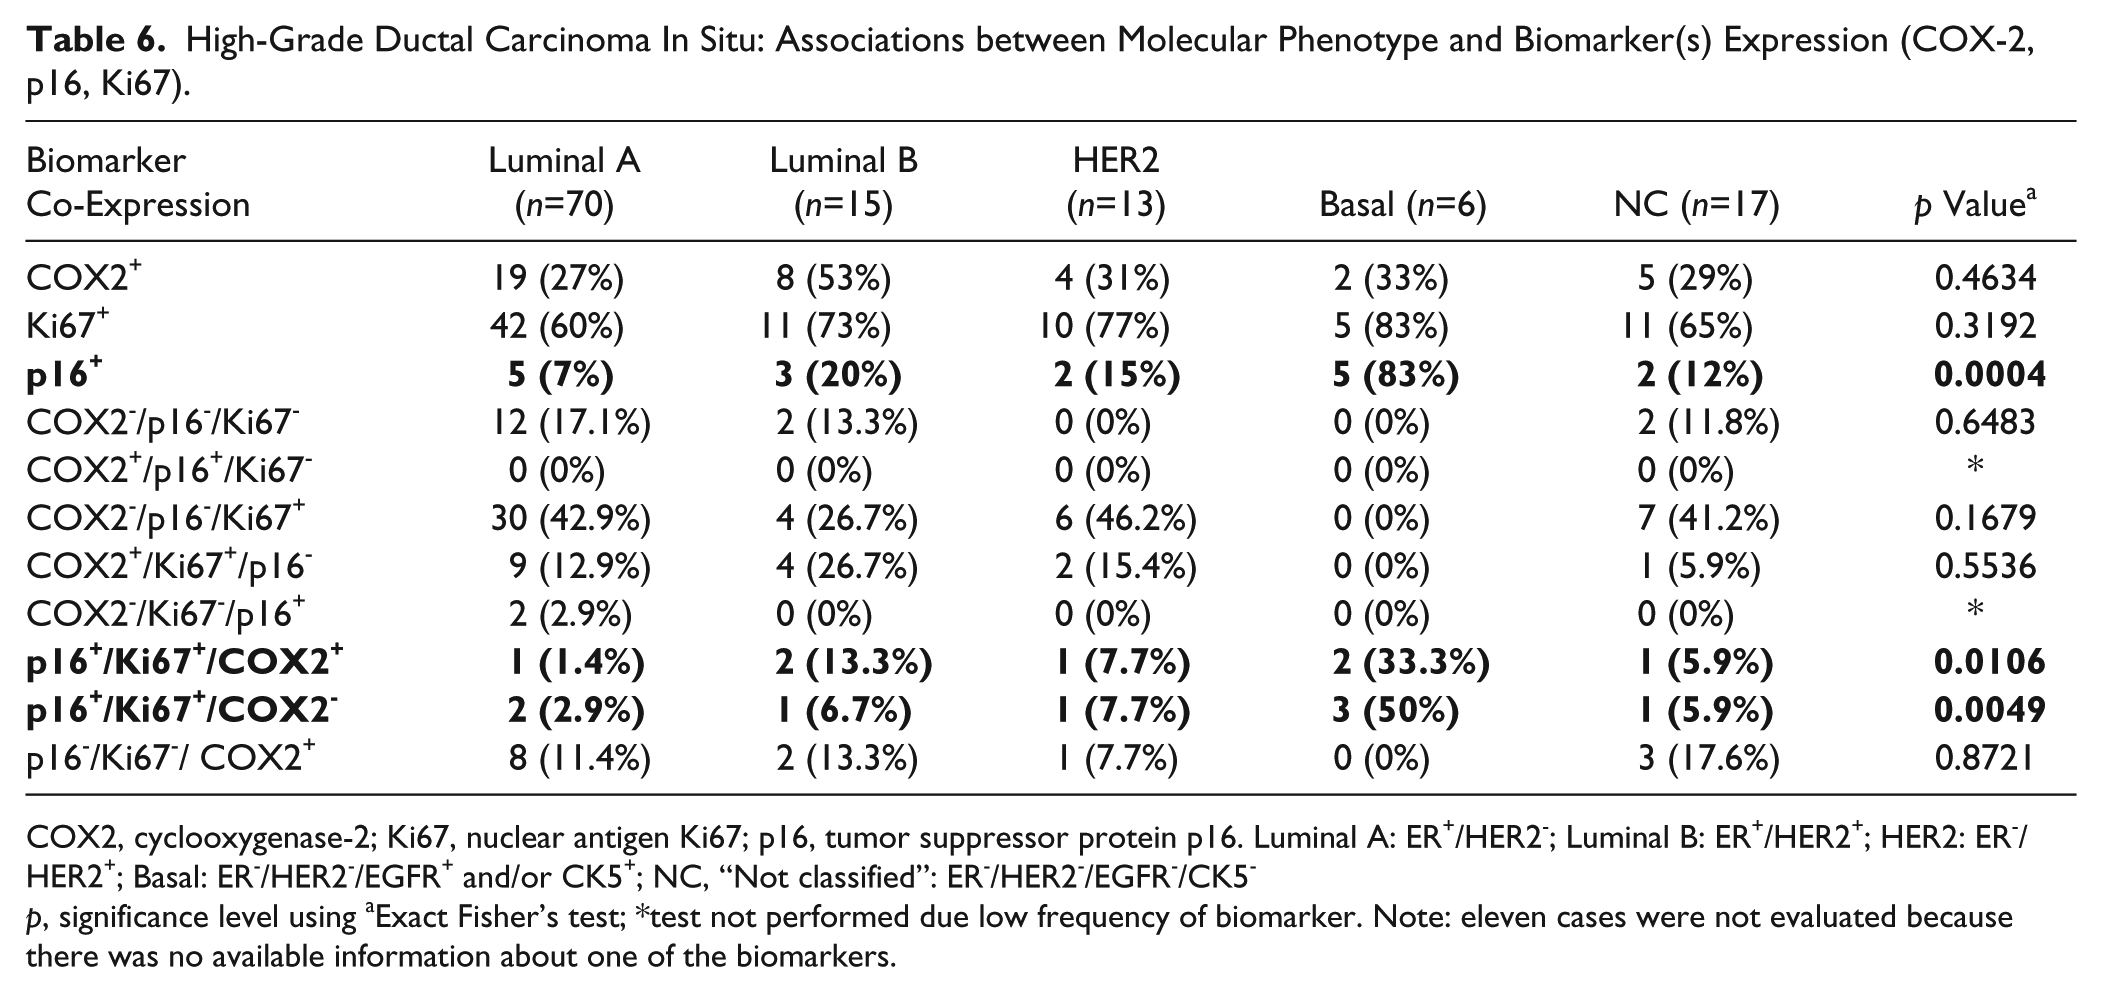
COX2, cyclooxygenase-2; Ki67, nuclear antigen Ki67; p16, tumor suppressor protein p16. Luminal A: ER+/HER2-; Luminal B: ER+/HER2+; HER2: ER-/HER2+; Basal: ER-/HER2-/EGFR+ and/or CK5+; NC, “Not classified”: ER-/HER2-/EGFR-/CK5-
p, significance level using aExact Fisher’s test; *test not performed due low frequency of biomarker. Note: eleven cases were not evaluated because there was no available information about one of the biomarkers.
Discussion
With the aim of contributing to a better understanding of the molecular features of DCIS, we determined the frequencies of cell cycle-related biomarkers in a series of cases of high-grade DCIS, pure or associated with invasive carcinoma. We also evaluated the co-expression of these markers and their association with the different molecular profiles of DCIS. We selected a specific subset of high-grade DCIS of the breast because it has a higher risk of local recurrence and progression to invasive carcinoma (Lakhani et al. 2012). In our series, we evaluated pure and IMC-associated DCIS samples and we did not observe a significant difference in the frequency of each biomarker in pure or IMC-associated DCIS subgroups (p>0.05).
Previous studies have been conducted to identify important biomarkers associated with DCIS and candidate biomarkers associated with increased risk of ipsilateral recurrence after a diagnosis of DCIS (Nofech-Mozes et al. 2005; Kerlikowske et al. 2010; Lopez-Garcia et al. 2010; Wang et al. 2011; Rakovitch et al. 2012; Ross et al. 2013; Benson and Wishart 2013; Perez et al. 2013). For DCIS, the optimal biomarker or combination of biomarkers would provide additional prognostic information beyond that provided by other clinical and pathological factors that have been previously established in the field as risk factors for local recurrence, such as DCIS grade and size, patient age, margin status, and use versus nonuse of adjuvant radiation and endocrine therapies (Lari and Kuerer 2011).
A statistically significant increase in the incidence of breast cancer between 1976 and 2009 was described in women aged 25 to 39 years, without a corresponding increase seen for an older population of women (Johnson et al. 2013). Our results identified a higher frequency of the luminal A phenotype in younger women and a higher frequency of the HER2 subtype in older women (p=0.026). In contrast, VandenBussche et al. (2013) described a higher proportion of the luminal B phenotype in younger patients in addition to a predominance of high-grade lesions, which could contribute to an increased rate of local recurrence in this population.
Although our series was composed of patients with high-grade DCIS, we found positivity for ER in 69% of pure DCIS cases and 70.9% of IMC-associated DCIS, frequencies that are in accordance with the literature (range, 49% to 96.6%; mean, 68.7%) (Lari and Kuerer 2011). A previous study revealed ER expression to be inversely related to the nuclear grade of DCIS: ER expression was higher in well-differentiated lesions than in poorly differentiated lesions (Lari and Kuerer 2011). ER is the only biomarker validated for routine clinical use in DCIS (Lakhani et al. 2012). ER status in patients with breast cancer predicts response to endocrine therapy, and evidence points to an association between ER-negative DCIS and a higher risk of local recurrence (Provenzano et al. 2003).
Our data showed a lower frequency of COX-2 positivity in high-grade DCIS cases (32%) as compared with the few studies in the literature that have evaluated this marker (mean, 62.4%) (Lari and Kuerer 2011). This difference could partly be attributable to different scoring systems and cut-offs used for COX-2 immunoreactivity. According to our data, COX-2 alone did not show a significant association with the expression of other biomarkers or different molecular phenotypes. COX-2 is a cytoplasmic enzyme involved in prostaglandin synthesis, and prostaglandins are pro-angiogenic molecules (Nofech-Mozes et al. 2005). COX-2 overexpression has been shown to be upregulated in neoplastic and preneoplastic lesions of the breast and its expression has been associated with higher nuclear grade, high Ki67 expression, ER negativity, HER2 positivity and risk of local–regional recurrence in DCIS (Lari and Kuerer 2011). There is also evidence to suggest that COX-2 inhibitors may function as chemopreventative agents in breast cancer and DCIS lesions (Leo et al. 2006; Generali et al. 2014).
We identified a high Ki67 proliferation index in the majority of cases of our series (70% for pure DCIS and 71.8% for IMC-associated DCIS). The Ki67 expression rate in our series is likely higher than the mean rate described in other studies (10.9% to 15.5%), which included DCIS of different grades (Lari and Kuerer 2011). Tumor proliferation rate may be evaluated by measuring the S-phase fraction by flow cytometry but this method is rarely applied in routine evaluation of tumors. Ki67 expression correlates with the S, G1, G2 and M phases, but not with the G0 phase (Inwald et al. 2013). Mitotic count correlates with grade, and a high proliferative activity has been previously associated with high-grade DCIS lesions (Nofech-Mozes et al. 2005; Lari and Kuerer 2011). No standard evaluation score or generally accepted cut-off definition exists for Ki67 (Inwald et al. 2013). In this study, we used the criteria proposed by the 2013 St. Gallen Consensus; i.e., a threshold of ≥20% is indicative of a high proliferation index (Goldhirsch et al. 2013). In our series, there was no significant association between Ki67 positivity and the expression of ER, HER2 or CK5 (p>0.05). The tumor proliferation rate is an important prognostic factor in invasive breast cancer. Although Ki67 has been frequently studied in DCIS, it is not validated as a prognostic factor independent of tumor grade (Nofech-Mozes et al. 2005; Lari and Kuerer 2011).
Our results identified a lower frequency of p16 positivity (10% in pure DCIS and 16.5% in IMC-associated DCIS) as compared with that in the previously reported literature (range, 28% to 39.3%; Lari and Kuerer 2011). It is possible that different criteria were used to evaluate the expression of this biomarker. We found a significant association among p16-positive, CK5-positive and ER-negative cases. P16 is a tumor suppressor protein that regulates cellular proliferation, growth and is also associated with local recurrence and progression to invasive cancer. Thus, we believe that an identification of p16 expression in high-grade DCIS would help clinicians in their decision to treat patients more aggressively.
In our series, a basal phenotype was associated with a higher frequency of p16 positive cases (83%) whereas a luminal A phenotype showed a higher frequency of p16 negative cases (93%). It is known that the luminal A phenotype has the best prognosis and basal-like phenotype usually a poorer prognosis in invasive breast cancer (Perou et al. 2000; Sorlie et al. 2003).
In the present study, the co-expression of p16, Ki67 and COX-2 (triple positive, p16+/Ki67+/COX2+) was more frequently associated with basal phenotype than with luminal A DCIS (33.3% versus 1.4%; p=0.01). We also identified a significant association between the pattern p16+/Ki67+/COX2- and the basal phenotype (p=0.004). Kerlikowske and colleagues demonstrated that women with DCIS that were positive for p16, Ki67 and COX-2 presented with an 8-year risk of subsequent invasive cancer, and that this was significantly higher than that for women who were p16, Ki67 and COX-2 negative (hazard ratio, 2.2; 95% CI, 1.1 to 4.5; Kerlikowske et al. 2010). They also showed a higher 8-year risk of subsequent DCIS for women with p16+/Ki67+/COX2- status (hazard ratio, 3.7; 95% CI, 1.7 to 7.9).
In our series, we did not perform a follow-up of patients due to the short time span after the initial diagnosis and the need for at least 8 to 10 years for evaluation of local recurrence of DCIS. Moreover, the follow-up evaluation would require a larger number of pure DCIS cases.
In conclusion, p16 expression, alone or in combination with Ki67 and COX-2, is associated with a basal phenotype among patients with high-grade DCIS. It is possible that these biomarkers could be incorporated into routine clinical practice of DCIS evaluation and that this “triple test” could be useful in guiding the choice for a more aggressive treatment plan in patients with high-grade DCIS and/or to develop new targeted therapies in chemoprevention. It would be interesting to follow-up these cases to confirm the value of p16, Ki67 and COX-2, and to validate the co-expression of these putative biomarkers as prognostic and/or predictive factors for DCIS of the breast.
Footnotes
Declaration of Conflicting Interests
The authors declared no potential conflicts of interest with respect to the research, authorship, and/or publication of this article.
Funding
The authors disclosed receipt of the following financial support for the research, authorship, and/or publication of this article: This work was supported in part by grants from Fundação de Amparo a Pesquisa de Minas Gerais (FAPEMIG), and Conselho Nacional de Desenvolvimento Científico e Tecnológico (CNPq).