
Abstract
Schimke immuno-osseous dysplasia (SIOD) is a pleiotropic disorder caused by mutations in the SWI/SNF2-related, matrix-associated, actin-dependent regulator of chromatin, subfamily a-like-1 (SMARCAL1) gene, with multiple clinical features, notably end-stage renal disease. Here we characterize the renal pathology in SIOD patients. Our analysis of SIOD patient renal biopsies demonstrates the tip and collapsing variants of focal segmental glomerulosclerosis (FSGS). Additionally, electron microscopy revealed numerous glomerular abnormalities most notably in the podocyte and Bowman’s capsule. To better understand the role of SMARCAL1 in the pathogenesis of FSGS, we defined SMARCAL1 expression in the developing and mature kidney. In the developing fetal kidney, SMARCAL1 is expressed in the ureteric epithelium, stroma, metanephric mesenchyme, and in all stages of the developing nephron, including the maturing glomerulus. In postnatal kidneys, SMARCAL1 expression is localized to epithelial tubules of the nephron, collecting ducts, and glomerulus (podocytes and endothelial cells). Interestingly, not all cells within the same lineage expressed SMARCAL1. In renal biopsies from SIOD patients, TUNEL analysis detected marked increases in DNA fragmentation. Our results highlight the cells that may contribute to the renal pathogenesis in SIOD. Further, we suggest that disruptions in genomic integrity during fetal kidney development contribute to the pathogenesis of FSGS in SIOD patients.
Keywords
Introduction
Schimke immuno-osseous dysplasia (SIOD) is an autosomal, recessive disorder characterized by T lymphocyte deficiency, spondyloepiphyseal dysplasia, and progressive nephropathy leading to renal failure (Spranger et al. 1991; Schmidt et al. 1997; Saraiva et al. 1999; Boerkoel et al. 2000; Kilic et al. 2005; Lucke et al. 2005). SIOD is caused by mutations in the gene SMARCAL1 (SWI/SNF2-related, matrix-associated, actin-dependent regulator of chromatin, subfamily a-like 1), which encodes an ATP-driven annealing helicase. The enzymatic activity of SMARCAL1 plays essential roles in DNA-nucleosome restructuring and chromatin remodeling during gene regulation, as well as in DNA replication and repair (Coleman et al. 2000; Boerkoel et al. 2002; Elizondo et al. 2009). The loss of SMARCAL1 function in patients causes DNA replication-associated genomic instability that likely contributes to the pleiotropic phenotypes present in SIOD (Boerkoel et al. 2000; Coleman et al. 2000; Boerkoel et al. 2002; Elizondo et al. 2009).
SIOD can be divided into infantile or juvenile forms (Lou et al. 2002). The infantile form arises from at least one null SMARCAL1 allele caused by a deletion, nonsense, or frameshift mutation (Lou et al. 2002; Elizondo et al. 2009). The infantile form first arises in utero and is characterized by growth retardation, hypothyroidism, bone marrow failure, transient ischemic attacks, strokes, and renal failure resulting in mortality within the first five years of life (Boerkoel et al. 2000; Elizondo et al. 2009). The juvenile onset form arises from missense mutations in SMARCAL1 alleles, leading to a malfunctioning SMARCAL1 protein (Elizondo et al. 2009). Patients with juvenile onset have less severe symptoms then those with infantile onset and can live into the second and third decade of life if the end stage renal disease (ESRD) is treated (Ehrich et al. 1995; Boerkoel et al. 2000; Boerkoel et al. 2002; Lou et al. 2002; Elizondo et al. 2006).
Despite the range in SIOD phenotype severity, ESRD is a primary complication leading to death (Spranger et al. 1991; Ehrich et al. 1995; Schmidt et al. 1997; Saraiva et al. 1999; Boerkoel et al. 2000; Boerkoel et al. 2002; Lou et al. 2002; Kilic et al. 2005; Lucke et al. 2005; Elizondo et al. 2006). SIOD patients present with mild urinary protein loss, which often progresses into steroid resistant nephrotic syndrome culminating in ESRD (Ehrich et al. 1990; Spranger et al. 1991; Ehrich et al. 1995; Ehrich and Filler 1996). An analysis of the renal pathology in SIOD patients is primarily characterized as focal segmental glomerulosclerosis (FSGS) (Boerkoel et al. 2000). FSGS is categorized into five subtypes including the perihilar, cellular, tip, collapsing, and not otherwise specified (NOS) (D’Agati 2003; D’Agati 2008). Certain variants of FSGS may reflect differences in its pathogenesis (D’Agati et al. 2011; Choi 2013), and therefore, characterizing the FSGS variants in SIOD may be helpful in understanding its pathogenesis.
To gain a better understanding of the nephropathy in SIOD patients, we performed an in-depth histological and ultrastructural analysis of SIOD patient renal biopsies. Our histological analysis of SIOD patients demonstrated the presence of the collapsing and tip variants of FSGS. In addition, an analysis of the glomerular ultrastructure by electron microscopy revealed numerous glomerular abnormalities in patients with SIOD. Finally, in examining which cell types may be contributing to the pathogenesis of FSGS in SIOD patients (as determined by defining the expression of SMARCAL1), we observed a dynamic SMARCAL1 expression in the developing and mature human kidney. Together, these data further define the FSGS variants and demonstrate the glomerular cells that may be involved in the renal pathogenesis found in SIOD patients.
Materials & Methods
Human Tissue
Human postnatal kidney tissue and renal biopsies from SIOD patients were collected and analyzed in accordance with the declaration of Helsinki and its guidelines. This study was approved by the ethics committee of McMaster University (Approval Number: 10-332-T). Parents of patients gave their written informed consent.
Microdissection of Mouse Postnatal Kidneys
Kidneys were resected from wild-type C57BL/6 using surgical forceps. Kidneys were washed in PBS, pH 7.4, and whole kidney tissue was fixed in 4% paraformaldehyde for 24 hr at 4C. Animal studies were performed in accordance with animal care and institutional guidelines (Animal Utilization Protocol #100855).
Histology
Kidneys were paraffin-embedded, sectioned (4 μm) and mounted onto Superfrost Plus slides (Thermo Fisher Scientific; Waltham, MA) and incubated overnight at 37C. Sections were deparaffinized using xylene and rehydrated using consecutive 100%, 95%, 75%, 50% ethanol washes. Samples were placed in PBS and stained with hematoxylin and eosin (Sigma-Aldrich; St. Louis, MO), Masson’s trichrome (Sigma-Aldrich) (Masson 1929), periodic acid–Schiff (Sigma-Aldrich) (McManus 1948), and Jones’ methenamine using the Artisan Stain Kit (Dako; Burlington, Canada) (Jones 1957).
Quantification of Fibrosis and Tubular Atrophy
Interstitial fibrosis was assessed as previously described (Servais et al. 2007). Briefly, biopsy tissue was stained with Masson’s trichrome and scanned (200×). We defined the percent of interstitial fibrosis as the number of blue pixels above the threshold in the interstitium divided by the total number of pixels in the renal biopsy, as measured using Adobe Photoshop (version CS5) software (Adobe Systems Inc.; San Jose, CA). Atrophic tubules were identified by their thickened, wrinkled basement membranes, dilated tubular lumina and hyaline casts in periodic acid–Schiff-stained biopsy tissues (Cohen 2006). The percentage of atrophic tubules was defined as the area of atrophic tubules divided by the total area of the renal biopsy, as described (Xu et al. 2013), using Adobe Photoshop.
TUNEL Assay
The TUNEL assay was performed using paraffin-embedded tissue sectioned to 4-μm and mounted onto Superfrost Plus slides. Briefly, tissue sections were deparaffinized, rehydrated and enzyme digested with proteinase K (10 μg/ml) for 15 min at room temperature. Labeling was performed in parallel and according to the manufacturer’s instructions with a 10-min color reaction (Vector Laboratories; Burlingame, CA). Sections were counterstained with hematoxylin for 20 sec. After each assay, sections were rinsed in water, dehydrated, and mounted with Permount (Fischer, Waltham, MA).
Immunohistochemistry
Paraffin-embedded kidney sections were deparaffinzed using xylene washes and rehydrated using graded 100%, 95%, 75%, 50% ethanol washes. Antigen retrieval was performed by boiling tissue sections for 5 min in 10 mM sodium citrate solution, pH 6.0. Endogenous peroxidase activity was blocked using 3% H2O2 for 10 min followed by 1 min PBS washes. The samples were blocked with 7.5% horse serum followed by blocking of endogenous biotin binding activity using a biotin/avidin blocking kit (Vector Laboratories) as per the manufacturer’s instructions. The tissue sections were incubated at 4C overnight with a polyclonal antibody to SMARCAL1 (1:200 dilution), obtained in collaboration with Cornelius Boerkoel (Deguchi et al. 2008). Positive and negative controls for SMARCAL1 were stained simultaneously to confirm SMARCAL1 staining specificity (Supplementary Fig. S1). SMARCAL1 (1:200 dilution), WT1 (Santa Cruz Biotechnology; Dallas, Texas; 1:200 dilution), ERG (Santa Cruz Biotechnology; 1:200 dilution), and P53 (Dako, 1:200 dilution) (Supplementary Fig. S1) were diluted in PBS with 0.3% Tween-20. Sections were washed with PBS and incubated in biotinylated secondary antibodies (Vector Laboratories) for 30 min at room temperature. ABC reagent (Vector Laboratories) was applied for 30 min. The color reaction was visualized using DAB (Vector Laboratories) and slides coverslipped using Permount. Kidneys were photographed on a Nikon 90i-eclipse upright microscope (Nikon, Tokyo, Japan).
Transmission Electron Microscopy
Kidneys were fixed in 2% glutaraldehyde for 24 hr, rinsed with 0.1 M sodium cocadylate, and fixed for 1 hr in 0.2% tannic acid followed by graded fixation in 1% osmium tetroxide and 1% osmium tetroxide/1.25% potassium ferrocyanide. After dehydration, samples were embedded in SPURR resin, sectioned, collected on copper grids, and stained for electron microscopy. Images were obtained using JEOL JEM 1200 EX TEMSCAN transmission electron microscope (JEOL; Peabody, MA). Images were acquired with an AMT 4 megapixel digital camera (Advanced Microscopy Techniques; Woburn, MA).
Glomerular Basement Membrane (GBM) Morphometry
GBM thickness was measured using the direct measurement approach, as described (McLay et al. 1992). Briefly, measurements were made from the overlying epithelial cell plasma membrane to the opposing endothelial cell plasma membrane using the JEOL JEM 1200 EX TEMSCAN transmission electron microscope at 30,000× magnification, and AMT Image Capture Engine software (version 600.236).
Statistical Analysis
Calculations and graph generation were performed using Microsoft Office Excel, 2007. Results are reported as the mean ± standard error of the mean (SEM).
Results
Characterization of the Renal Pathology in SIOD Patients
The Columbia classification categorizes FSGS into five subtypes. These include: the perihilar, cellular, tip, collapsing, and not otherwise specified (NOS) variants. In this study, we analyzed the renal biopsies from three different SIOD patients (Table 1) to determine the renal pathology and categorize the FSGS variants. We first examined the renal pathology in Patient 1 and determined that 14 out 33 (42%) glomeruli present in the renal biopsy displayed focal sclerotic lesions. Hematoxylin and Eosin (H&E) staining revealed glomeruli with podocyte hypertrophy and adhesions to parietal epithelial cells of the Bowman’s capsule, specifically at the origin of the proximal tubule (Fig. 1A). Next, we analyzed the presence of sclerosis in the glomeruli using periodic acid–Schiff (PAS), Masson’s trichrome (MASS), and Jones’ methenamine silver (JMS) staining (Fig. 1B, 1C, 1D respectively). These analyses revealed segmental sclerotic lesions in the proximal pole, opposite the hilum, and mild mesangial expansion with hyalinosis. Together, these findings demonstrate that the renal biopsy from Patient 1 displays characteristics of the tip variant of FSGS. We next characterized the tubular-interstitial changes in Patient 1 (Fig. 2A–2C) and demonstrated interstitial fibrosis in 3.42% ± 0.246% of the renal biopsy (Fig. 2B, 2J) and found that 1.06% ± 0.342% of the tubules were atrophic (Fig. 2K).
SIOD Patient Data and Clinical Course of Renal Pathology.
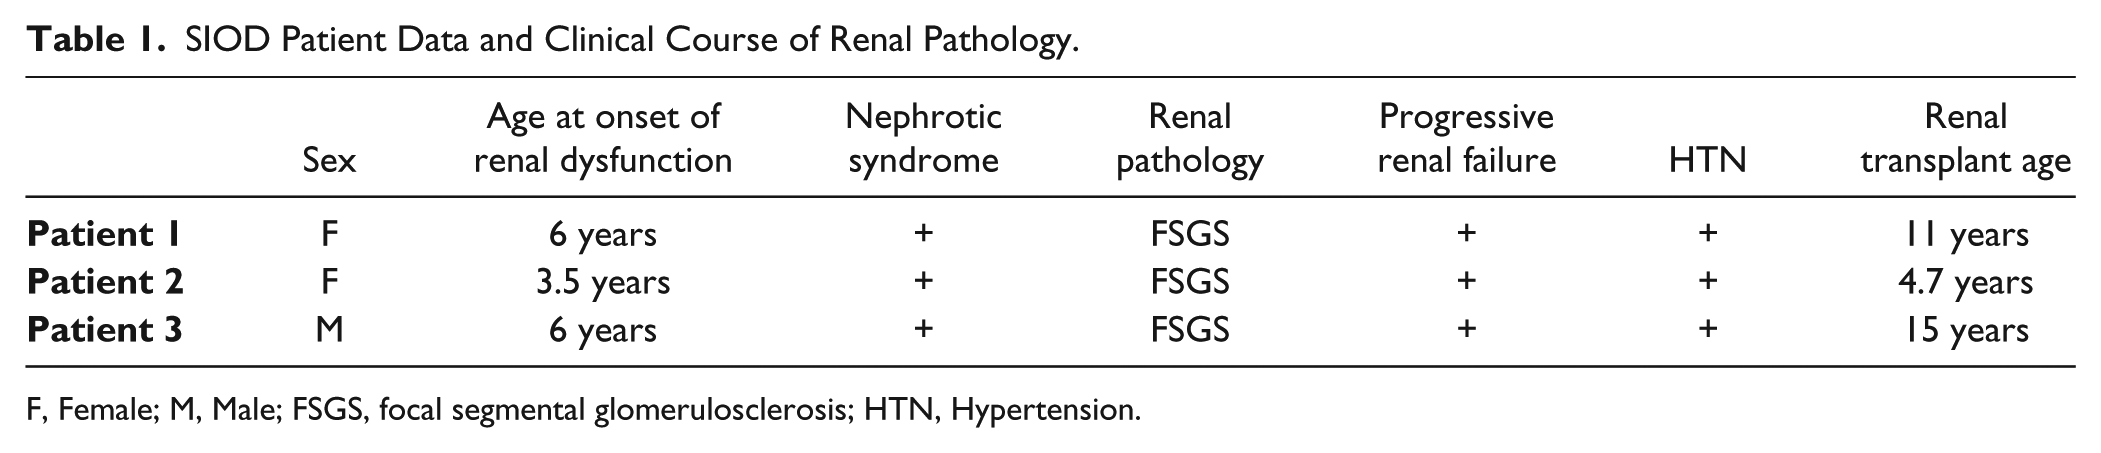
F, Female; M, Male; FSGS, focal segmental glomerulosclerosis; HTN, Hypertension.
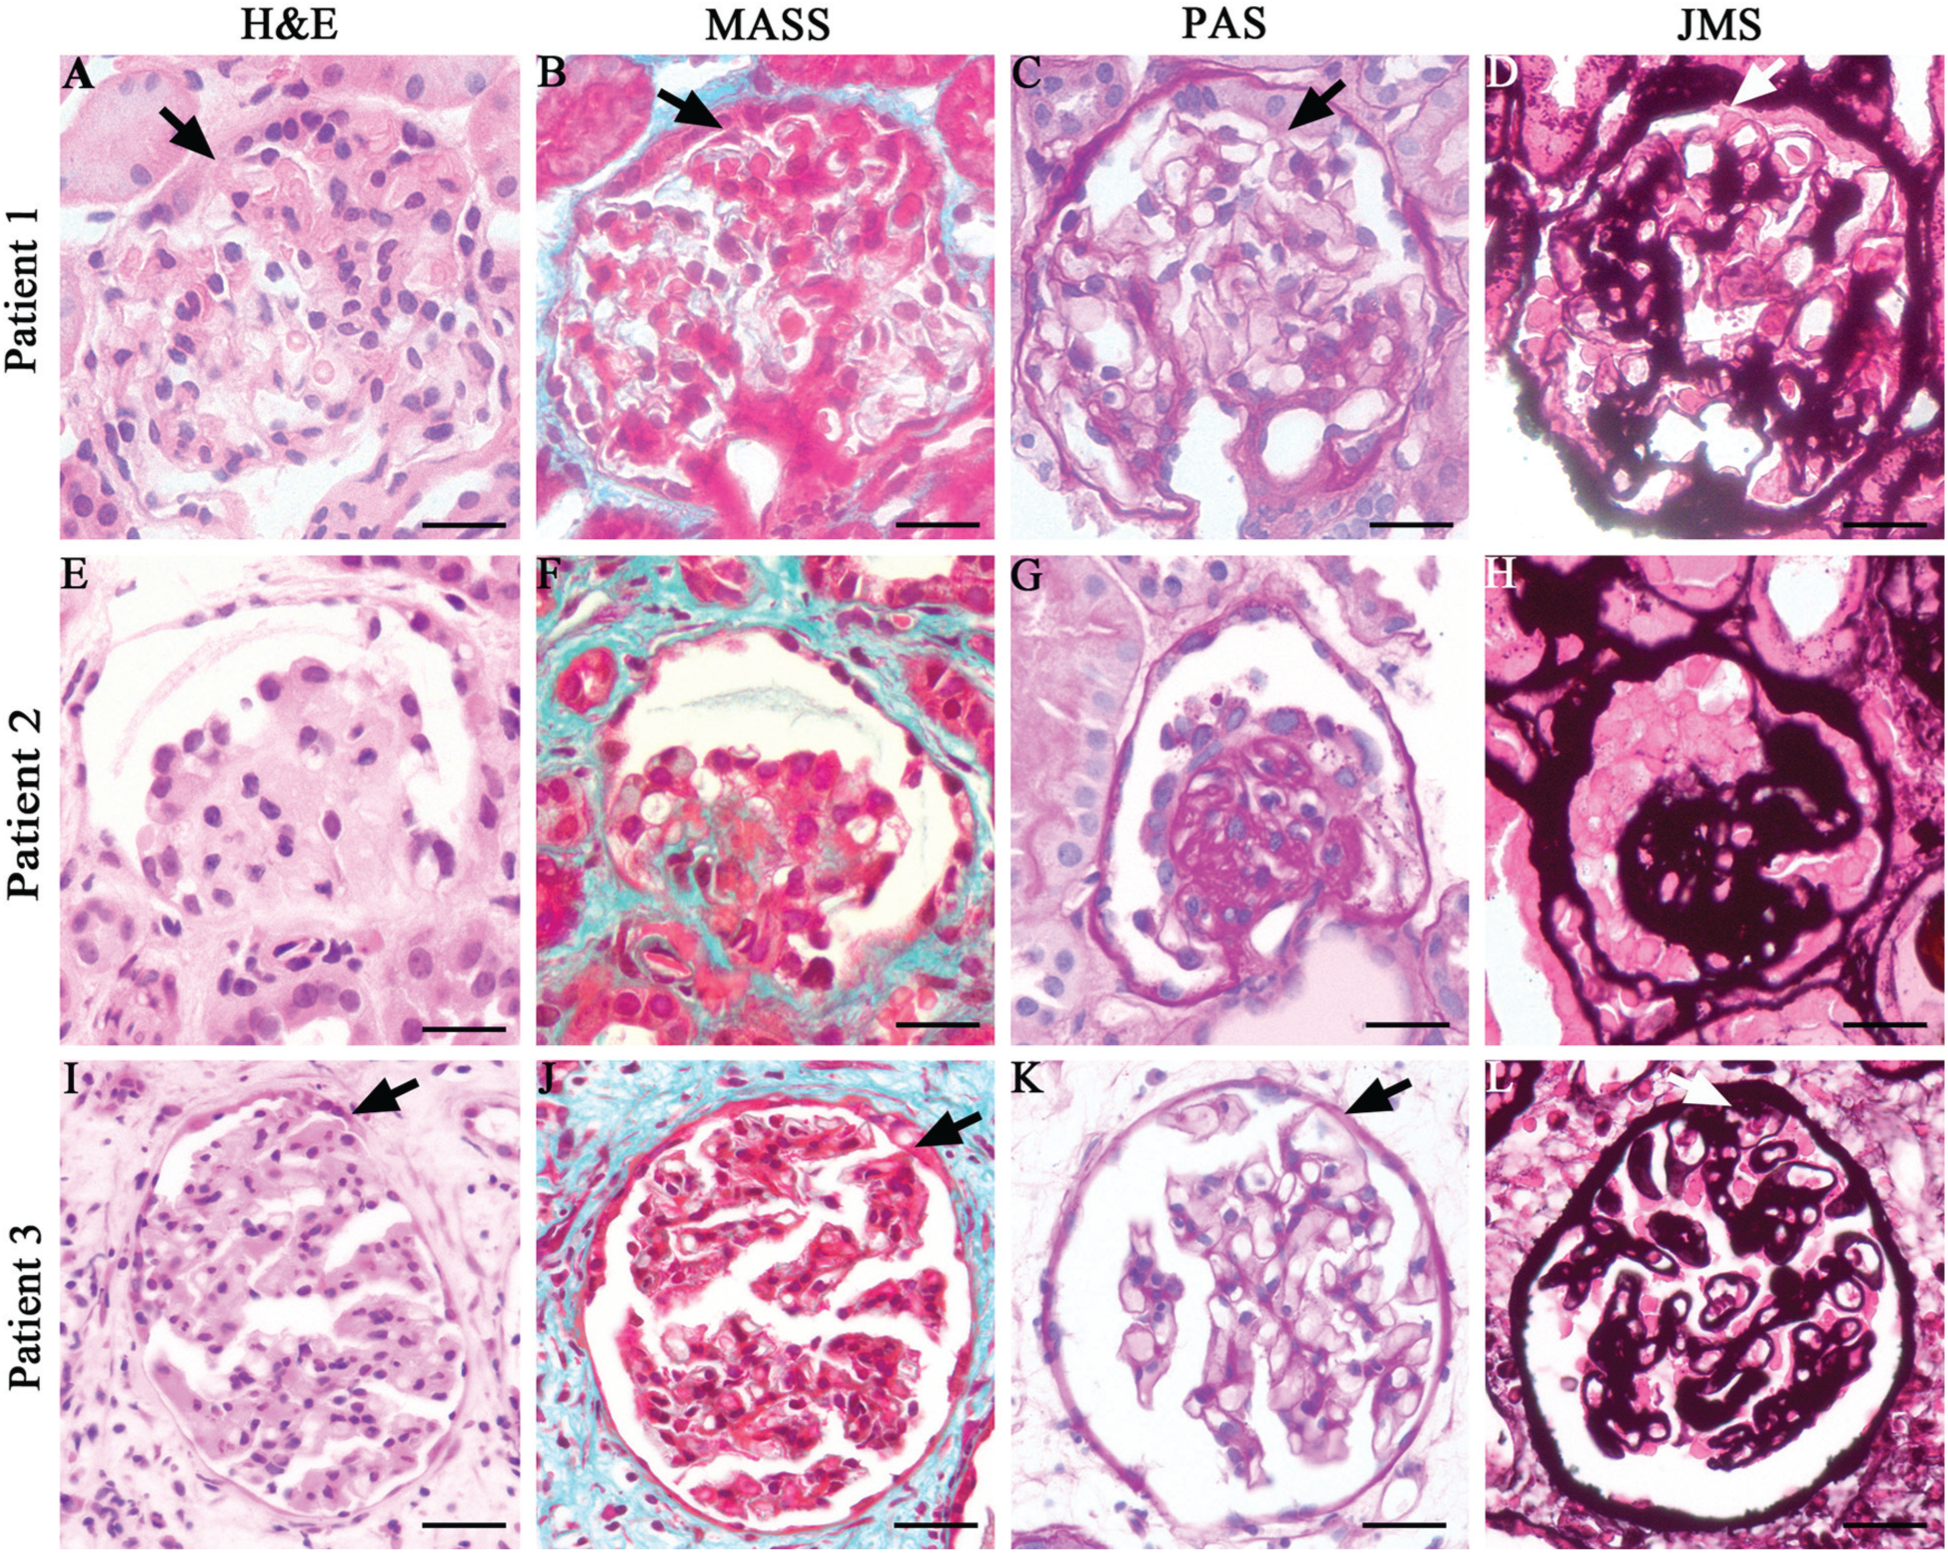
Histological characterization of the renal biopsies from SIOD patients. (A–D) Analysis of the renal biopsy from SIOD Patient 1. (A) Hematoxylin and eosin (H&E) stain, (B) Masson’s trichrome (MASS) stain, (C) Periodic acid–Schiff (PAS) stain, (D) Jones’ methenamine silver (JMS) stain. These analyses demonstrate the FSGS tip variant (arrow points to the tip region) in Patient 1. (E–H) Analysis of the renal biopsy from SIOD Patient 2. (E) H&E, (F) MASS, (G) PAS, and (H) JMS stains demonstrate the FSGS collapsing variant in Patient 2. (I–L) Analysis of the renal biopsy from SIOD Patient 3. (I) H&E, (J) MASS, (K) PAS, and (L) JMS stains reveal the FSGS tip variant in Patient 3 (arrow points to the tip lesion). Scale, 20 μm.
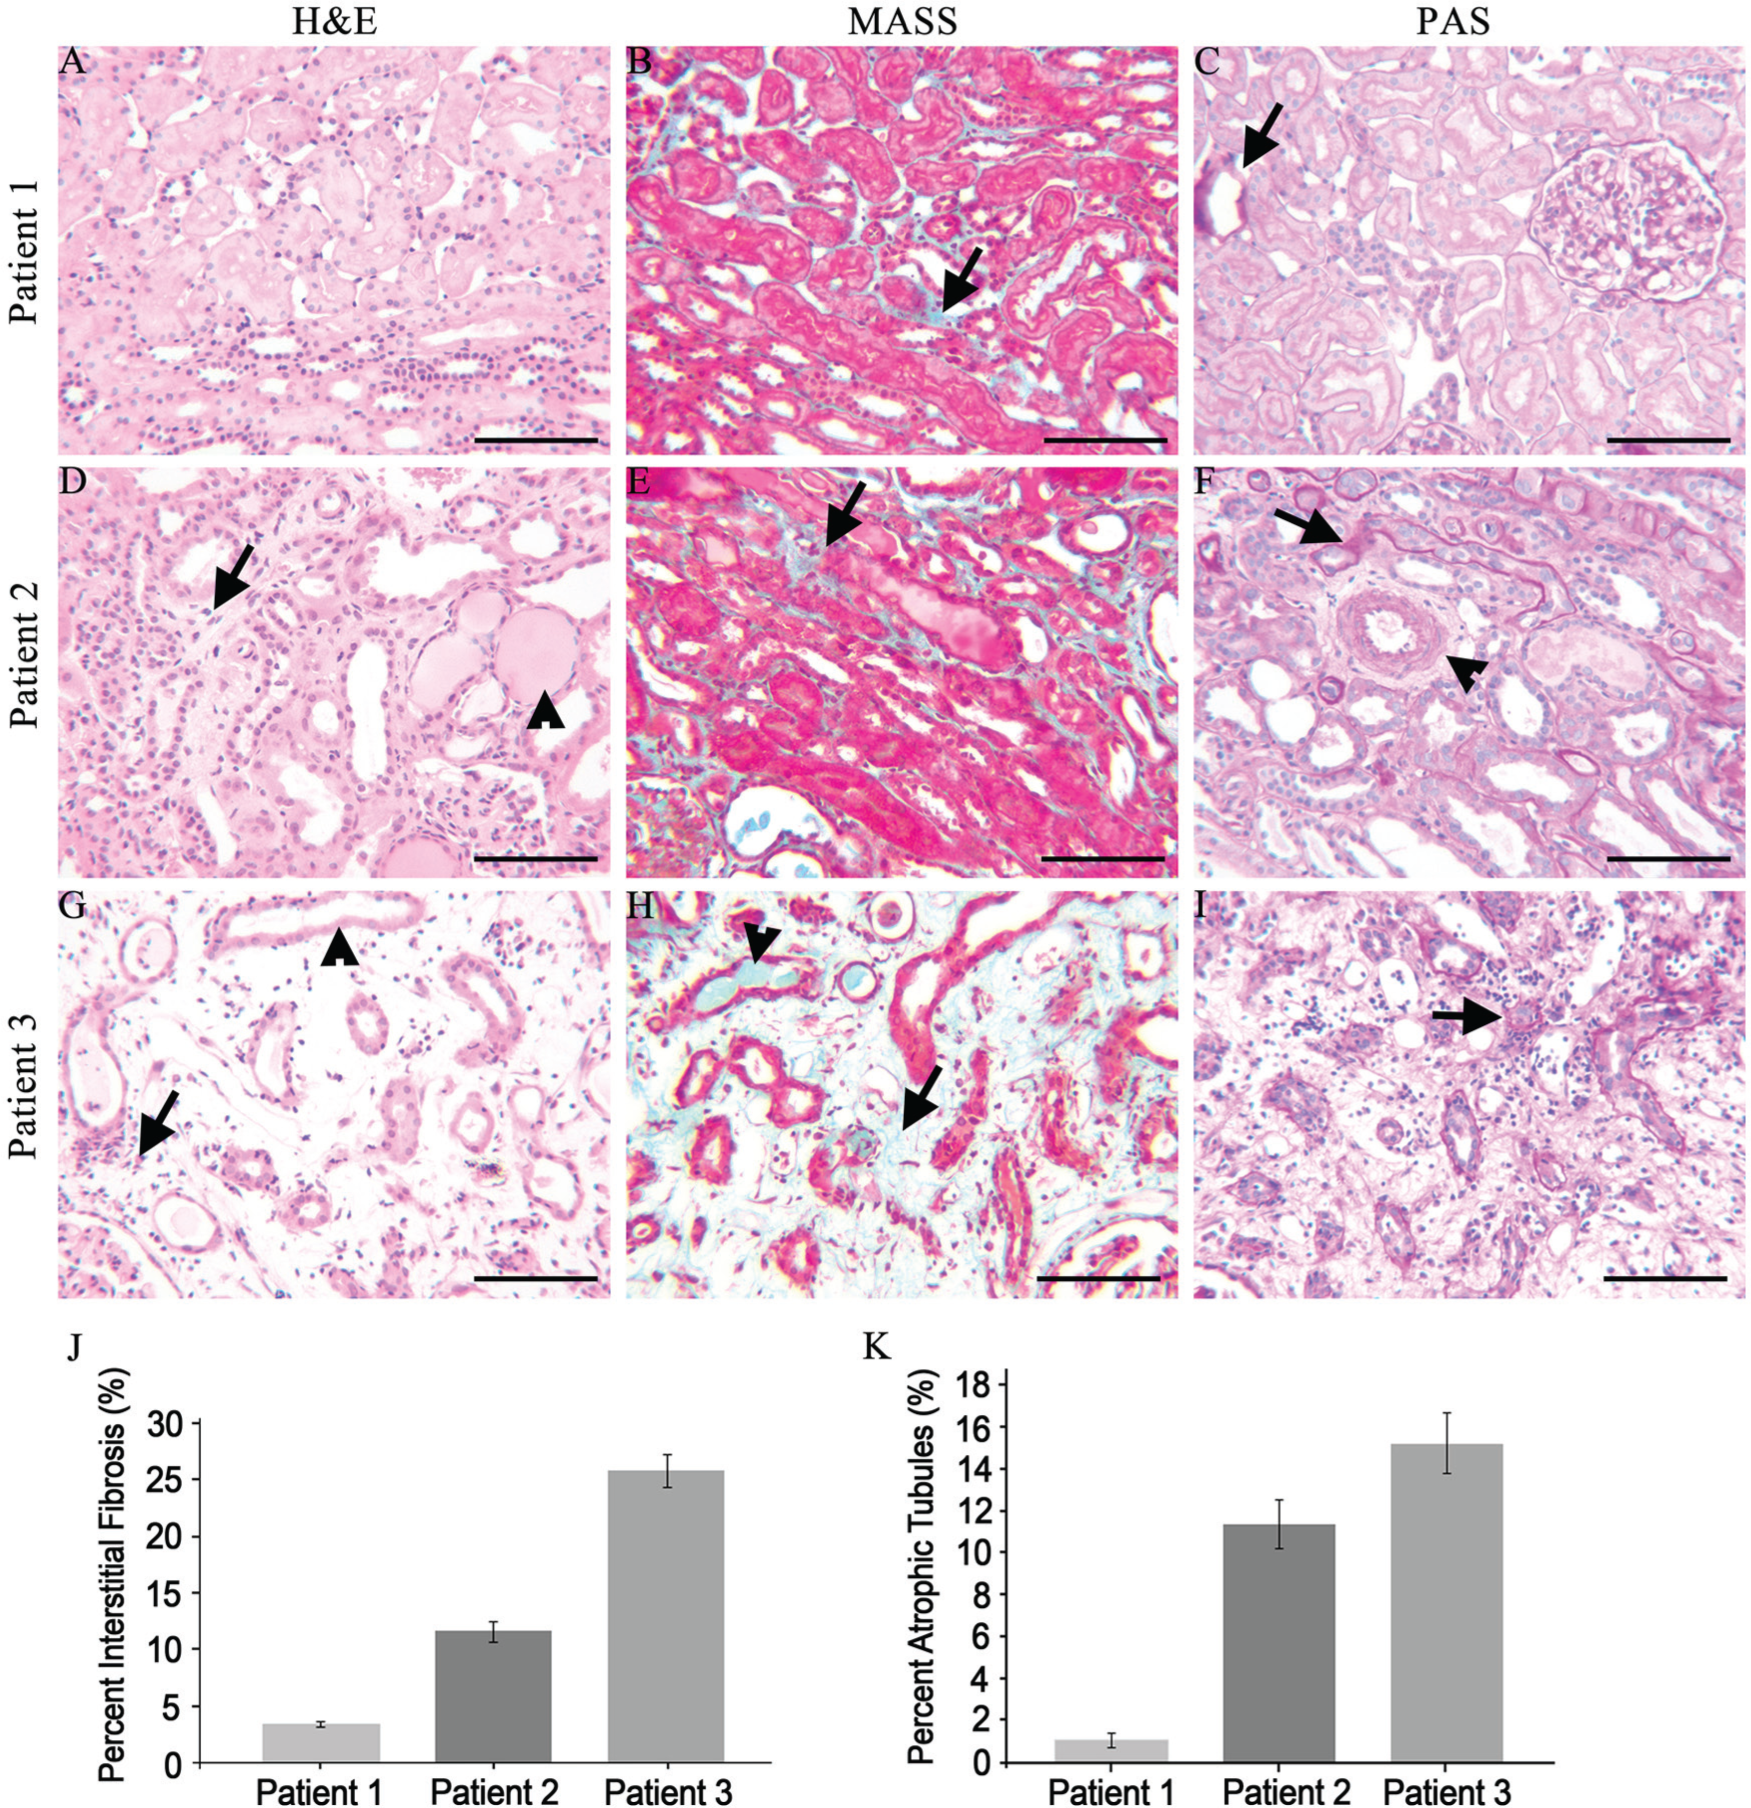
Characterization of the tubule-interstitial changes in SIOD patients. (A–C) Analysis of the renal biopsy from SIOD Patient 1. (A) Hematoxylin and eosin (H&E) stain reveals no overt tubule-interstitial changes in Patient 1. (B) Masson’s trichrome (MASS) stain demonstrates minimal interstitial fibrosis (arrow). (C) Periodic acid–Schiff (PAS) stain reveals minimal tubule basement membrane thickening (arrow). (D–F) Analysis of the renal biopsy from SIOD Patient 2. (D) Interstitial infiltrates (lymphocytes; arrow) and protein casts (arrowhead). (E) Moderate interstitial fibrosis (arrow). (F) Basement membrane thickening in tubules (arrow), arteriole thickening (arrowhead). (G–I) Analysis of the renal biopsy from SIOD Patient 3. (G) Interstitial infiltrates (lymphocytes; arrow) and tubular necrosis (arrowhead). (H) Tubular protein casts (arrowhead) and Interstitial fibrosis (arrow). (I) Tubular basement membrane thickening. (J) Morphometric analysis of the percentage of interstitial fibrosis in renal biopsies from SIOD patients. Patient 1 demonstrates 3.42% (± 0.246%) interstitial fibrosis, Patient 2 demonstrates 11.6 % (± 0.923%) interstitial fibrosis, and Patient 3 demonstrates 25.8% (± 1.43%) interstitial fibrosis. (K) Analysis of the percentage of atrophic tubules in renal biopsies from SIOD patients. Patient 1 demonstrates 1.06% (± 0.342%) atrophic tubules, Patient 2 demonstrates 11.4% (± 1.15%) atrophic tubules, Patient 3 demonstrates 15.3% (± 1.43%) atrophic tubules. Scale, 100 µm.
The renal biopsy from Patient 2 displayed severe segmental glomerulosclerosis involving 52 out of 52 (100%) glomeruli present in the renal biopsy. Close histological analysis using H&E, MASS, PAS and JMS stains of the glomeruli demonstrated both segmental and global glomerular capillary tuft collapse. In addition, podocytes were hyperplastic and hypertrophied with some podocytes detaching from the glomerular basement membrane (GBM) and localizing to the urinary space (Fig. 1E–1H ). Based on these observations, we conclude that the biopsy of Patient 2 is of the collapsing variant of FSGS. It is noteworthy that the biopsy of Patient 2 also presented glomeruli with the tip variant of FSGS (data not shown). However, this variant was not as dominant due to the precedence and severity of the collapsing variant. In addition, Patient 2’s biopsy demonstrated numerous tubular-interstitial changes. Pigmented and protein casts were observed in various tubules, indicative of the accumulation of serum proteins (Fig. 2D). Other tubular-interstitial and vascular changes included tubules with a thickened basement membrane and flattened epithelial cells, thickened arteriole walls, and inflammatory interstitial infiltrates (lymphocytes; Fig. 2D–2F). Interstitial fibrosis was observed in 11.6% ± 0.923% of the renal biopsy and 11.4% ± 1.15% of tubules were atrophic (Fig. 2J, 2K).
The renal biopsy from Patient 3 demonstrated focal segmental glomerulosclerosis affecting 3 out of 8 (37 %) glomeruli. Histological analysis of sclerotic glomeruli by high magnification revealed the tip variant of FSGS (Fig. 1I–1L) accompanied by mild mesangial prominence (Fig. 1I). In addition, severe interstitial edema and acute tubular necrosis was also observed (Fig. 2G). Examination of the dilated tubular lumina demonstrated infiltration of cellular debris and protein and pigmented casts (Fig. 2G, 2H). The absence of nuclei in the tubular epithelial cells indicates coagulation necrosis of these cells (Fig. 2G). Interstitial fibrosis was observed in 25.8% ± 1.43% of the renal biopsy, and 15.3% ± 1.43% of the tubules were atrophic (Fig. 2H–2K).
Together, our histological analyses confirm the presence of FSGS in our SIOD patients. We further extended upon these findings by demonstrating that patients with SIOD exhibited FSGS variants consistent with the tip and collapsing subtypes.
Ultra-structural Characterization of the Renal Pathology in SIOD Patients
To further define the renal pathology in SIOD patients, we performed an ultrastructural analysis of glomeruli from renal biopsies. The glomerulus comprises podocytes, endothelial, mesangial, and parietal epithelial cells (Fig. 3A) (Reidy and Kaskel 2007). Analysis of SIOD Patient 1 demonstrated adhesions of the podocyte to the parietal epithelial cells lining the Bowman’s capsule (Fig. 3B). Higher magnification revealed podocyte hypertrophy and stretching of the podocyte toward the parietal epithelial cells (Fig. 3C). In addition, we observed the presence of irregular thickening of the Bowman’s capsule (Fig. 3C), flattened and effaced podocyte foot processes (Fig. 3D, 3E), and red blood cells in the urinary space (Fig. 3D).
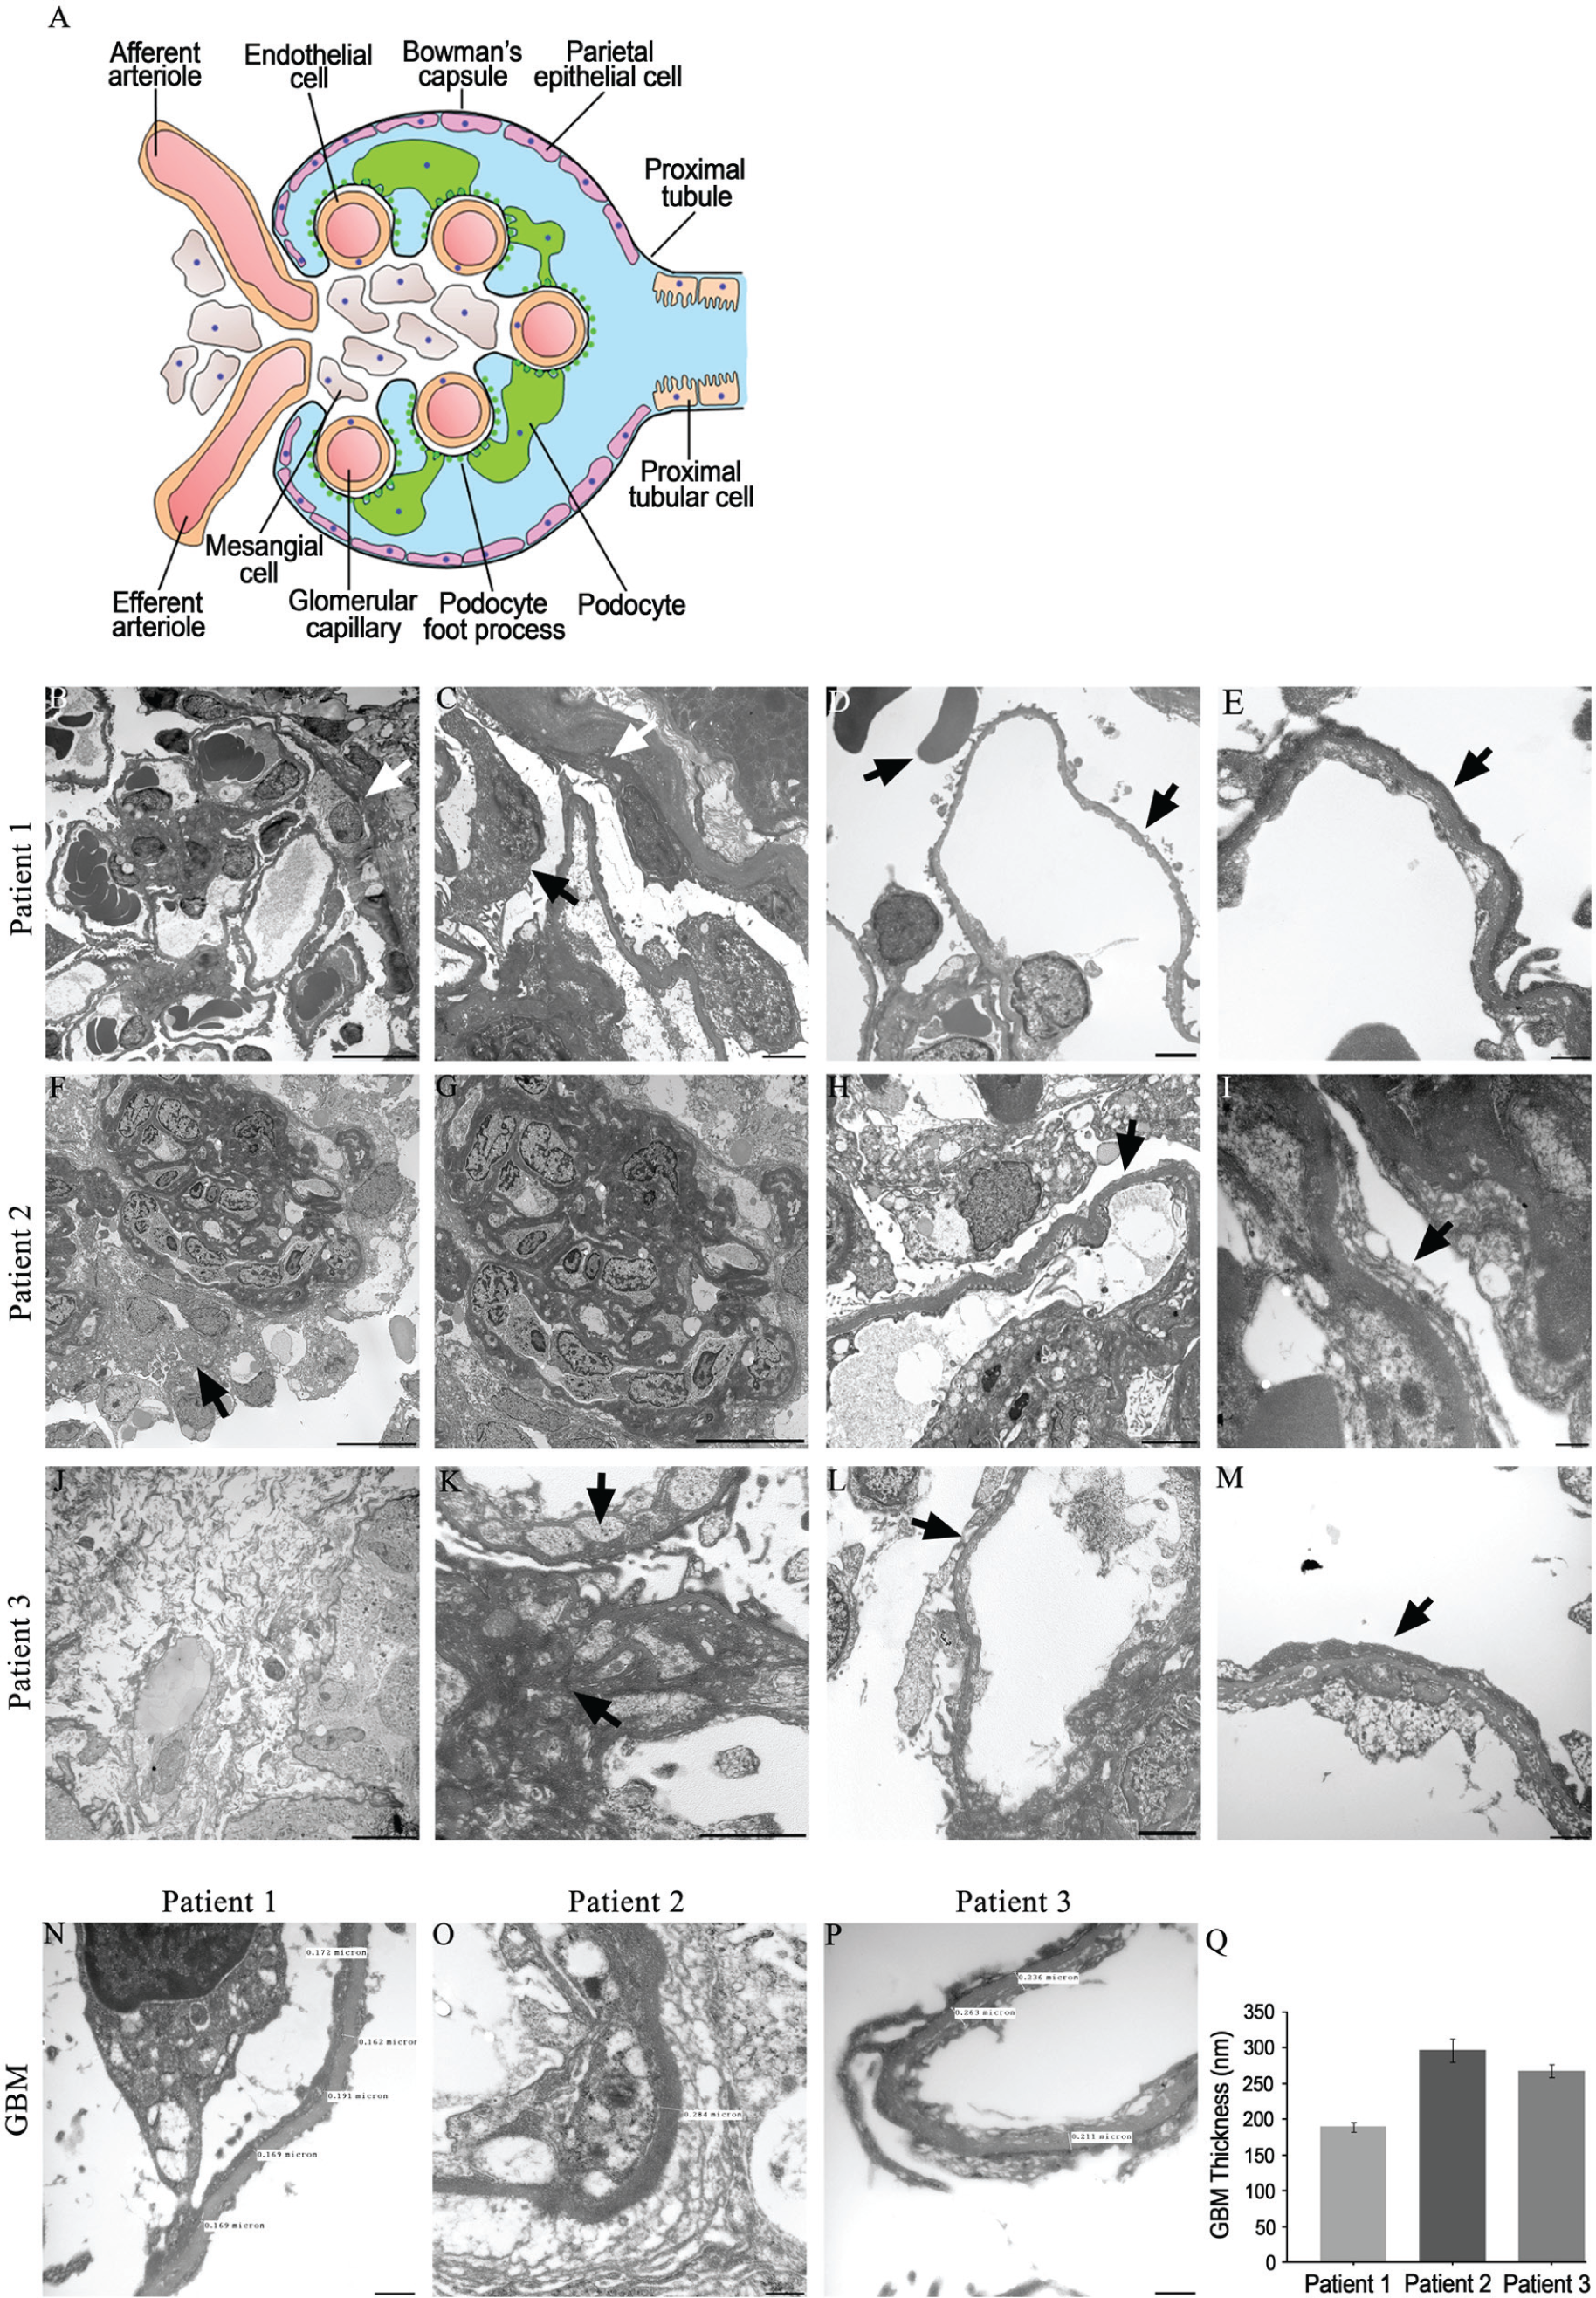
Ultra-structural analysis of the renal biopsies from SIOD patients. (A) Schematic model of the cells of the glomerulus. (B–E) Transmission electron microscopy of the renal biopsy from Patient 1. (B) Adhesions to the Bowman’s capsule (white arrow). (C) High magnification reveals podocyte hypertrophy (black arrow) and adhesions to the parietal epithelial with irregular thickening of the Bowman’s capsule (white arrow). (D) Red blood cells in the urinary space (left black arrow) and podocyte foot process effacement (right black arrow). (E) Magnification at 30,000× reveals fused and flattened podocyte foot processes, which are effaced (black arrow). (F–I) Transmission electron microscopy of the renal biopsy from Patient 2. (F) Podocyte hypertrophy and hyperplasia (black arrow). (G) Glomerular capillary collapse with increased mesangial matrix. (H) Podocyte foot process effacement (black arrow). (I) Magnification at 30,000× reveals fused and flattened podocyte foot processes and clear foot process effacement (black arrow). (J–M) Transmission electron microscopy of the renal biopsy from Patient 3. (J) Interstitial edema. (K) Increased mesangial matrix (black arrows). (L) Podocyte foot process effacement (black arrow). (M) Magnification at 30,000× reveals fused and flattened podocyte foot processes with marked effacement (black arrow). (N–P) Measurements of glomerular basement membrane (GBM) thickness at 30,000× magnification in SIOD Patients 1, 2 and 3. (Q) Mean GBM thicknesses of 189 ± 7.70 nm for Patient 1, 296 ±16.6 nm for Patient 2 and, 267 ± 9.47 nm for Patient 3. Data are expressed as the mean ± SEM. Scale (B, D, J) 10 µm; (C, F, G, H, K, L) 2 µm; (E, I, M) 500 nm.
Patient 2 exhibited numerous glomerular abnormalities, including podocyte hypertrophy and hyperplasia (Fig. 3F). We also observed collapsing and wrinkling of the capillary basement membrane in conjunction with an increase in mesangial matrix deposition (Fig. 3G). In addition, podocyte foot processes were flattened and effaced (Fig. 3H, 3I).
An ultra-structural analysis of the renal biopsy from Patient 3 showed that the tissue exhibited interstitial edema (Fig. 3J) and revealed an irregular increase in mesangial matrix (Fig. 3K). Patient 3 also exhibited podocyte foot processes that were flattened and effaced (Fig. 3L, 3M).
We next analyzed the GBM thicknesses in all three patients using high-magnification electron microscopy. In children with healthy kidneys, the GBM normally measures 150 nm at birth and continually thickens to 200 nm by 1 year (Vogler et al. 1987). The GBM gradually increases in width and subsequently approaches an adult thickness by age 11 years (Vogler et al. 1987). Female adults demonstrate an average GBM thickness of 320 ± 50 nm, whereas male adults demonstrate a thicker GBM of 370 ± 50 nm (Vogler et al. 1987). Patient 1, a 6-year-old female (Table 1), demonstrated an average GBM width of 189 nm ± 7.70 nm (Fig. 3N, 3Q). The GBM in Patient 2, a 3.5-year-old female (Table 1), measured 296 nm ± 16.6 nm (Fig. 3O, 3Q), whereas Patient 3, a 6-year-old male, demonstrated an average GBM thickness of 267 nm (± 9.47 nm) (Fig. 3P, 3Q).
SMARCAL1 Expression in Mature and Developing Human Kidneys
Defining the normal expression of SMARCAL1 is an essential first step in determining the cells that contribute to the pathogenesis of FSGS in SIOD patients. Furthermore, previous reports have demonstrated conflicting patterns of SMARCAL1 expression in both developing and mature kidneys (Dekel et al. 2008; Elizondo et al. 2009). Therefore, we first analyzed SMARCAL1 expression in mature human kidneys. Our results demonstrate SMARCAL1 is broadly expressed throughout the cortex and medulla in the postnatal mature kidney, as evidenced by the majority of nuclei having positive immunoreactivity with the SMARCAL1 antibody (brown nuclei) (Fig. 4B, 4C). However, not all cells express SMARCAL1, as hematoxylin-stained blue nuclei are observed (Fig. 4B, 4C). We next analyzed SMARCAL1 expression at a higher magnification and observed expression in the majority of nuclei in epithelial tubules around the glomerulus (Fig. 4D). In addition, the expression was also observed in the squamous parietal cells lining the Bowman’s capsule and some positive immunoreactivity was observed in the glomerulus in a pattern consistent with the podocyte (Fig. 4D).
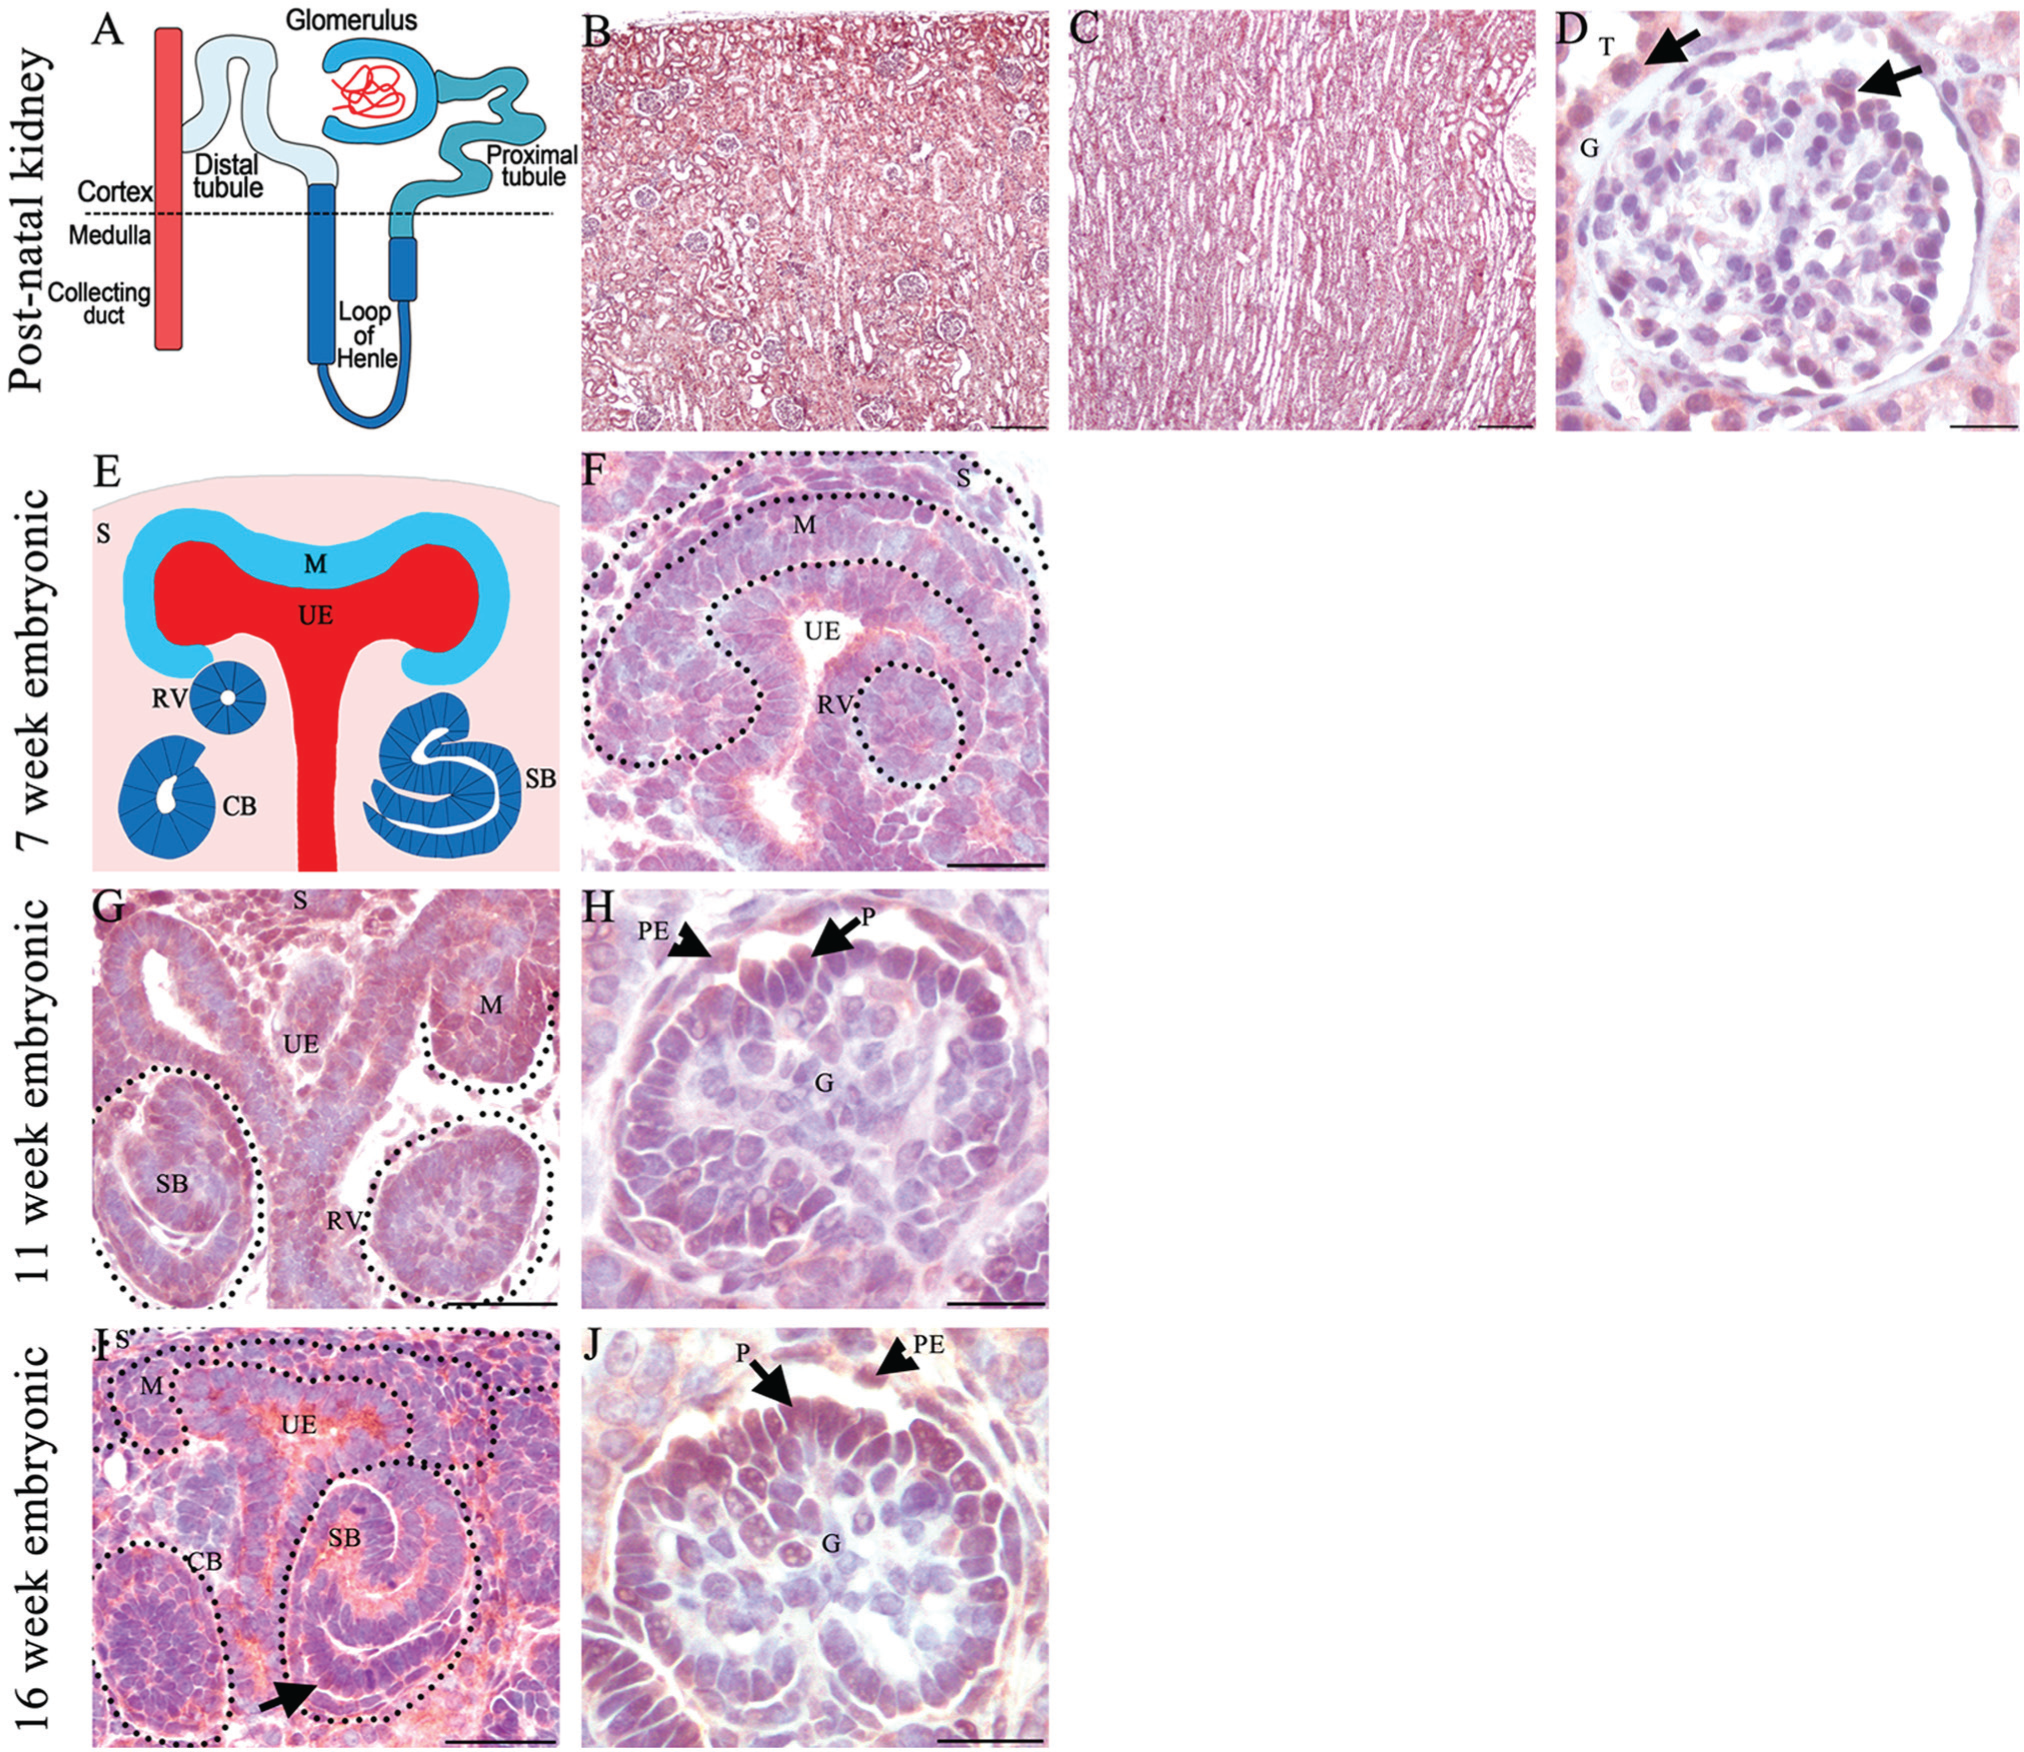
SMARCAL1 protein expression in developing and mature human kidney. (A) Schematic model of nephron segments. (B–D) SMARCAL1 expression in the postnatal adult kidney. (B, C) Low-power image demonstrates SMARCAL1 expression in the kidney cortex and medulla showing expression in most but not all kidney cells. (D) High magnification of a representative glomerulus demonstrating SMARCAL1 expression in tubules adjacent to the glomerulus, parietal epithelial cells (top black arrow), and cells in the glomerular tuft in a pattern consistent with the podocyte (bottom black arrow). (E) Schematic representation of a developing kidney showing mesenchyme (blue), ureteric epithelium (red), stroma (pink), and morphological stages of developing nephrons (navy blue). (F) SMARCAL1 is expressed in the stroma and ureteric epithelium. Low levels of expression are also observed in the mesenchyme and renal vesicle in a developing 7-week fetal kidney. (G, H) SMARCAL1 expression in a developing 11-week fetal kidney. (G) SMARCAL1 is observed in the nephrogenic zone, specifically in the mesenchyme, stroma, collecting duct, renal vesicle and S-shaped body. (H) SMARCAL1 is expressed in the parietal epithelial cells and in some but not all cells of the glomerular tuft in a pattern consistent with the podocyte (black arrow). (I, J) SMARCAL1 expression in 16-week developing kidney. (I) SMARCAL1 is expressed in the developing podocyte cell layer in the S-shape body (black arrow). (J) SMARCAL1 is observed in the glomerulus in a pattern consistent with the podocyte (black arrow). CB-comma shaped body, CD-collecting duct, G-glomerulus, M-mesenchyme, PE-parietal epithelial cell, P-podocyte, RV-renal vesicle S-stroma, SB-S-shaped body, T-tubules, UE- ureteric epithelium. Scale (B, C), 200 µm; (D, F, G, H, I, J), 20 µm.
The severe infantile form of SIOD occurs in utero, a time point when the kidney is undergoing development. Therefore, we also analyzed the expression of SMARCAL1 in the developing human kidney at three different developmental stages. There are three main cell types required for kidney development: mesenchyme, ureteric epithelium, and renal stroma (Fig. 4E) (Dressler 2006). SMARCAL1 expression at 7 weeks gestation—a time point just after the initiation of kidney development—demonstrates expression primarily in the renal stroma, the ureteric epithelium, and the mesenchyme (Fig. 4F). SMARCAL1 expression was observed in most, but not all of these cells. The mesenchyme will undergo a mesenchyme-to-epithelial transition to form the renal vesicle which will undergo morphological changes to form the nephron, the functional unit of the kidney (Dressler 2006). We observed low levels of SMARCAL1 expression in the renal vesicle and developing S-shaped nephrons (Fig. 4F). The analysis of SMARCAL1 expression at 11 weeks gestation demonstrated expression in the mesenchyme population and was maintained in the stroma, ureteric epithelium, and developing S-shaped bodies (Fig. 4G). Numerous mature glomeruli were observed at 11 weeks gestation and SMARCAL1 expression localized to the parietal epithelial cells and cells in the glomerular tuft in a pattern consistent with the podocyte (Fig. 4H). Similarly, the pattern of SMARCAL1 expression at 16 weeks gestation was observed in the stroma, mesenchyme, ureteric epithelium, and selective cells of the glomeruli (Fig. 4I, 4J). Robust levels of SMARCAL1 expression were observed in the developing nephrons, notably in the developing podocyte cell layer in the S-shaped body (Fig. 4I). Combined, our results demonstrate SMARCAL1 expression in all the three cell types required for kidney development and, notably, in some but not all cells of the glomerulus.
SMARCAL1 Expression in Mouse is Identical to Human
Central to the pathogenesis of FSGS is podocyte damage, which leads to foot process effacement and disruption of the filtration barrier (Lou et al. 2002; Sethi et al. 2014). Because FSGS is a hallmark of SIOD, we suspected SMARCAL1 plays essential roles in the podocyte. However, we were not able to determine which cells of the glomerulus express SMARCAL1 due to an inability to perform co-immunofluorescence and co-immunohistochemistry, and the limited availability of human embryonic and mature kidney tissue. Therefore, we defined the expression of SMARCAL1 in mouse tissue (herein expressed as Smarcal1) to determine if this was a suitable model to define the SMARCAL1-expressing cells of the glomerulus. Immunohistochemistry of Smarcal1 expression in the mouse was identical to that observed in the human tissue, establishing that the murine model is ideal for co-localization studies (Fig. 5A, 5C). Despite numerous attempts, however, we were still unable to perform co-immunofluorescence or co-immunohistochemistry using the Smarcal1 antibody. Therefore, we performed immunohistochemistry on 4-μm serial sections from 30-day-old mice using antibodies for Smarcal1, Wilm’s Tumor 1 (Wt1), a nuclear podocyte marker, and Ets related gene (Erg), a nuclear marker of endothelial cells. As expected, we observed Smarcal1 expression in some but not all of the cells of the glomerulus (Fig. 5A, 5C). Wt1 localized to the podocyte nucleus primarily located at the periphery of the glomerulus (Fig. 5B). Smarcal1 localized to several of the Wt1-positive nuclei (Fig. 5; compare 5A and 5B); however, not all of the nuclei overlapped, suggesting the same nuclei were not present in the serial sections or that other cells of the glomerulus also express Smarcal1. We next analyzed Erg expression and demonstrated that Smarcal1 was also expressed in the Erg1-positive nuclei (Fig. 5; compare 5C and 5D). These studies demonstrate that Smarcal1 is expressed in the glomerular endothelial cells and podocytes, and may have important roles in their development and/or maintenance.
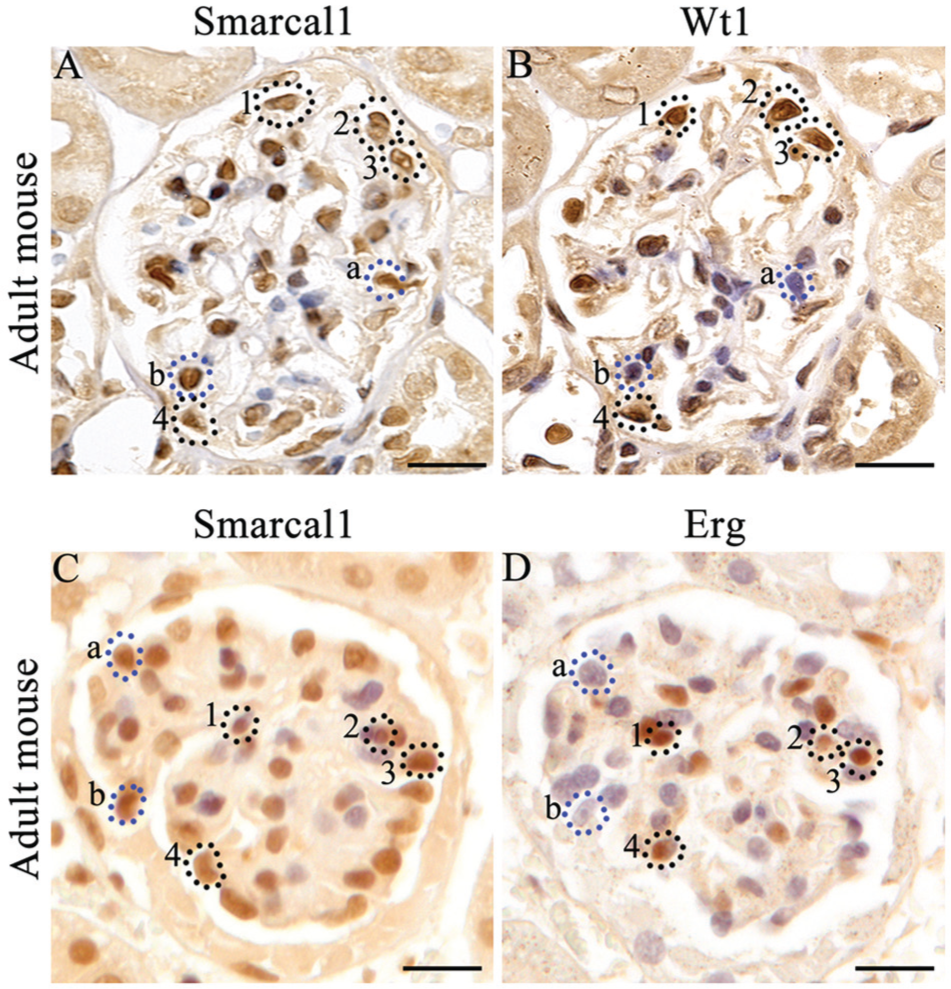
Localization of Smarcal1 with glomerular markers in adult mouse kidney. (A, B) Serial sections of an adult mouse kidney incubated with Smarcal1 or Wilm’s Tumor 1 (Wt1; a nuclear marker of podocytes) and counterstained with hematoxylin. (A) Smarcal1 is detected in a number of cells within the glomerulus in a pattern identical to that seen in human tissue. (B) Wt1 is expressed in selective cells of the glomerulus. Some Wt1-positive cells are also Smarcal1-positive (circled nuclei #1–4). Not all Smarcal1 nuclei correspond to Wt1-positive cells (dotted lines a, b). (C, D) Serial sections of an adult mouse kidney incubated with Smarcal1 or Erg (a nuclear marker of endothelial cells) and counterstained with hematoxylin. (C) Smarcal1 is detected in a number of cells within the glomerulus (D) Erg is expressed in selective cells of the glomerulus. Some Erg-positive cells are also Smarcal1-positive (circled nuclei #1–4). Not all Smarcal1 nuclei correspond to Erg-positive cells (dotted lines a, b). Scale, 20 µm.
Increased DNA Fragmentation in SIOD Patients
Based on the SMARCAL1 expression in the podocyte, we suspected that podocyte injury or loss may be involved in the pathogenesis of FSGS in SIOD patients. Therefore, we performed a terminal deoxynucleotidyl transferase dUTP nick end labeling (TUNEL) assay, which measures DNA fragmentation, a common feature in apoptosis (Gavrieli et al. 1992). Our analysis of normal human glomeruli and that from patients with non-SIOD-related FSGS demonstrated no or very few TUNEL-positive cells, respectively, as shown by the absence of brown-stained nuclei (Fig. 6A, 6B). In contrast, renal biopsies taken from SIOD Patient 1 and -2 demonstrated numerous TUNEL-positive (brown) nuclei. The TUNEL-positive cells were localized to the parietal epithelial layer, the cells within the glomerular tuft, and the tubules surrounding the glomerulus (Fig. 6C, D). However, in Patient 3, the TUNEL-positive cells were not as prominent and were primarily localized to the parietal epithelial layer (Fig. 6E). Interestingly, very few TUNEL-positive cells demonstrated the cellular morphology characteristic of apoptotic cells, including pyknotic condensed nuclei, nuclear fragmentation, and cells lying slightly above the plane of focus (Saraste and Pulkki 2000). The TUNEL assay measures DNA fragmentation by labeling exposed 3’ DNA ends (Gavrieli et al. 1992). The abundance of TUNEL-positive cells in our SIOD patient samples indicates the presence of a large number of exposed 3’ DNA ends and marked DNA fragmentation that is independent of apoptosis.
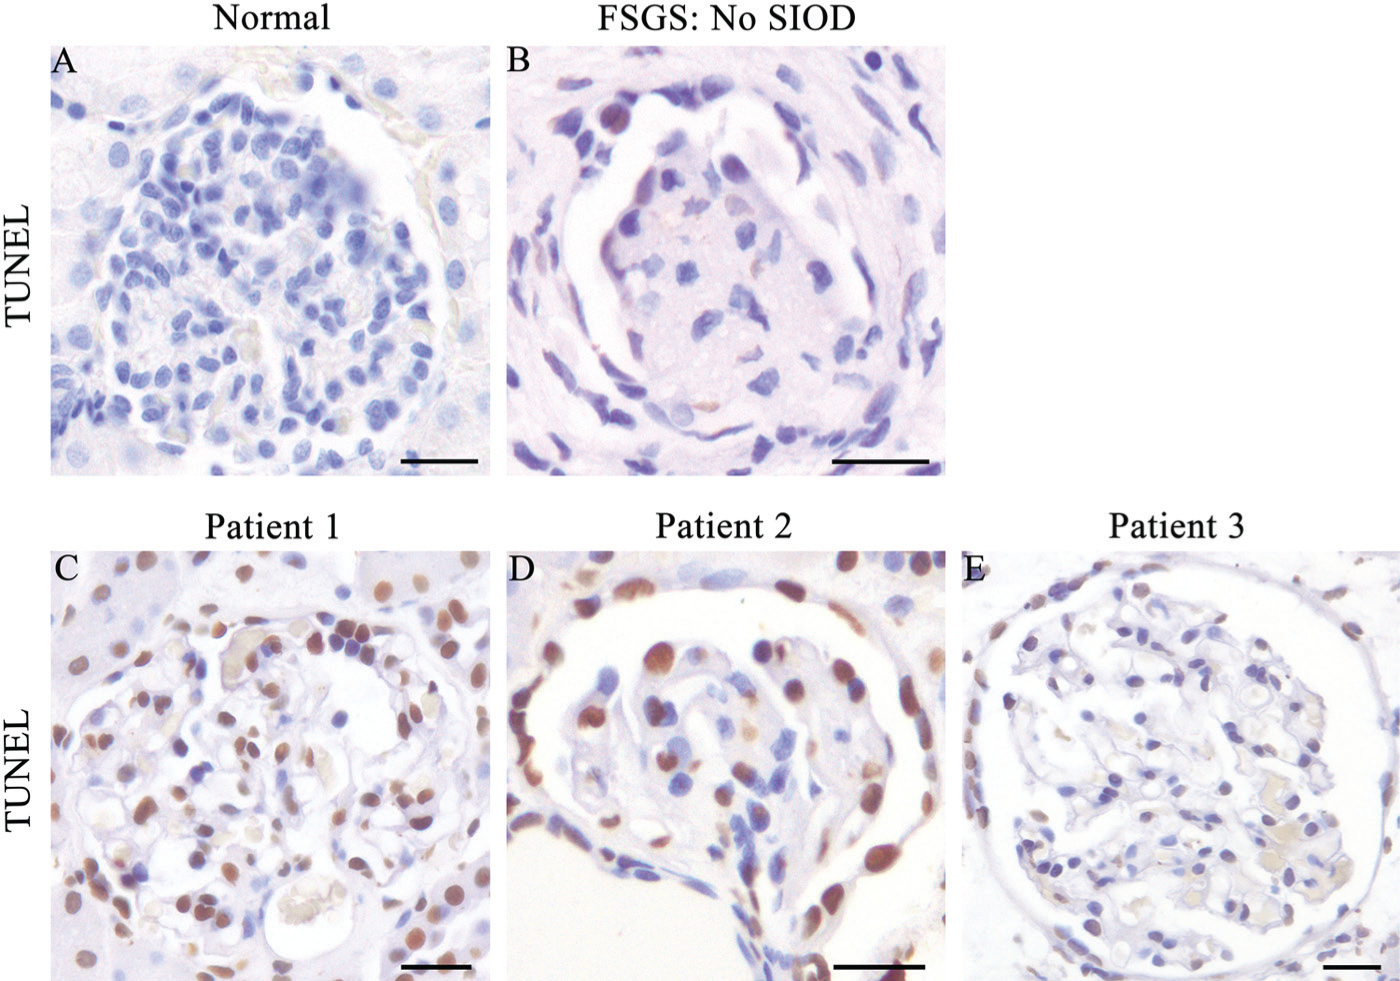
Kidneys from SIOD patients exhibit increased DNA fragmentation. (A) TUNEL assay on normal human adult kidney demonstrating no DNA fragmentation as measured by the absence of TUNEL-positive brown nuclei. (B) Kidney biopsy from a postnatal non-SIOD patient with FSGS demonstrating few TUNEL-positive cells with a mild degree of DNA fragmentation. (C, D) SIOD Patients 1 and -2 exhibit high levels of DNA fragmentation in the majority of cells. (E) SIOD Patient 3 demonstrates low levels of DNA fragmentation in the majority of cells. Scale, 20 μm.
Discussion
SIOD is a pleiotropic disorder with a broad range of clinical manifestations caused by mutations in the SMARCAL1 gene (Boerkoel et al. 2000). Patients with SIOD exhibit varying degrees of severity; however, ESRD is a common complication often leading to renal failure and death (Ehrich et al. 1995; Boerkoel et al. 2000; Boerkoel et al. 2002; Lou et al. 2002; Elizondo et al. 2009). The nephropathology in SIOD patients is typically characterized as FSGS (Ehrich et al. 1990; Spranger et al. 1991; Ehrich et al. 1995; Ehrich and Filler 1996). Here, we analyzed renal biopsies using histological staining and electron microscopy from three SIOD patients and classified their FSGS into one of the five variant categories. Further, we demonstrated SMARCAL1 spatial and temporal expression in developing and mature human and mouse kidneys. Finally, we observed marked increased DNA fragmentation in SIOD renal biopsies. These studies further define the type of FSGS in SIOD patients and further our understanding of the cells and mechanisms that may contribute to the pathogenesis of FSGS in SIOD patients.
We categorized the SIOD glomerular pathology using the Columbia classification system, which divides FSGS into pathologically and clinically meaningful subgroups (D’Agati 2003).The renal biopsies from two SIOD patients in our study were of the tip variant, whereas the third patient exhibited both collapsing and tip variants. The tip variant of FSGS is characterized by adhesions of the glomerular tuft and/or the podocyte to the Bowman’s capsule, particularly at the proximal pole (D’Agati 2003; D’Agati 2008). The tip variant responds favorably to treatment (Zivicnjak et al. 2009; Korbet 2012), and thus SIOD patients with a milder form are more likely to exhibit the tip variant because they respond to renal treatment. The collapsing variant is characterized by global glomerular capillary tuft collapse with podocyte hypertrophy and hyperplasia (D’Agati 2003). The collapsing variant is typically resistant to treatment (Korbet 2012) and has a rapid course to ESRD (Nair 2006; D’Agati 2008). SIOD patients with the severe infantile form respond poorly to renal treatments and have high mortality rates in the first five years of life, primarily due to renal failure (Ehrich et al. 1995; Elizondo et al. 2009; Zivicnjak et al. 2009). This suggests that patients with the severe infantile form likely are of the collapsing variant. The heterogeneous FSGS lesions we observed may reflect the progression of tip lesions into the more severe collapsing variant (Pollak 2002). Conversely, different mutations in SMARCAL1 may also lead to the different FSGS variants and thus unique clinical outcomes. Together, the various manifestations of these different FSGS morphological variants in our three SIOD patients likely result from different mechanisms and cellular contributions (Choi 2013).
Previous studies have demonstrated conflicting patterns of SMARCAL1 expression in the kidney (Dekel et al. 2008; Elizondo et al. 2009). Furthermore, it is possible that different cells in the kidney may contribute to the FSGS phenotype in SIOD patients. Despite this, the SMARCAL1 expression pattern remains poorly understood. Therefore, we performed an expression analysis of SMARCAL1 in human developing and mature kidneys to better understand the cellular involvement in SIOD-related FSGS. A previous report by Dekel et al. (2008) demonstrated SMARCAL1 expression in the mesenchyme and early tubules in 19-week human fetal kidneys. We confirmed and extended upon their findings by analyzing SMARCAL1 expression at three distinct kidney developmental stages. Similar to Dekel and colleagues, we observed SMARCAL1 in the mesenchyme. However, we also demonstrated its expression in the ureteric epithelium, the renal stroma and throughout the different morphological stages of nephron development. In contrast to their findings, we observed SMARCAL1 expression in the developing and maturing glomerulus during the fetal period. The specific spatial and temporal expression pattern of SMARCAL1 suggests an important, functional role for the helicase during kidney development. It is possible that the absence or disruption of SMARCAL1 function in our SIOD patients caused abnormalities in kidney development that manifested during the perinatal or adolescent period.
We also analyzed SMARCAL1 expression in the mature human kidney. Dekel et al. (2008) localized SMARCAL1 to the distal tubular cells, collecting ducts, and cells of the glomerulus. Consistently, we showed that SMARCAL1 is expressed in the glomerulus, tubules of the nephron, and collecting ducts in the postnatal adult kidney. Furthermore, we sought to examine the specific cell types of the glomerulus that express SMARCAL1. Although we were unable to perform co-immunofluorescence on human or mouse kidney tissue, we were able to perform IHC on serial kidney sections and demonstrated its expression in the podocyte and endothelial cells. These results demonstrate a role for SMARCAL1 in the maintenance and integrity of podocytes and endothelial cells. Interestingly, some but not all of the endothelial and podocyte cells expressed SMARCAL1. This is consistent with previous reports in which other cells of the kidney also display selective SMARCAL1 expression (Dekel et al. 2008). This selectivity in the expression of SMARCAL1 within specific kidney cell lineages may reflect its role in regulating subsets of genes via chromatin remodeling or its role in DNA repair where it is recruited to sites of DNA damage (Boerkoel et al. 2002; Elizondo et al. 2009).
Central to the pathogenesis of FSGS is damage or a loss of the podocyte cell layer (Kriz 2003). While performing an analysis for apoptosis, we observed numerous TUNEL-positive cells. However, these cells did not exhibit the morphological cellular characteristics consistent with apoptosis. The TUNEL assay measures DNA fragmentation by labeling exposed 3’ DNA ends (Gavrieli et al. 1992). Therefore, we propose that the numerous TUNEL-positive cells result from increased DNA damage stemming from DNA breaks. Consistent with this theory, SMARCAL1 is necessary to prevent DNA damage accumulation during DNA replication and repair, with one report showing that fibroblast cells from SIOD patients exhibiting increased levels of DNA damage (Bansbach et al. 2010). DNA damage leads to genomic instability and disruptions in the proper biological functions of the cell (Yang et al. 2013). Based on the expression of SMARCAL1 in the developing fetal kidney, we hypothesize that DNA damage begins during fetal development causing marked DNA fragmentation and genomic instability, which culminates in disrupted kidney cell function in SIOD patients.
In summary, we demonstrate that our three SIOD patients (Patients 1, 2 and 3) exhibit the tip and collapsing variants of FSGS. We observed selective SMARCAL1 expression in numerous cell types of both the developing and mature human and mouse kidney. Within the glomerulus, SMARCAL1 localizes to the podocyte and endothelial cells. Additionally, our analysis of SIOD patient renal biopsies showed marked increases in DNA fragmentation. Given the known roles of SMARCAL1, we suggest that disruptions in genomic integrity during fetal kidney development contribute to the pathogenesis of FSGS in SIOD patients.
Footnotes
Declaration of Conflicting Interests
The authors declared no potential conflicts of interest with respect to the research, authorship, and/or publication of this article.
Funding
The authors disclosed receipt of the following financial support for the research, authorship, and/or publication of this article: This study was supported by start-up funds to DB from McMaster University. This work was supported by funds from the
References
Supplementary Material
Please find the following supplemental material available below.
For Open Access articles published under a Creative Commons License, all supplemental material carries the same license as the article it is associated with.
For non-Open Access articles published, all supplemental material carries a non-exclusive license, and permission requests for re-use of supplemental material or any part of supplemental material shall be sent directly to the copyright owner as specified in the copyright notice associated with the article.