
Abstract
Microwave methods of fixation can dramatically shorten fixation times while preserving tissue structure; however, it remains unclear if adequate tissue antigenicity is preserved. To assess and validate antigenicity, robust quantitative methods and animal disease models are needed. We used two mouse mammary models of human breast cancer to evaluate microwave-assisted and standard 24-hr formalin fixation. The mouse models expressed four antigens prognostic for breast cancer outcome: estrogen receptor, progesterone receptor, Ki67, and human epidermal growth factor receptor 2. Using pathologist evaluation and novel methods of quantitative image analysis, we measured and compared the quality of antigen preservation, percentage of positive cells, and line plots of cell intensity. Visual evaluations by pathologists established that the amounts and patterns of staining were similar in tissues fixed by the different methods. The results of the quantitative image analysis provided a fine-grained evaluation, demonstrating that tissue antigenicity is preserved in tissues fixed using microwave methods. Evaluation of the results demonstrated that a 1-hr, 150-W fixation is better than a 45-min, 150-W fixation followed by a 15-min, 650-W fixation. The results demonstrated that microwave-assisted formalin fixation can standardize fixation times to 1 hr and produce immunohistochemistry that is in every way commensurate with longer conventional fixation methods.
Introduction
The methods and quality of tissue fixation can significantly affect tissue morphology and antigenicity, factors that are important in both research and clinical pathology. In addition to morphological factors such as tumor grade, pathologists assess the amount of hormone receptor proteins within invasive tumor cells to provide prognostic information. The overall quality of fixation can be assessed by many parameters, including morphology, antigenicity, and molecular data. When changing a single component of an established protocol, it would be ideal to quantify these parameters, instead of only relying on subjective assessment by pathologists. A number of semi-quantitative measurements of antigenicity have been proposed and tested for breast cancer, including: Allred Score (Allred et al. 1998), J-Score (Kurosumi 2007), H-score (McClelland et al. 1990), and “quickscore” (Leake et al. 2000) methods. These are all based on the percentage of positive tumor cells and, except for J-Score, all apply a “label intensity” component to the scoring.
Recently, we developed methods for quantitative image analysis (QIA) that provide a quantitative description of staining intensity over an entire tissue sample (Cardiff et al. 2013). Our Density:Intensity histograms were validated in a lengthy study on mouse and human breast cancers (Cardiff et al. 2013). In this study, we use the new QIA technology to measure antigenicity when mouse tissues were fixed with or without the application of microwave energy. Microwave-assisted (MA) formalin fixation with 10% neutral buffered formalin (NBF), containing approximately 4% formaldehyde, has been demonstrated to reduce fixation times to as little as 20 min without affecting morphology or vimentin antigenicity of paraffin-embedded tissues (Galvez et al. 2006). An MA approach to NBF fixation saves considerable time over conventional methods of NBF fixation (Fox et al. 1985) and provides the additional benefit of standardizing the fixation step to a single time point (Giberson and Elliott 2001; Galvez et al. 2006; Gagna et al. 2007). This is particularly relevant because the debate over minimum and maximum formalin fixation times, especially in breast cancer diagnostics, has been extensive and ongoing (von Wasielewski et al. 1998; Goldstein et al. 2003; Wolff et al. 2007; Gown 2008; Yaziji et al. 2008; Hammond et al. 2010; Tong et al. 2011; Nofech-Mozes et al. 2012).
To evaluate antigenicity, a four-antigen panel (IHC4) was employed, which is significant to the prognosis and treatment of breast cancer (Cuzick et al. 2011). The IHC4 panel consists of (1) estrogen receptor (ER), (2) progesterone receptor (PR), (3) human epidermal growth factor receptor 2 (Her2), and (4) the proliferation and ribosomal RNA transcription protein (Ki67). The acquisition of digital whole slide images (WSI) followed by proven methods of QIA (Cardiff et al. 2013) provided the means to evaluate the antigenicity of the IHC4 panel after the different fixation methods.
The findings of this study provide a quantitative and graphical basis of comparison for each fixation method and antigen consistent with the microscopic evaluation of the results. The use of QIA on WSI provided an unbiased reproducible means of quantifying antigenicity that clearly indicated that MA NBF fixation would produce IHC4 labeling results in 1 hr that are equivalent to those achieved with conventional 24-hr fixation.
Materials & Methods
This study employed two mouse models of breast cancer to evaluate antigenicity after fixation with 10% NBF by either MA or conventional room temperature techniques. We compared two 1-hr MA methods of NBF fixation (Giberson and Elliott 2001; Galvez et al. 2006; Gagna et al. 2007) to a passive soaking in NBF at room temperature for 24 hr (the control). After fixation, the tissues were placed in 70% ethanol and processed into paraffin. Together, the two mouse models expressed all four IHC4 antigens. We utilized a rigorous, established standard operating procedure (SOP) for all steps, from tissue acquisition through processing and labeling, in addition to proven methods of QIA to quantify and characterize labeling intensity and density (Cardiffet al. 2013).
Mouse Models
The two mice used for these two models of human breast cancer were housed at the Center for Comparative Medicine Mouse Biology Program at the University of California, Davis. All procedures were performed in accordance with the U.S. Public Health Service Policy of Humane Care and Use of Laboratory Animals as well as the Animal Welfare Act (7 U.S.C. et seq.). Animal use protocols were approved by the Institutional Animal Care and Use Committee of the University of California, Davis.
Mouse Mammary Tumor Cell Lines
The two mouse mammary tumor cell lines used in this study were:
SSM2 (ER/PR positive, Ki67+, Her2Low): Luminal-like tumor from Tm (Stat1-/-(Schreiber/Chan)) (Taconic, Hudson, NY) (Chan et al. 2012).
NDL (Her2+, Ki67+, ER/PR negative): Luminal-like tumor line from Strain FVB mice with a neu deletion (NDL) allele Tg(MMTV:NDLMuller) (Siegel et al. 1999).
The two tumor cell lines were grown in culture and prepared for transplantation into the #3 and/or #4 mouse mammary fat pads. The two tumor lines were transplanted into each wild type mouse and allowed to grow prior to processing and evaluation. For all experiments, mammary gland, uterus, and liver were sampled.
Animals were sacrificed with a lethal dose of intraperitoneal pentobarbital sodium. Tumor, mammary gland, uterus and liver were removed, each divided into 2-mm pieces, and placed in NBF as quickly as possible after sacrifice. In all cases, the time from sacrifice to immersion in NBF was less than 30 min. Three tissue pieces (tumor/mammary gland, uterus, and liver) from each animal were placed into each of 6 cassettes. These served as replicates for the three fixation protocols: (1) MA 60 min at 150 W, (2) MA 45 min at 150 W followed by 15 min at 650 W, and 24 hr control fixation at room temperature. To differentiate amongst the processing groups, the tumors from each mouse model tumor were designated ‘A’ and ‘B’.
Microwave-assisted NBF Fixation
Microwave-assisted NBF fixation was performed with a PELCO BioWave® Pro (Ted Pella, Inc., Redding, CA). The microwave processor can be programmed to deliver continuous power at any power output from 100 to 750 W. Power delivery is, therefore, continuous throughout the fixation process versus on/off or pulsed. Continuous sample temperature control during microwave exposure was obtained through the use of the PELCO SteadyTemp™ Pro (STP, Ted Pella, Inc., Redding, CA). This ancillary device functions as a chiller or heater and is connected to the microwave via fluid hoses for circulation and an RS 232 cable. The STP circulates and controls the temperature of a 2 L volume of water in an 8.25-inch square × 4-inch deep polypropylene container inside the microwave cavity.
Two different MA protocols, previously demonstrated to preserve tissue ultrastructure were evaluated: 1) 60 min at 150 W and fixative temperature <37C; MW1-A for Tumor A and MW1-B for Tumor B; 2) 45 min at 150 W + 15 min at 650 W and fixative temperature <37C; MW2-A for Tumor A and MW2-B for Tumor B (Giberson and Elliott 2001; Galvez et al. 2006).
Tissues for fixation were placed in 50 ml conical screw cap tubes (USA Scientific Inc., Ocala, FL) containing 45 ml of NBF. The tubes floated on their sides in the container cooled by the STP inside the microwave cavity. In this way, no agitation of the NBF took place during microwave exposure. To maintain NBF temperatures below 37C inside the screw cap tubes for the 150 W cycle, the STP was set at 26C. The 150/650 W cycle required that the STP automatically reset to 10 C for the 650 W portion of the cycle to maintain the final NBF temperature below 37C inside the tube.
Control NBF Fixation
Tissues fixed as controls were placed in cassettes and allowed to sit in NBF at room temperature (approximately 23C) for a 24-hr passive fixation. Controls for each mouse model were designated Control-A for one tumor and Control-B for the other. In this way they directly correspond with the MA processing groups. Passive relates to the fact that no agitation of the sample or fixative was performed during the period. Minimum conventional NBF fixation times for the IHC4 are from 6-8 hr (von Wasielewski et al. 1998; Werner et al. 2000; Goldstein et al. 2003; Wolff et al. 2007; Gown 2008; Yasiji et al. 2008; Nofech-Mozes et al. 2012).
Tissue Processing after Fixation
Immediately after fixation, the tissues were transferred to 70% ethanol before overnight processing into paraffin with a Tissue-Tek autoprocessor (Sakura Finetek USA, Inc., Torrance, CA). Each cassette contained a sample of tumor/mammary gland, uterus, and liver.
The tissues were embedded in Paraplast paraffin (melting temperature 56–60C), sectioned to 5 µm and mounted on glass slides. Sections were stained using Mayer’s hematoxylin and eosin (H&E) to facilitate evaluation of histology and morphology. During processing, tissues were dehydrated in a graded series of ethanol and cleared with xylene prior to paraffin infiltration.
All pre- and post-fixation steps were standardized by having them performed by a single individual.
Immunohistochemistry
All tissues were stained for IHC4 by a single individual. All primary antibodies were rabbit polyclonal and the source and dilutions are listed below.
ER: Santa Cruz Biotechnology, Inc., Dallas, TX (Cat# sc-542; dilution 1:800).
PR: Dako North America, Inc., Carpinteria, CA (Cat# A0098; dilution 1:500).
Ki67: Lab Vision (Neomarker), Fremont, CA (Cat# RB1510-PO; dilution 1:800).
c-erbB2 (Her2): Lab Vision (Neomarker), Fremont, CA (Cat# RB103-PIABX; dilution 1:600).
Slides for immunohistochemistry were deparaffinized in three changes of xylene followed by three changes of 100% EtOH followed by quenching for endogenous peroxidase with 3% hydrogen peroxide (20 ml of 30% H2O2 plus 180 ml of 100% methanol). Slides were then rehydrated with two stages each of 100%, 95% and 70% ethanol (2 min each step) followed by 5 min in running tap water and two rinses with distilled water. Antigen retrieval was performed with freshly-made citrate buffer, pH 6.0, in a Decloaking Chamber™ (Biocare Medical, Concord, CA). Slides were rinsed and then blocked with 10% horse or goat serum in phosphate-buffered saline (PBS) for 20 min. All primary antibodies were diluted with PBS + 0.1% Ova Albumin (Sigma-Aldrich, St. Louis, MO), and stained overnight at room temperature. Slides were rinsed in PBS and secondary antibody staining in PBS + 0.1% Ova Albumin was done for 1 hr at room temperature with biotinylated goat anti-rabbit IgG (Vector Laboratories, Burlingame, CA) at 1:1000 dilution.
After rinsing in PBS, slides were stained for 30 min at room temperature with avidin-biotin complex (ABC Reagent, Vector Laboratories, Burlingame, CA) in PBS + 0.1% Ova Albumin, rinsed in PBS, and treated with diaminobenzidine (Vector Laboratories, Burlingame, CA) for 3-5 min. Slides were then rinsed in water, counterstained with hematoxylin, dehydrated in ethanol, and cleared in xylene before cover-slipping. Negative and positive controls were included with each run.
Control Tissues: ER, PR, Ki67 and ErbB2 (Her2)
Mouse uterine tissue was used for the positive and negative (primary antibody-deletion) immunohistochemistry controls for ER and PR. The uterine myometrium from the recipient mice was used as control tissue for ER/PR in each experiment because it is essentially constant through the estrous cycle (Cardiff et al. 2013). For each experiment, normal human tonsils and normal mouse lymph nodes served as positive and negative (primary antibody-deletion) controls for Ki67. The NDL mammary tumor overexpresses ErbB2 (Her2), and was chosen as the positive control. A standard NDL tumor block was used for each IHC run using anti-ErbB2 (Her2).
Whole Slide Images and Quantitative Image Analysis
After fixation and staining, slides were scanned to created digital whole slide images (WSI) using an Aperio ScanScope XT (Aperio Technologies, Vista, CA). The data from each slide was automatically captured and stored in the Aperio Spectrum version 11 database. Each WSI was annotated by experienced morphologists to select similar tumor, mammary gland and uterine tissue regions. All tissue regions in each WSI were analyzed using Aperio ImageScope software (http://www.aperio.com/#imagescope-request). The Aperio “Membrane” (ErbB2/Her2) and “Nuclear” (ER, PR and Ki67) version 9 algorithms were used to count the number of cells in total and measure the intensity of positive staining in each cell. The percentage of positively stained cells (and the 1+, 2+, and 3+ intensity breakdowns) in each tumor and uterus was calculated and recorded in the Aperio Spectrum database.
Aperio Algorithm Parameter Settings
The nuclear and membrane algorithms have parameters that can be changed to affect cell detection or to change the intensity cutoff values used to bin cells in the 1+, 2+, or 3+ categories. For tumor tissue we retained the default parameter settings to ensure consistency with our previous work in SSM2 and NDL mouse tissues (Cardiff et al. 2013) and also because they produced empirically valid results for cell detection and segmentation. The algorithm parameter settings were modified for the uterine myometrium to take into account the fusiform shape of the smooth muscle cells of the myometrium, which improved the accuracy of ER, PR, and Ki67 analyses (Cardiff et al. 2013). We used identical intensity cutoff values for all tissues, retaining the default intensity cutoff values to ensure consistency with previous work, but also because the goal of the project was to assess variance in staining. As long as each sample was analyzed using the same cutoff values, similarly stained tissue should present similar histograms and percentage values.
Density: Intensity Line Plots
Intensity and cell count data were exported from Spectrum to create Density:Intensity line plots. These line plots were used in combination with percent positive data to evaluate the immunohistochemistry results in this study. The line plots represented the relative cell density (y-axis) at any given intensity (x-axis) for cells annotated for a given tissue. Because the line plots represent 256 intensity bins instead of 4 (0, 1+, 2+, 3+), they provide a more detailed interpretation of the staining distribution than percent positive data alone. The data were analyzed using R, a “freely available language and environment for statistical computing and graphics” (http://www.R-project.org). The plot produces a measure of “cell density” in cells/mm2 versus intensity, measured from 0 (lightest) to 1 (darkest) in optical intensity units (OIU). For the nuclear algorithm, the cells with intensity above the cutoff value of 0.125 OIU were regarded as “positive staining” and less than 0.125 as “negative staining”, whereas, for the membrane algorithm, the cutoff value was 0.167 OIU. The line plots were smoothed using a loess predictor, which smoothed the data using locally weighted linear regression, with a span of 0.1 chosen empirically.
Kolmogorov-Smirnov Test to Assess Line Plot Similarity
The Kolmogorov-Smirnov (KS) test is a non-parametric test that can measure if two sample distributions were drawn from the same distribution or not (Kolmogorov 1933). The empirical distribution functions for both distributions are calculated and the distance between them compared. If that distance is greater than a critical level in the KS table, the null hypothesis that the distributions differ is rejected. The R ks.test library was used to calculate the p value for a two-sample KS test. Because we wanted to assess whether or not the microwave protocols would reduce antigenicity, we used the alternative hypothesis that the microwave sample was less than the control sample. Simply put, a small p value (less than 0.05) for the KS test would indicate that the microwave sample had lower antigenicity than the control sample. In addition to comparing the microwave and control tissues, the KS test was used to assess the biological variance between the two control fixations for the different tissues. In this case, the regular two-sample KS test was used, and small p values would indicate that the control samples differed. This approach provided insight into the variance in staining between any two tissues from the same mouse fixed using control methods.
Determination of Similarity by Microscopic Examination
The following considerations were used by experienced pathologists to determine similarity between the two fixation techniques:
Is the stain localization and counterstain appropriate and specific for each antigen?
Is there an equivalent staining intensity noted for both techniques for control and MA-fixed slides for all four antigens?
Is the background staining increased or decreased by MA fixation?
Would the results from MA fixation have changed the diagnosis or prognosis?
Results
This research employed well-characterized mouse models of breast cancer (Cardiff et al. 2013) and an IHC4 panel of antibodies that has been extensively studied and comes with rigorous assay requirements (Leake et al. 2000). Antigen preservation, as measured by labeling intensity, the line plots, cell density numbers and the Kolmogorov-Smirnov test of the line plots were the key determinants in this comparison of two fixation methods. The microscopic examination of the IHC4 stained slides was used to affirm the QIA results.
Quantitative Image Analysis of IHC4
The results of the IHC4 of mammary gland are not shown due to the small number of available nuclei (<1000) in 20 of the 36 tissue samples. All tumor or uterine samples evaluated had >1000 nuclei. The average number of nuclei evaluated was 20,147 for each tumor sample and 8,530 for the uterus.
Percent Positive Labeling
The Aperio “Membrane” (ErbB2/Her2) and “Nuclear” (ER, PR and Ki-67) version 9 algorithms were used for QIA. Labeling intensities (1+, 2+, 3+, and total percent positive) were calculated by QIA for each tissue and fixation method for IHC4. Currently, semi-quantitative methods serve as the basis for the IHC4 diagnostic and prognostic interpretation (Nofech-Mozes et al. 2012), including Allred Immunohistochemistry Score (Allredet al. 1998), J-Score (Kurosumi 2007), H-score (McClelland et al. 1990), and “quickscore” (Leake et al. 2000) methods. By calculating both the percent positive and the Density:Intensity line plots, we could compare antigenicity at the resolution used for diagnostic interpretation and also at a much finer-grained resolution. The intensity levels used were the default cutoffs provided by the Aperio algorithm. The different labeling intensities (1+, 2+, 3+) and total percent positive cells were compiled and are presented in Table 1.
Percent Positive Labeling Data from the four-antigen panel (IHC4) of the NDL and SSM2 Mouse Models.
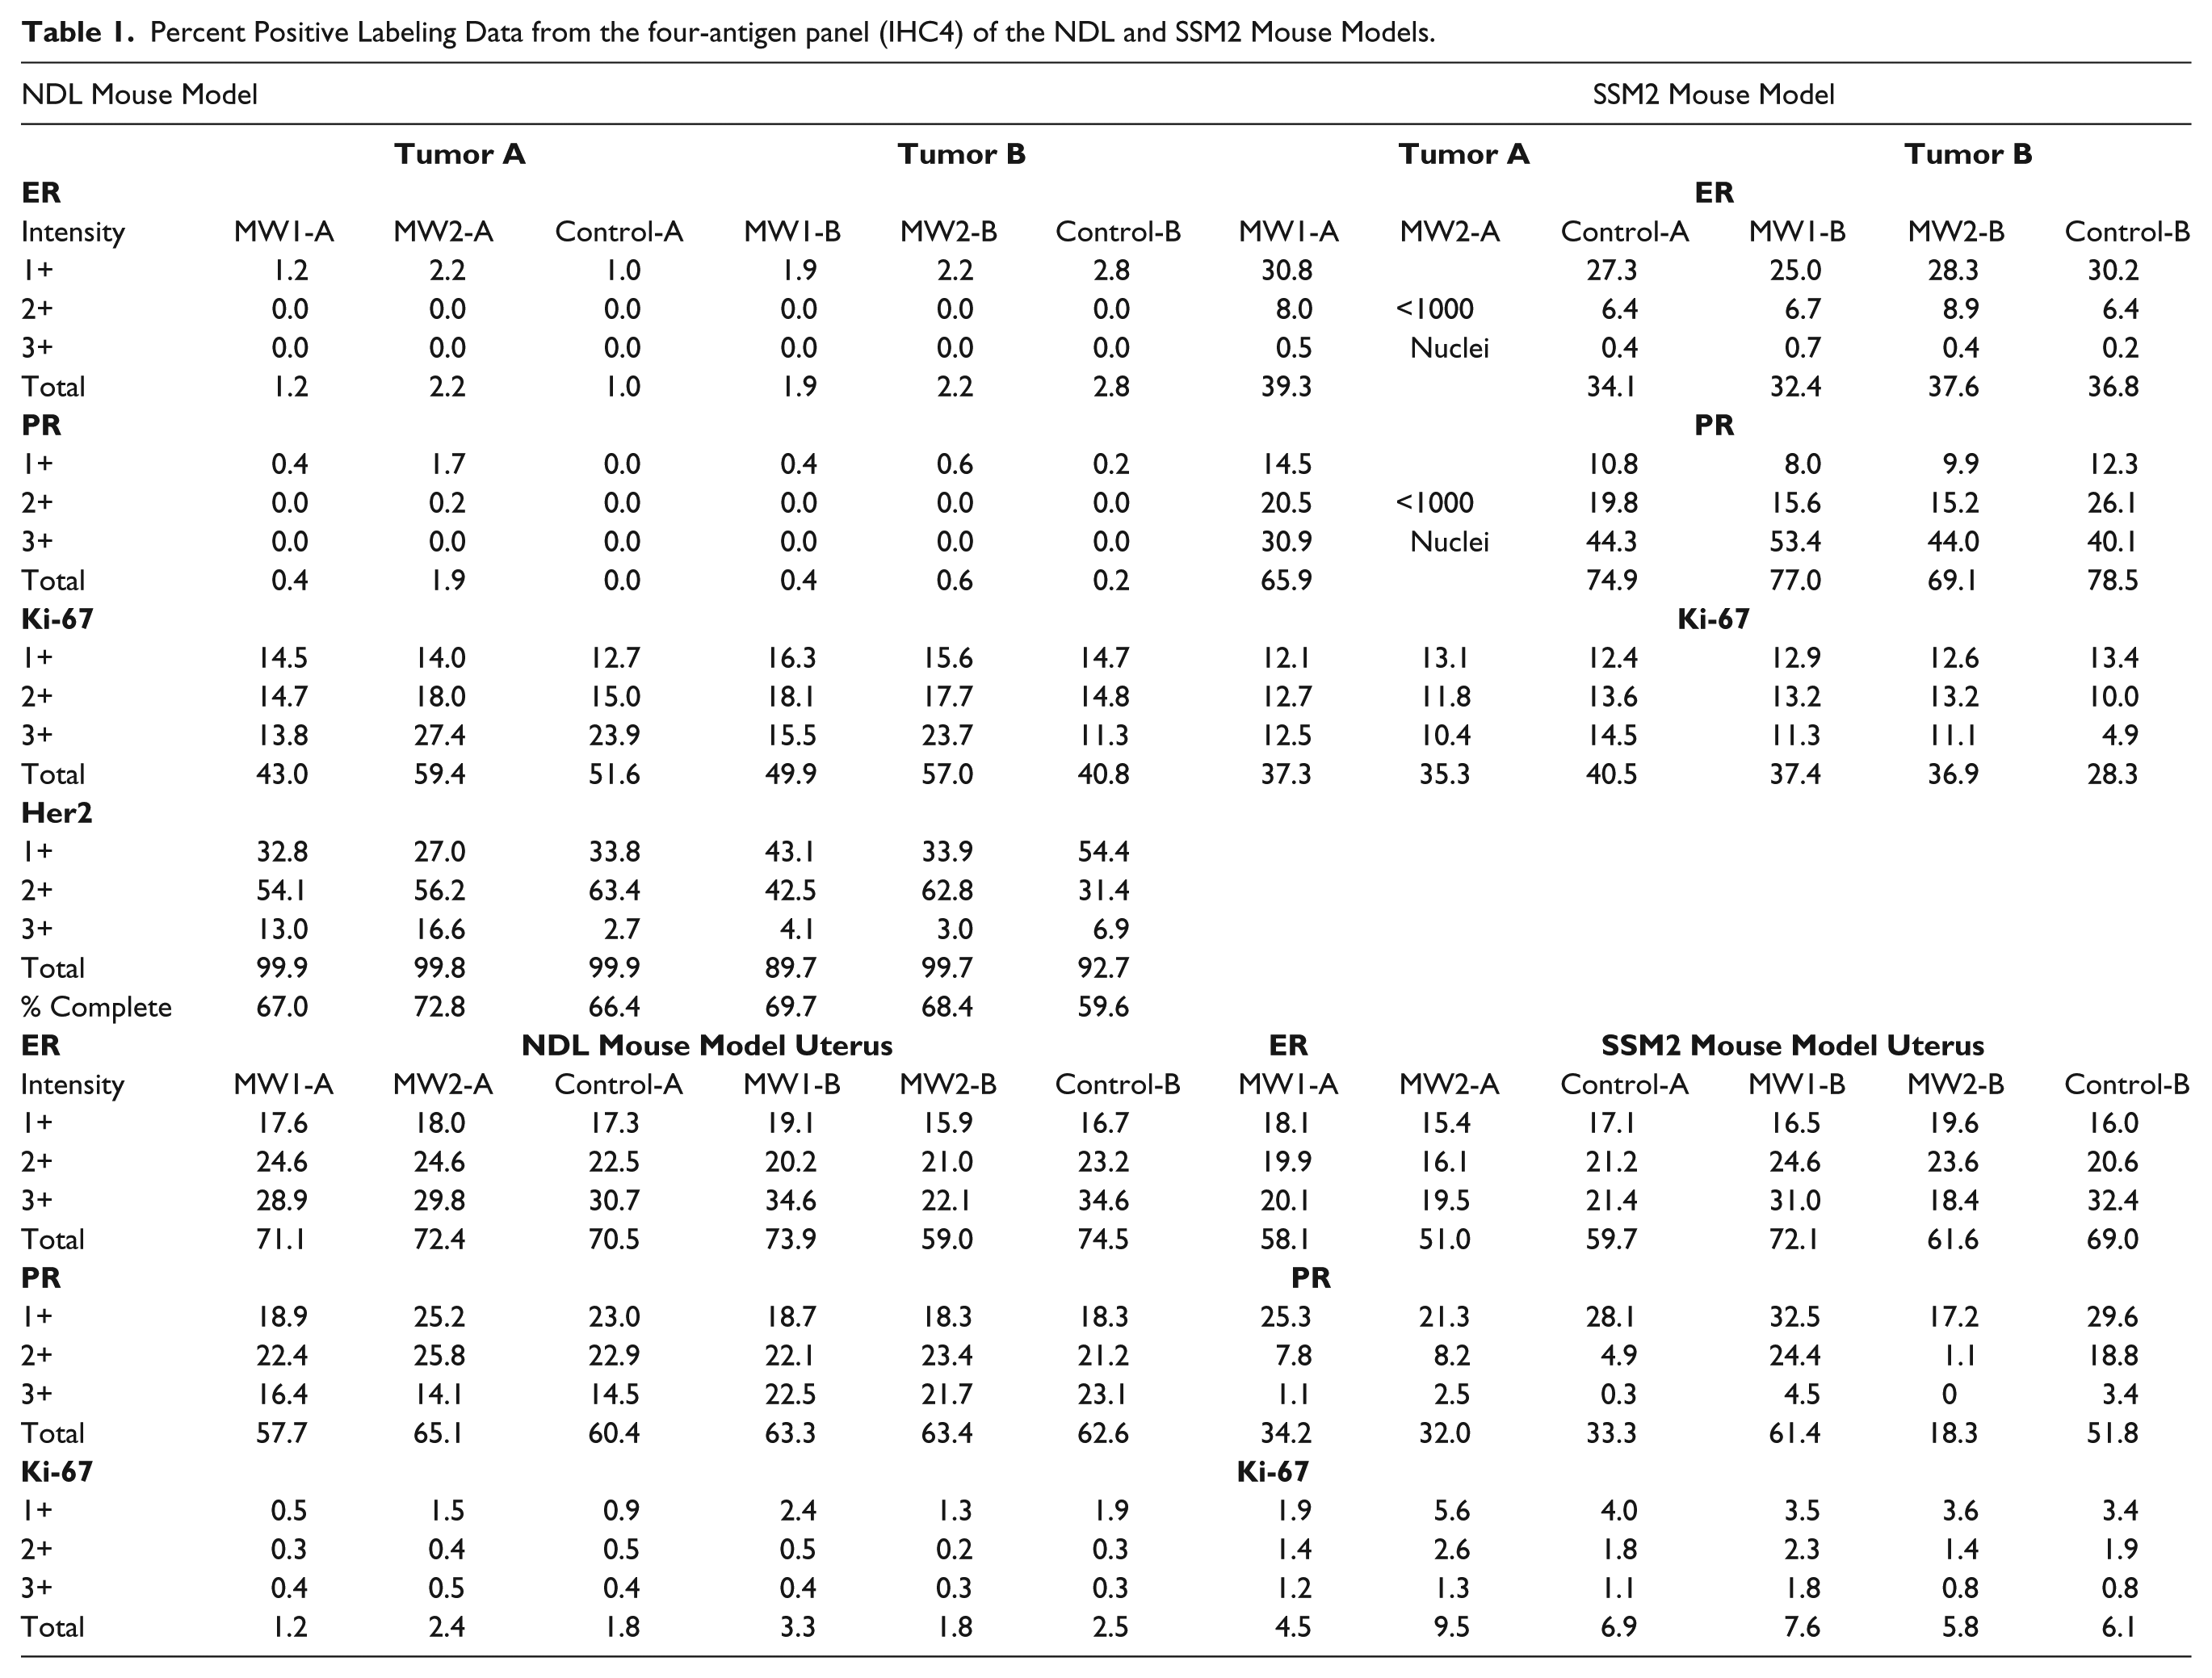
NDL Mouse Model Percent Positive Label
The NDL model overexpresses ErbB2 (Her2) to a degree that is relevant in the prognosis of human cancers. However, diagnostically, the ER/PR tumor staining would be considered negative, although there is some push to consider 1% positive staining for ER as positive (Nofech-Mozes et al. 2012). All 6 samples of tumor presented ER staining from 1 to 2.8% positive. Tumor PR labeling was from 0 to 1.9% for all samples (Control-A, 0%; Control- B, 0.2%). The ErbB2/Her2 tumor staining results were consistent across all samples for uniform intense and complete (59.6-72.8%) membranous staining (Gown 2008). Tumor percent positive results for Ki67 presented a range of values from a low of 40.8% for Control-B to a high of 59.4% for MW2-A. Uterine percent positive differences for all samples were within 4% for ER (except MW2-B), 7.4% for PR, and 2.1% for Ki67.
SSM2 Mouse Model Percent Positive Label
The SSM2 model is similar to human luminal cancer. The ER/PR tumor total percent positive staining differences for all samples were all within 6.9% for ER and 12.6% for PR. The range for 3+ label intensity for PR was >20% (low 30.9% for MW1-A, high 53.4% for MW1-B). The 3+ labeling intensity for PR, due to intra-tumor heterogeneity, can vary by over 20% (Cardiff et al. 2013). The MW2-A samples for ER and PR presented insufficient tissue (<1000 nuclei each) with which to provide valid intensity data. The Ki67 tumor values presented a range from a low of 28.3% for Control-B to a high of 40.5% for Control-A.
Uterus Control
The uterine labeling results for ER presented an approximate 10% difference between Control-A and B and MW2-A and B. The MW1-A to B difference was >10%. The uterine PR values presented a 43.1% spread (MW2-B lowest, MW1-B highest). The differences for MW1-A, MW2-A, and Control-A were all within 3%.
Density:Intensity Line Plots and Cell Density for the IHC4
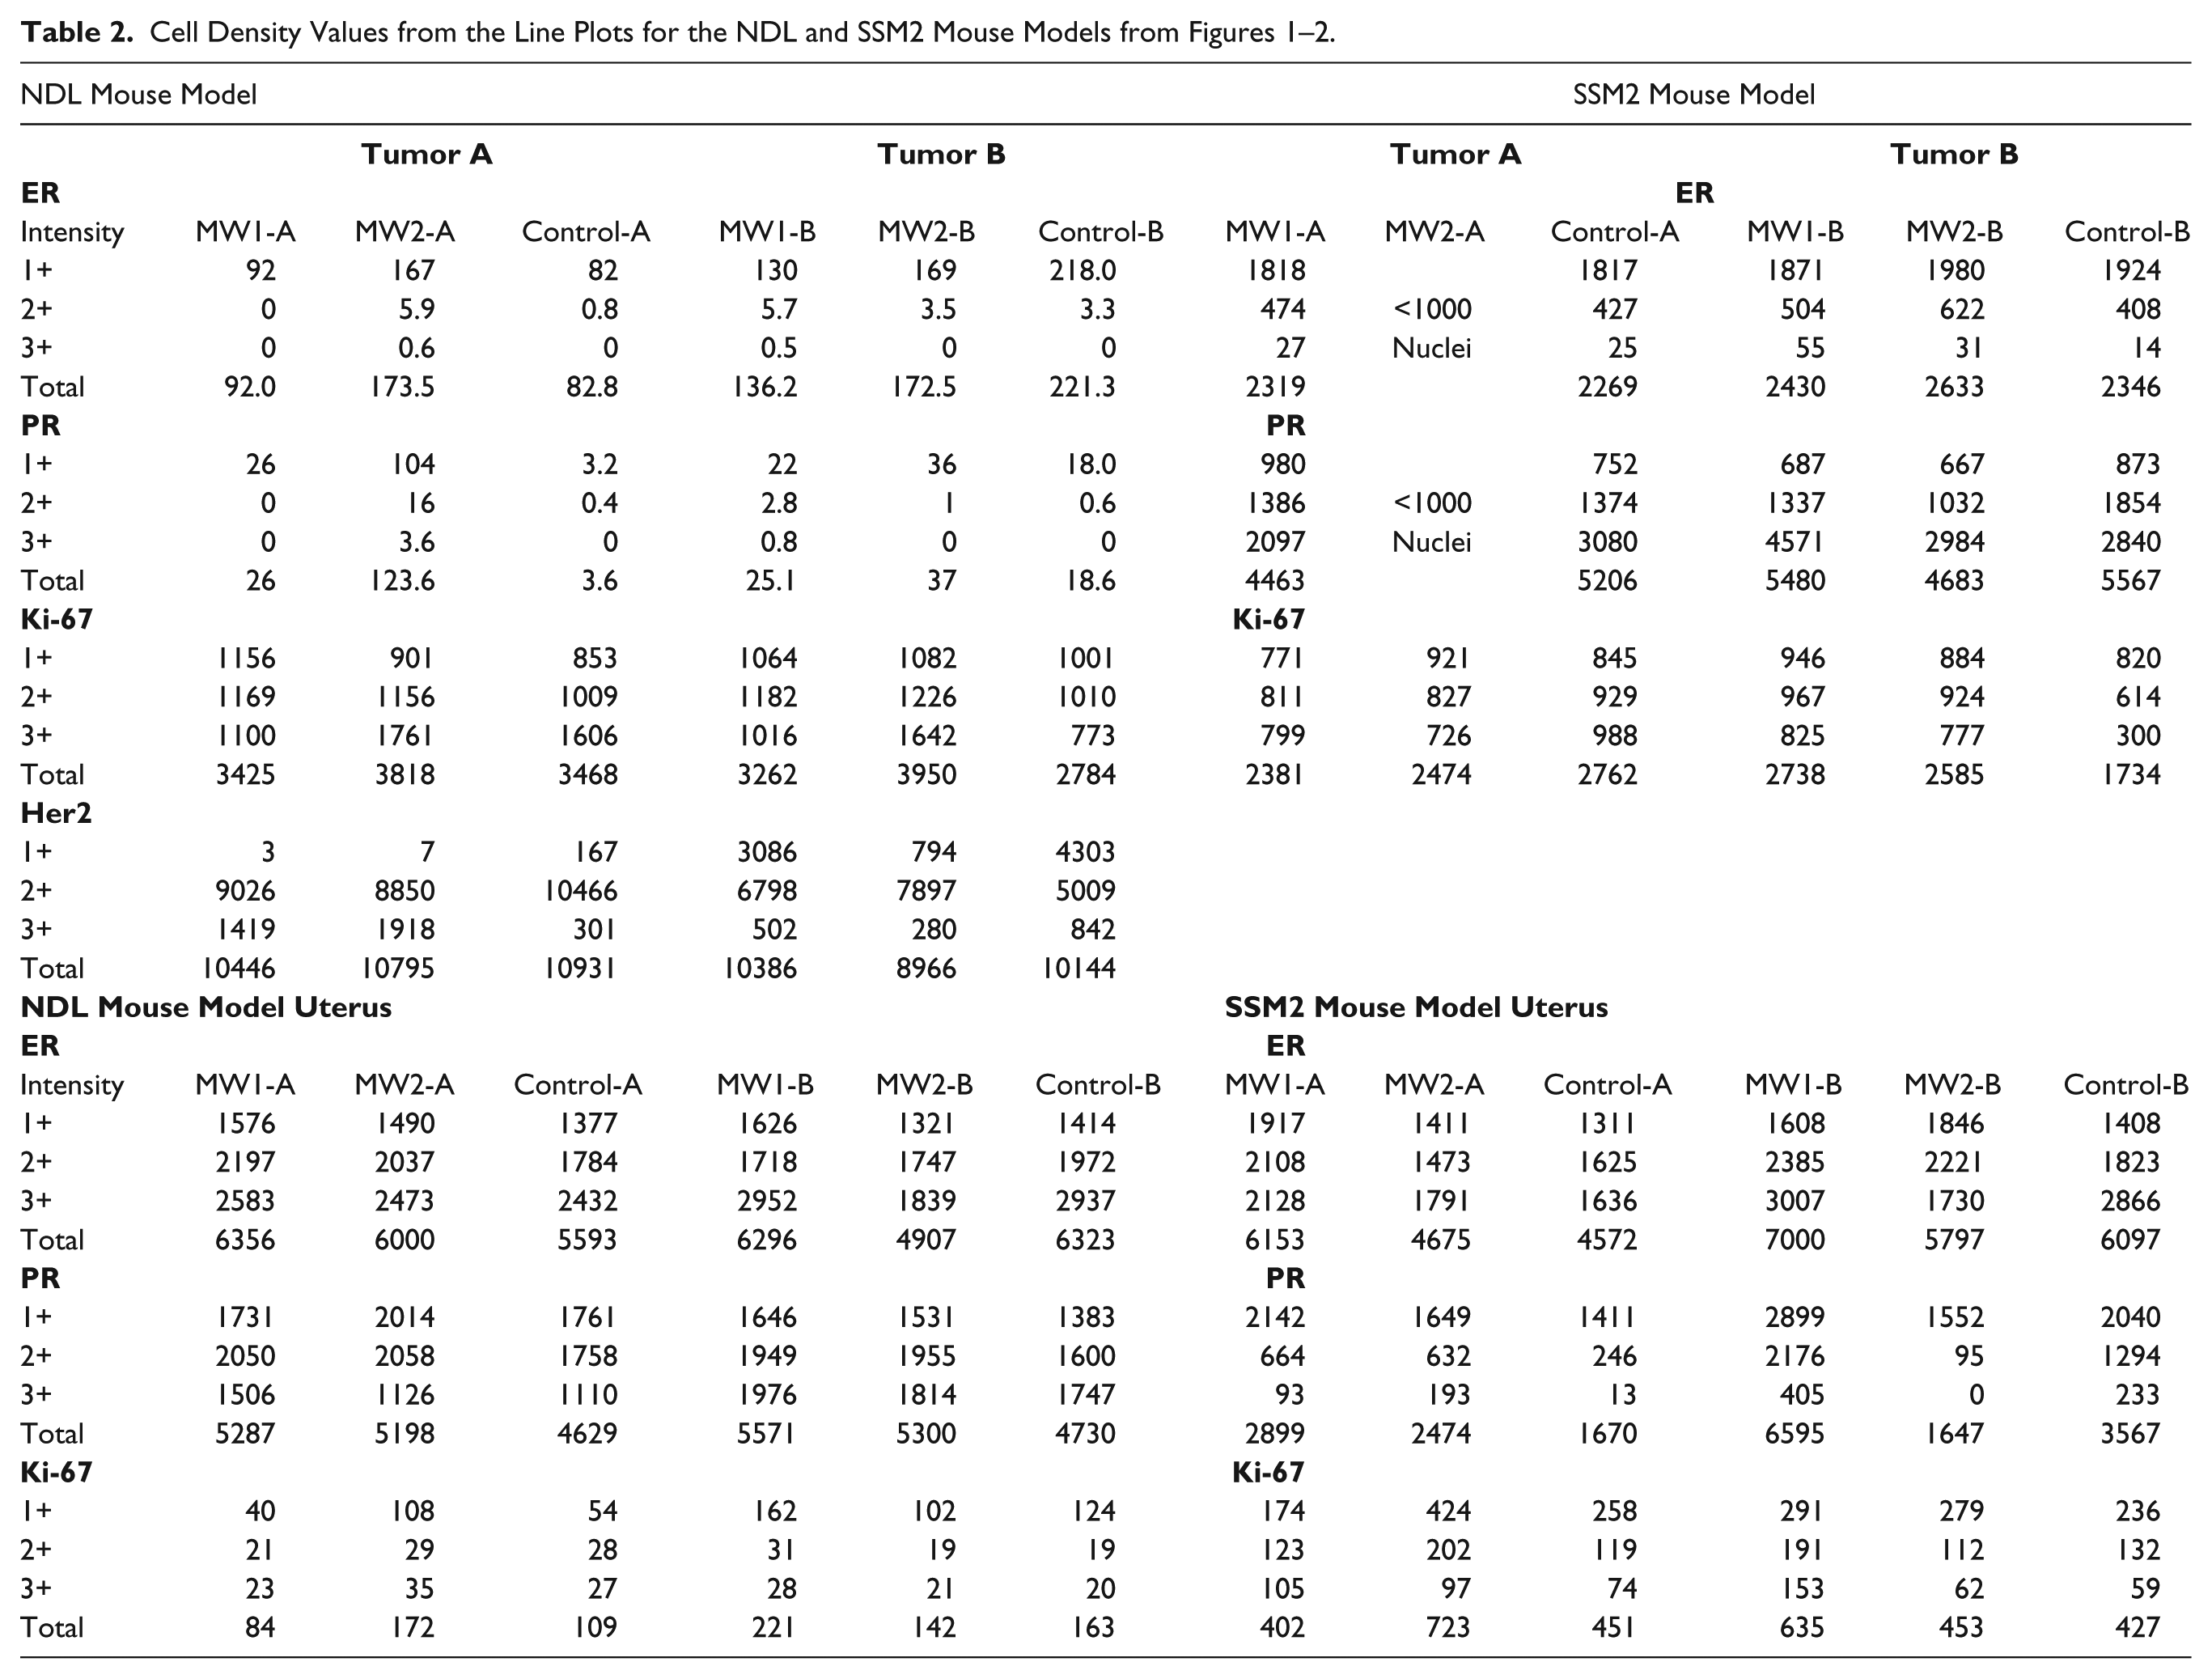
The graphical representation of the staining data available via the Density:Intensity histograms provided more detailed information of the stain distribution. These plots (Figs. 1, 2) represent the relative cell density (y-axis) at any given intensity (x-axis) for the immunostaining of the tumor and uterine results for both models. The intensity levels were the default cutoffs provided by the Aperio algorithm and the vertical lines represent 1+ >0.125 OIU, 2+ >0.217 OIU, and 3+ >0.325 OIU for each of ER, PR and Ki67. The intensity levels for Her2 were the default cutoffs provided the Aperio algorithm and the vertical lines represent 1+ >0.167 OIU, 2+ >0.292 OIU, and 3+ >0.563 OIU. The uterine SSM2 MW2-B PR total percent positive results (Table 1) varied by >43% and that result is depicted by a flat line through most of the 2+ and all of the 3+ intensity regions. The negative ER/PR results for tumors A and B of the NDL model are evident in the line plots (Fig. 1); however, the cell density data, derived from the line plots (Table 2), presented clear evidence that tumor A and B results for ER/PR were positive for all samples. The NDL Her2 line plots (Fig. 1) presented different shape and symmetry between the two tumors. The percent positive results for Her2 (Table 1) did not appear to suggest a lack of symmetry. However, the line plots for ER, PR and Ki67 all present a similar symmetry for both tumors in each model.
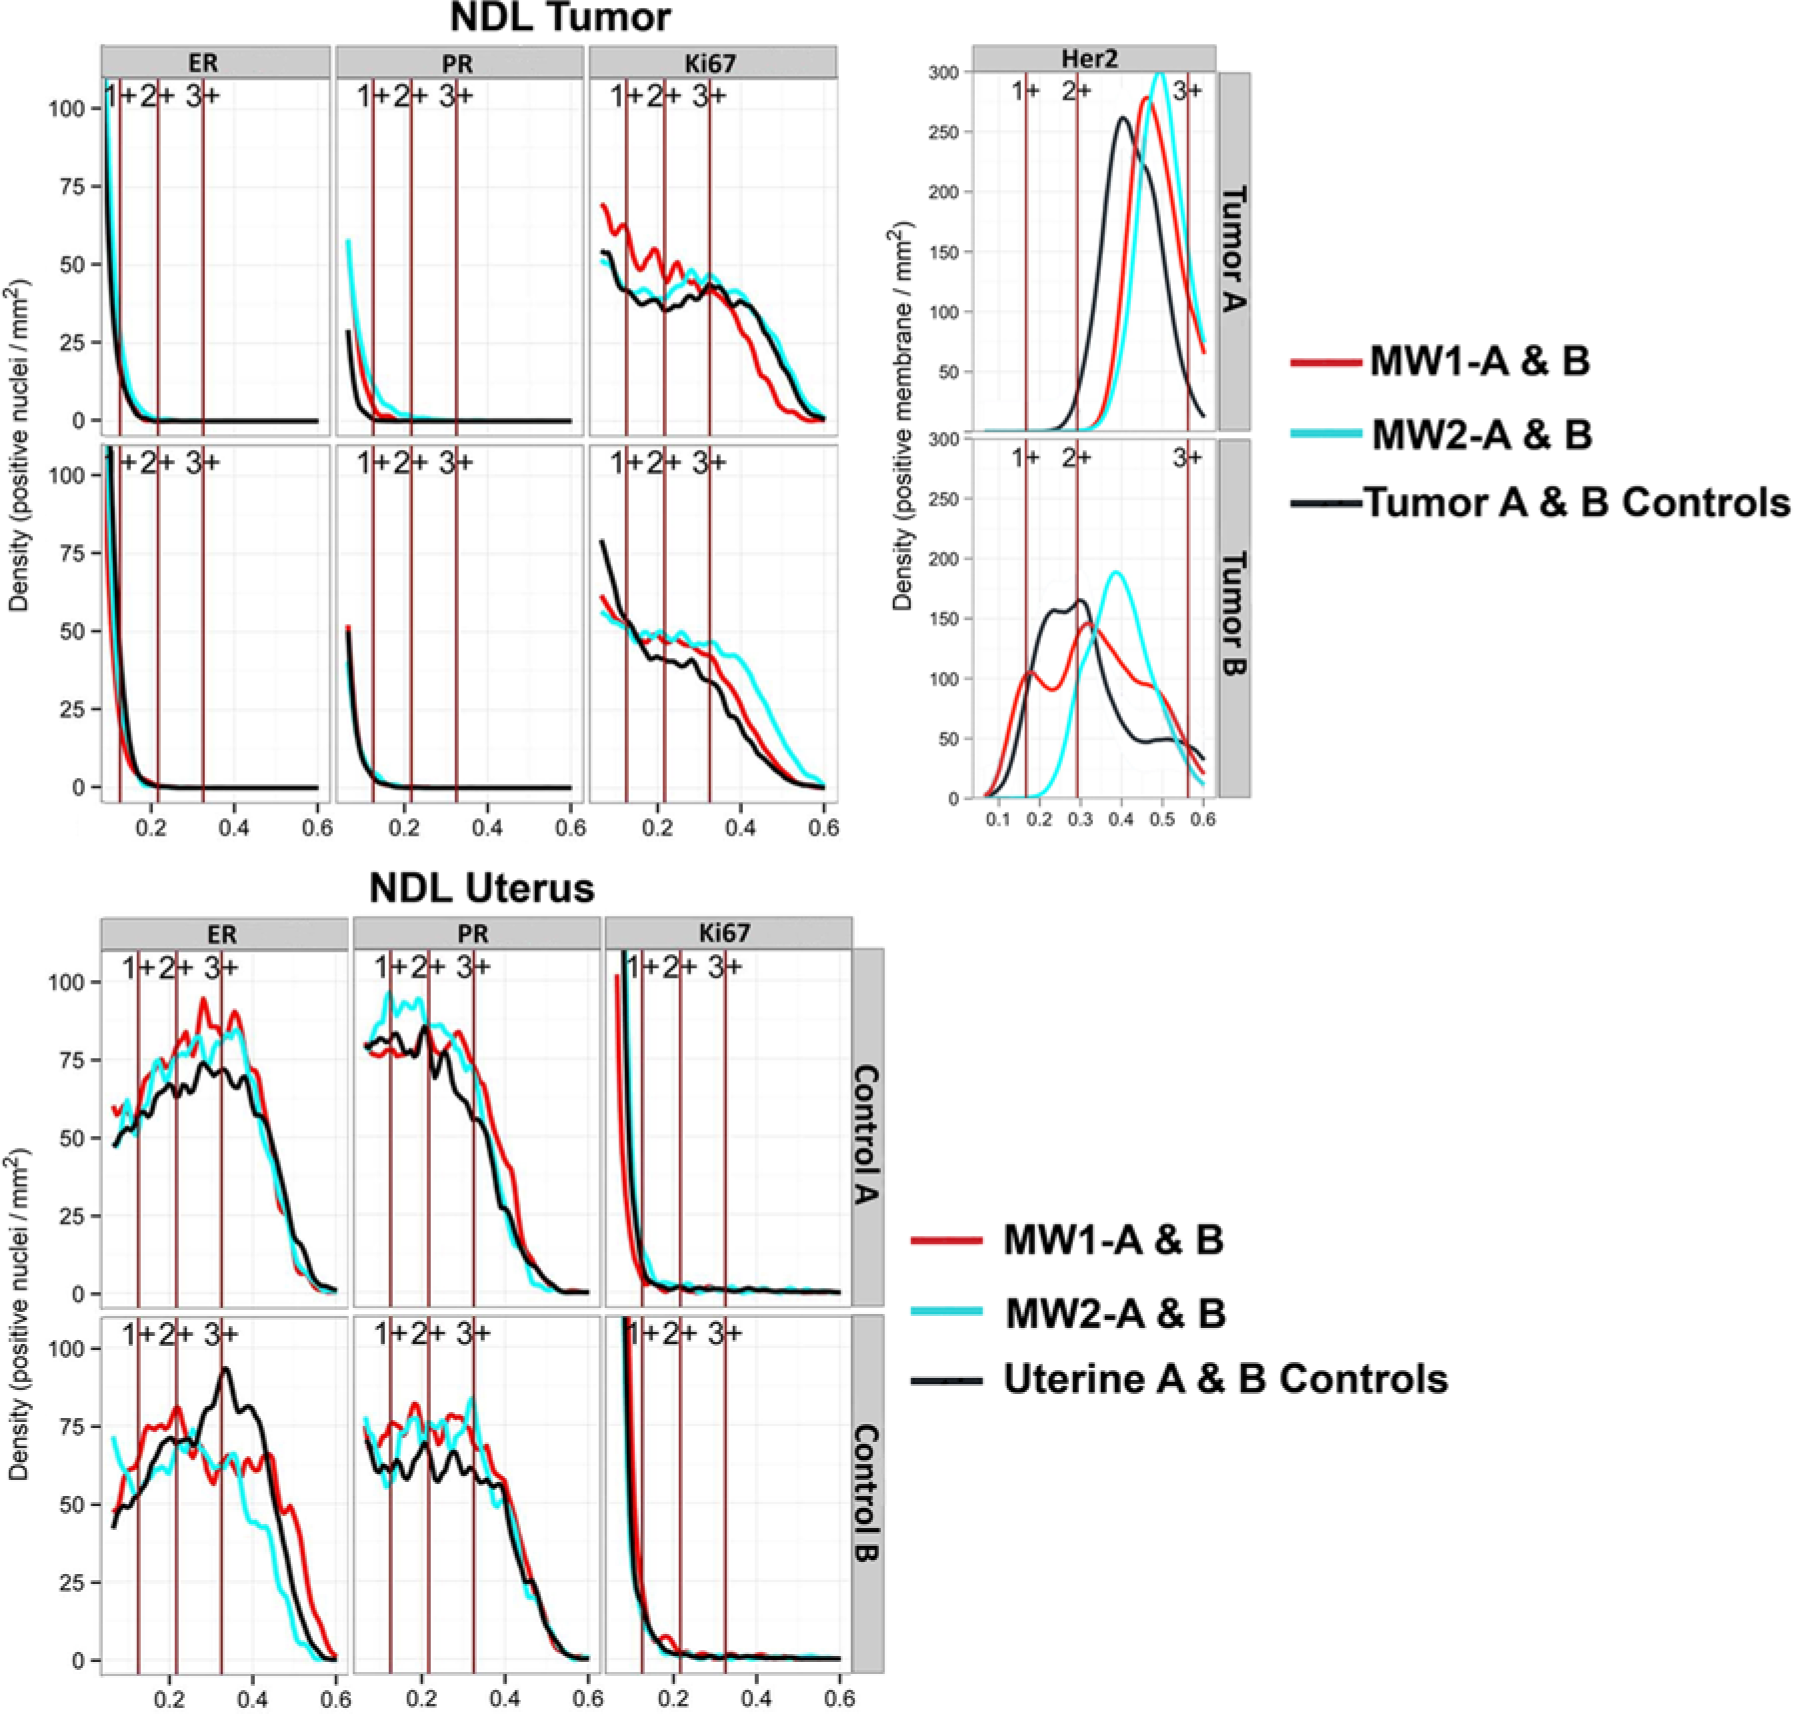
Density:Intensity line plots of the four-antigen panel (IHC4) from the NDL tumors and uterus. These plots represent the relative cell density in cells/mm2 (y-axis) at any given intensity (x-axis) for the IHC4 of the NDL tumor and uterus. The intensity levels were the default cutoffs provided by the Aperio algorithm and the vertical lines represent 1+ >0.125 OIU, 2+ >0.217 OIU, and 3+ >0.325 OIU for each of estrogen receptor (ER), progesterone receptor (PR), and Ki67. The values for human epidermal growth factor receptor (Her2) are 1+ >0.167 OIU, 2+ >0.292 OIU, and 3+ >0.563 OIU.
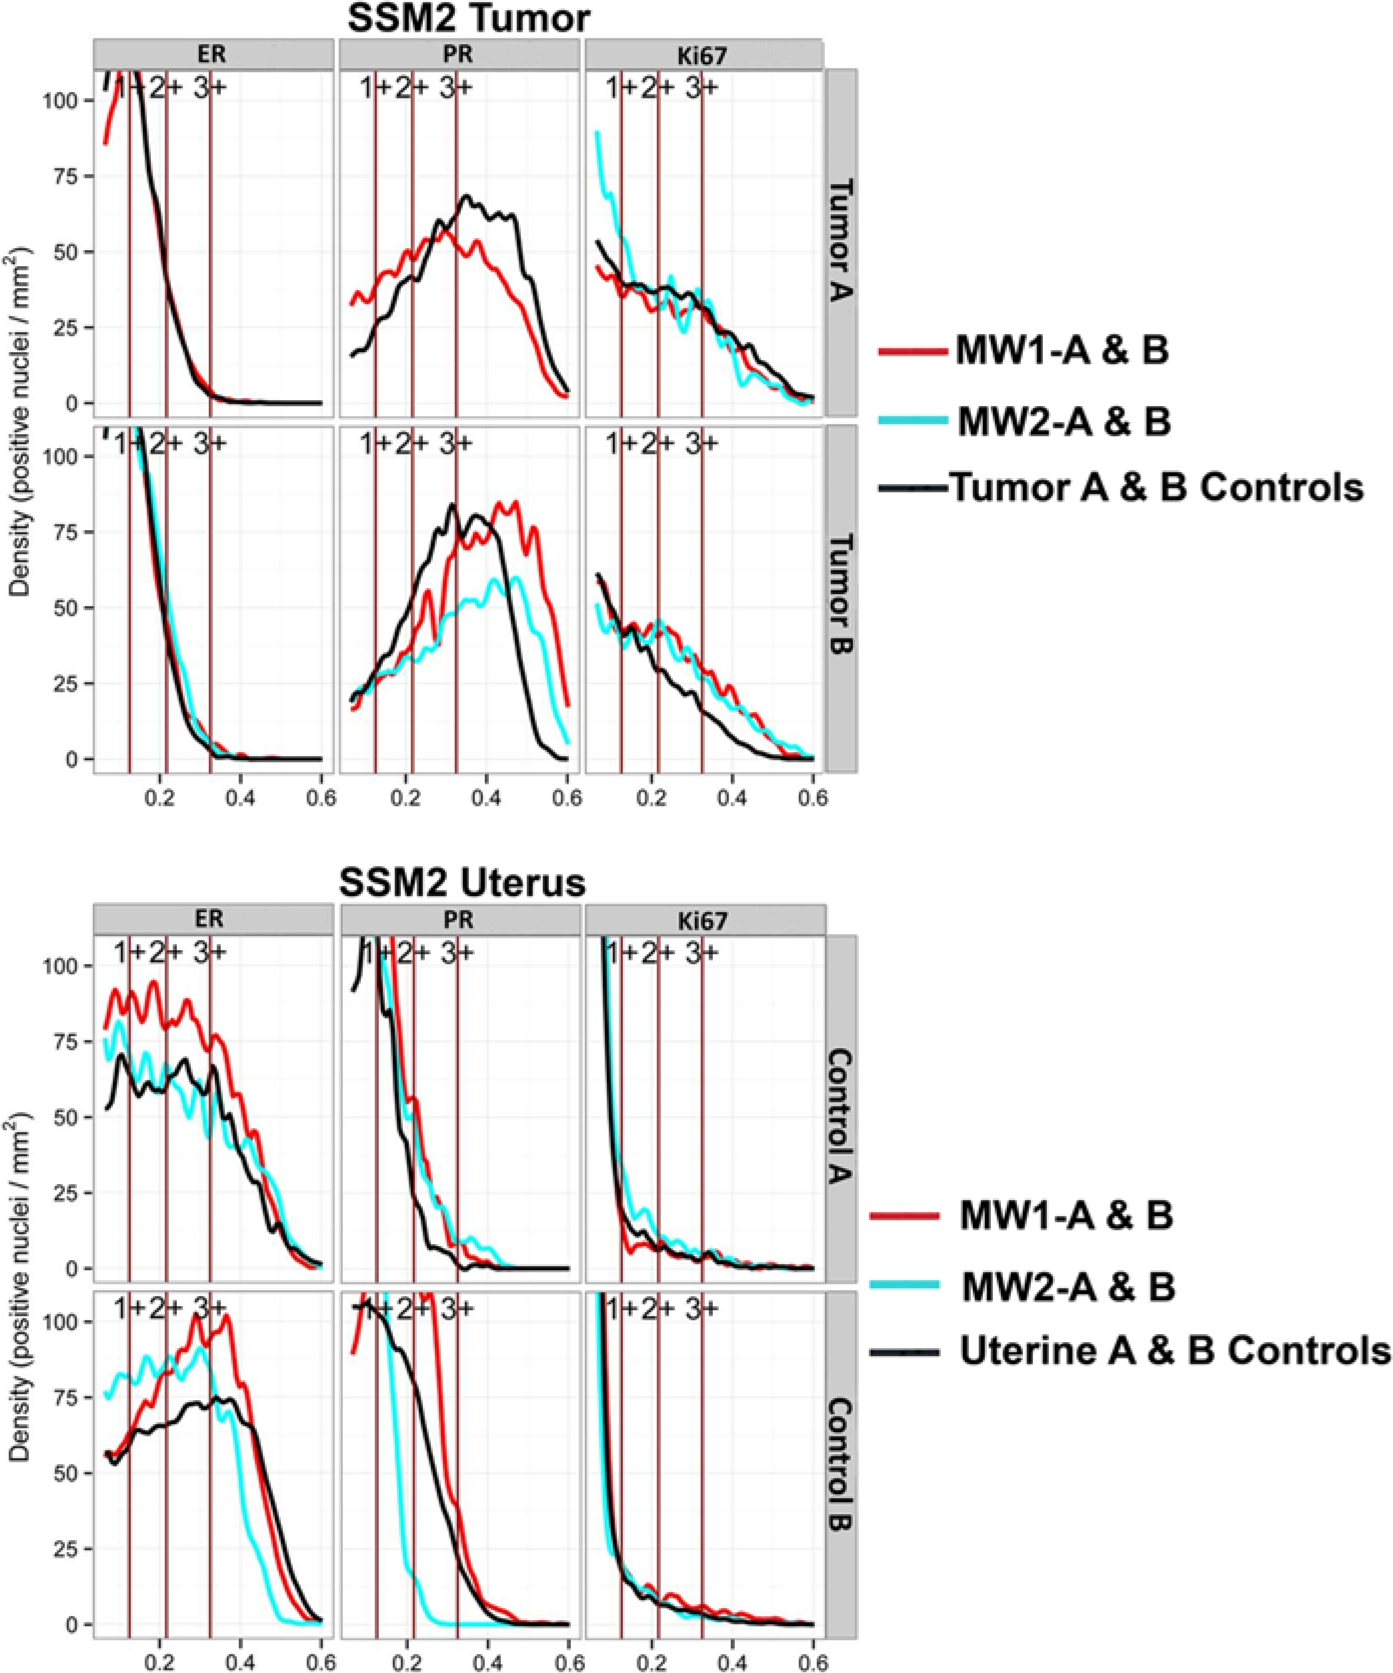
Density:Intensity line plots of the four-antigen panel (IHC4) from the SSM2 tumors and uterus. The SSM2 model is human epidermal growth factor receptor (Her2) negative. These plots represent the relative cell density in cells/mm2 (y-axis) at any given intensity (x-axis) for the IHC4 of the SSM2 tumor and uterus. The intensity levels were the default cutoffs provided by the Aperio algorithm and the vertical lines represent 1+ >0.125 OIU, 2+ >0.217 OIU, and 3+ >0.325 OIU.
Kolmogorov-Smirnov Test
The p values for each comparison are presented in Table 3 (NDL and SSM2 tumors) and Table 4 (uterus). In both tables, the p values are presented in conjunction with the total percent positive and cell density values. P values less than 0.05 for microwave-to-control comparisons indicated that the MA fixation reduced antigenicity (KS test alternative hypothesis). For control-to-control comparisons, the first number in the p value column represents the alternative hypothesis (Control-B is the experimental and Control-A the reference) and the second number, the regular two-sample KS test. In both instances, p<0.05 results would be indicative of biological variation in the control fixation results (Tables 3 and 4).
KS Statistic P Values Compared to Percent Positive and Cell Density Values for NDL and SSM2 four-antigen panel (IHC4) Results.
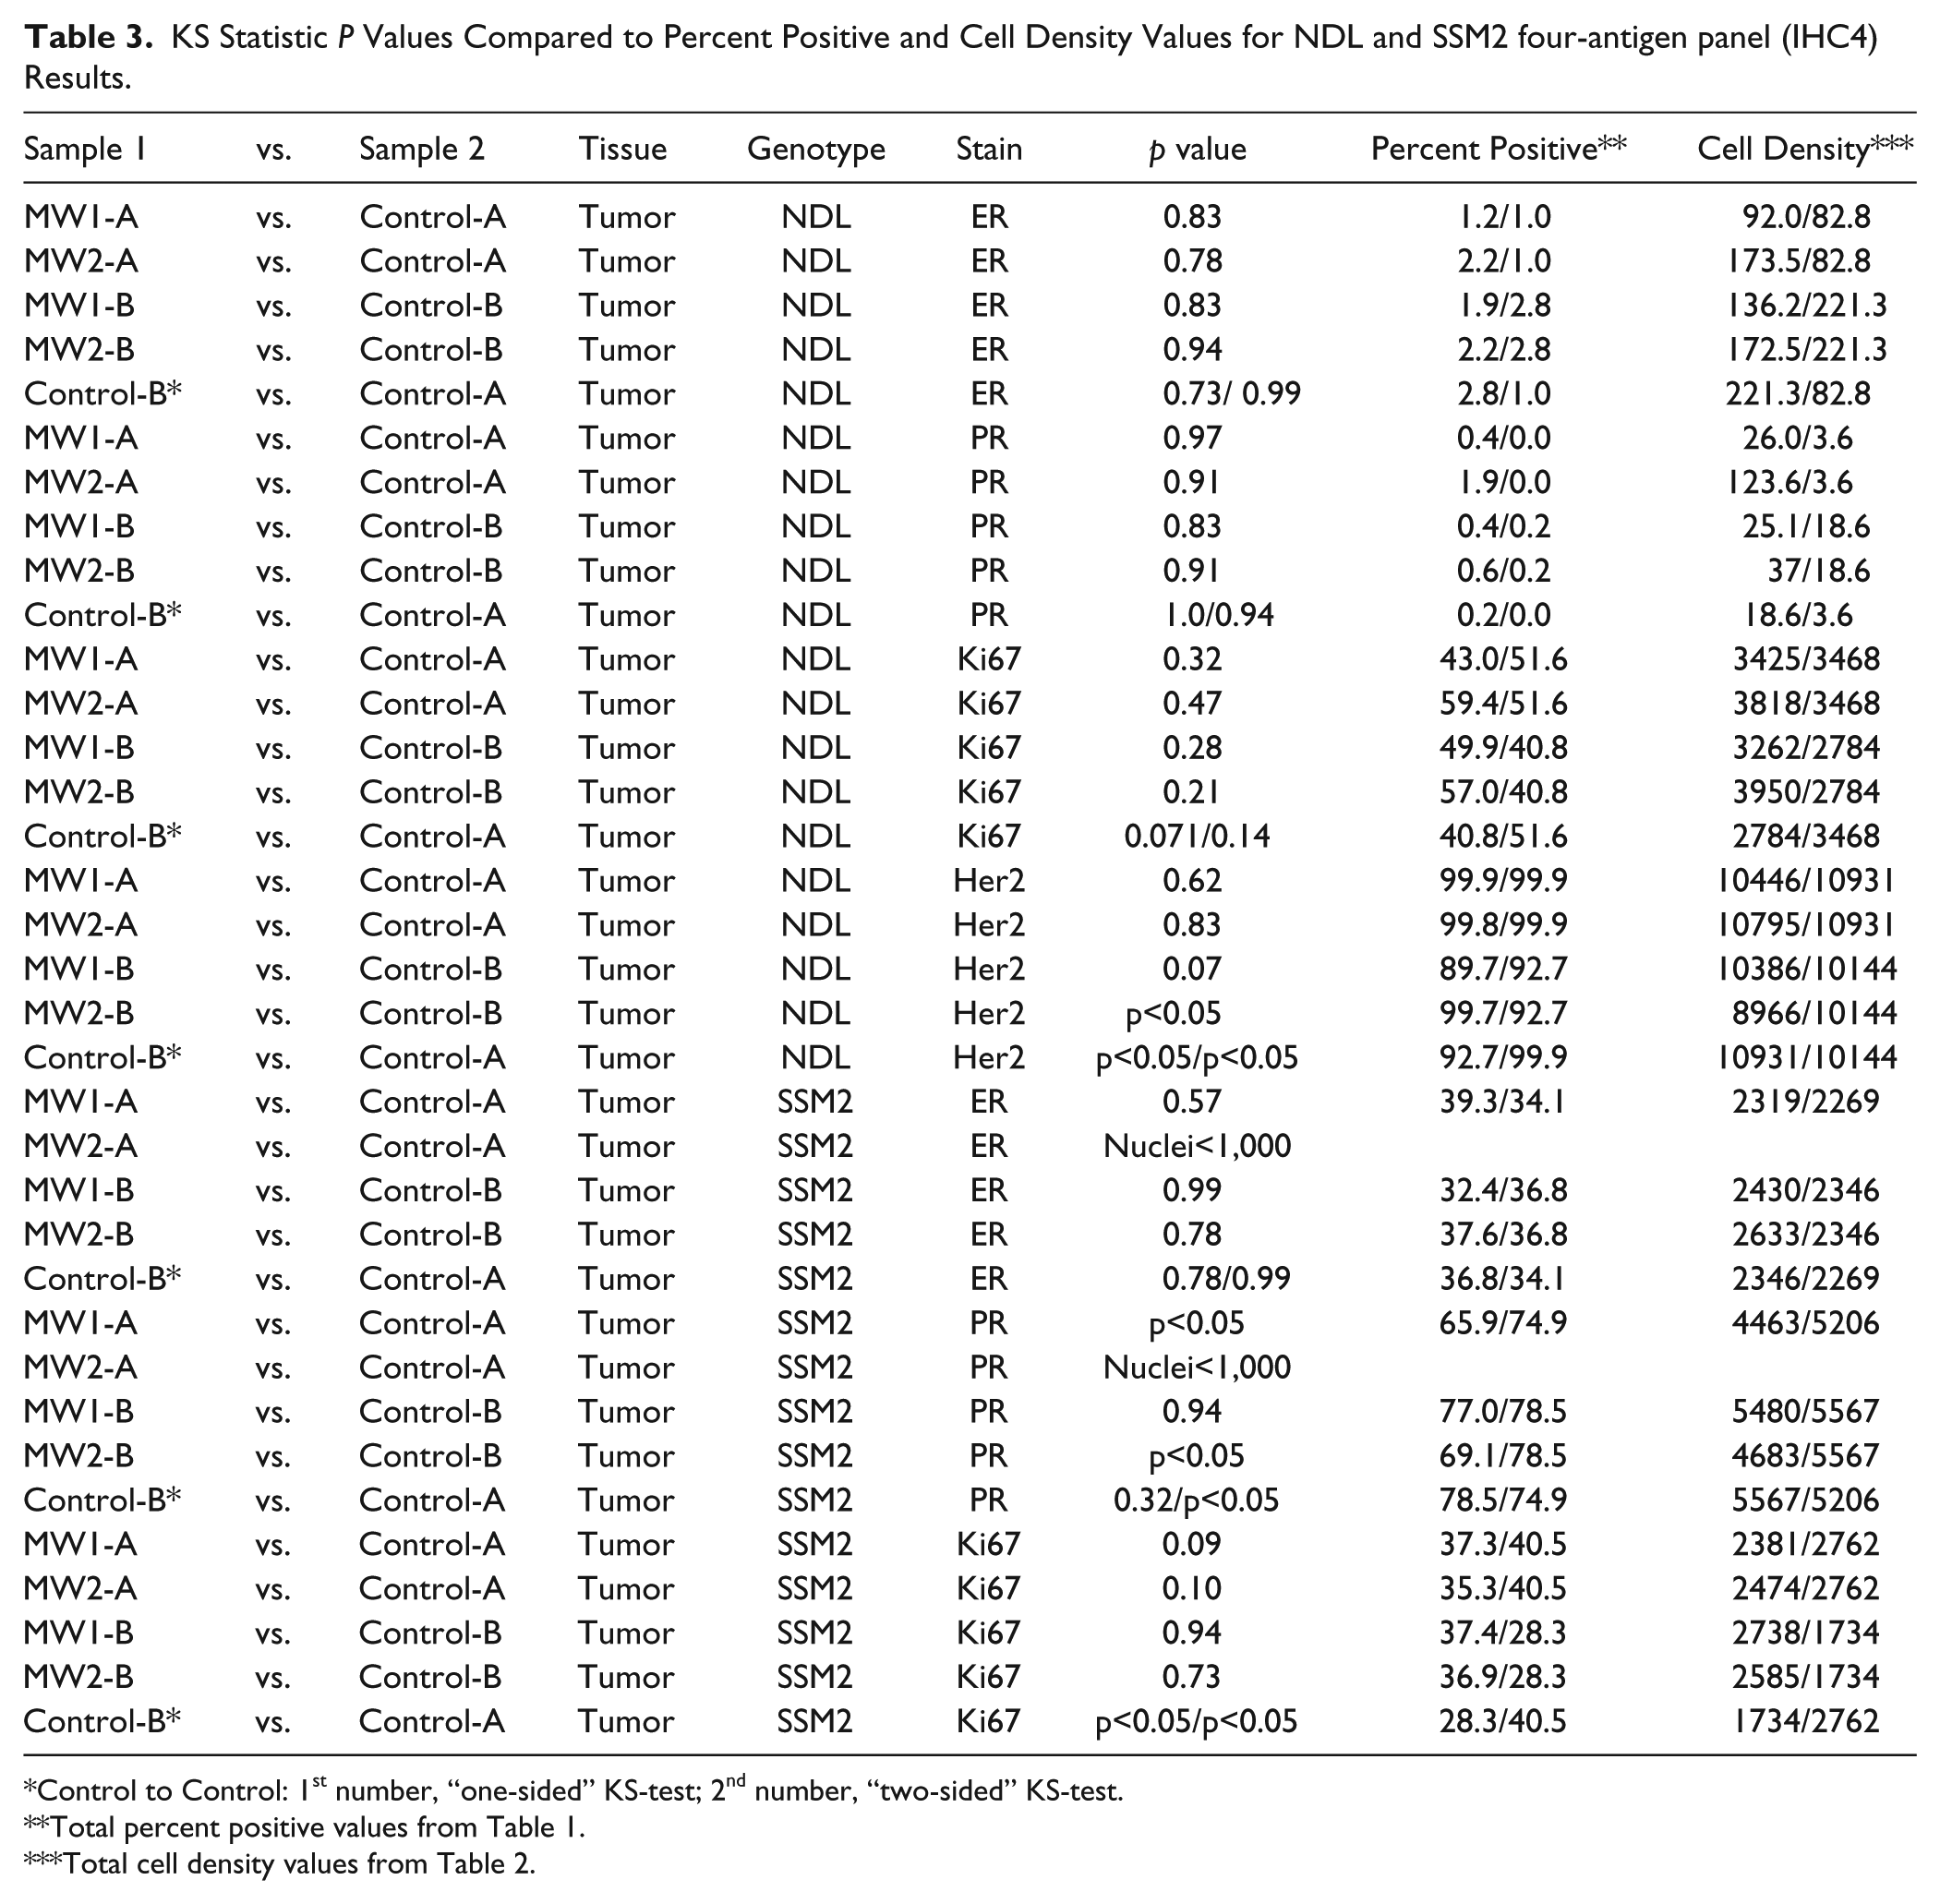
Control to Control: 1st number, “one-sided” KS-test; 2nd number, “two-sided” KS-test.
Total percent positive values from Table 1.
Total cell density values from Table 2.
KS Statistic P Values Compared to Percent Positive and Cell Density Values for NDL and SSM2 Uterine four-antigen panel (IHC4) Results.
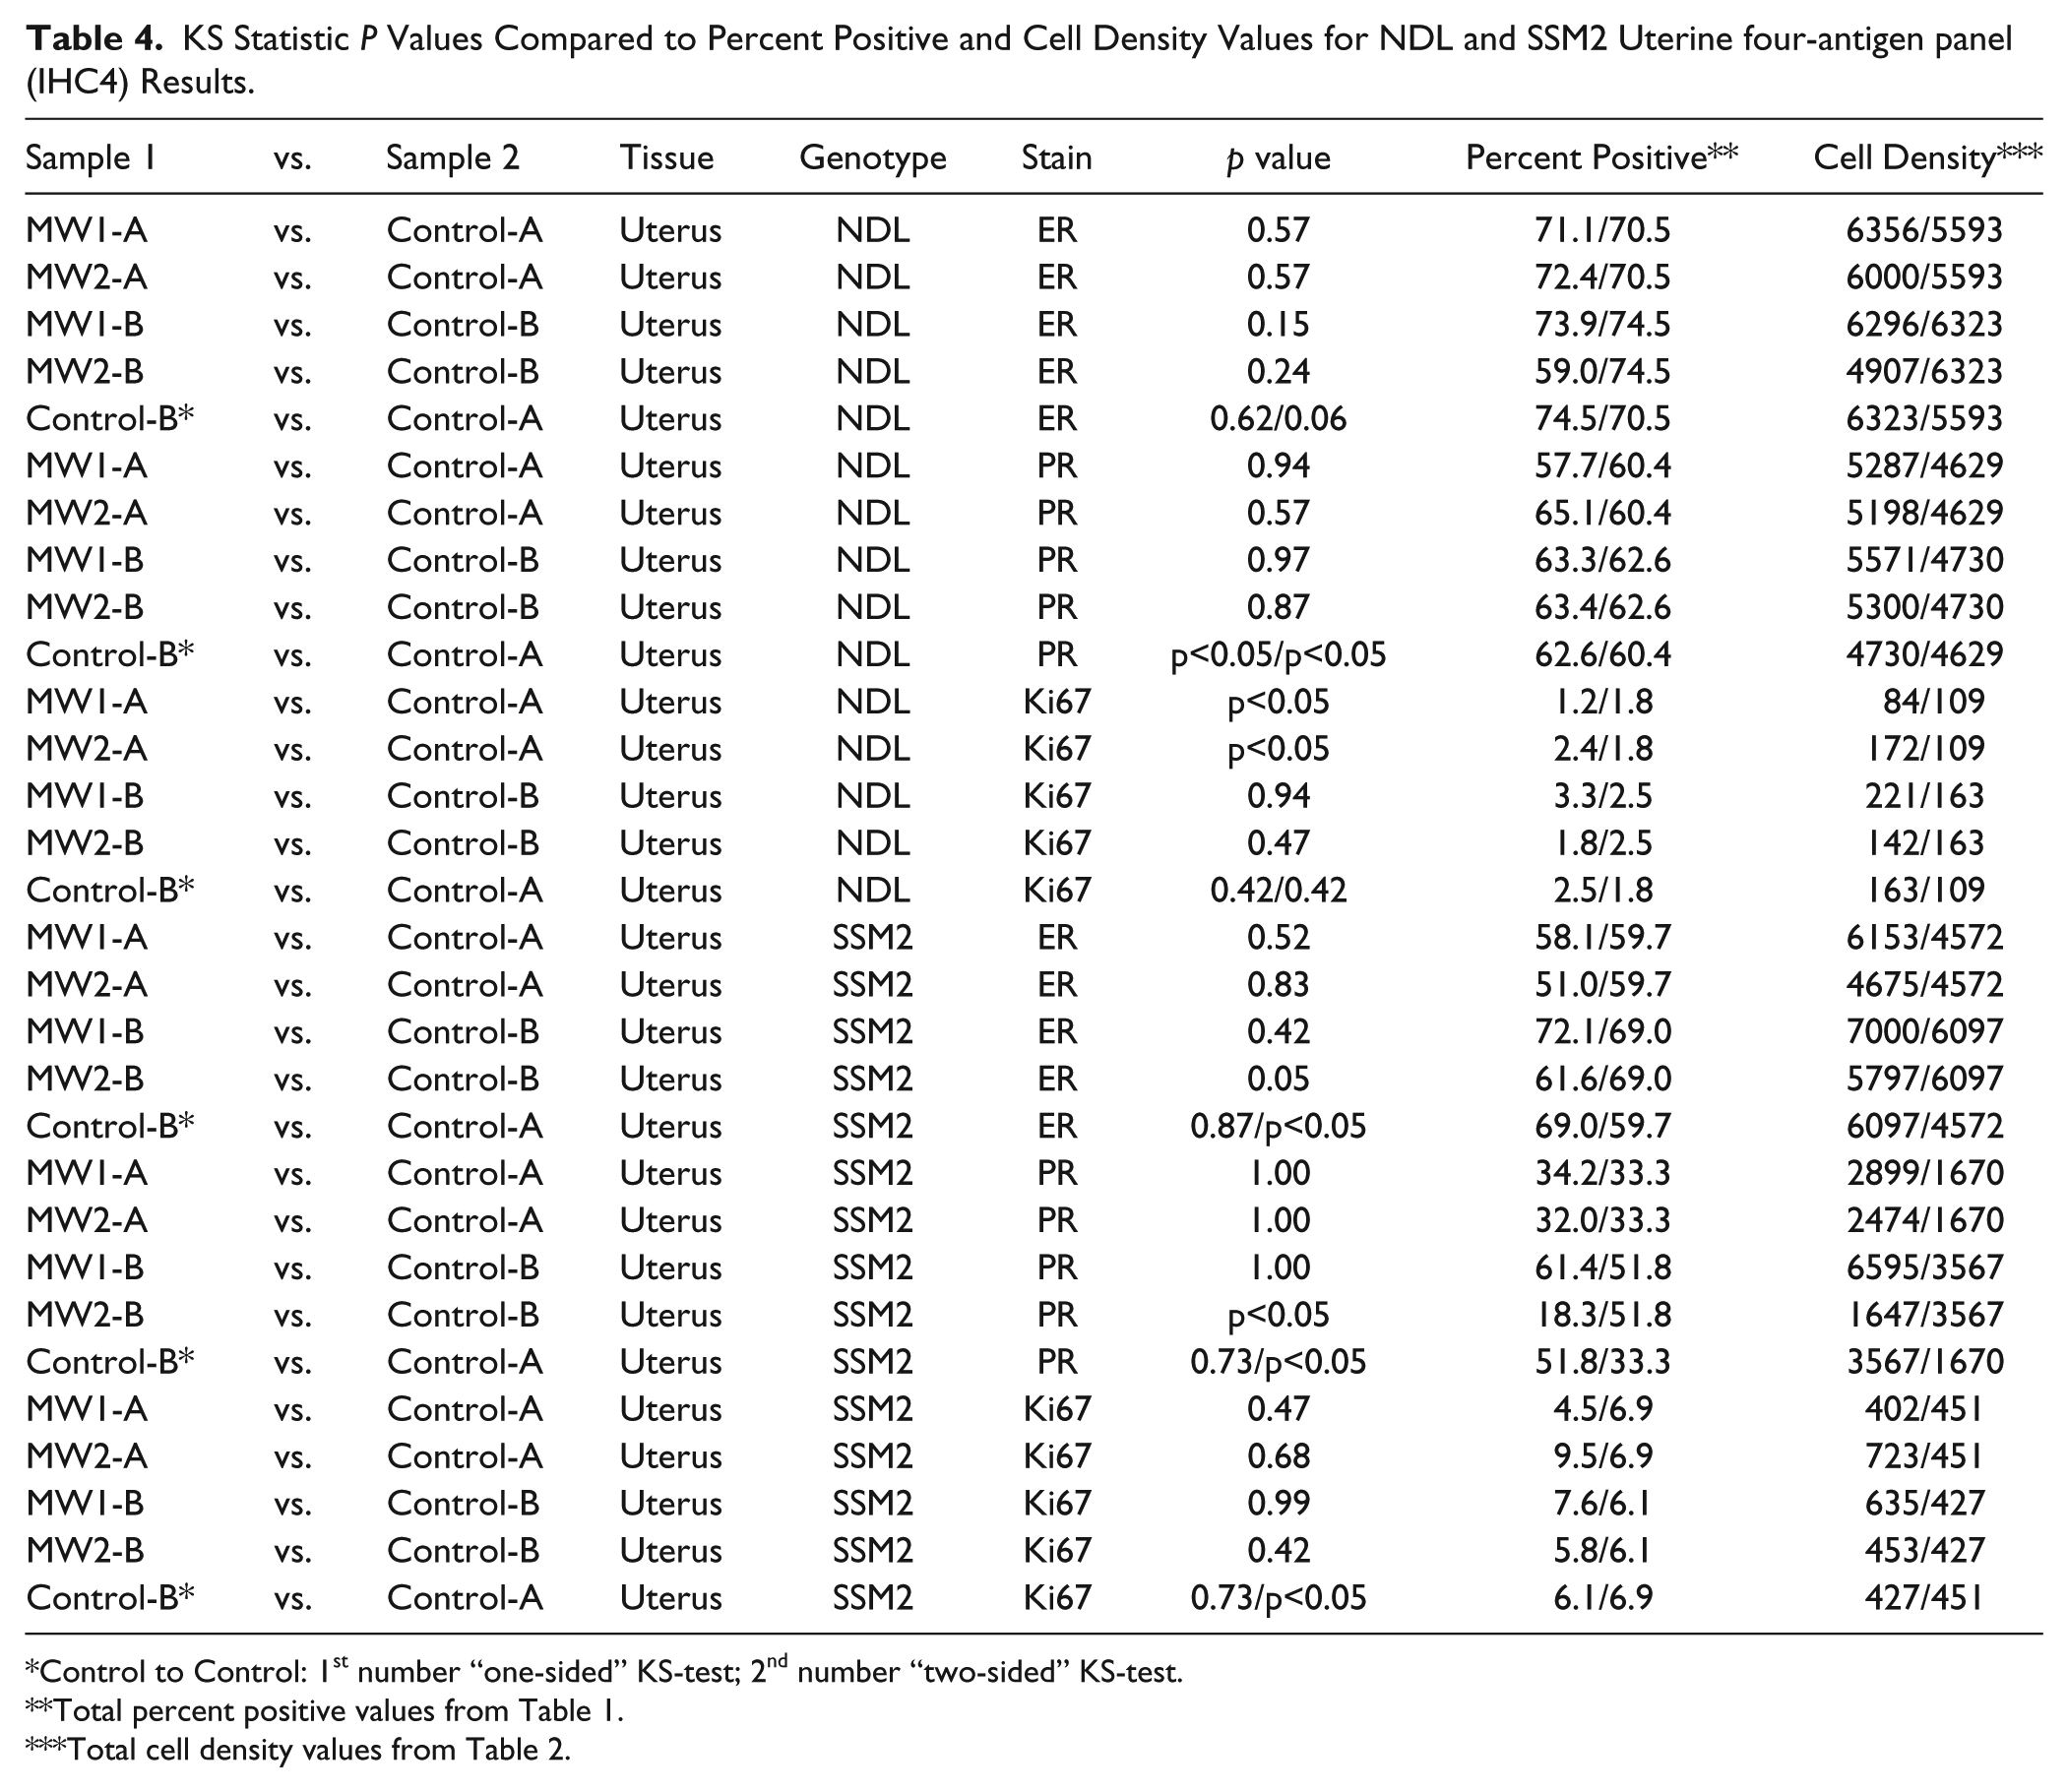
Control to Control: 1st number “one-sided” KS-test; 2nd number “two-sided” KS-test.
Total percent positive values from Table 1.
Total cell density values from Table 2.
NDL Mouse Model
For the NDL tumors, all KS comparisons were similar, except for the Her2 MW2-B to Control-B and Control-B to Control-A values (Table 3). The Her2 Control-B to Control-A p values were p<0.05 for both the alternate hypothesis and the regular two-sample KS test. The Ki67 tumor controls exhibited a higher degree of biological variance, based on p value, than any of the microwave results for that marker. The tumor ER and PR p values of the MA fixations and the control-to-control values were the best data set for similarity within the study.
The uterine results for ER/PR indicated good similarity across all MW1 or 2 comparisons with the controls (Table 4). The control-to-control p values for both markers were less than the MA samples and p<0.05 for PR. These results were not apparent in the percent positive or cell density numbers (Tables 1–2). The MW1-A and MW2-A p values for Ki67 were p<0.05 but the MW1-B and MW2-B p values were high and the control-to-control values high. The lack of similarity for the MW1-A and MW2-A to Control-A data was not expected based on the line plots (Fig. 1), percent positive data (Table 1) or the cell density values (Table 2).
SSM2 Mouse Model
The ER results for the SSM2 tumors, even with the relatively low cell numbers for the MW2-A sample, clearly indicated a good correlation between microwave results and the controls. The PR results for this tumor demonstrated a high degree of biological heterogeneity between the controls, which can also be observed in the microwave results (Table 3) and is consistent with previous results (Cardiff et al. 2013). The lack of sufficient tissue for the MW2-A sample made the results more difficult to interpret because the MW1-A (tumor A) and the MW2-B (tumor B) samples demonstrated p<0.05. The MW1-B sample had an excellent correlation to its control. The Control-B to -A correlation for the two-sample KS test was p<0.05, indicating a high degree of biological variation between the two tumors (Table 3). The Ki67 correlation of microwave-to-control results for all samples was good, but the two-sample KS test for the control-to-control comparison was p<0.05. This result indicated a high degree of biological variation between the tumors for this marker, which is consistent with the findings of a recent study (Cardiff et al. 2013).
The microwave results for all three uterine markers (ER, PR and Ki67) indicated good correlation with their respective controls except for MW2-B for ER (p<0.05) and PR (p<0.05). All the control-to-A comparisons for the two-sample KS tests resulted in p<0.05, but good correlation for the alternate hypothesis (Table 4).
Overview of KS test Results
Taken as a whole, these results demonstrate that (1) the KS test provides statistical evidence of biological variance between samples; (2) the KS test can detect small changes in antigenicity between samples fixed using different techniques; and (3) the MW protocols, with few exceptions, did not reduce antigenicity in the tissues analyzed.
Microscopic Evaluation of IHC4
The four criteria set forth in the Materials & Methods for a microscopic examination—(1) stain localization, 2) stain uniformity, 3) background staining and 4) diagnostic/prognostic value—were met by both microwave and conventional/control fixation. The three nuclear antigens (ER, PR, and Ki67) presented three different intensity patterns for their respective labeling of the tumors from the NDL and SSM2 models (Table 1, Figs. 3–4, Supplemental Table 1, Supplemental Figs. 1–42). Tumor ER labeling in the SSM2 model for all samples was almost exclusively 1+ intensity, which was in contrast with the tumor SSM2 PR labeling, which presented a dominant 3+ intensity for all samples (see Tables 1–2, Fig. 4, Supplemental Figs. 25–36). The NDL tumors presented low percentage ER/PR labeling for all samples, which was evident in the percent positive labeling data (Table 1), line plots (Fig. 1), cell density data (Table 2) and Fig. 3. The Ki-67 tumor labeling for all samples in both models presented a speckled nuclear labeling pattern with relative uniformity of all labeling intensities (Tables 1–2, Figs. 3–4, Supplemental Table 1, Supplemental Figs. 13–18 and 37–42).
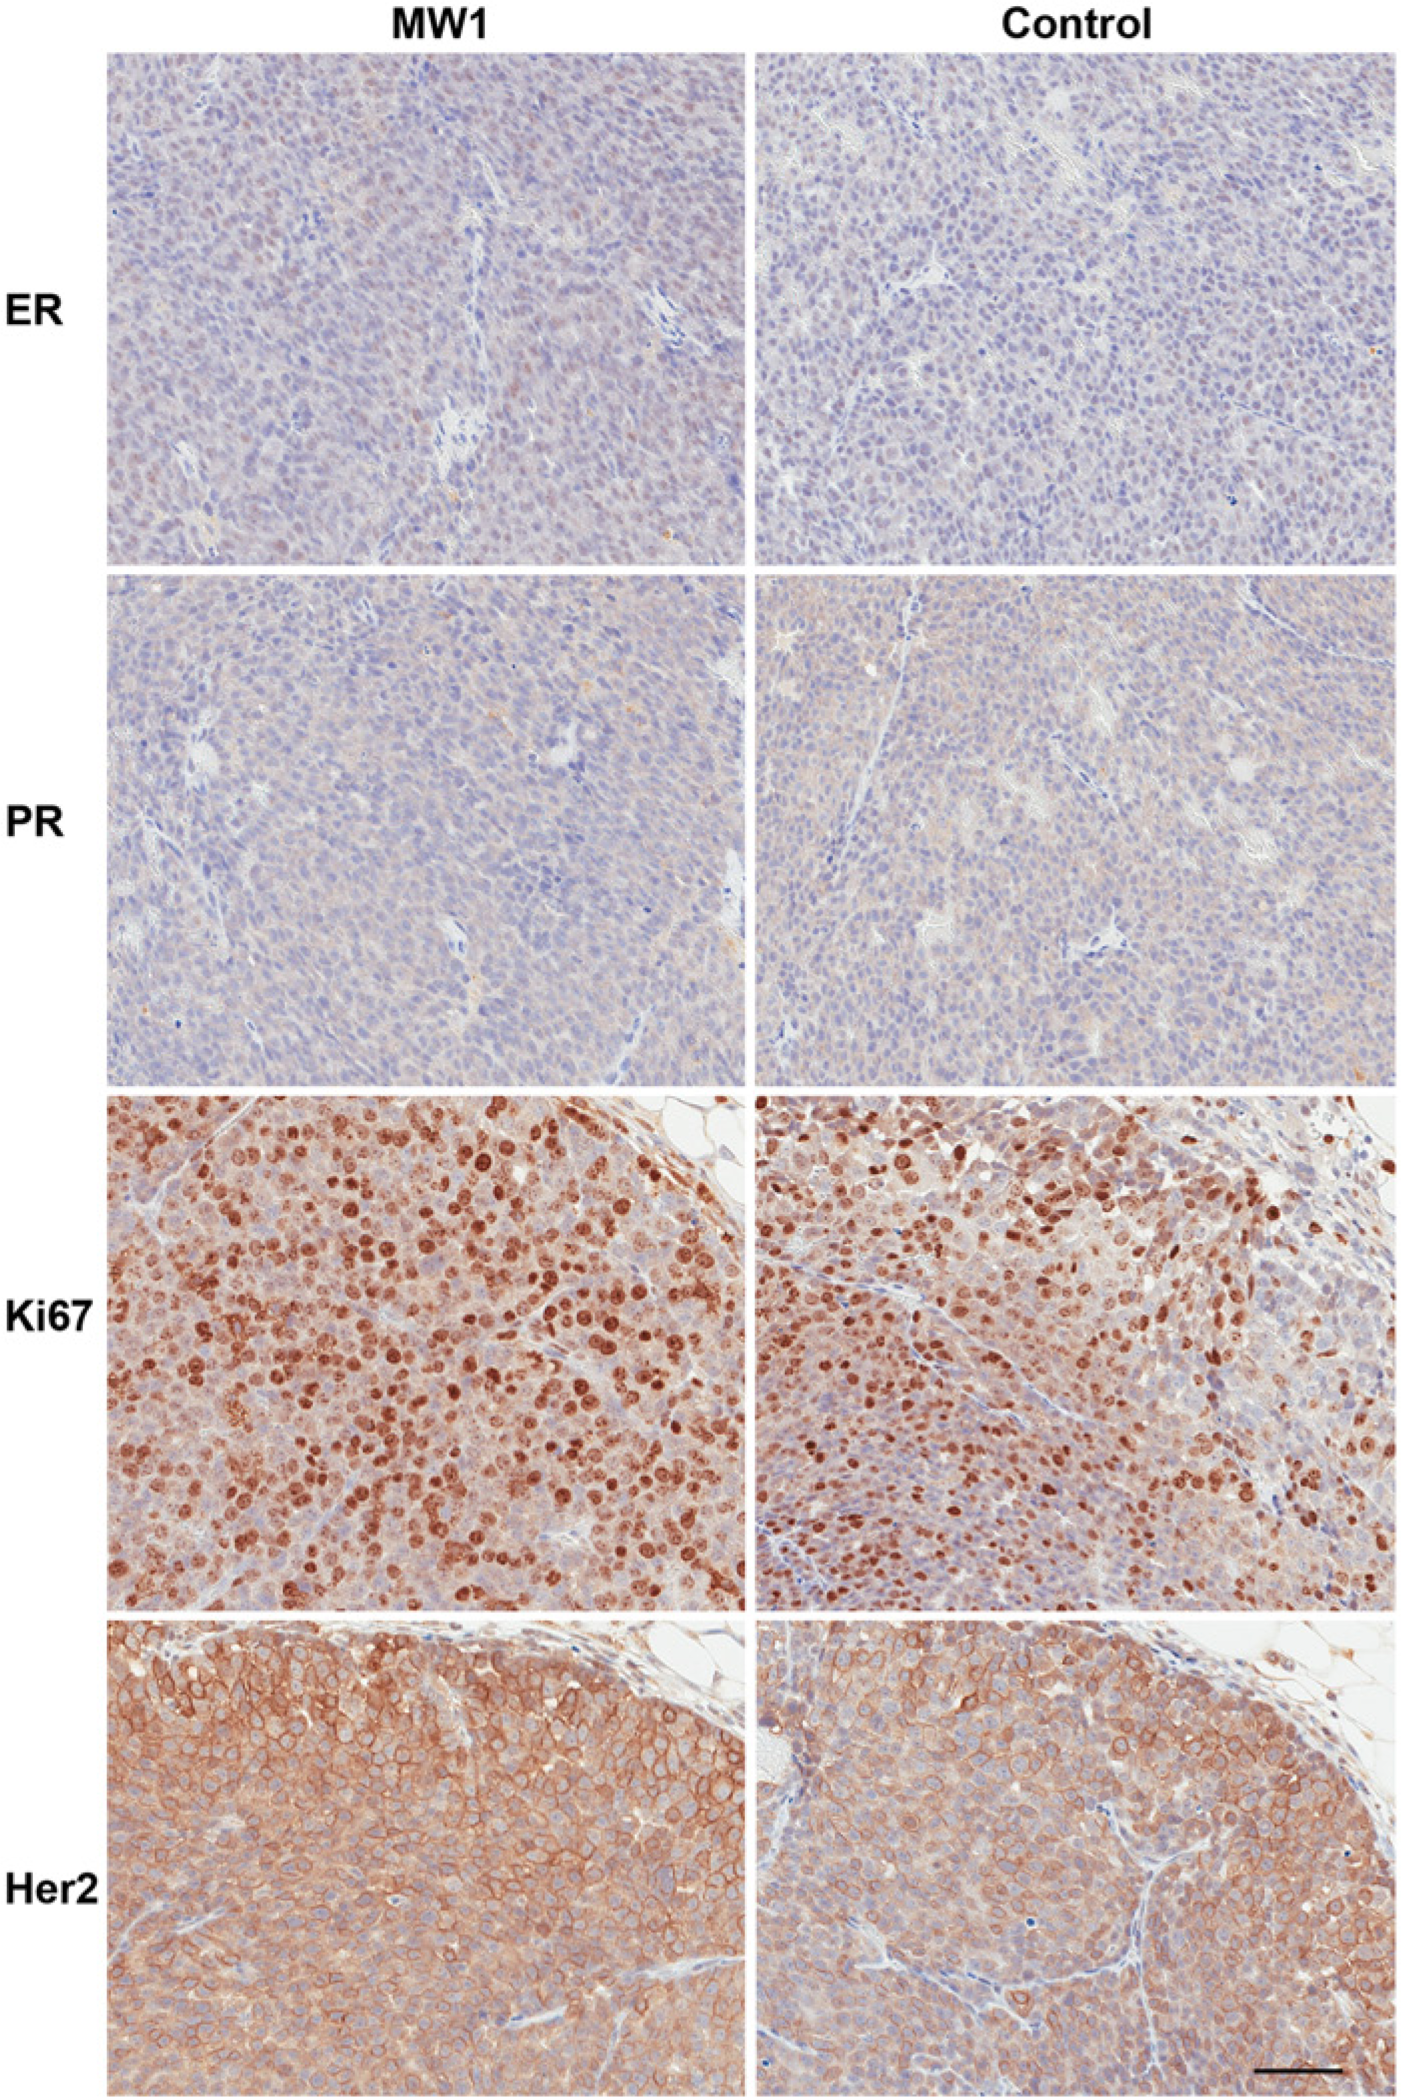
Representative photomicrographs of the tumor four-antigen panel (IHC4) immunohistochemistry from the NDL tumors. The images for microwave protocol #1 (MW1, see Materials & Methods) are MW1-A (tumor A) for estrogen receptor (ER) and progesterone receptor (PR) with their respective controls. The Ki67 and human epidermal growth factor receptor 2 (Her2) images are MW1-B (tumor B) with their respective controls. The photomicrographs are characteristic of the overall IHC4 staining patterns, intensities and background observed microscopically with this model. Scale bar, 50 µm.
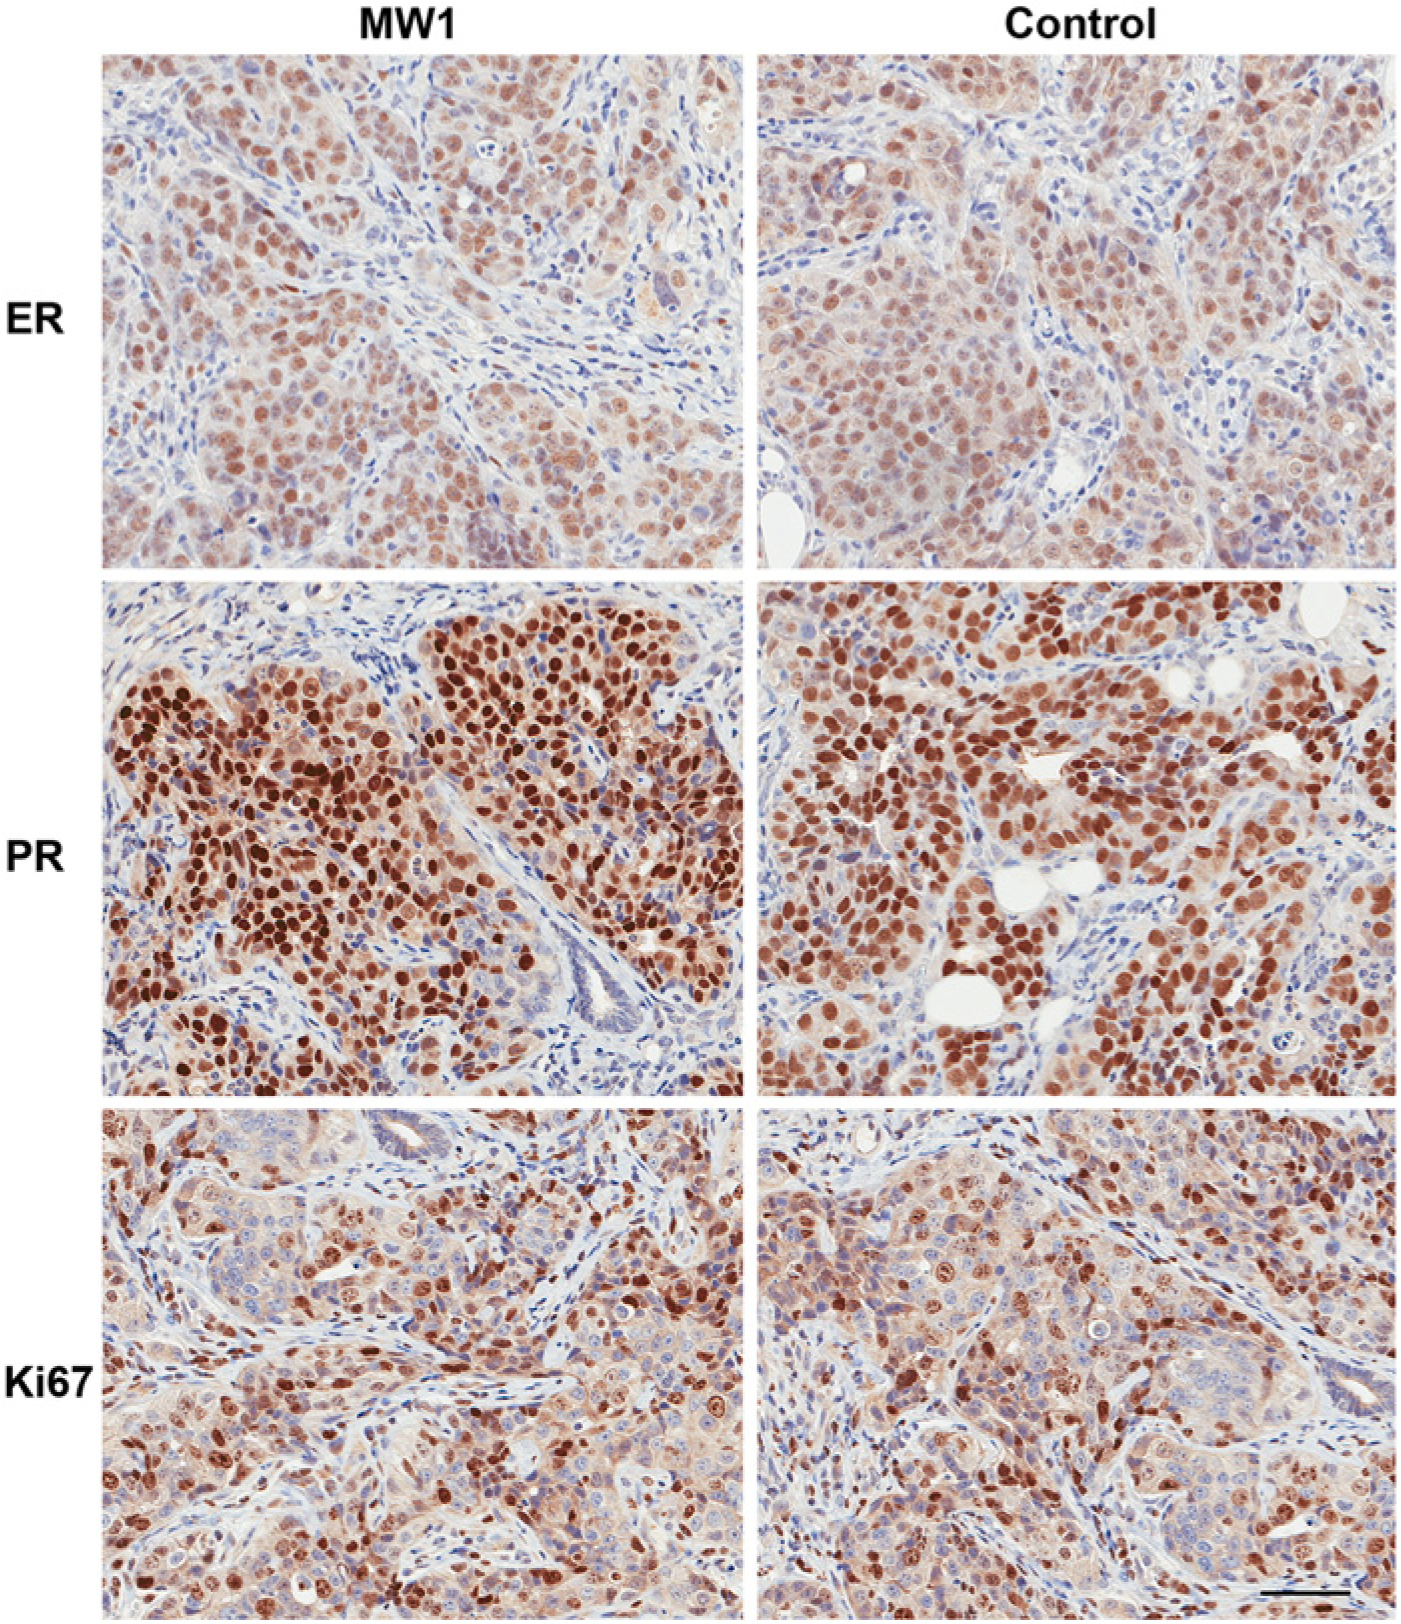
Representative photomicrographs of the tumor four-antigen panel (IHC4) immunohistochemistry from the SSM2 tumors. The images for microwave protocol #1 (MW1; see Materials & Methods) are MW1-A (tumor A) for estrogen receptor (ER) and MW1-B (tumor B) for progesterone receptor (PR) and Ki67 with their respective controls. The SSM2 model is Her2 negative. The photomicrographs are characteristic of the overall IHC4 staining patterns, intensities and background observed microscopically with this model. Scale bar, 50 µm.
The ErbB2/Her2 staining in the NDL model presented similar intensities of label for all samples (Tables 1–2, Fig. 3, Supplemental Table 1, Supplemental Figs. 19–24). From the microscopic examination we concluded that MA methods of fixation tended to have less background. This finding was based on the blue counterstain (hematoxylin) contrast to the brown (DAB) IHC4 results, which overall appeared sharper in the MA fixations than the controls.
Summary of Results
These results combined empirical observation made by experts with multiple methods of quantitative comparison. The KS test results (Tables 3–4) provided the means to statistically compare the quantitative results embodied in the line plots. The line plots provided a graphical representation of the percent positive data, and the resulting cell density data used for the plots provided a more in depth examination of the percent positive data. The microscopic evaluation of the slides provided a trained eye to agree or disagree with the quantitative results.
Discussion
The results for this study were produced using image analysis (QIA of WSI), evaluated using statistics (KS test) and corroborated using the current gold standard—a microscopic examination by a trained pathologist. This entire process was used to compare hormone receptor antigenicity between microwave-assisted formalin fixation and standard formalin fixation. The KS test results (Tables 3–4) provide the means to better understand the QIA components (Tables l–2, Figs. 1–2) used in the study. The “two-sided” hypothesis of the KS test provided the mechanism to assess biological variance between tumors and within the uterine tissues from the NDL and SSM2 tumor models. No single approach could provide a definitive determination of retained antigenicity. As an example, the NDL Her2 nonconformance was evident in the light microscopic examination (results not shown), the line plots of Tumor A and B Controls (Fig. 1) and by the >30% difference in 2+ labeling intensity and the >20% difference in the 1+ intensity values (Table 1). However, the differences between MW1-A/MW2-A and the respective control fixations for uterine results were not apparent from any of the other results (Figs. 1–2, Tables 1–4), or even by light microscopic examination.
The QIA tools described here and in earlier works (Cardiff et al. 2013) serve to remove interobserver variability and thus provide a more reproducible approach for the quantification of labeling intensities. Although QIA may not yet be fully optimized or proven to give the best possible answer, it is well suited to measure the similarities in tissue antigenicity between samples. In the small sample sets used for this study, the binned histogram data provided the data sets necessary to do the statistical analysis and line plot visualization. The known heterogeneity of the tumors in the luminal SSM2 model (Cardiff et al. 2013) made direct comparisons more difficult for PR and Ki67 and this heterogeneity appeared to be present in the uterine PR and Ki67 p values from the “two-sided” KS test. The SSM2 PR uterine results were the least reliable data set, tumor or uterine, of this study based on the differences in percent positive and cell density values, but not based on the KS test “one-sided less than” alternative hypothesis.
The NDL breast cancer model proved to be the most reliable model to compare techniques based on QIA and KS test results. As an additional advantage, it was the only model that displayed prognostically relevant ErbB2/Her2 values (Cardiff et al. 2013).
The use of a less heterogeneous and well-characterized model system (NDL) in conjunction with QIA of WSI has many advantages. It tests each aspect of a laboratory’s SOP, from tissue acquisition to final post-staining of the immune-labeled slide. Model systems, such as the NDL/SSM2 mouse models of breast cancer, which have been adapted for QIA of WSI (Cardiff et al. 2013), are valuable tools in the evaluation of new methods or changes to existing methods. A significant advantage of QIA of WSI is that a small sample size yields a large number of data points. When the points are integrated together to form the line plots, the raw data can then be used for the KS test or the similar Anderson–Darling test (Stephens 1974).
Although we believe that this report, along with previously published data (Galvez et al. 2006; Gagna et al. 2007), demonstrates the feasibility and usefulness of the microwave for fixing tissue samples, we are aware that, especially in the clinical setting, adopting new technology requires re-validation of antibodies and techniques (Hammond et al. 2010). We are also aware that, although avoiding decreased antigenicity is obviously beneficial, increased antigenicity can also be problematic, especially for tests such as Dako’s Herceptest™, where increases in antigenicity can lead to false positives. The overall results of this study indicate that the most reliable microwave protocol was the single wattage (150W: MW1-A and MW1-B) technique; the KS test validates this conclusion based on MW2 p<0.05 results.
The microscopic examination of the MA fixation indicated that, in many cases, the MA-fixed tissue had empirically better staining quality. It is possible that for a less than optimal fixation using other fixatives, the use of MA fixation might “rescue” the fixation quality and improve antigenicity. However, previous results (Galvez et al. 2006), suggest that epitope retrieval is still required when using MA fixation, so that step cannot be avoided.
In previous research, we demonstrated that an MA NBF fixation was a combination of controlled wattage and fixative temperature (Galvez et al. 2006; Gagna et al. 2007) and that electron microscopy confirmed that MA methods can reduce fixation times (Galvez et al. 2006). NBF penetrates tissues at a rate of roughly 1 mm per hour, but the fixation process is a chemical reaction that requires 24 hours to complete at room temperature (Fox et al. 1985; Goldstein et al. 2003; Yaziji et al. 2008). An elevation in temperature is clearly not the mechanism behind a reduction in MA NBF fixation times in this research (Fox et al. 1985). At this time, we can only speculate that the presence of 2.45 GHz microwave energy causes a reduction in the activation energy required for NBF crosslinking to normally take place, independent of heat.
Our results indicate that a single wattage approach is best for the IHC4 of breast cancer. Microwave fixation is far quicker than conventional methods and the results from QIA of WSI clearly indicate equal or better retention of antigenicity for the IHC4. Controlled microwave NBF fixation is a promising technology for the standardization of NBF fixation times.
Footnotes
Acknowledgements
The authors wish to acknowledge Dr. Anthony Nasr for his ongoing support over the years. The SSM2 and NDL mouse tissues were a gift from Dr. A.D. Borowsky. We thank Judith E. Walls for technical histological work, Ted Pella, Inc. for their support in this research, and Ben Schwartz for technical support. Lawrence Young passed away during the preparation of the manuscript, but made significant contributions to the study design, execution, and analysis.
Declaration of Conflicting Interests
The author(s) declared the following potential conflicts of interest with respect to the research, authorship, and/or publication of this article: Richard T. Giberson is the manager of biomedical R&D for Ted Pella Inc. (Redding, CA), the manufacturer of the microwave used in this study. Mr. Giberson is a recognized expert in the field of microwave biomedical research, has authored numerous papers, and presented numerous workshops on microwave processing techniques. Ted Pella, Inc. provided the cost of slide preparation and whole slide imaging for this study. All other authors, (JAE, LJTY, NEH, RDC) have no conflicts of interest or competing financial interests.
Funding
The author(s) disclosed receipt of the following financial support for the research, authorship, and/or publication of this article: The research described here was supported in part by Athena Breast Health Network through the Safeway Foundation and University of California Office of the President [Grants U01-CA141582, U01-CA141541] and from the National Cancer Institute’s Mouse Models of Human Cancers Consortium [U01 CA105490-01] (RDC, JAE, NEH).
References
Supplementary Material
Please find the following supplemental material available below.
For Open Access articles published under a Creative Commons License, all supplemental material carries the same license as the article it is associated with.
For non-Open Access articles published, all supplemental material carries a non-exclusive license, and permission requests for re-use of supplemental material or any part of supplemental material shall be sent directly to the copyright owner as specified in the copyright notice associated with the article.