
Abstract
Inflammation is an important pathophysiological mechanism in diabetic nephropathy (DN). Tubular epithelial cell-myofibroblast transdifferentiation (TEMT), which can be induced by many cytokines, is an important event in DN. Oncostatin M (OSM), an inflammatory cytokine, can induce TEMT in vitro. The suppressors of cytokine signaling (SOCS) proteins are negative-feedback regulators of cytokine signaling. The purpose of this study was to investigate the role of SOCS in DN. The results demonstrated that overexpression of SOCS ameliorated proteinuria, the expression of α-SMA and OSM in tubular epithelial cells, and interstitial extracellular matrix accumulation in the renal tissue of CD-1 mice. In addition, our previous studies indicated that OSM induced TEMT by activating the JAK/STAT pathway, which could be inhibited by SOCS. These results indicate that overexpression of SOCS has a therapeutic effect in DN.
Introduction
Diabetic nephropathy (DN) has become the most frequent cause of end-stage renal disease, which is characterized by renal fibrosis. The morphological features of renal fibrosis are tubulointerstitial fibrosis (TIF) and glomerular sclerosis. Studies have indicated that TIF has a greater influence on renal function than glomerular sclerosis (Okoń 2003; Meyer 2003). The appearance of myofibroblasts is thought to play a key role in the progression of TIF. Myofibroblasts, which express the mesenchymal marker α-smooth muscle actin (α-SMA), are the main source of extracellular matrix (ECM) proteins in TIF. Although there has been debate regarding the role of epithelial-mesenchymal transition (EMT) in this process (Iwano et al. 2002; Humphreys et al. 2010), an increasing number of studies has focused on the role of tubular epithelial cell transdifferentiation in TIF.
The mechanism regulating renal tubular epithelial-mesenchymal transition (TEMT) remains largely unknown. Recent studies have shown that inflammation is a key pathophysiological mechanism in DN, and that kidney inflammation is crucial in promoting the development and progression of DN (Galkina and Ley 2003; Lim and Tesch 2012; Tuttle 2005). A number of inflammatory cytokines are believed to play an important role in the progression of DN (Dalla Vestra et al. 2005; Mensah-Brown et al. 2005; Navarro et al. 2007; Navarro et al. 2006; Rubio-Guerra et al. 2009; Wang et al. 2008). Furthermore, previous studies have shown that many inflammatory cytokines that play a pivotal role in DN, such as TGF-β1, TNF-α and interleukin (IL)-1β, can also induce TEMT (Doerner and Zuraw 2009; Fan et al. 2001; Kamitani et al. 2011). Oncostatin M (OSM) is a multifunctional member of the IL-6 cytokine family and is produced by activated T cells, monocytes, macrophages and neutrophils. There are two contrary views about the role of OSM in fibrosis. Given that renal proximal tubule cells transform into myofibroblasts in response to OSM (Nightingale et al. 2004; Pollack et al. 2007), we speculated that OSM may participate in diabetic kidney injury and contribute to TIF.
Cytokines regulate many biological processes through the activation of intracellular signaling pathways. Most cytokines relay biological information to target cells by activating the Janus kinase (JAK)/signal transducers and activators of transcription (STAT) pathway. This pathway is negatively regulated by various mechanisms including the suppressor of cytokine signaling (SOCS) proteins. SOCS family members (CIS; SOCS1-7), particularly SOCS1 and SOCS3, control the magnitude and duration of JAK/STAT signaling. Studies have shown that overexpression of SOCS in the kidney can relieve the progression of DN by inhibiting the JAK/STAT pathway, which is one of the pivotal signaling pathways in DN (Berthier et al. 2009; Ortiz-Muñoz et al. 2010; Shi et al. 2010). Moreover, our previous studies have shown that SOCS can also suppress TEMT that is induced by OSM (Liu et al. 2011).
In the present study, we investigated the effects of SOCS on OSM expression, ECM deposition and the phenotypic change of tubular epithelial cells in diabetic mice.
Materials and Methods
Reagents
Streptozotocin (STZ) and rabbit anti-FLAG antibody were purchased from Sigma-Aldrich (St. Louis, MO). The detection system for immunohistological staining was purchased from Zhongshan Golden Bridge Biotechnology Co. (Beijing, China). Rabbit anti-SOCS1 and anti-SOCS3 antibodies were purchased from Abcam (Cambridge, UK). Rabbit anti-phosphorylated (p)-STAT1, anti-p-STAT3 and anti-OSM antibodies were purchased from Santa Cruz Biotechnology (Dallas, TX). Rabbit anti-CK18, anti-α–SMA and anti-β–actin were from Beijing Biosynthesis Biotechnology Co (Beijing, China). TransIT-EE Hydrodynamic Delivery Solution was purchased from Mirus International Inc. (Andover, MA). CD-1 mice were purchased from Beijing Vital River Laboratory Animal Technology (Beijing, China). The ELISA kit for OSM was purchased from R&D Systems (Minneapolis, MN). RNA Prep Pure Micro Kit and TIANScript RT Kit were purchased from Tiangen Biotechnology Co. (Beijing, China). Premix Ex TaqTM Kit was purchased from Takara Co (Mie, Japan).
Experimental Animals
Male CD-1 mice at 5 weeks of age and weighing 20-25 g were housed in a specific pathogen-free animal facility with free access to food and water. The experimental protocols were approved by the Institutional Animal Care and Use Committee of Hebei Medical University.
The animals were randomly divided into five groups: normal control mice (N); diabetic mice (DM); diabetic mice that received the empty vector pEF-FLAG-I (DM+V); and diabetic mice that received pEF-FLAG-I/mSOCS1 plasmid (DM+S1) and pEF-FLAG-I/mSOCS3 plasmid (DM+S3). Diabetes was induced in CD-1 mice by intraperitoneal injection of STZ (150 mg/kg in 0.1 M citrate buffer, pH 4.5). Mice with glycemic concentrations ≥ 16.7 mmol/L for three consecutive days were included in the studies. Plasmid DNA and empty vector were administered to the mice by rapid intravenous injection of a large volume of TransIT-EE Hydrodynamic Delivery Solution. The diabetic mice received an injection of the plasmid at 1 mg/kg at week 8 and then every 7 days thereafter. At weeks 4, 8 and 12 after STZ injection, six mice from each group were weighed and housed individually for 24 hr in metabolic cages for collecting urine to measure 24-hr urinary proteins. After anesthesia by sodium pentobarbital (40 mg/kg), the renal cortex was removed, cleaned, washed and immediately preserved in neutral-buffered formalin for histopathological examination or frozen in liquid nitrogen for extraction of protein and mRNA.
Histopathological Examination
Masson staining was used for calculating the area of renal interstitial fibrosis, determined as the percentage of the blue stain to the whole area.
Immunohistochemistry Analysis
For immunohistochemistry, the cortex tissue samples were resected from the kidney and fixed immediately in 4% paraformaldehyde. Standard procedures were used to dehydrate the tissue and render it transparent. Samples were embedded and sectioned into 4 µm-thick sections that were then deparaffinized with xylene and rehydrated in graded ethanol. Endogenous horseradish peroxidase activity was blocked by pretreatment with 3% H2O2 for 10 min at room temperature. Antigen recovery was performed by microwave. To block nonspecific binding, the sections were incubated at 37C for 30 min in PBS containing 10% goat serum. Finally, the sections were incubated, respectively, with primary antibodies against CK18, α-SMA, and OSM overnight at 4C. The following day, the sections were washed three times with PBS for 5 min and incubated with a biotinylated secondary antibody for 30 min at 37C. After incubation with horseradish peroxidase-conjugated streptavidin for 30 min at 37C, the sections were stained with 3,3-diaminobenzidine (DAB). The negative controls were prepared by the replacing the primary antibody with PBS.
Laser Capture Microdissection (LCM)
Frozen renal cortex tissue blocks were cut into 10-µm sections, mounted on the LCM slide and kept at -80C until use. When needed, sections were thawed and immediately fixed in ice-cold 70% ethanol for 1 min. Next, the sections were stained briefly with toluidine blue, immediately rinsed, and then dehydrated in graded ethanol. Dehydrated slides were allowed to air dry for 3-5 min. Tubule epithelial cells in the sections were captured by LCM, collected in Eppendorf tubes and stored at -80C until protein and mRNA retrieval.
Western Blot Analysis
For protein retrieval, tubules that had been stored at -80C were thawed briefly and treated with ice-cold lysis buffer (7 mol/L urea, 2 mol/L thiourea, 2% NP-40, 1% Triton X-100, 100 mmol/L dithiothreitol (DTT), 5 mmol/L phenylmethylsulfonyl fluoride (PMSF), 4% CHAPS, 0.5 mmol/L EDTA, 40 mmol/L Tris, 2% pharmalyte). Subsequently, the homogenate was centrifuged at 12,000 ×g for 30 min at 4C and the supernatants were collected. The protein concentration was measured using the method of Bradford. The protein extracts (30 µg of protein/lane) were separated by SDS-PAGE and then transferred onto PVDF membranes. After being blocked with 5% fat-free dry milk, the membranes were incubated overnight at 4C with primary antibodies for FLAG, CK18, α-SMA, SOCS1, SOCS3, p-STAT1, p-STAT3 and β-actin, respectively. Subsequently, the membranes were washed three times with Tris-buffered saline with Tween-20 (TBST), incubated with goat anti-rabbit IgG horseradish peroxidase-conjugated secondary antibody for 60 min at 37C, and then washed three times with TBST. After chemiluminescence, the bands were detected by exposing the blots to X-ray film for an appropriate time period. Band intensity was measured using LabWorks 4.5 software (UVP, Upland, CA) and normalized relative to the β-actin intensity.
Real-Time PCR Analysis
The mRNA was retrieved using the RNA Prep Pure Micro Kit according to the manufacturer’s descriptions and then reverse-transcribed into cDNA using TIANScript RT Kit. Real-Time PCR amplification was performed with an ABI7500 real-time PCR system with the following conditions: 95C for 30 sec and 40 cycles of amplification (95C for 5 sec, 60C for 30 sec). The nucleotide sequences of the primers are as follows: CK18, 5’-GTTCAGCACGGCCTCATTAC-3’ and 5’-CTGCACCTGGAGTCAGAGC-3’; α-SMA, 5’-GCCTTGGTGTGTGACAATGG-3’ and 5’-AAAACAGCCCTGGGAGCAT-3’; and 18S rRNA, 5’-ACACGGACAGGATTGACAGA-3’ and 5’-GGACATCTAAGGGCATCACAG-3’. The ΔΔCT method was used to calculate the relative gene expression level. The gene copy number of each sample was expressed as the CT value, and 18S rRNA was used as the internal control.
Enzyme-linked Immunosorbent Assay
Homogenates of the renal cortex were centrifuged at 1000 ×g for 10 min at 4C and the supernatants collected. The level of OSM protein was quantified using a competitive sandwich ELISA kit, according to the manufacturer’s descriptions.
Statistical Analyses
The data are expressed as the mean ± SD and were analyzed using one-way ANOVA with SNK test. A correlation analysis between the OSM expression and ECM deposition was performed using the single Spearman coefficient. Statistical significance was defined as p<0.05.
Results
In Vitro Gene Transfer of SOCS
We injected the respective plasmid at week 8 and then every 7 days thereafter. To test the efficiency of the gene transfer in vivo, exogenous FLAG protein expression in the renal cortex was determined at week 12. FLAG protein expression was evident in diabetic mice treated with pEF-FLAG-I, pEF-FLAG-I/mSOCS1 or with pEF-FLAG-I/mSOCS3. No detectable FLAG protein was found in control and diabetic mice. Moreover, western blot analyses confirmed that the expression of SOCS1 and SOCS3 increased significantly in mice with diabetes after gene transfer (Fig. 1). These results confirmed a sustained, high level of expression of the SOCS protein in the kidneys after intravenous injection of the expression plasmid.
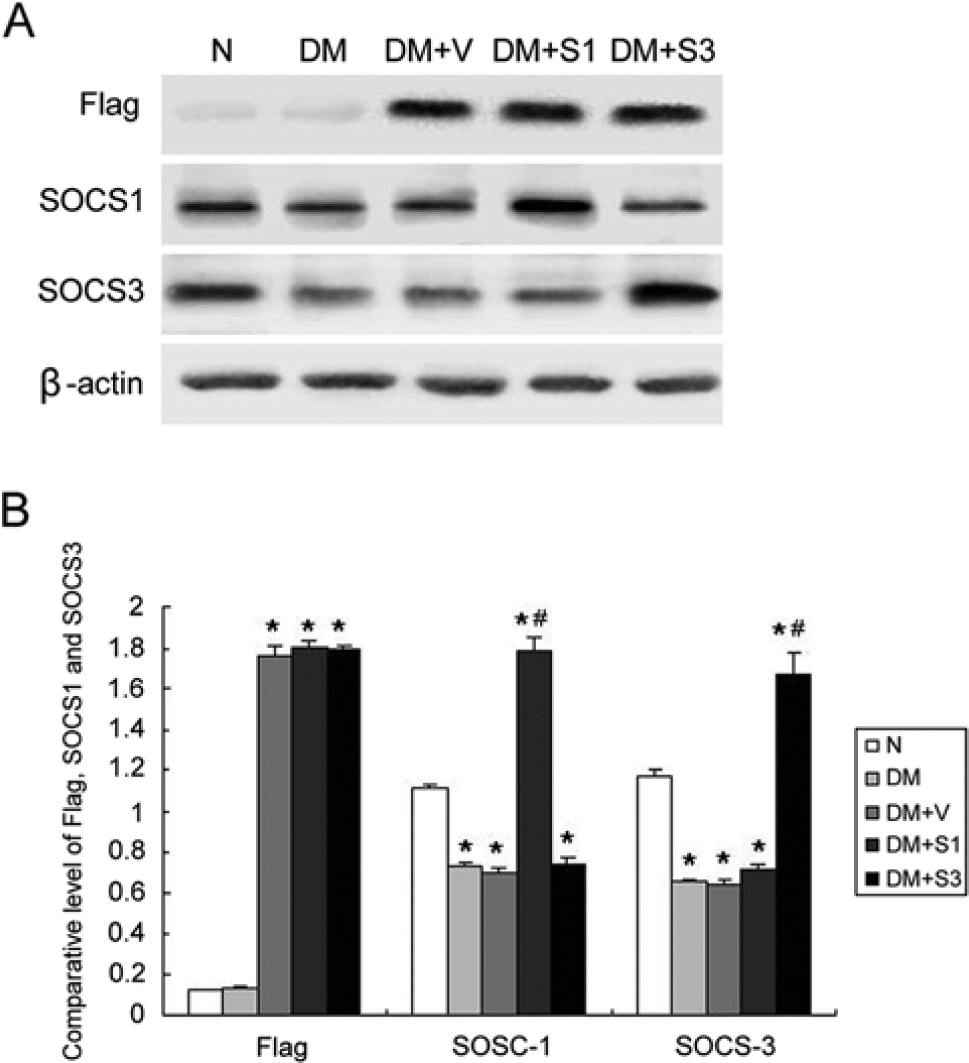
(A) SOCS and FLAG protein expression in the renal cortex was examined by western blot. No FLAG protein was found in the renal cortex in mice without plasmid injection, and FLAG protein expression was evident in mice treated with pEF-FLAG-I (DM+V), pEF-FLAG-I/mSOCS1 (DM+S1) or pEF-FLAG-I/mSOCS3 (DM+S3). SOCS1 and SOCS3 expression decreased in mice with diabetes, and it increased significantly after the mice were transfected with pEF-FLAG-I/mSOCS1 or pEF-FLAG-I/mSOCS3. β-actin was used as an internal control. (B) Western blotting results represented as a bar graph (n=6 mice for each bar). The values are expressed as the mean ± SD. *p<0.05 vs. control mice (N); #p<0.05 vs. mice with diabetes (DM).
Changes in Basic Parameters
Urinary protein (Upro) was detected at weeks 4, 8 and 12 after STZ injection. The amount of Upro in the mice with diabetes significantly increased from week 8 after STZ injection (Fig. 2A). Thus, in subsequent tests, we injected the plasmid at week 8 and collected the 24-hour urine at week 12. Overexpression of SOCS1 or SOCS3 significantly reduced Upro levels in diabetic mice (Fig. 2B). In addition, SOCS1 or SOCS3 overexpression improved the serum creatinine (Scr) (Fig. 2C) and kidney/body weight ratio (Fig. 2D) in diabetic mice.
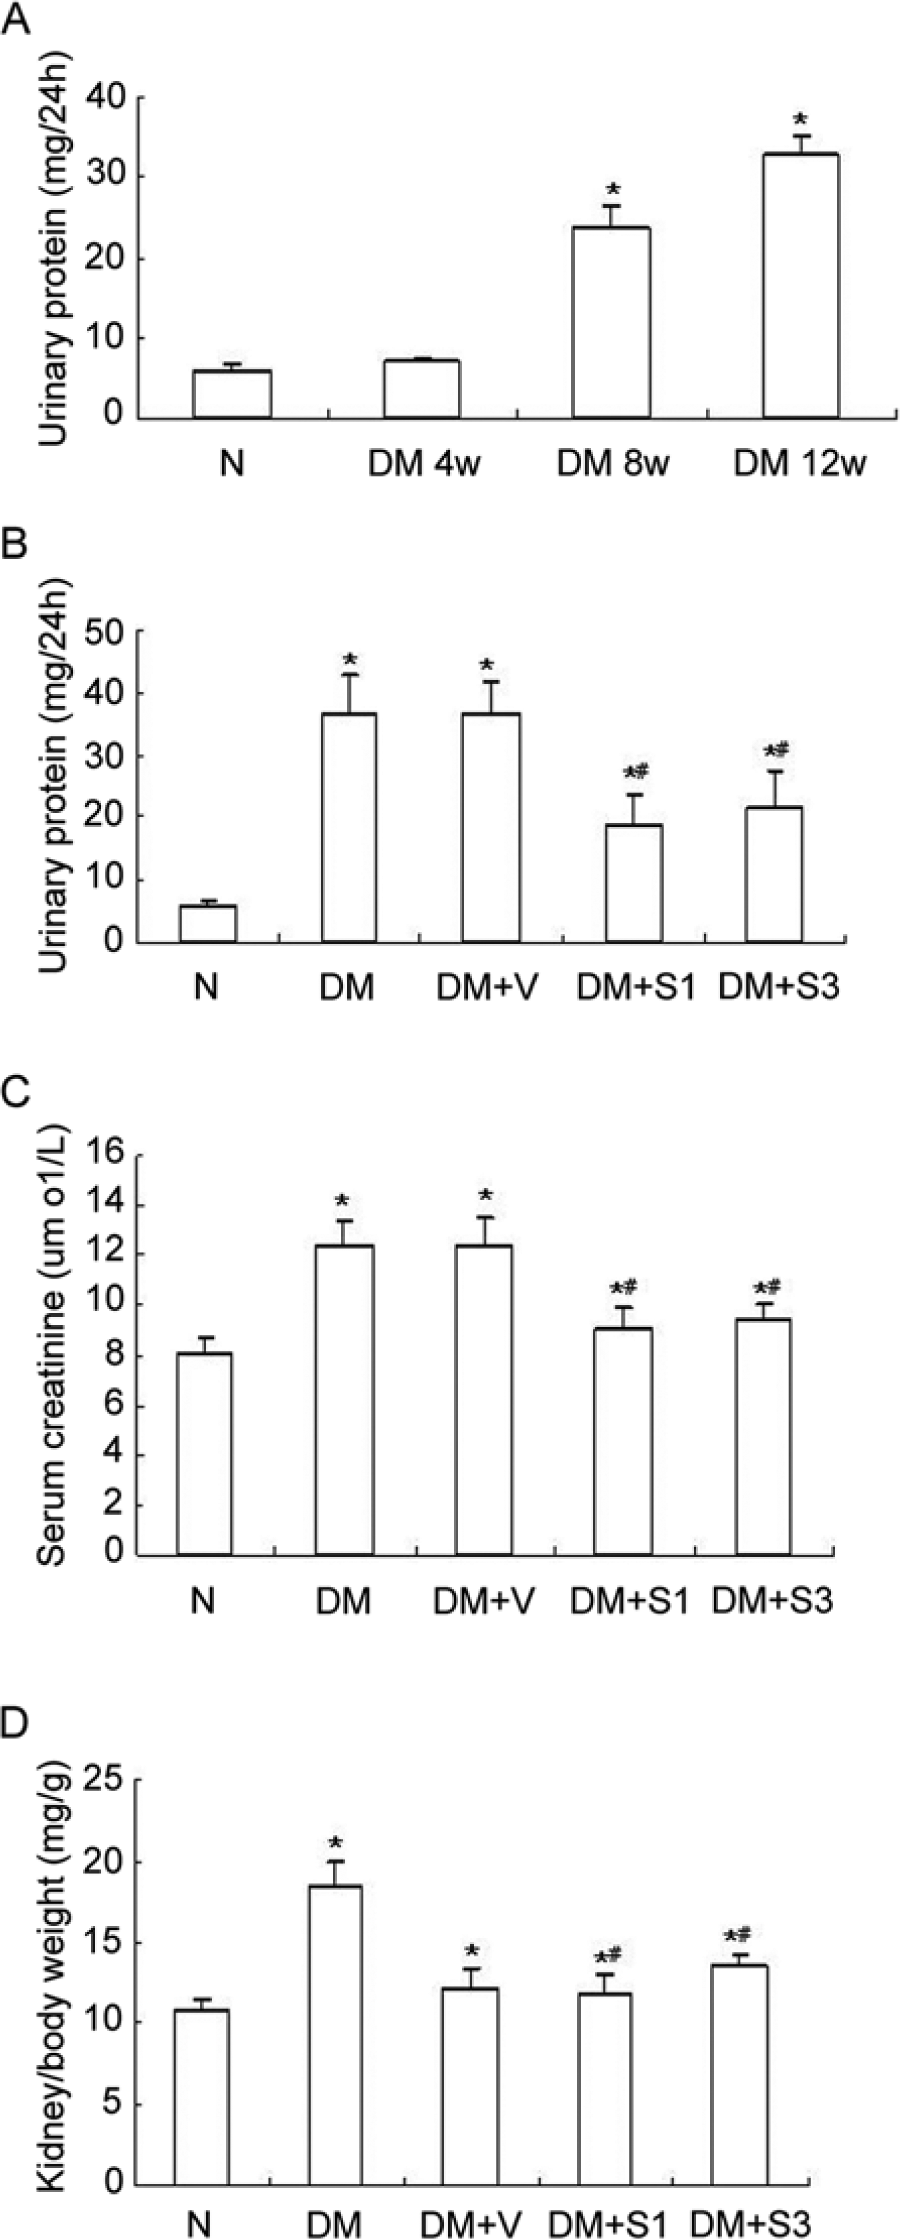
Comparison of urinary protein (Upro), serum creatinine (Scr) and body weight among treated mice. (A) 24-hour (24-h) Upro was measured at weeks 4, 8 and 12 in diabetic mice. The effects of SOCS1 (DM+S1) or SOCS3 (DM+S3) overexpression on 24-h Upro (B), Scr (C) and kidney/body weight ratio (D) at week 12 in diabetic mice after injection of plasmid at week 8. The values are expressed as the mean ± SD. *p<0.05 vs. control mice (N), #p<0.05 vs. mice with diabetes (DM). DM+V represents pEF-FLAG-I vector control.
SOCS Overexpression Inhibits STAT1 and STAT3 Activation in Diabetic Kidneys
To investigate the modulation of the JAK/STAT signaling pathway by SOCS, mice with diabetes were transfected with the pEF-FLAG-I/mSOCS1 or pEF-FLAG-I/mSOCS3 plasmid or an empty vector (pEF-FLAG-I). STAT1 and STAT3 phosphorylation levels increased in mice with diabetes and mice treated with the empty vector as compared with control mice. Overexpression of SOCS1 and SOCS3 significantly reduced the phosphorylation levels of STAT1 and STAT3 (Fig. 3).
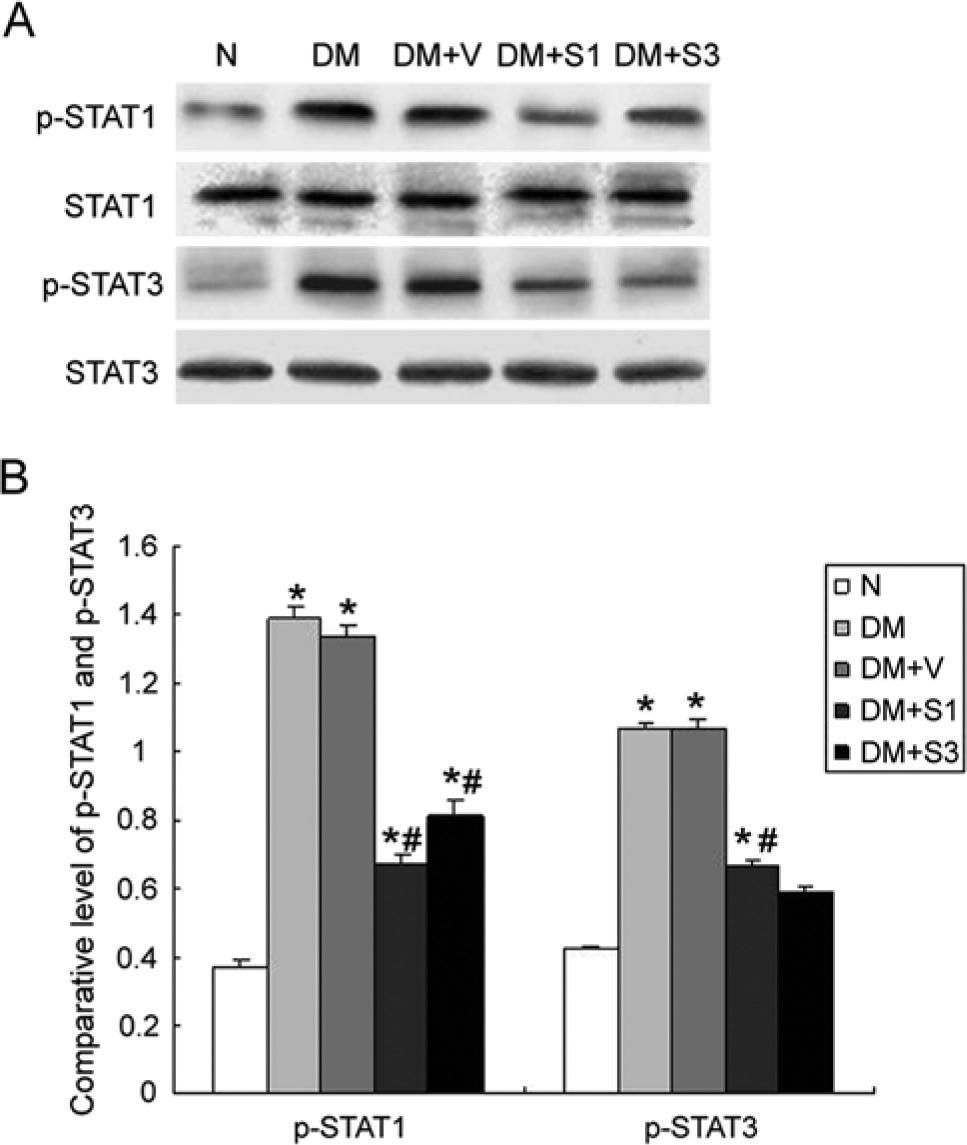
Expression of phosphorylated (p)-STAT1 and p-STAT3 protein in the renal cortex examined by western blotting. (A) Overexpression of SOCS1 (DM+S1) or SOCS3 (DM+S3) significantly reduced tyrosine phosphorylation of p-STAT1 and p-STAT3. (B) Western blotting results represented as a bar graph. The values are expressed as the mean ± SD. *p<0.05 vs. control mice (N), #p<0.05 vs. mice with diabetes (DM). DM+V represents pEF-FLAG-I vector control.
SOCS Overexpression Inhibits the Expression of α-SMA in the Proximal Tubule Epithelial Cells
Cytokeratins are epithelial cell marker proteins, and cytokeratin 18 (CK 18) is highly expressed in proximal tubular epithelial cells. To verify the phenotypic change of the proximal tubular epithelial cell, we detected the expression of CK18 and α-SMA (a myofibroblast marker protein) in proximal tubular epithelial cells. Immunohistochemistry staining (Fig. 4A-C) showed strong expression of CK18 and weak expression of α-SMA in proximal tubule epithelial cells of control mice. In mice with diabetes, the reverse pattern was observed, with increased expression of α-SMA and decreased expression of CK18 in these cells. These expression changes of CK18 and α-SMA could be partially reversed by treatment with SOCS1 or SOCS3 plasmid. Western blot (Fig. 4D) and real-time PCR (Fig. 4E-G) analyses showed similar results as the immunohistochemistry analysis.
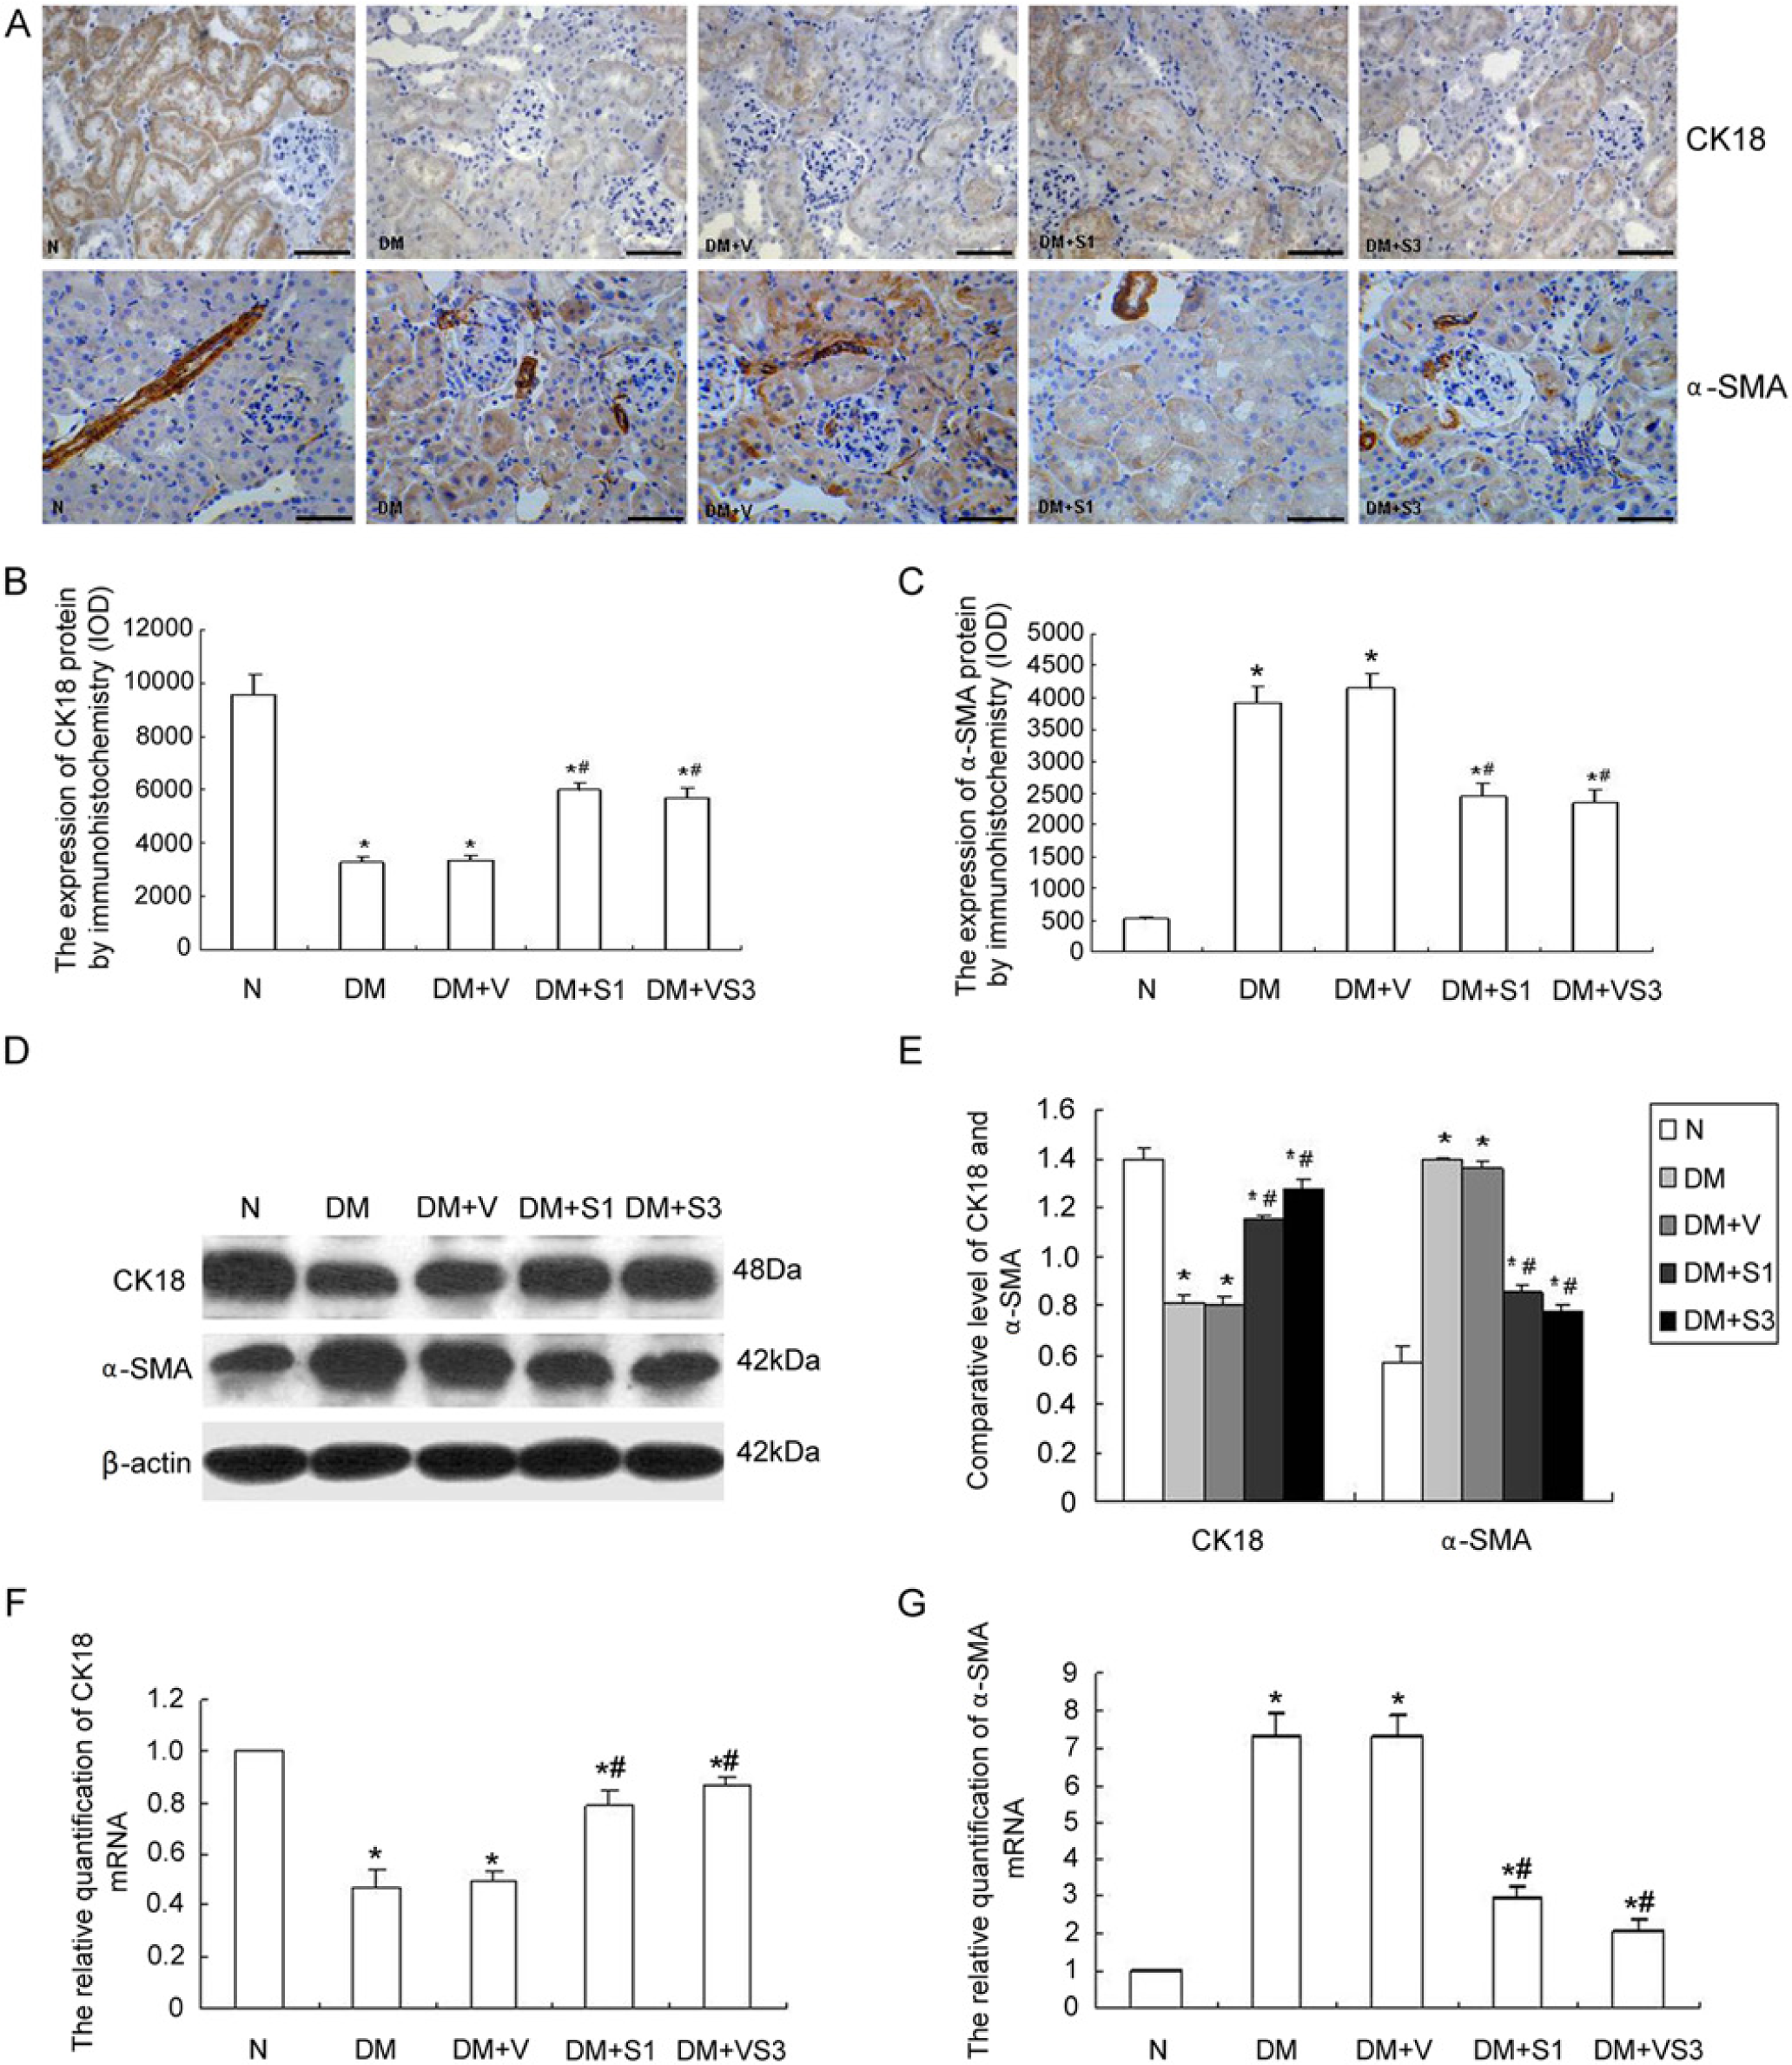
Protein and mRNA expression of cytokeratin (CK)18 and α-smooth muscle actin (α-SMA). (A) Immunohistochemical staining for CK18 and α-SMA and (B, C) integrated optical density (IOD) of these staining patterns. (D-E) Western blot and (F-G) real-time PCR analysis for CK18 and α-SMA. CK18 expression decreased while α-SMA expression increased in the tubular epithelial cells in diabetic mice. SOCS1 (DM+S1) or SOCS3 (DM+S3) treatment reversed the expression of CK18 and α-SMA in mice with diabetes. The values are expressed as the mean ± SD. *p<0.05 vs. control mice (N), #p<0.05 vs. mice with diabetes (DM). DM+V represents pEF-FLAG-I vector control. Scale bars in (A) = 100 µm.
SOCS Overexpression Inhibits the Expression of OSM in Diabetic Kidney
The immunohistochemistry results showed marked OSM expression in the tubular epithelial cells, whereas insignificant expression was noted in the glomeruli. ELISA analysis revealed that compared with the normal mice, the expression of OSM was increased in the mice with diabetes, whereas overexpression of SOCS1 or SOCS3 significantly depressed the expression level of OSM (Fig. 5).
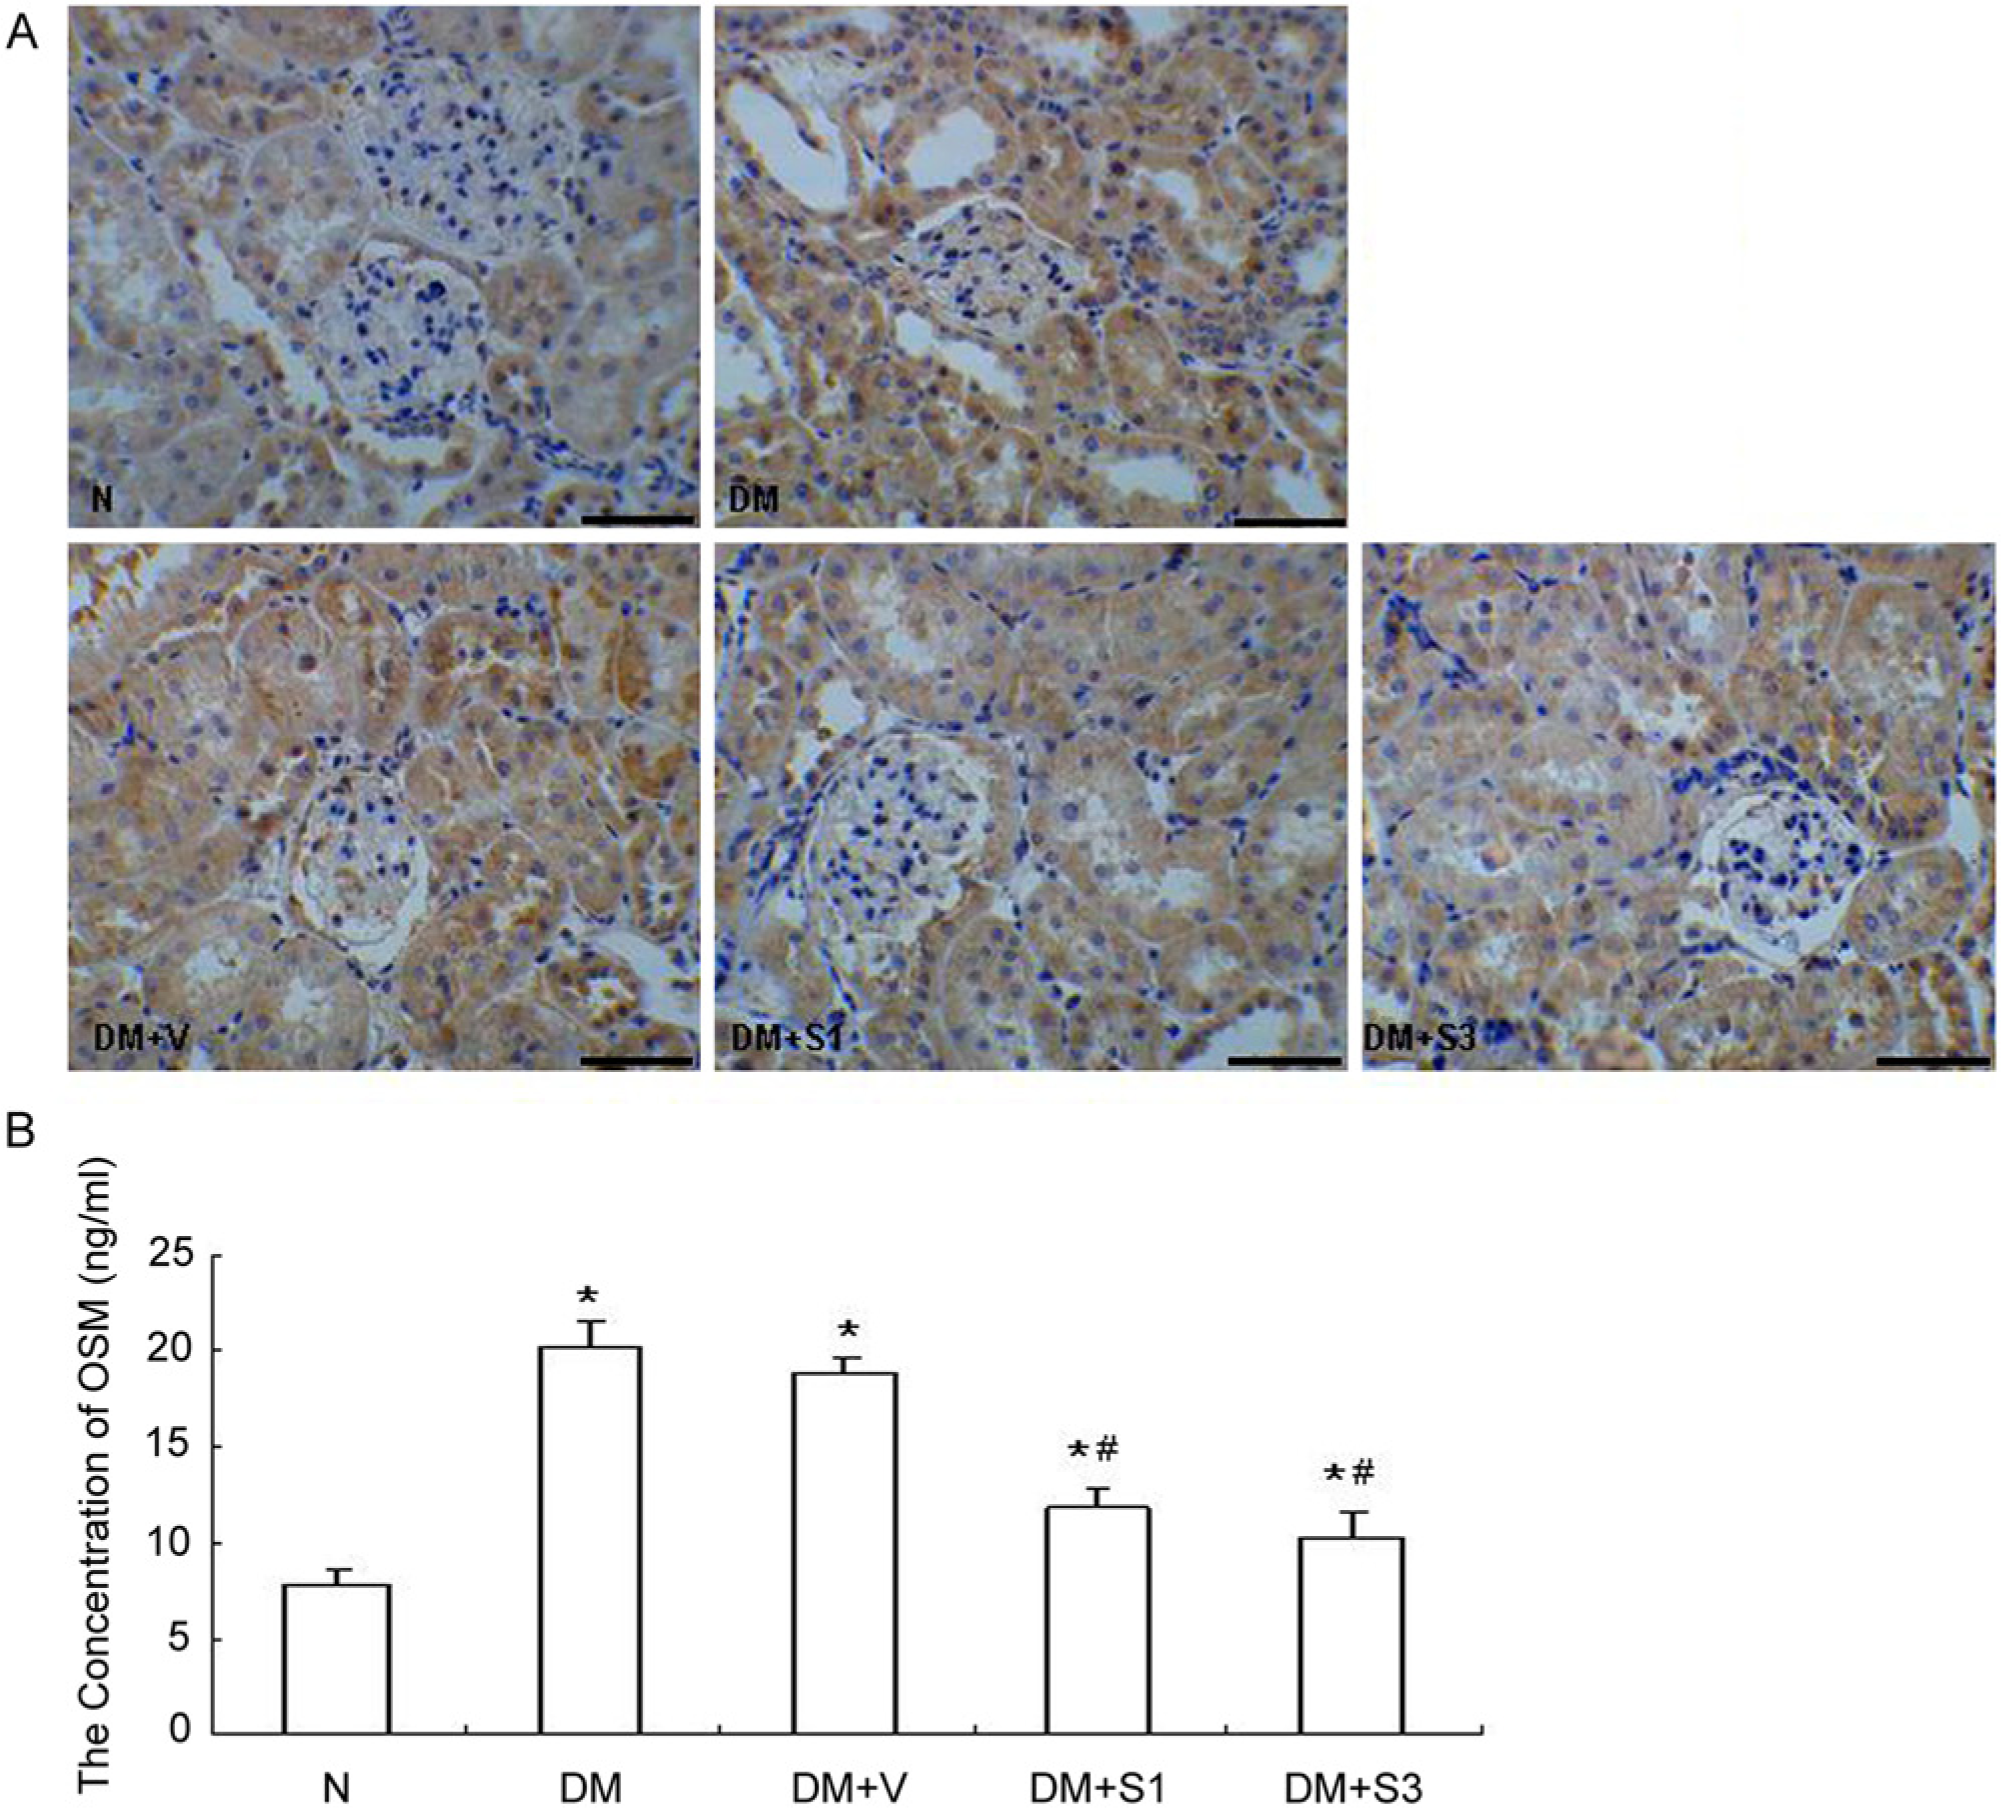
Expression of oncostatin M (OSM) examined by immunohistochemistry (A) and ELISA (B). Immunostaining showed marked OSM expression in the tubular epithelial cells, whereas insignificant expression was noted in the glomeruli. ELISA analysis revealed that SOCS1 (DM+S1) or SOCS3 (DM+S3) treatment significantly reduced the expression of OSM. The values are expressed as the mean ± SD. *p<0.05 vs. control mice (N), #p<0.05 vs. mice with diabetes (DM). DM+V represents pEF-FLAG-I vector control. Scale bars in (A) = 100 µm.
SOCS Overexpression Mitigates Renal Interstitial Fibrosis
The degree of renal interstitial fibrosis was determined by Masson staining. The area of interstitial fibrosis increased in the diabetic mice. Moreover, the administration of the SOCS plasmids markedly reduced the area of interstitial fibrosis in the diabetic mice (Fig. 6).
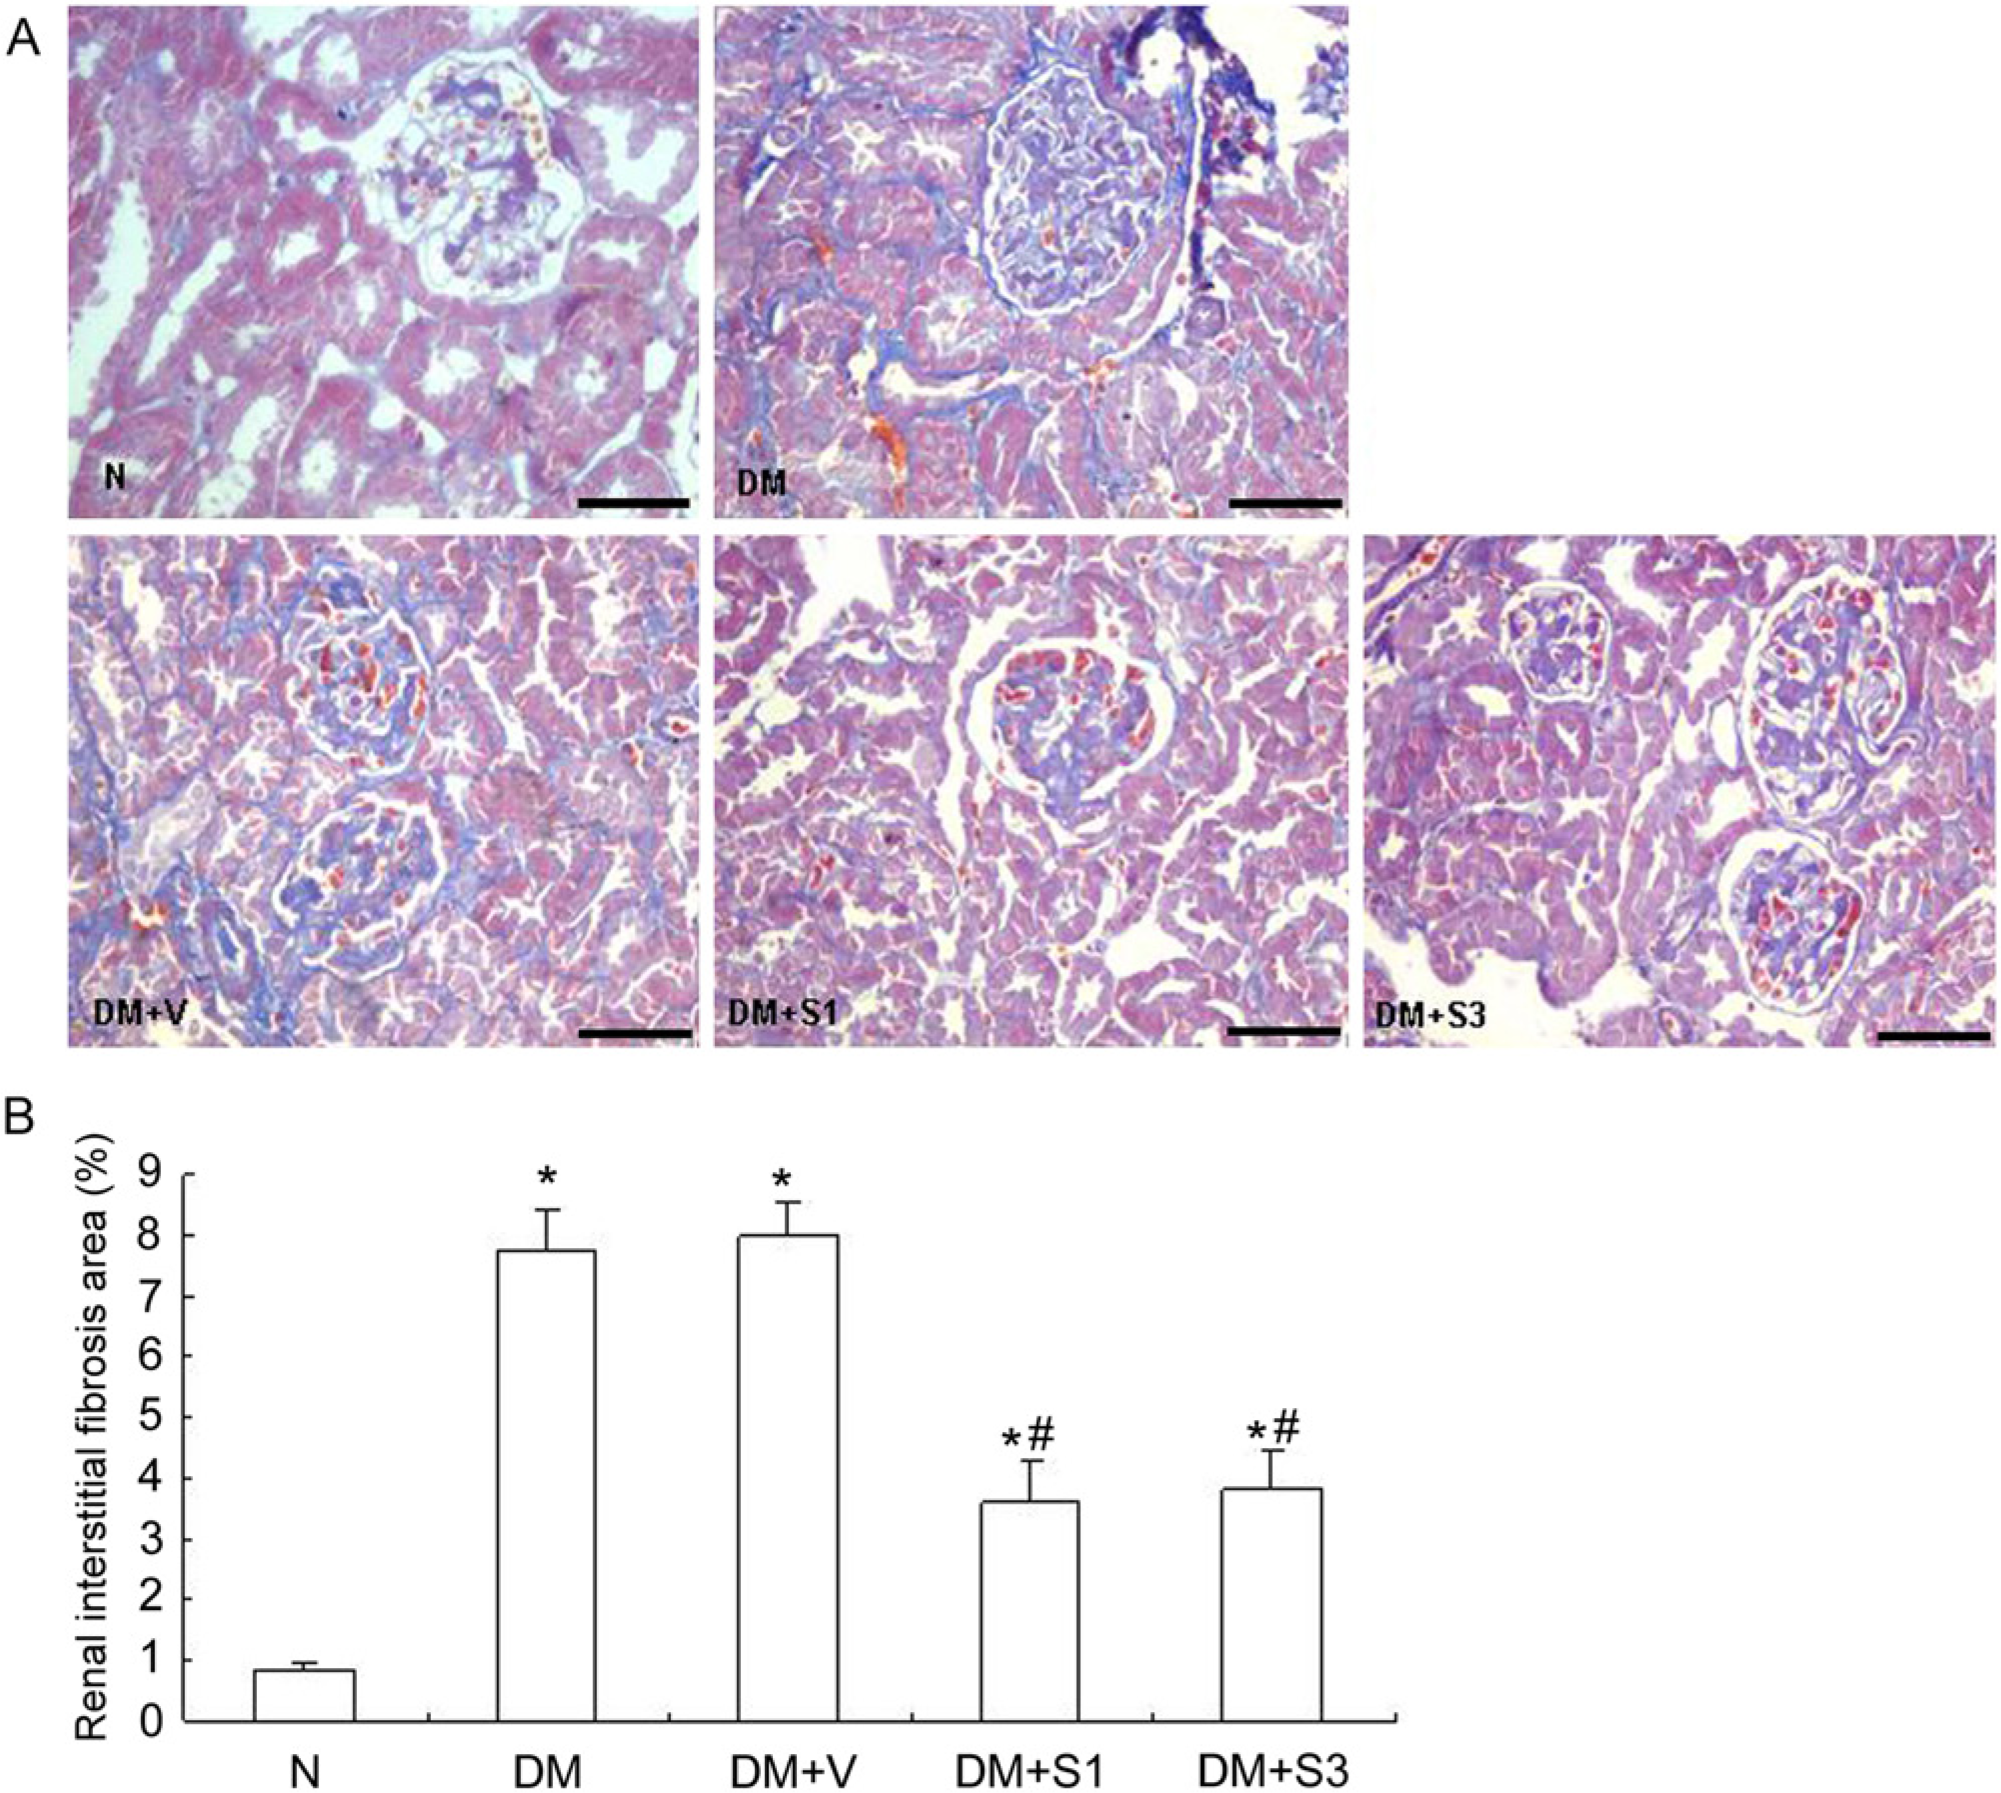
Pathological changes in renal interstitial fibrosis detected by Masson staining (A). SOCS1 (DM+S1) or SOCS3 (DM+S3) treatment reduced the area of interstitial fibrosis in diabetic mice (B). The values are expressed as the mean ± SD. *p<0.05 vs. control mice (N), #p<0.05 vs. mice with diabetes (DM). DM+V represents pEF-FLAG-I vector control. Scale Bars in (A) = 100 µm.
Discussion
DN is one of the most devastating microvascular complications of diabetes as well as the leading cause of end-stage renal disease. Histologically, end-stage renal disease manifests as glomerulosclerosis, vascular sclerosis and TIF. TIF is particularly important because deterioration of renal function is mainly determined by the extent and severity of interstitial lesions in many forms of chronic kidney disease (Bohle et al. 1987; Idasiak-Piechocka and Krzymański 1996). Regardless of the initial causes, TIF is characterized by the de novo activation of α-SMA–positive myofibroblasts, the crucial effector cells responsible for excess deposition of the ECM under pathological conditions (Badid et al. 2002). The origin of myofibroblasts in the kidney has been studied over the past years. To date, EMT has become the predominant theory as to the origin of myofibroblasts; although, a number of researchers have opposed this hypothesis (Humphreys et al. 2010). Considering that the high expression of α-SMA in vascular smooth cells and that α-SMA–positive myofibroblasts may also be derived from mesangial cells and stromal fibroblasts, we collected tubules by LCM to investigate the phenotypic changes that occur in tubular epithelial cells. To verify the phenotypic changes in proximal tubular epithelial cells in the diabetic mouse kidneys, we examined the expression of CK18 and α-SMA in the proximal tubular epithelial cells by immunohistochemistry and western blot. Cytokeratins are a group of epithelial cell marker proteins and α-SMA is a myofibroblast marker protein. There are more than 30 types of cytokeratins in epithelial cells, of which CK18 is highly expressed in the proximal tubular epithelial cells. Although CK18 is also expressed in distal tubular epithelial cells, expression changes in CK18 mainly occur in proximal tubular epithelial cells because the proximal tubules are more sensitive to injury in kidney disease than the distal tubules. The results suggest that renal tubular epithelial cells lose the expression of their own marker proteins and acquire the expression profile of the myofibroblasts.
Many factors can promote TEMT, including a variety of inflammatory cytokines. Recently, DN has been considered as an inflammatory disease (Tuttle 2005). Accumulating evidence has demonstrated that inflammatory cell infiltration and inflammatory factors play a crucial role in the loss of renal function in DN. OSM is an IL-6–type cytokine. In vivo, OSM expression increases in a time-dependent manner within hours following unilateral ureteral obstruction (UUO), a model of renal fibrosis (Elbjeirami et al. 2010) and in vitro, OSM can induce TEMT (Nightingale et al. 2004; Pollack et al. 2007). These results suggest that OSM has profibrotic properties. However, recent studies have shown that OSM attenuated TGF-β1–induced expression of matricellular proteins, which suggests the antifibrotic effects of OSM (Sarközi et al. 2011). In this study, we detected the expression of OSM by immunohistochemistry and ELISA. Immunostaining showed marked OSM expression in the tubular epithelial cells, whereas insignificant expression was noted in the glomeruli. ELISA analysis revealed that the expression of OSM was increased in mice with diabetes compared with control mice. In addition, the expression of OSM was correlated with renal interstitial fibrosis, which was determined by Masson staining (r=0.898, p<0.01). These results suggest that OSM has profibrotic effects and plays an important role in the development of TIF in DN.
The suppressor of cytokine signaling (SOCS) proteins were, as their name suggests, first described as negative-feedback regulators of cytokine signaling. Evidence demonstrates the involvement of SOCS proteins in inflammatory diseases (Adhikari et al. 2006; Gómez-Guerrero et al. 2004; Shouda et al. 2001; Yoshimura et al. 2007). Although the SOCS family comprises eight members (SOCS1-SOCS7, and CIS), much of our understanding of SOCS function is derived from studies on SOCS1 and SOCS3. In this study, a SOCS1 or SOCS3 plasmid was administered to mice with diabetes via tail vein injection at week 8. This time point was chosen because this is when the level of proteinuria of mice with diabetes is significantly higher than that in the control mice; the appearance of proteinuria indicates notable kidney injury in mice with diabetes. The results suggest that renal delivery of SOCS1 and SOCS3 ameliorated proteinuria, reduced OSM expression and ECM deposition and partly restored the expressions of CK18 and α-SMA. In addition, SOCS gene therapy attenuated the activity of STAT in diabetic kidneys. Our findings also suggest that gene transfer was successful in our model.
Overall, these results suggest that OSM is involved in the development of DN. In addition, SOCS has a therapeutic role in DN, which may be related to the inhibition of OSM expression, ECM deposition and the phenotypic changes to tubular epithelial cells. In addition, reports show that both insulin and angiotensin II are individually able to induce the expression of SOCS proteins which, in turn, blocks insulin and angiotensin II signaling (Rui et al. 2002; Hernández-Vargas et al. 2005). This suggests that SOCS is involved in the progression of DN through metabolic and hemodynamic changes. In future studies, we will explore other mechanisms of SOCS action in the progression of DN.
Footnotes
Declaration of Conflicting Interests
The author(s) declared no potential conflicts of interest with respect to the research, authorship, and/or publication of this article.
Funding
The author(s) disclosed receipt of the following financial support for the research, authorship, and/or publication of this article: This study was supported by grants from the National Natural Science Foundation (81000301 and 81100517) and the Department of Education of the Hebei Province of China (2011168 and 2010150).