
Abstract
Mouse models of myocardial infarction are essential tools for the study of cardiac injury, repair, and remodeling. Our current investigation establishes a systematic approach for quantitative evaluation of the inflammatory and reparative response, cardiac function, and geometry in a mouse model of reperfused myocardial infarction. Reperfused mouse infarcts exhibited marked induction of inflammatory cytokines that peaked after 6 hr of reperfusion. In the infarcted heart, scar contraction and chamber dilation continued for at least 28 days after reperfusion; infarct maturation was associated with marked thinning of the scar, accompanied by volume loss and rapid clearance of cellular elements. Echocardiographic measurements of end-diastolic dimensions correlated well with morphometric assessment of dilative remodeling in perfusion-fixed hearts. Hemodynamic monitoring was used to quantitatively assess systolic and diastolic function; the severity of diastolic dysfunction following myocardial infarction correlated with cardiomyocyte hypertrophy and infarct collagen content. Expression of molecular mediators of inflammation and cellular infiltration needs to be investigated during the first 72 hr, whereas assessment of dilative remodeling requires measurement of geometric parameters for at least four weeks after the acute event. Rapid initiation and resolution of the inflammatory response, accelerated scar maturation, and extensive infarct volume loss are important characteristics of infarct healing in mice.
Patients who survive a large myocardial infarction develop extensive chamber dilation, cardiomyocyte hypertrophy, and increased sphericity of the ventricle. This process, termed “post-infarction remodeling” (Pfeffer and Pfeffer 1987; Pfeffer and Braunwald 1990; Opie et al. 2006), is associated with the development of heart failure and increased incidence of arrhythmias (St John Sutton et al. 2003), and is a predictor of mortality following myocardial infarction. Even minor attenuation in remodeling following infarction can result in significant decreases in the incidence of heart failure and cardiovascular death (St John Sutton et al. 1997). Despite the profound clinical implications of cardiac remodeling, the mechanisms involved in the pathogenesis of cardiac dilation following myocardial infarction remain poorly understood. Alterations in loading conditions and mechanical stretch are proportional to the extent of the infarct and play an important role in dilation of the infarcted ventricle. In addition to the size of the infarct, the qualitative characteristics of the healing scar are important determinants of chamber geometry and function. Thus, the molecular signals regulating the reparative response following infarction are critically involved in the pathogenesis of adverse remodeling (Whittaker et al. 1991; Frangogiannis et al. 2005; Bujak et al. 2007; Bujak et al. 2008; Dobaczewski et al. 2010).
With the development of genetically targeted animals, mouse models of myocardial infarction have become valuable tools for dissecting the cellular and molecular pathways involved in cardiac remodeling (Jones and Lefer 2000; Hoit 2001; Maekawa et al. 2009; Schellings et al. 2009). Investigators have used a variety of methodological approaches, such as echocardiography (Pollick et al. 1995; Takagawa et al. 2007; Zhang et al. 2007; Scherrer-Crosbie and Thibault 2008), quantitative morphometry (Huebener et al. 2008), invasive hemodynamic monitoring (Scherrer-Crosbie et al. 2001) and magnetic resonance imaging (Nahrendorf et al. 2008), to quantitatively assess remodeling-associated parameters and to study the role of specific molecular pathways in chamber dilation, hypertrophy, and systolic and diastolic dysfunction following myocardial infarction. Unfortunately, interpretation of the findings from various studies is complicated by the absence of consistent methodological protocols for assessment of various endpoints. Optimal analysis of the reparative response following infarction should take into account the time course of the molecular, histological, and functional alterations observed in the infarcted heart. Moreover, a systematic comparison of the relative value of various methodological strategies for assessment of functional, morphometric, and anatomic endpoints in mice undergoing myocardial infarction protocols is lacking.
The current study uses morphometric, echocardiographic, and hemodynamic approaches to establish methodology for optimal assessment of the functional and geometric alterations in the remodeling infarcted mouse heart. Moreover, using systematic immunohistochemical and molecular analyses, we examine the optimal time points for assessment of the inflammatory and fibrotic response following myocardial infarction. Our observations demonstrate that healing of the infarcted mouse heart is associated with extensive and progressive tissue loss, leading to marked thinning of the ventricular wall and formation of a contracted and acellular scar. These unique characteristics of cardiac repair in mouse models need to be taken into account when interpreting studies in mouse models of myocardial infarction.
Materials and Methods
Reperfused Murine Infarction Protocols
All animal studies were approved by the Institutional Animal Care and Use Committee (IACUC) at Baylor College of Medicine and at Albert Einstein College of Medicine. Female and male C57/BL6 mice from our colony, 8 to 12 weeks of age (18.0–22.0 g body weight), were anesthetized with inhaled isoflurane (2%). A closed-chest mouse model of reperfused myocardial infarction was utilized as previously described (Dewald et al. 2004), to avoid the confounding effects of surgical trauma and inflammation. The left anterior descending coronary artery was occluded for 1 hr then reperfused for 3 days (n=12), 7 days (n=15), or 28 days (n=16). To assess cardiac function and remodeling following myocardial infarction, all animals underwent both echocardiographic and morphometric analyses. At the end of the experiment, the chest was opened and the heart was perfusion-fixed in zinc-formalin, and embedded in paraffin for histological studies. For RNA extraction, additional animals underwent 1 hr coronary occlusion followed by 6 hr (n=16), 24 hr (n=14), or 72 hr (n=12) of reperfusion. Sham animals (n=8 for histology, n=14 for RNA extraction) were prepared identically without undergoing coronary occlusion/reperfusion.
Perfusion Fixation and Assessment of Ventricular Volumes
For morphometric assessment of postinfarction remodeling, all infarcted hearts were used for perfusion-fixation as previously described (Dewald et al. 2005). Sham animals (n=8) were used as controls. A cardioplegic solution (Michael et al. 1999) was perfused through the jugular vein to promote relaxation. After excision and rinsing in cold cardioplegic solution, two PE-50 catheters were pushed into the left ventricle (one through the aorta, the other through the left atrium), secured in place, and used to enable flow of fixative through the left ventricle. This system was used to fix the heart for 10 min with 10% zinc-buffered formalin. Subsequently, formalin-fixed hearts were embedded in paraffin. The entire heart was cross-sectioned from base to apex at 250-µm intervals. Ten serial 5-µm sections were obtained at each interval, corresponding to an additional 50-µm segment. The first section from each interval was stained with hematoxylin/eosin (Fig. 1). For each section, the left ventricular wall area (LVWA), septal area (SA), left ventricular chamber area (LVCA), and the infarct area (IA) were measured using ImagePro software (Media Cybernetics; Rockville MD). Assessment of cardiac end-diastolic volumes was performed by calculating the sum of the volumes of all 300-µm partitions. Because histological processing results in shrinkage of the processed tissue (Kerns et al. 2008), the values were corrected by a linear factor of 1.3. The following formulas were used:
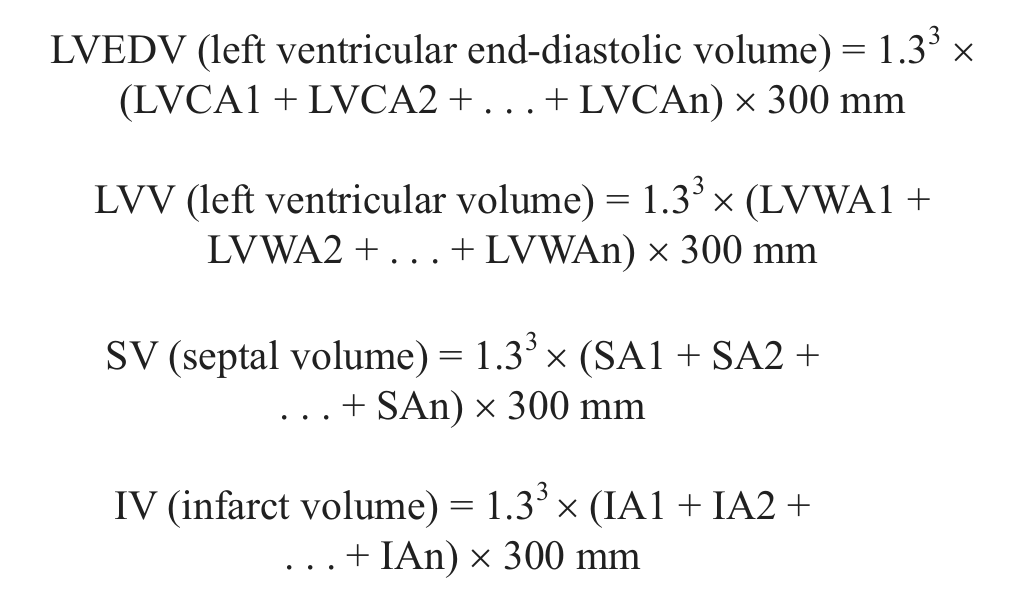
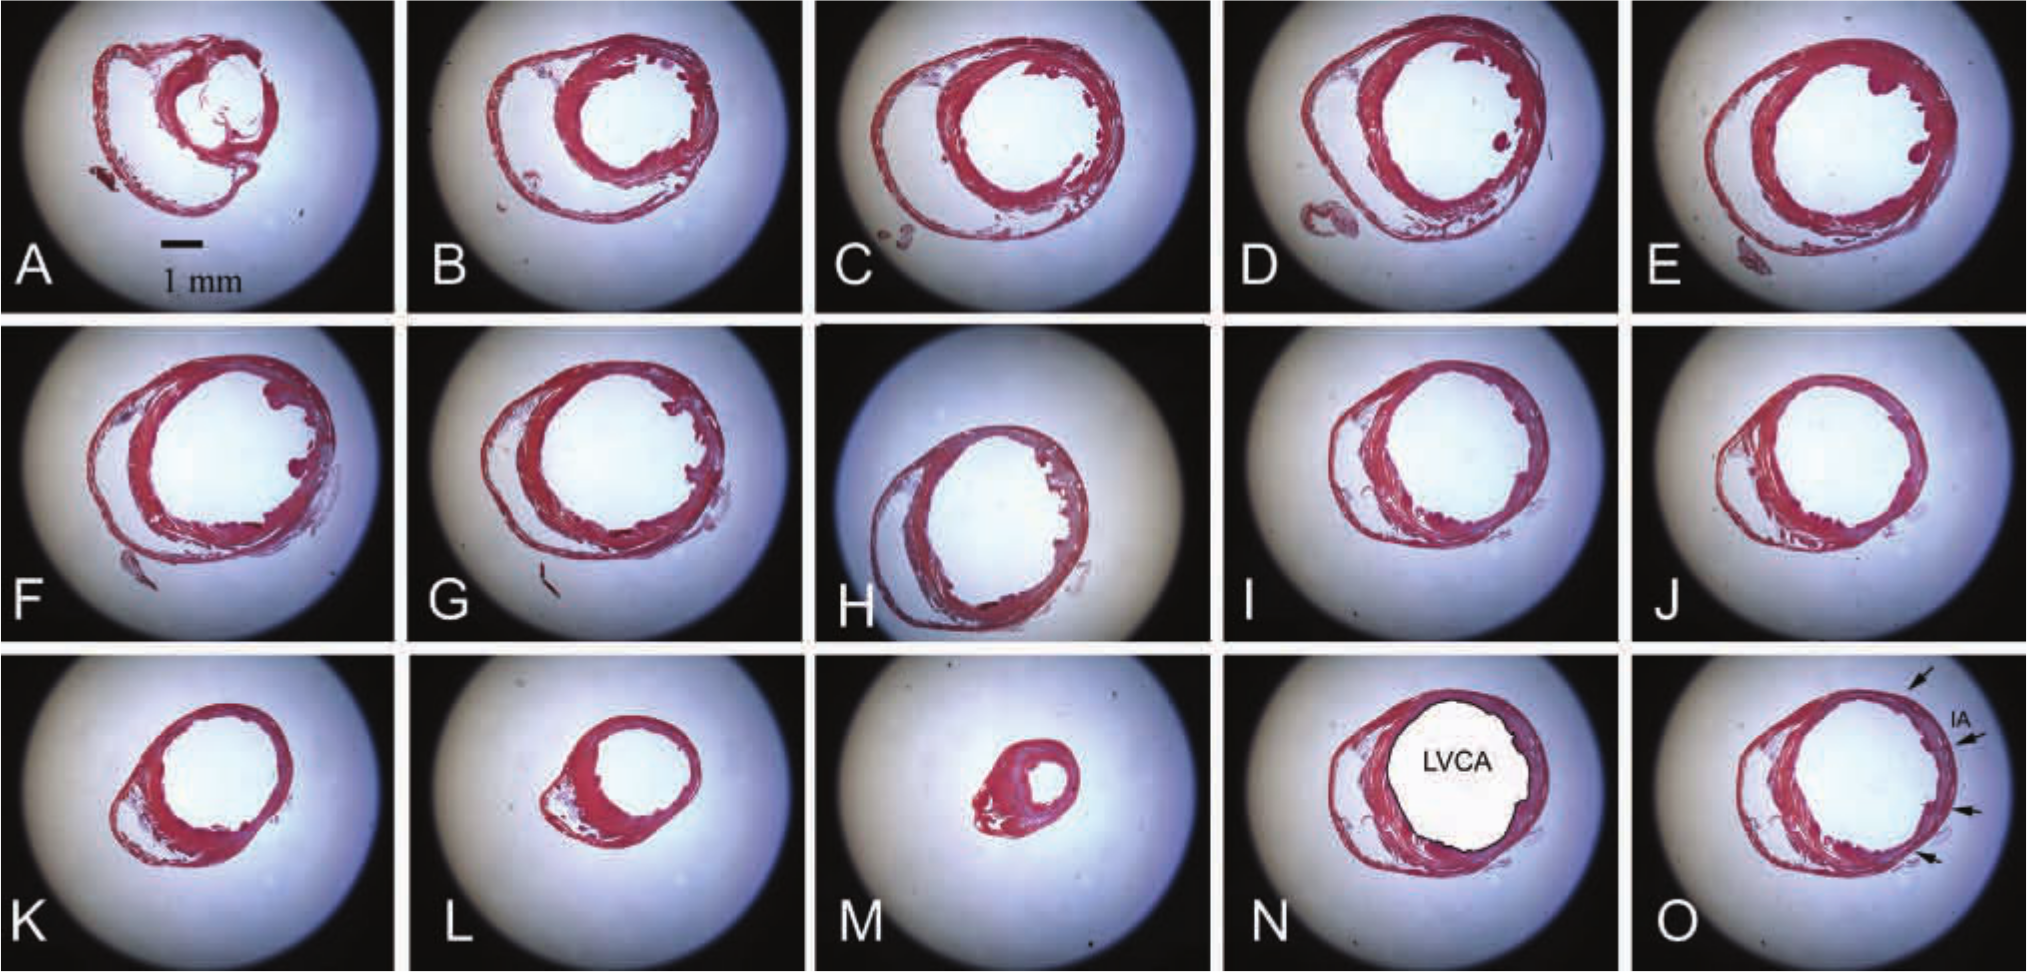
Morphometric analysis of remodeling-associated parameters in infarcted mouse hearts. After 1 hr coronary occlusion and 7 days (same was done for 3 and 28 days) of reperfusion, the infarcted heart was perfusion-fixed and sectioned from base to apex (A-M) at 250-µm intervals. Ten 5-µm sections were cut at each interval and the first section was stained for hematoxylin/eosin (A-M); thus, each partition corresponded to a 300-µm interval. Left ventricular volumes were quantitated by adding the volumes corresponding to each 300-µm partition. To assess the left ventricular end-diastolic volume (LVEDV), the left ventricular chamber area (LVCA) was traced and measured at each interval (N). The formula LVEDV = 1.33(LVCA1 + LVCA2 + . . . + LVCAn) × 300 µm was used. The infarct volume was assessed by tracing the infarct area (IA; arrows) for each interval (O). The size of the infarct was assessed as the ratio: infarct volume (IV)/left ventricular volume (LVV). Note the midmyocardial location of the infarct that extends from the level of the papillary muscles (D) to the true apex (M). Bar = 1 mm.
Septal mass was assessed by multiplying the septal volume (SV) with the specific gravity of the cardiac muscle (1.065 mg/µl). The size of the infarct was measured as the ratio of the IV to the LVV and was expressed as a percentage.
Echocardiography
Transthoracic 2D-echocardiography was performed in anesthetized mice (2% isoflurane delivered through a nonrebreather nasal cone) before instrumentation (preinfarction values) and before sacrifice (postinfarction values) using a 14 MHz linear transducer (GE Healthcare, Milwaukee, WI). Left ventricular (LV) dimensions were measured in parasternal long-axis view using 2D-directed M-mode echocardiography as previously described (Bujak et al. 2009). The following parameters were measured as indicators of LV function and remodeling: LV end-diastolic diameter (LVEDD), LV end-systolic diameter (LVESD), and fractional shortening (FS = 100 × [LVEDD – LVESD]/LVEDD). The percentage changes in these parameters at 7 days after infarction were calculated using the following formulas: ΔLVEDD = 100 × (LVEDD at 7 days – LVEDD at baseline)/LVEDD at baseline, ΔLVESD = 100 × (LVESD at 7 days – LVESD at baseline)/LVESD at baseline, and ΔFS = 100 × (FS at baseline – FS at 7 days)/FS at baseline. A similar strategy was used to measure the percentage changes at 3 days and at 28 days. An additional group of infarcted mice (n=10) underwent serial echocardiographic imaging at baseline (preinfarction) and after 7, 14, and 28 days of reperfusion using the Vevo 770 system (Visualsonics, Toronto, ON, Canada). LVEDD, LVESD, LV end-diastolic volume (LVEDV), FS, LV mass, and the percentage changes in comparison with baseline values were quantitatively assessed.
Invasive Hemodynamic Monitoring
LV pressure was recorded in infarcted mice after 3–28 days of reperfusion (before sacrifice) and in sham controls (sham, n=5; 3 days, n=10; 7 days, n= 12; 28 days, n=11). The right carotid artery was cannulated with a modified RADI PressureWire catheter (RADI Medical Systems, Upsala, Sweden). Subsequently, the catheter was advanced into the ascending aorta and then into the left ventricle (Reddy et al. 2005). LV pressure signal along with ECG were acquired and stored for offline analysis. The LV end-diastolic pressure (LVEDP), the maximal rate of LV contractility (dp/dtmax, mm Hg/s), the maximal rate of LV relaxation (–dp/dtmax, mm Hg/s), and τ (the relaxation time constant) were calculated from the LV pressure signal.
Immunohistochemistry and Quantitative Histology
To assess the cellular content of the infarcted heart, histological sections were stained immunohistochemically with the following antibodies: mouse anti-α smooth muscle actin (α-SMA) antibody (Sigma, St. Louis, MO), rat anti-mouse macrophage antibody Mac-2 (Cedarlane, Burlington, ON, Canada), and rat antineutrophil antibody (Serotec, Raleigh, NC), and rabbit polyclonal anti-IL-1β antibody (Abcam, Cambridge, MA). Staining was performed with a peroxidase-based technique using the Mouse on Mouse (MOM) kit (Vector Laboratories, Burlingame, CA) for α-SMA, the Ultravision LP detection system (Thermo Scientific, Waltham, MA) for IL-1β, and the ABC Elite kit (Vector) for Mac-2 and for the antineutrophil antibody as previously described (Dewald et al. 2005; Bujak et al. 2008). Antigen retrieval with heat and a citrate buffer was used for IL-β immunohistochemistry. Quantitative assessment of neutrophil and macrophage density was performed by counting the number of neutrophils and Mac-2-immunoreactive cells, respectively, in the infarcted area (I), the subendocardial and subepicardial areas neighboring the infarct (peri-infarct area, PI), and the remote remodeling myocardium (R) (Dewald et al. 2005). Myofibroblasts were identified as extravascular α-SMA positive cells and counted in the infarcted myocardium (Frangogiannis et al. 2005), the preserved PI, and the remote myocardium. Cell density was expressed as cells/mm2. Moreover, the total number of neutrophils, macrophages, and myofibroblasts in the infarct was assessed using the formula: cell number in the infarct = (cell density) × (infarct volume)/0.005 mm (thus taking into account that the thickness of each section is 5 µm). The collagen network was identified using picrosirius red staining (Dewald et al. 2005). Picrosirius red-stained slides from each infarcted heart were scanned using a digital camera. The area of collagen staining in the infarcted area, the PI, and the remote myocardium was quantitatively assessed using ImagePro software and expressed as a percentage of the total corresponding area. Cardiomyocyte size was assessed in the noninfarcted remodeling myocardium using staining with Alexa Fluor 594-conjugated wheat germ agglutinin (WGA) lectin (Invitrogen) to label cardiomyocyte membranes (Gros et al. 1982). In each animal, the mean cross-sectional area (CSA) of cardiomyocytes was measured in the preserved subepicardial and subendocardial areas of the infarcted anterior wall and in the noninfarcted posterior septum. Assessment of CSA was based on measurements of 50 cardiomyocytes from each animal.
RNA Extraction and Ribonuclease Protection Assay
RNA extraction from sham and infarcted whole hearts was performed using standard protocols as previously described (Dewald et al. 2005; Huebener et al. 2008). The mRNA expression level of the cytokines tumor necrosis factor (TNF)-α, interleukin (IL)-1β, IL-6, IL-10, transforming growth factor (TGF)-β1, 2, and 3, macrophage–colony stimulating factor (M-CSF), and the extracellular matrix proteins osteopontin (OPN) and type I collagen α1 chain was assessed using a ribonuclease protection assay (RiboQuant; BD Pharmingen; San Diego, CA) according to the manufacturer’s protocol. Gene expression was normalized to the ribosomal protein L32 mRNA.
Statistical Analysis
Statistical analysis was performed using ANOVA followed by t-test corrected for multiple comparisons (Student–Newman–Keuls) using GraphPad Prism 6.0 software (GraphPad Software, La Jolla, CA). Paired t-test was used to compare echocardiographic endpoints before and after myocardial infarction. Data were expressed as mean ± SEM. Statistical significance was set at 0.05. Correlations were assessed using Spearman’s rank correlation coefficients.
Results
Reperfused Infarction in Mice is Associated with Progressive Scar Contraction and Extensive Volume Loss
In all, 43 animals underwent coronary occlusion and reperfusion protocols. Mortality during coronary occlusion was 9.3%; one animal died during reperfusion. LAD coronary artery occlusion/reperfusion resulted in extensive infarction of the anterior and lateral wall that primarily involved the midmyocardium sparing thin strips of subendocardial and subepicardial myocardium (Fig. 2A-C). After 3 days of reperfusion, dead cardiomyocytes in the midmyocardium were replaced by highly cellular granulation tissue (Fig. 2A). Subsequently, infarct healing was associated with marked scar contraction and significant volume loss (Fig. 2B-E). After 28 days of reperfusion, mature scars comprised a thin strip of collagenous matrix (Fig. 2C); 28-day infarcts had only 1/3 the volume of infarcts at 72 hr of reperfusion (Fig. 2E). In contrast, the noninfarcted septum exhibited hypertrophic remodeling, showing a marked, progressive increase in volume (Fig. 2F-J).
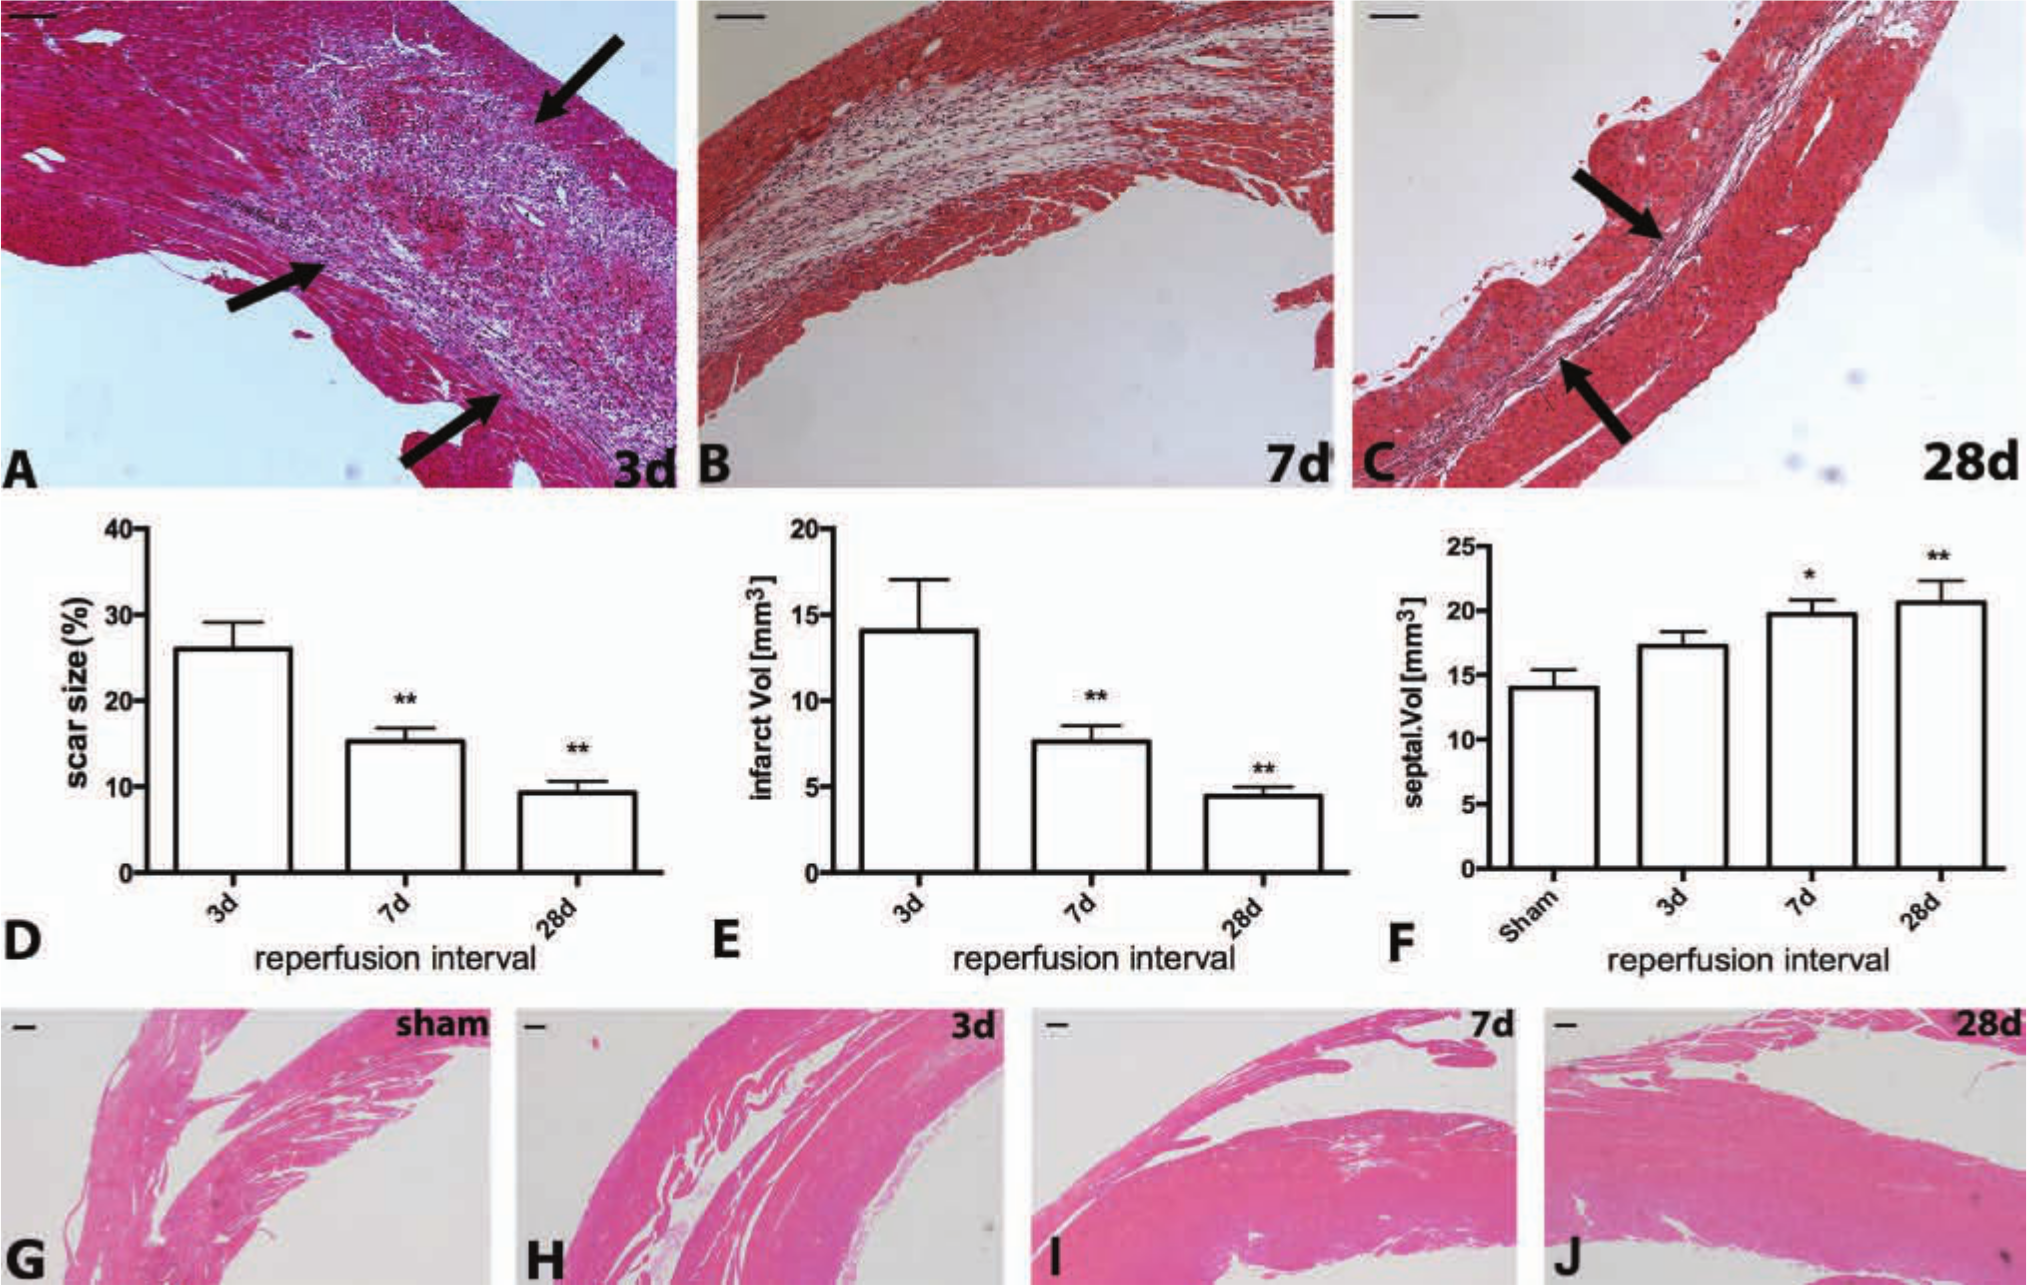
Reperfused murine myocardial infarcts exhibit marked and progressive contraction. A-C: Hematoxylin eosin staining. After 3 days of reperfusion (A) most dead cardiomyocytes in the infarcted mouse heart are replaced by granulation tissue (arrows). After 7 (B) to 28 (C) days of reperfusion, the healing scar becomes much thinner and less cellular. After 28 days of reperfusion, only a thin strip of collagen-based scar remains in the area of the infarct (C, arrows). D: Quantitative analysis of the size of the infarct shows marked contraction of the scar after 7 and 28 days of reperfusion (**p<0.01 vs 3-day infarcts). E: Quantitation of the infarct volume shows marked tissue loss after 7–28 days of reperfusion (**p<0.01 vs 3-day infarcts). F: In contrast, the volume of the noninfarcted septum progressively increases after 7–28 days of reperfusion reflecting hypertrophic remodeling of the surviving myocardial segments (*p<0.05, **p<0.01 vs sham) (sham n=8, 3d n=8, 7d n=13, 28d n=12). G-J: Representative images illustrate increase in septal thickness after 3 (H), 7 (I), and 28 (J) days of reperfusion in comparison with sham myocardium (G). Bars A-C = 0.1 mm; G-J = 100 µm.
The Time Course of the Cellular Inflammatory and Fibrotic Response in Reperfused Mouse Infarcts
In the infarcted myocardium, early activation of the inflammatory response is followed by fibrous tissue deposition (Frangogiannis 2012b). Reperfused mouse infarcts exhibited rapid transition of the reparative response from the inflammatory to the proliferative phase. After 3 days of reperfusion, the infarcted myocardium was highly cellular, containing significant numbers of neutrophils (Fig. 3A,D, E), macrophages (Fig. 3F, I, J), and myofibroblasts (Fig. 4A, D-E, I). The neutrophilic infiltrate rapidly resolved after 7 days of reperfusion (Fig. 3B, D, E), whereas macrophage and myofibroblast density in the infarcted area remained elevated (Figs. 3G, 3I, 3J, 4B, 4I, 4J). After 28 days of reperfusion, the thinned mature scar exhibited low myofibroblast and macrophage density and had high collagen content (Figs. 3H, 3I, 3J, 4C, 4G, 4I, 4J, 4K). The total number of myofibroblasts in the scar after 28 days of reperfusion was only 10% of the number of myofibroblasts at the 72 hr time point (Fig. 4J).
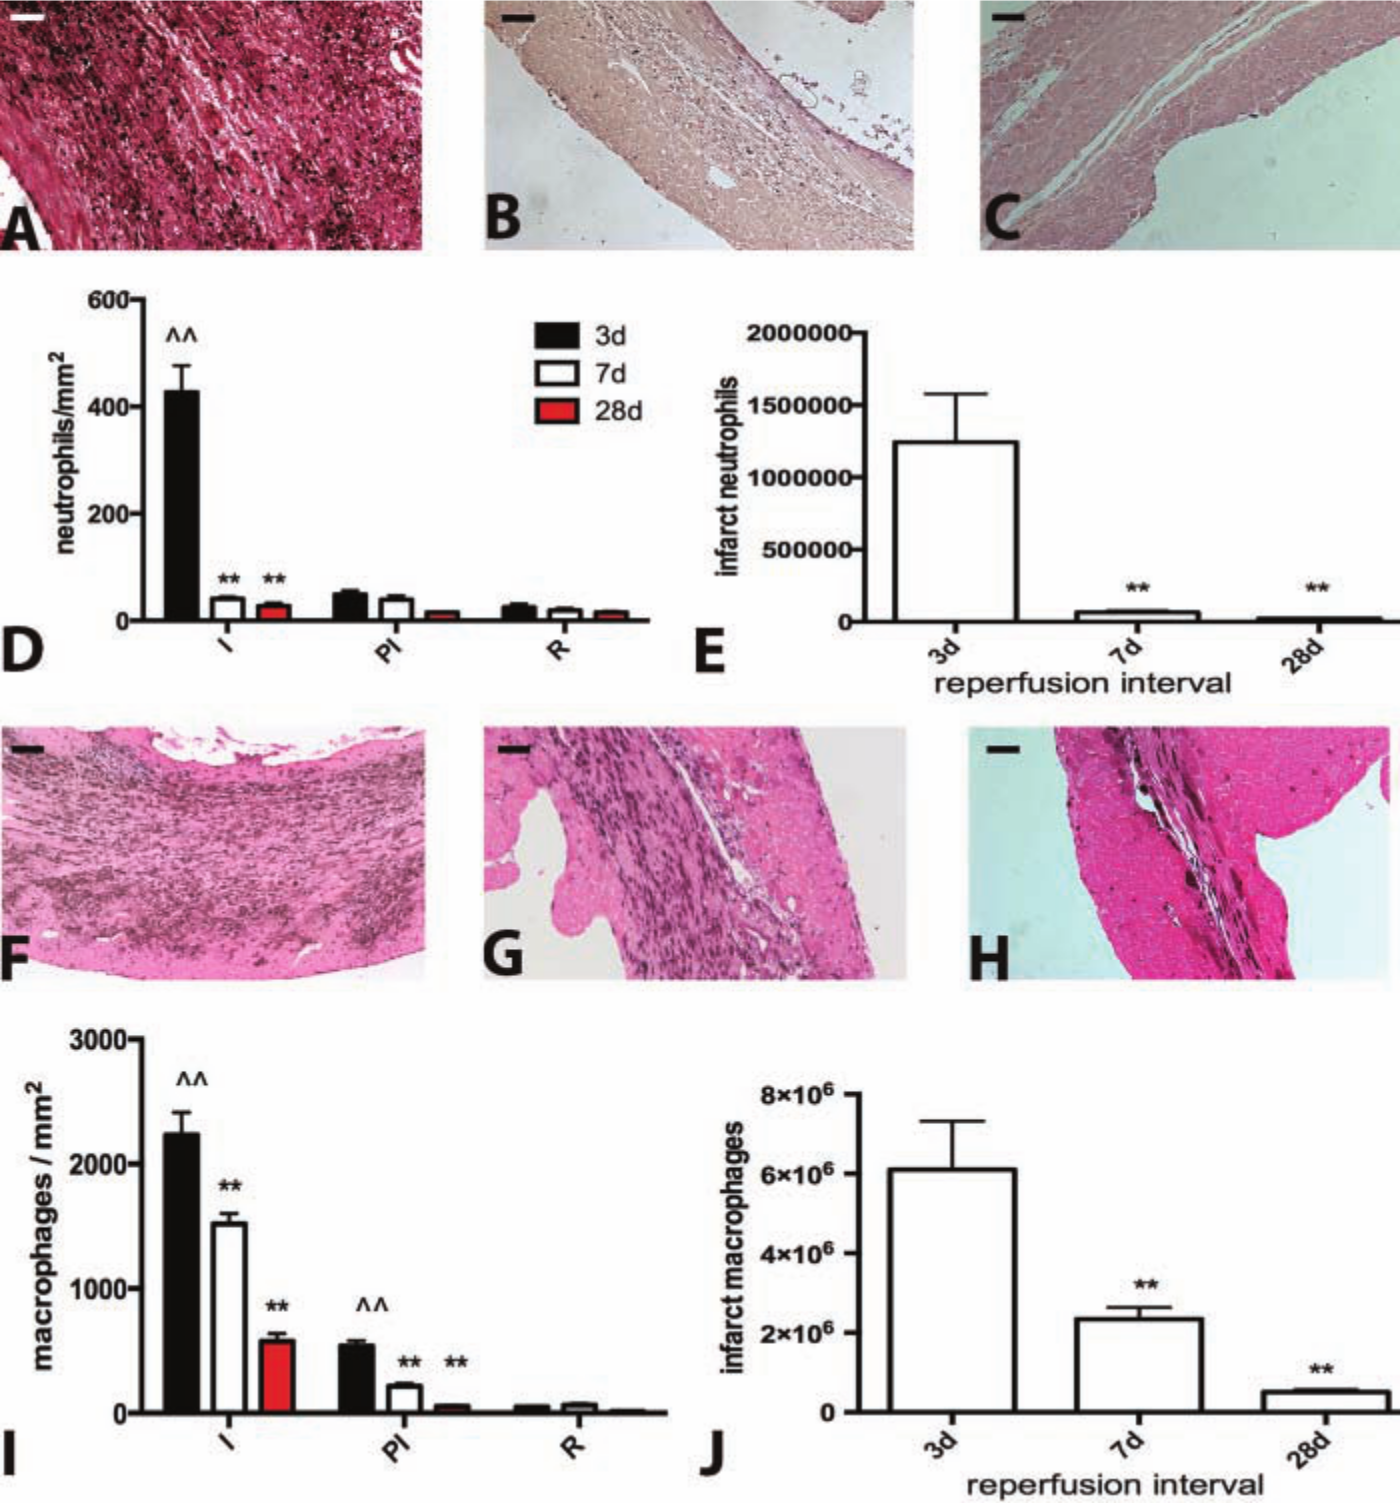
Reperfused infarction in the mouse is associated with marked but transient infiltration of the infarct with neutrophils and macrophages. A-C: Neutrophil immunohistochemistry in the infarcted mouse heart after 3 days (A), 7 days (B), and 28 days of reperfusion (C). D: Neutrophil density in the infarcted area (I) is markedly higher than in remote noninfarcted areas (R) (^^p<0.01 vs corresponding R) after 3 days of reperfusion, but decreases significantly after 7–28 days as the postinfarction inflammatory reaction resolves (**p<0.01 vs 3-day infarcts). Neutrophil infiltration in the peri-infarct area (PI) is low and the density is comparable with the remote remodeling myocardium (R). E. Quantitative analysis of the total number of neutrophils in the infarcted heart. Intense infiltration of the infarct with neutrophils after 3 days of reperfusion is followed by marked reduction after 7–28 days (**p<0.01 vs 3-day infarct). F-H: Immunohistochemical identification of macrophages using staining for Mac-2 after 3 days (I), 7 days (J) and 28 days of reperfusion (K). I; Macrophage density in the infarcted and remodeling heart. Macrophage density in the infarcted area (I) after 3–7 days of reperfusion is significantly higher than in remote noninfarcted areas (R) (^^p<0.01 vs corresponding R). Macrophage density in the infarct is significantly reduced as the scar matures after 7–28 days of reperfusion (**p<0.01 vs 3-day infarct). Macrophage density in the peri-infarct area (PI) is higher than that in the remodeling myocardium (R) after 3 days of reperfusion (^^p<0.01 vs corresponding R), but is significantly reduced after 7–28 days of reperfusion (**p<0.01 vs corresponding 3-day peri-infarct area density). J: Quantitative analysis of total infarct macrophage numbers showed that the marked accumulation of macrophages in the infarct after 3d of reperfusion is followed by a progressive reduction in macrophage numbers after 7–28 days (**p<0.01 vs 3-day infarct) (sham n=8, 3d n=8, 7d n=13, 28d n=12). Bars A-C; F-H = 0.1 mm.
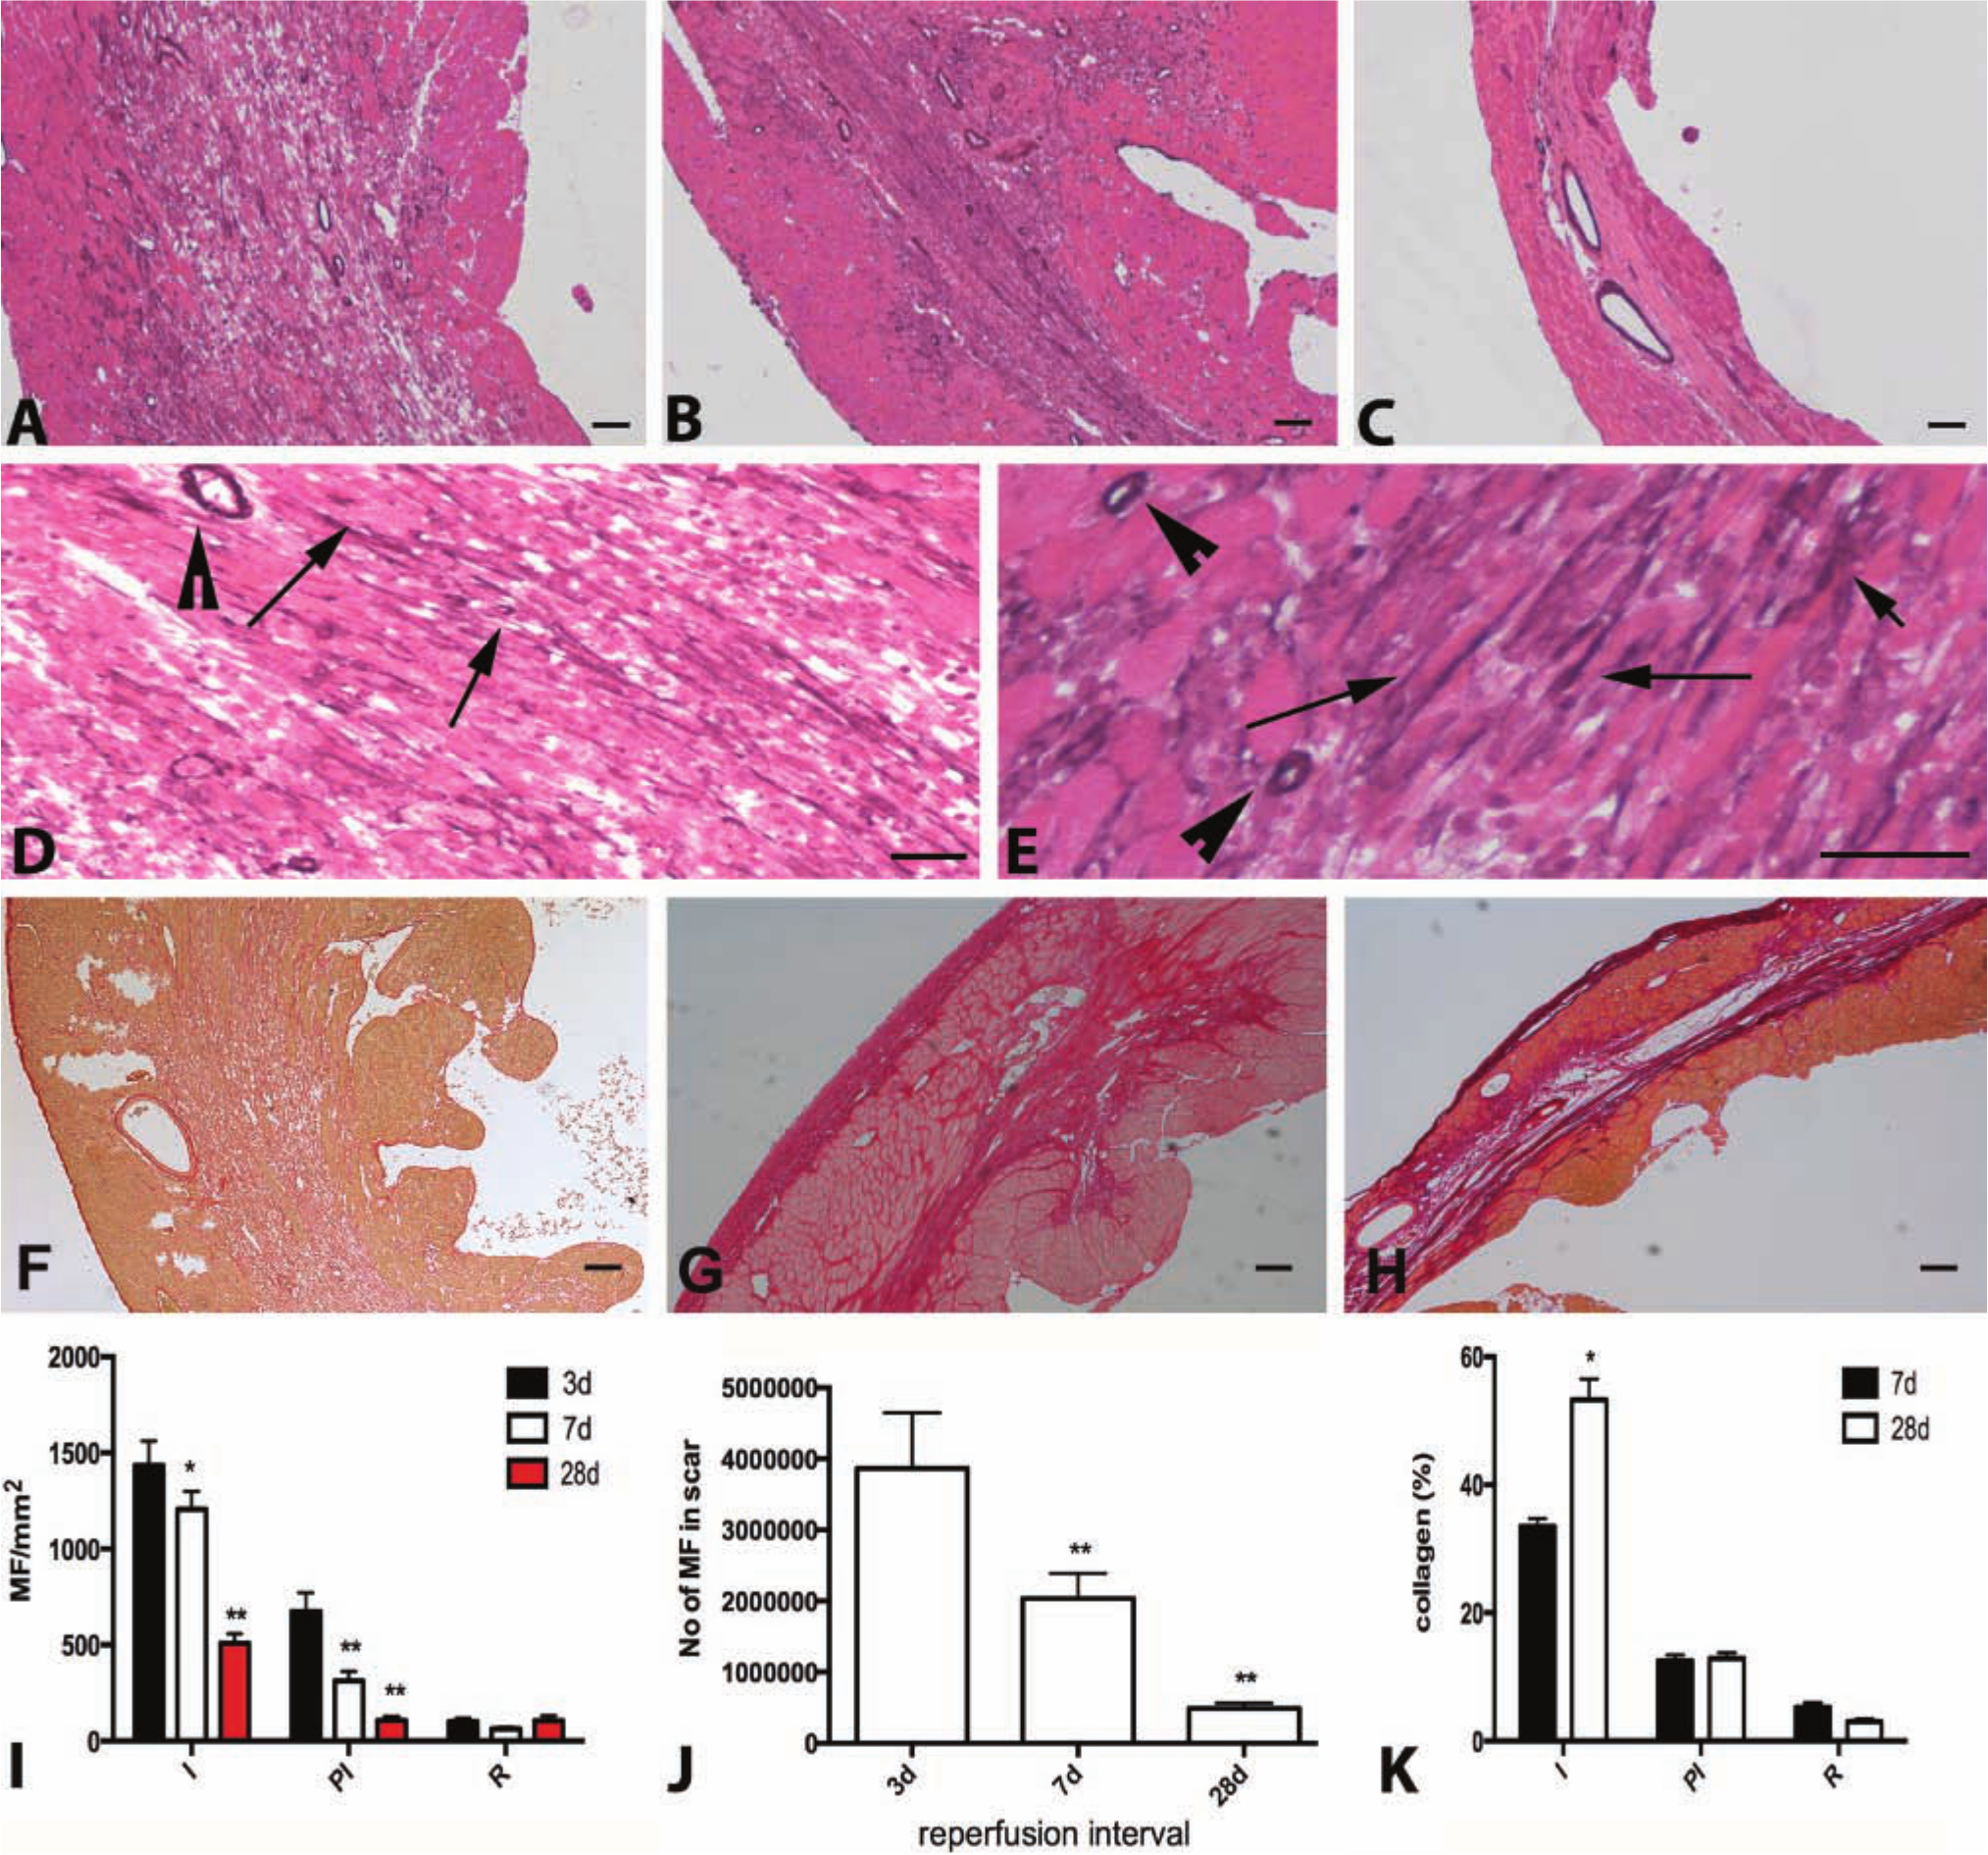
The fibrotic response in reperfused murine myocardial infarction. A-C: Staining for α-smooth muscle actin identifies infarct myofibroblasts as spindle-shaped cells located outside the media of vessels (arrows) after 3 days (A), 7 days (B) and 28 days (C) of reperfusion. D-E: High magnification images show α-SMA immunoreactivity in infarct myofibroblasts after 3 days of reperfusion (arrows). Smooth muscle cells also showed intense α-SMA staining (arrowheads). F-H: Sirius red staining identifies the collagen network in the healing infarct after 3 days (F), 7 days (G) and 28 days (H) of reperfusion. I: Quantitative analysis of myofibroblast density in the infarct (I), peri-infarct area (PI) and remote remodeling myocardium (R). Myofibroblast density in the infarct is significantly higher in the infarcted area after 3–28 days of reperfusion as compared with corresponding non-infarcted remote remodeling areas (^^p<0.01 vs corresponding R). Infarct myofibroblast density peaks after 3 days of reperfusion and is significantly decreased as the scar matures (*p<0.05, **p<0.01 vs 3-day infarcts). Myofibroblast density in the peri-infarct area after 3 and 7 days of reperfusion is higher than that in remote areas (^^p<0.01, ^p<0.05 vs corresponding remote myocardium). J: Quantitation of the total number of infarct myofibroblasts in the infarct shows a progressive reduction in infarct myofibroblasts as the scar matures (**p<0.01 vs 3-day infarcts). K: Quantitative analysis of the collagen-stained area in the infarcted myocardium. Collagen content is markedly higher in the infarcted area (I) as compared with the remote (R) remodeling myocardium (^^p<0.01 vs corresponding R). As the scar matures after 28 days of reperfusion, collagen content in the infarcted area increases (*p<0.05 vs 7-day infarct). After 7–28 days of reperfusion, the peri-infarct (PI) area has significantly higher collagen content than the remote remodeling myocardium (^^p<0.01 vs corresponding R) (sham n=8, 3d n=8, 7d n=13, 28d n=12). Bars A-C, F-H = 100 µm; D-E = 40 µm.
Expression of Inflammatory Cytokines and Growth Factors in Reperfused Mouse Infarcts
To better define the transition of the reparative response from the inflammatory phase to matrix deposition, we studied the time course of proinflammatory and fibrogenic cytokine expression in the infarcted myocardium. Myocardial expression of the proinflammatory cytokines TNF-α, IL-1β and IL-6 peaked after 6 hr of reperfusion (Fig. 5A-C). At the peak of the inflammatory phase, cardiac TNF-α mRNA levels were 3-fold higher than in sham hearts. IL-1β and IL-6, on the other hand, showed a much more impressive upregulation, exhibiting more than 20-fold increase in myocardial mRNA levels in comparison with sham hearts (Fig. 5B-C). Expression of proinflammatory cytokines decreased significantly after 24–72 hr of reperfusion reflecting repression of acute inflammation and transition to the proliferative phase of cardiac repair. As levels of proinflammatory cytokines decreased, inhibitory and fibrogenic mediators (such as TGF-β1 and TGF-β2 and IL-10) showed a rapid and persistent upregulation in the infarcted myocardium after 6–72 hr of reperfusion (Fig. 5D-E, G). TGF-β3 had a distinct time course of upregulation, exhibiting a marked late induction after 72 hr of reperfusion (Fig. 5F). Increased levels of fibrogenic mediators were associated with upregulation of both matricellular (OPN) and structural (collagen α1 chain) extracellular matrix proteins (Fig. 5I, J).
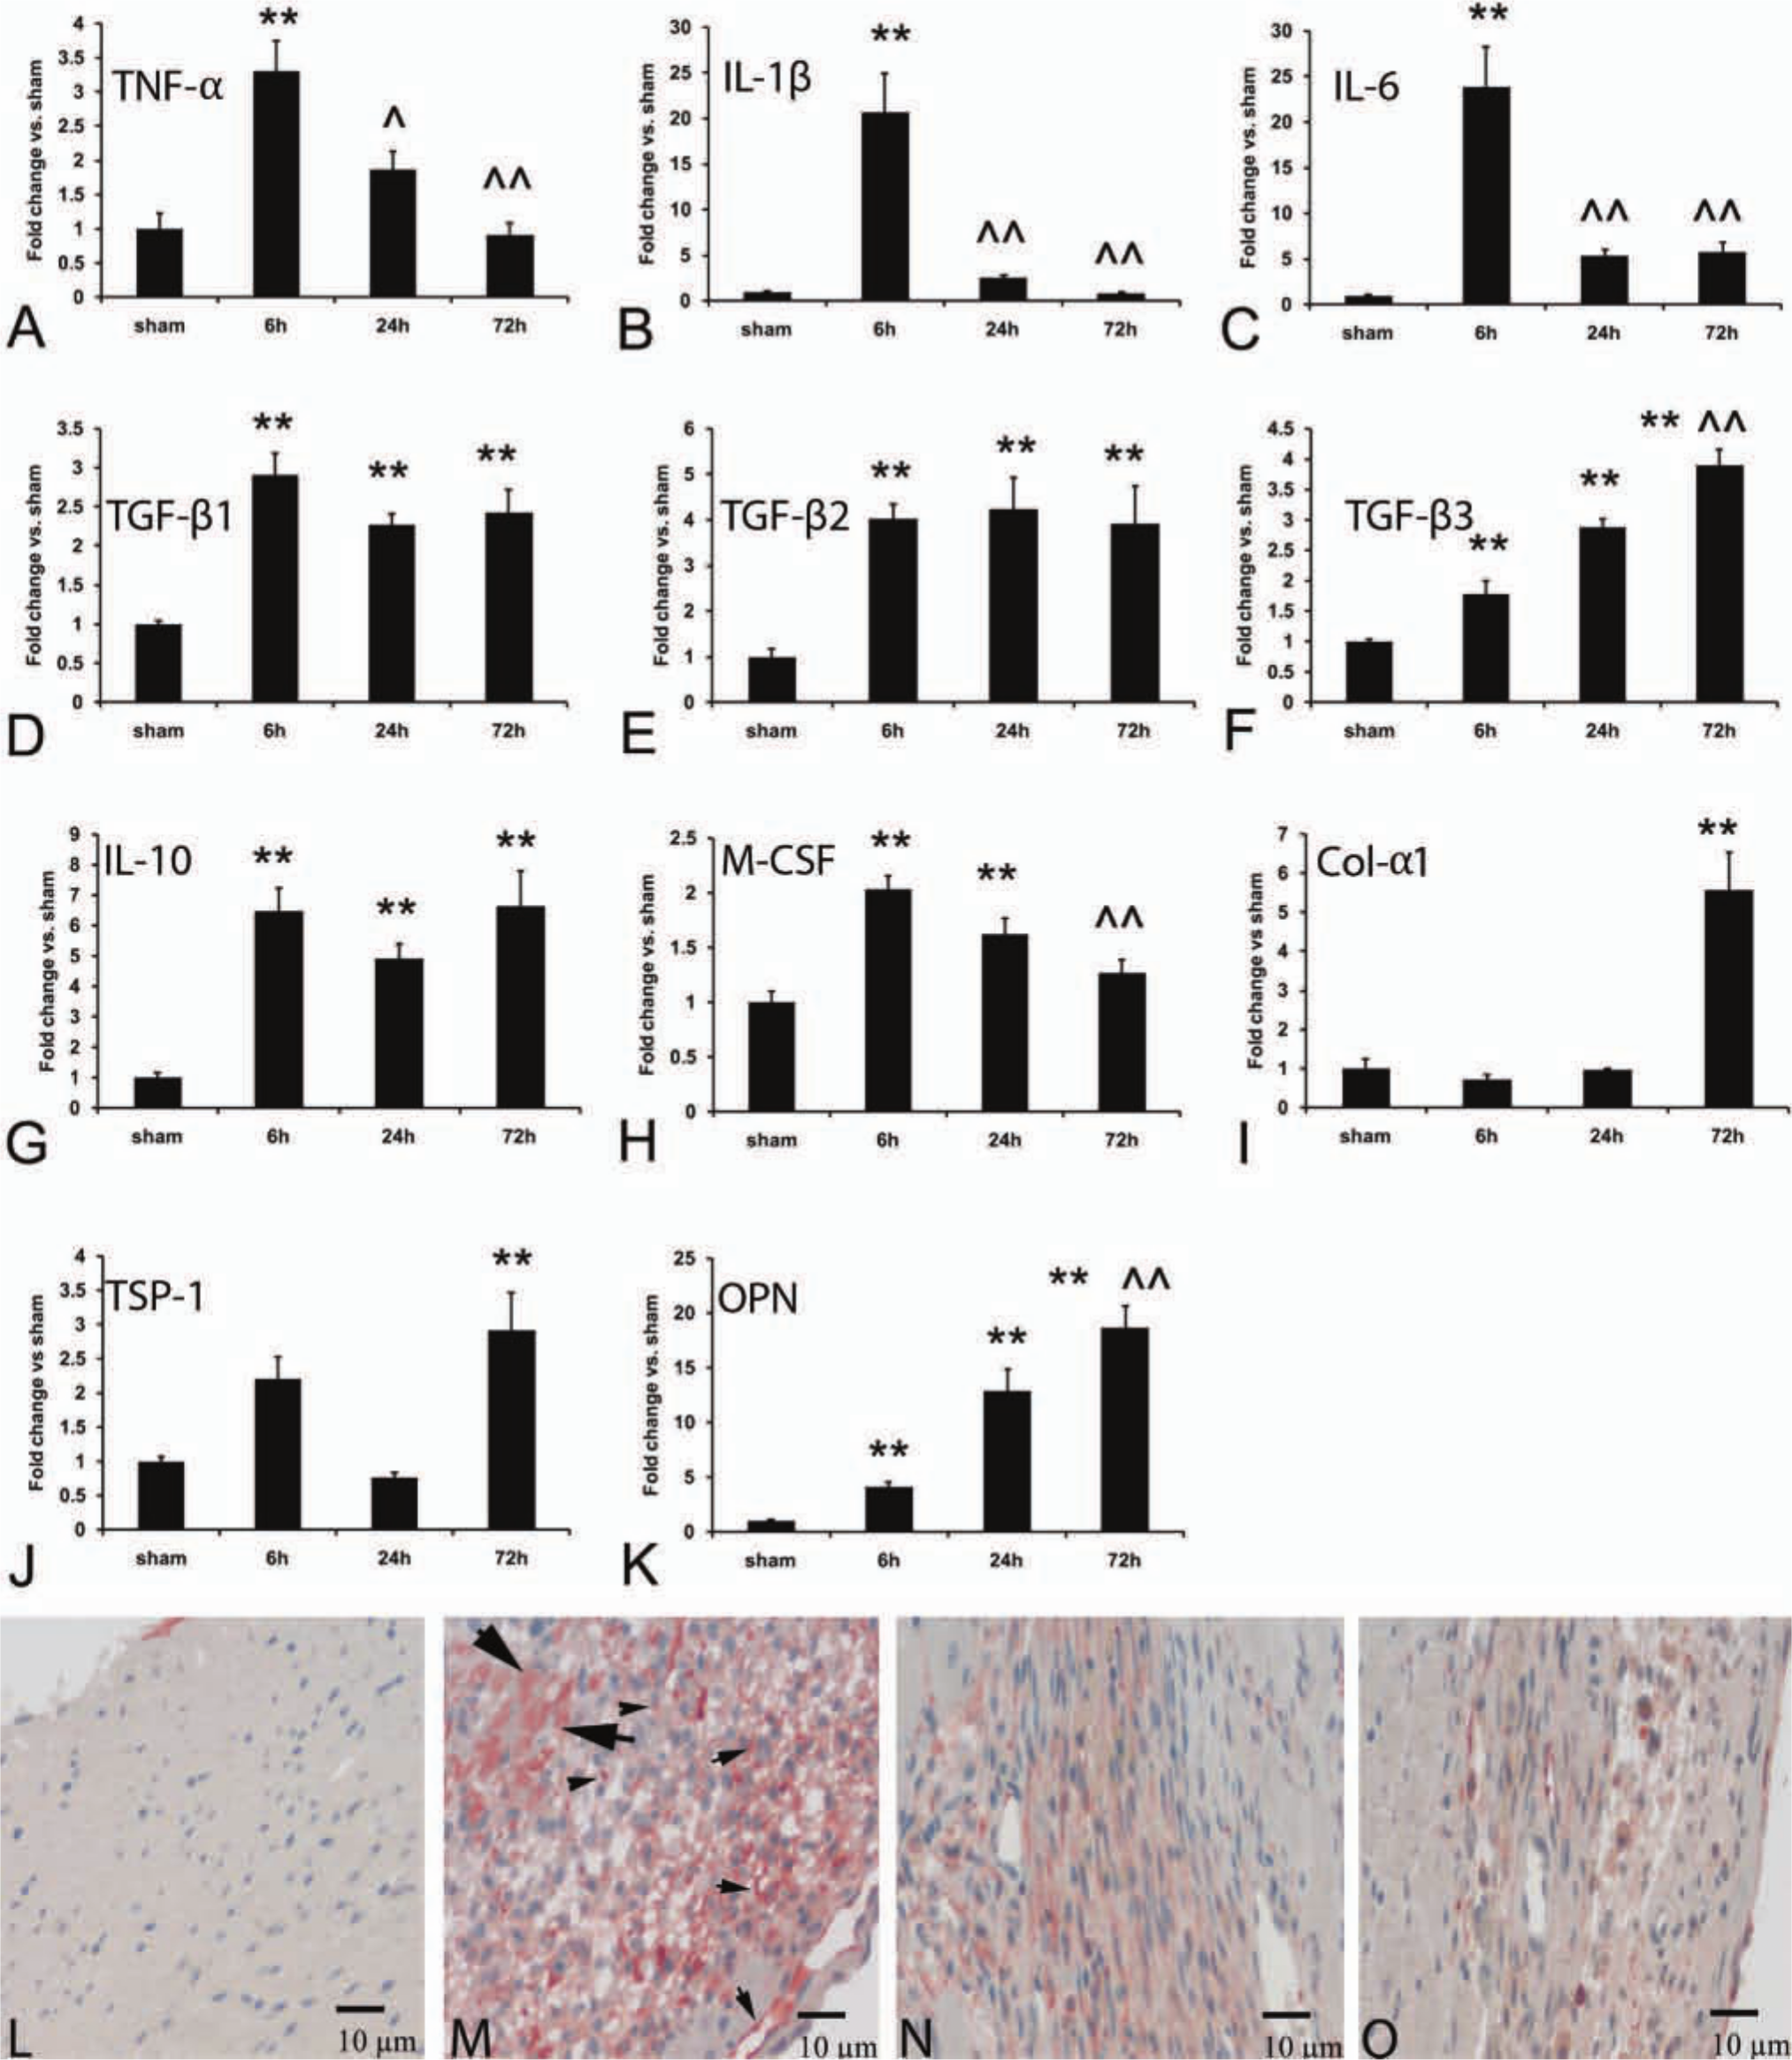
Time course of cytokine and extracellular matrix protein upregulation in reperfused mouse infarcts. A-C. Myocardial mRNA expression of the proinflammatory cytokines TNF-α (A), IL-1β (B) and IL-6 (C) is markedly upregulated after 6 hr of reperfusion (**p<0.01 vs sham). Peak IL-1β and IL-6 levels are increased more than 20-fold in the infarcted heart; in contrast, TNF-α induction is less impressive. Proinflammatory cytokine mRNA expression is reduced after 24–72 hr of reperfusion (^^p<0.01 vs 6 hr reperfusion interval), suggesting rapid repression of the inflammatory response. D-F: TGF-β isoform upregulation in the infarcted myocardium. TGF-β1 (D) and TGF-β2 (E) show rapid but persistent induction after 6–72 hr of reperfusion. In contrast, TGF-β3 (F) mRNA levels progressively increase, showing a late peak after 72 hr of reperfusion (^^p<0.01 vs 6 hr reperfusion interval). G: IL-10 mRNA expression also shows a rapid and prolonged upregulation. H: M-CSF levels increase after 6 hr of reperfusion, but are significantly reduced after 72 hr. I-K: Upregulation of structural (collagen) and matricellular (TSP-1 and OPN) extracellular matrix proteins in the infarcted myocardium. Collagen α1 chain (I) and TSP-1 levels (J) significantly increase after 72 hr of reperfusion. OPN (K) shows a rapid upregulation after 6 hr of reperfusion followed by a progressive increase in expression during the transition to the proliferative phase of healing (sham n=14, 6 hr n=16, 24 hr n=14, 72 hr n=12). L-O: Immunohistochemical staining for IL-1β in sham (L) and infarcted mouse hearts. IL-1β expression is negligible in sham myocardium (L), but is markedly increased in the infarct after 3 days of reperfusion (M) and is localized in cells with morphological characteristics of inflammatory leukocytes and vascular cells. Some cardiomyocytes in the infarct also exhibit IL-1β immunoreactivity. After 7 (N) and 28 days (O) of reperfusion, IL-1β staining in the infarct is significantly reduced. Bars L-O = 10 µm.
Immunohistochemical staining demonstrated negligible expression of IL-1β in sham myocardium (Fig. 5L). IL-1β immunoreactivity was markedly increased after 3 days of reperfusion and was localized in cells with morphological characteristics of leukocytes, fibroblasts, and vascular cells (Fig. 5M). Moreover, occasional cardiomyocytes in the infarct zone showed IL-1β immunoreactivity; this may reflect cytokine synthesis by activated cardiac myocytes, or binding to the cell surface. IL-1β expression was markedly decreased after 7–28 days of reperfusion (Fig. 5N, O).
Infarcted Mouse Hearts Exhibit Cardiac Hypertrophy, Progressive Dilative Remodeling, and Dysfunction
Infarct healing was associated with extensive dilative and hypertrophic remodeling of the ventricle: as the infarct heals the chamber dilates, whereas noninfarcted segments undergo hypertrophy. Morphometric analysis showed that reperfused mouse infarcts exhibited a significant increase in LVEDV after 7 days of reperfusion; chamber dilation increased further after 28 days of reperfusion (Fig. 6A-B). Echocardiographic analysis also demonstrated significant dilative remodeling of the infarcted heart, as evidenced by significantly increased LVEDD and LVESD after 7 days of reperfusion in comparison to preinfarction values (Table 1). The increase in LVEDD and LVESD was significantly higher after 28 days of reperfusion (Tables 1, 2) reflecting the progression of the remodeling process. Morphometrically derived LVEDV correlated well with LVEDD, as assessed through M-mode echocardiography (r = 0.74, p<0.01, n=35); this suggests that both methods provide comparable information on the assessment of dilative remodeling. Remodeling of infarcted hearts was associated with a marked decrease in FS, indicating LV systolic dysfunction (Table 1). Serial assessment of echocardiographic parameters (Fig. 6D) demonstrated that, although the infarcted ventricle dilated more rapidly during the first week after infarction, chamber dilation continued for at least 4 weeks after the acute event. LVEDV increased by 30%±9.1 after the first 7 days of reperfusion, whereas the increase in LVEDV during the second week was 9.96%±4.82 (p=0.05 vs ΔLVEDV 7d) and the mean increase during the third and fourth week was 14.04%±4.61 (Table 2).
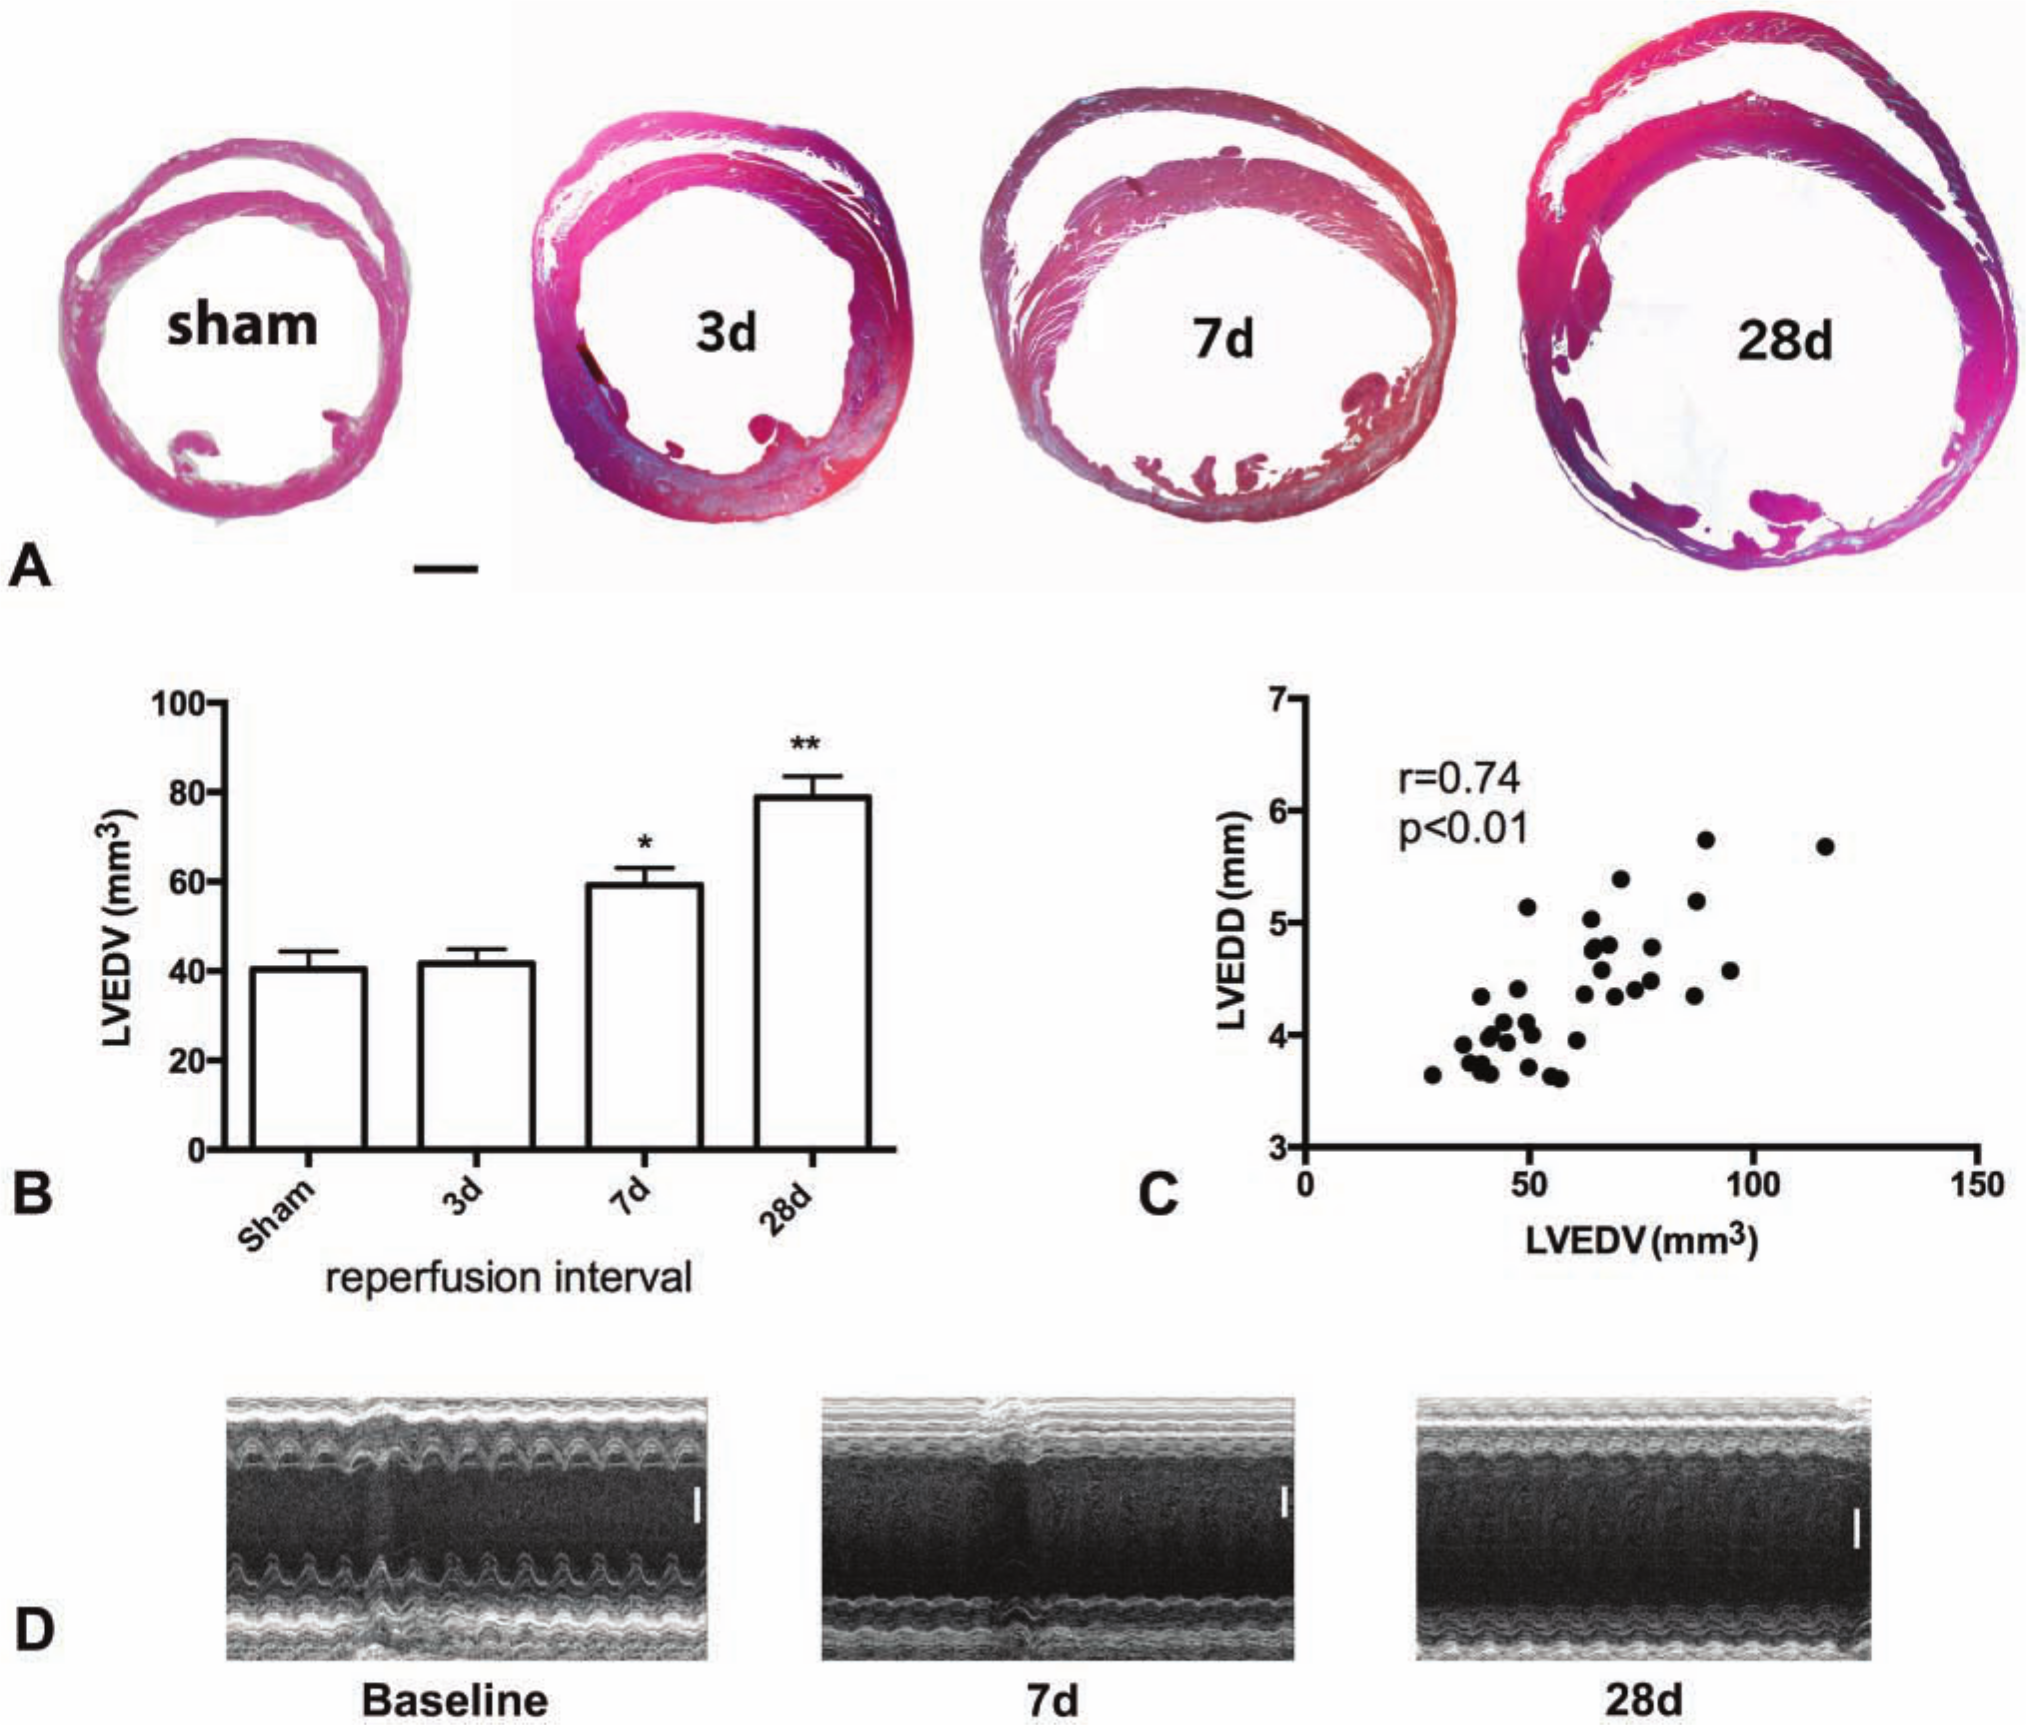
Time course of adverse remodeling of the infarcted mouse heart. A: Morphometric analysis using perfusion-fixation demonstrated that the ventricle dilates significantly after 7 days of reperfusion and exhibits further enlargement after 28 days. B: Quantitative analysis showed that left ventricular end-diastolic volume (LVEDV) significantly increases after 7–28 days of reperfusion (*p<0.05, **p<0.01 vs sham). C: Morphometrically derived LVEDV correlated well with LVEDD measurements obtained through echocardiography in the same animals (r = 0.74, p<0.01) (sham n=8, 3d n=8, 7d n=13, 28d n=12). D Serial echocardiographic assessment of left ventricular remodeling following infarction. Representative images are shown at baseline and after 7 and 28 days of reperfusion. Quantitative analysis of the findings is shown in Table 1 (n=10). Bars A = 0.5 mm; D = 1 mm.
Echocardiographic Parameters in Infarcted Mice.
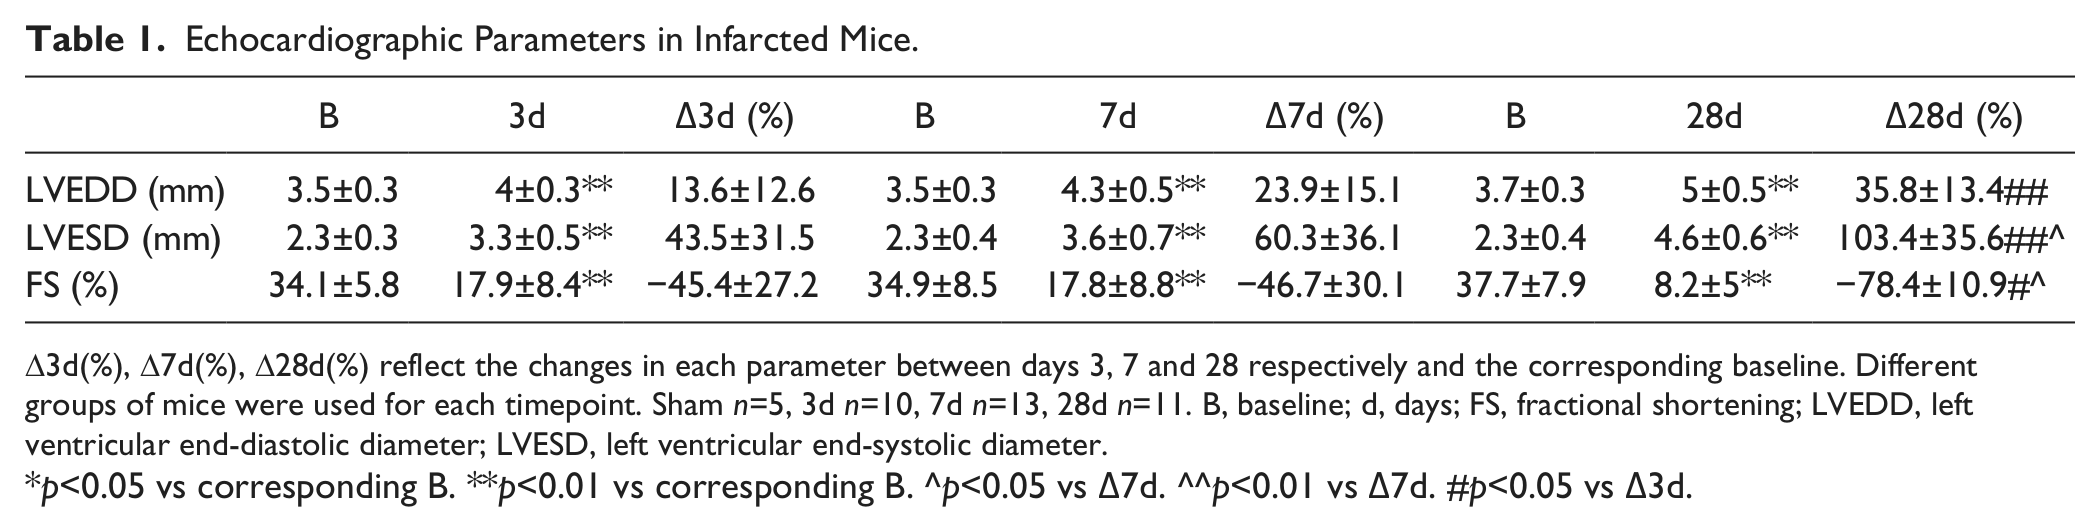
D3d(%), D7d(%), D28d(%) reflect the changes in each parameter between days 3, 7 and 28 respectively and the corresponding baseline. Different groups of mice were used for each timepoint. Sham n=5, 3d n=10, 7d n=13, 28d n=11. B, baseline; d, days; FS, fractional shortening; LVEDD, left ventricular end-diastolic diameter; LVESD, left ventricular end-systolic diameter.
p<0.05 vs corresponding B. **p<0.01 vs corresponding B. ^p<0.05 vs Δ7d. ^^p<0.01 vs Δ7d. #p<0.05 vs Δ3d.
Serial Assessment of Echocardiographic Parameters in Infarcted Mice.
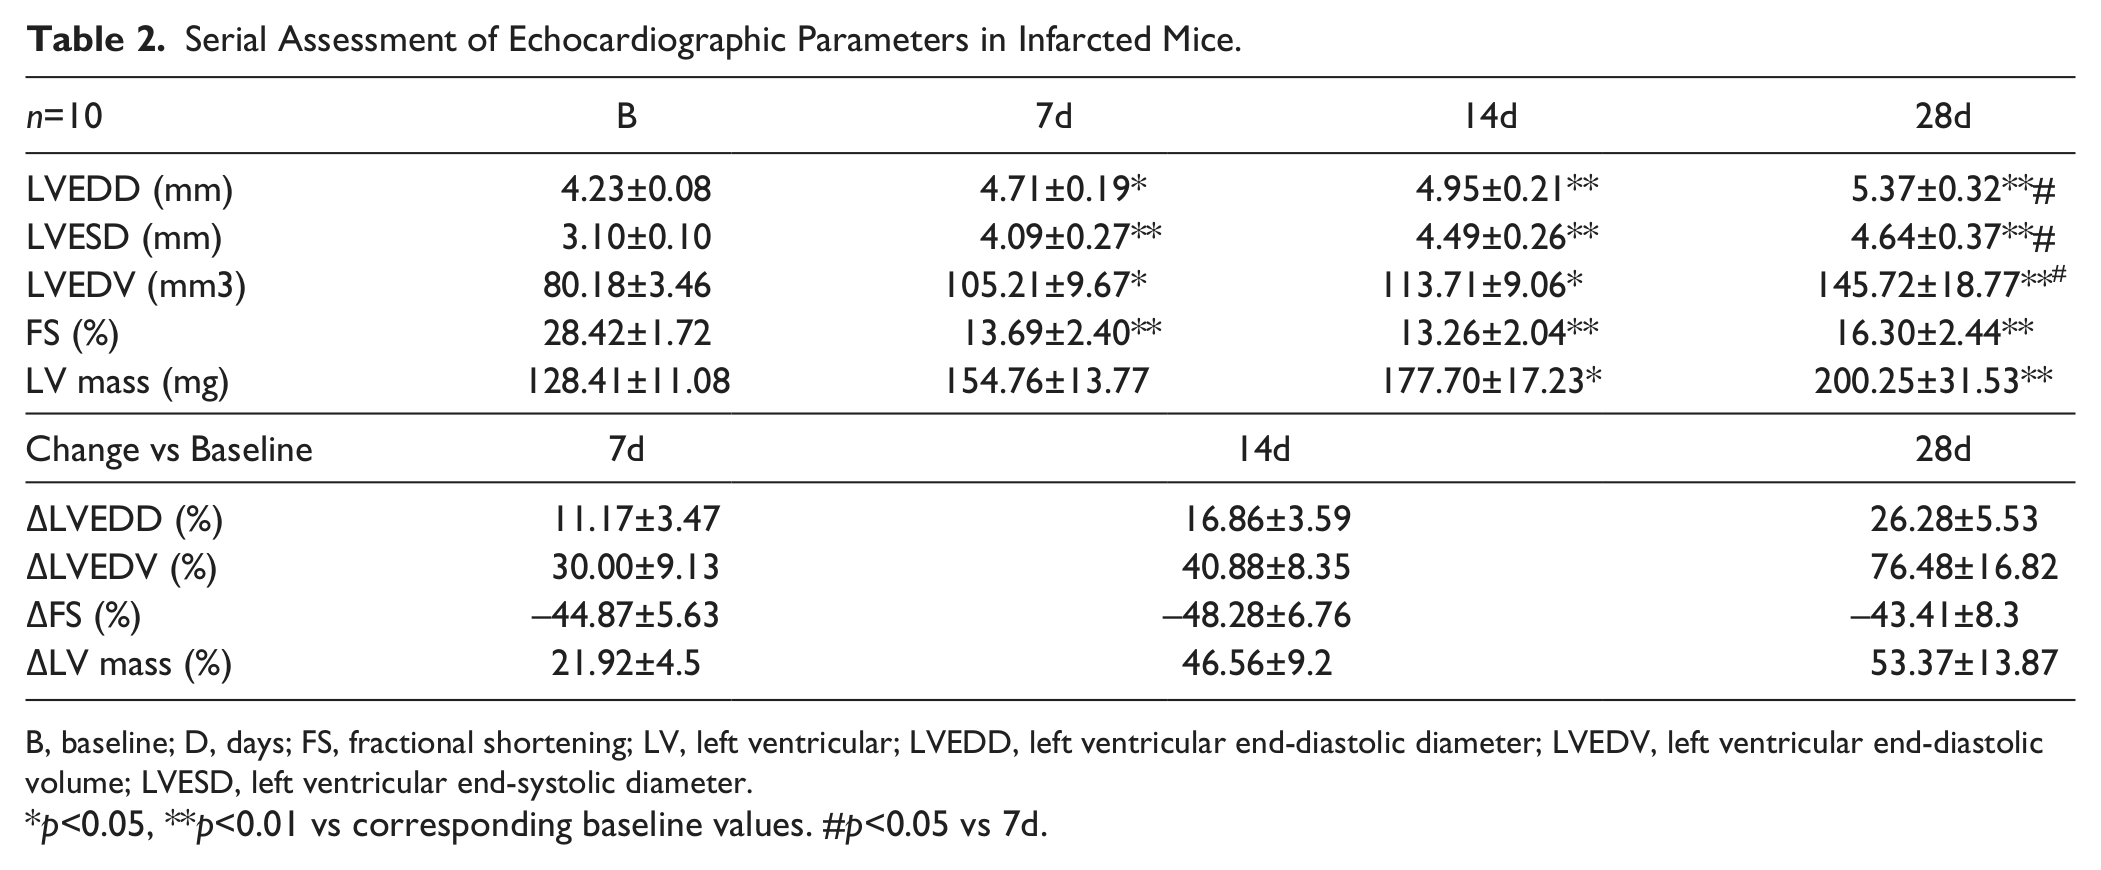
B, baseline; D, days; FS, fractional shortening; LV, left ventricular; LVEDD, left ventricular end-diastolic diameter; LVEDV, left ventricular end-diastolic volume; LVESD, left ventricular end-systolic diameter.
p<0.05, **p<0.01 vs corresponding baseline values. #p<0.05 vs 7d.
Cardiomyocyte Hypertrophy in the Remodeling Infarcted Myocardium
Surviving cardiomyocytes in the remodeling noninfarcted myocardium exhibited progressive hypertrophy (Fig. 7). Quantitative analysis showed that the mean cardiomyocyte CSA in the noninfarcted subepicardial and subendocardial region of the LV anterior wall markedly and progressively increased after 3–28 days of reperfusion (Fig. 7A-D, 7I). In the remodeling posterior septum, cardiomyocyte CSA was also significantly increased after 7–28 days of reperfusion (Fig. 7E-H, 7J); however, cardiomyocyte size was lower than that in the spared subepicardial and subendocardial areas adjacent to the infarct (Fig. 7I, J). The accelerated increase in CSA of the anterior wall cardiomyocytes may indicate a more rapid time course of hypertrophy in the PI, or may reflect geometric distortion of border zone myocytes neighboring the infarct.
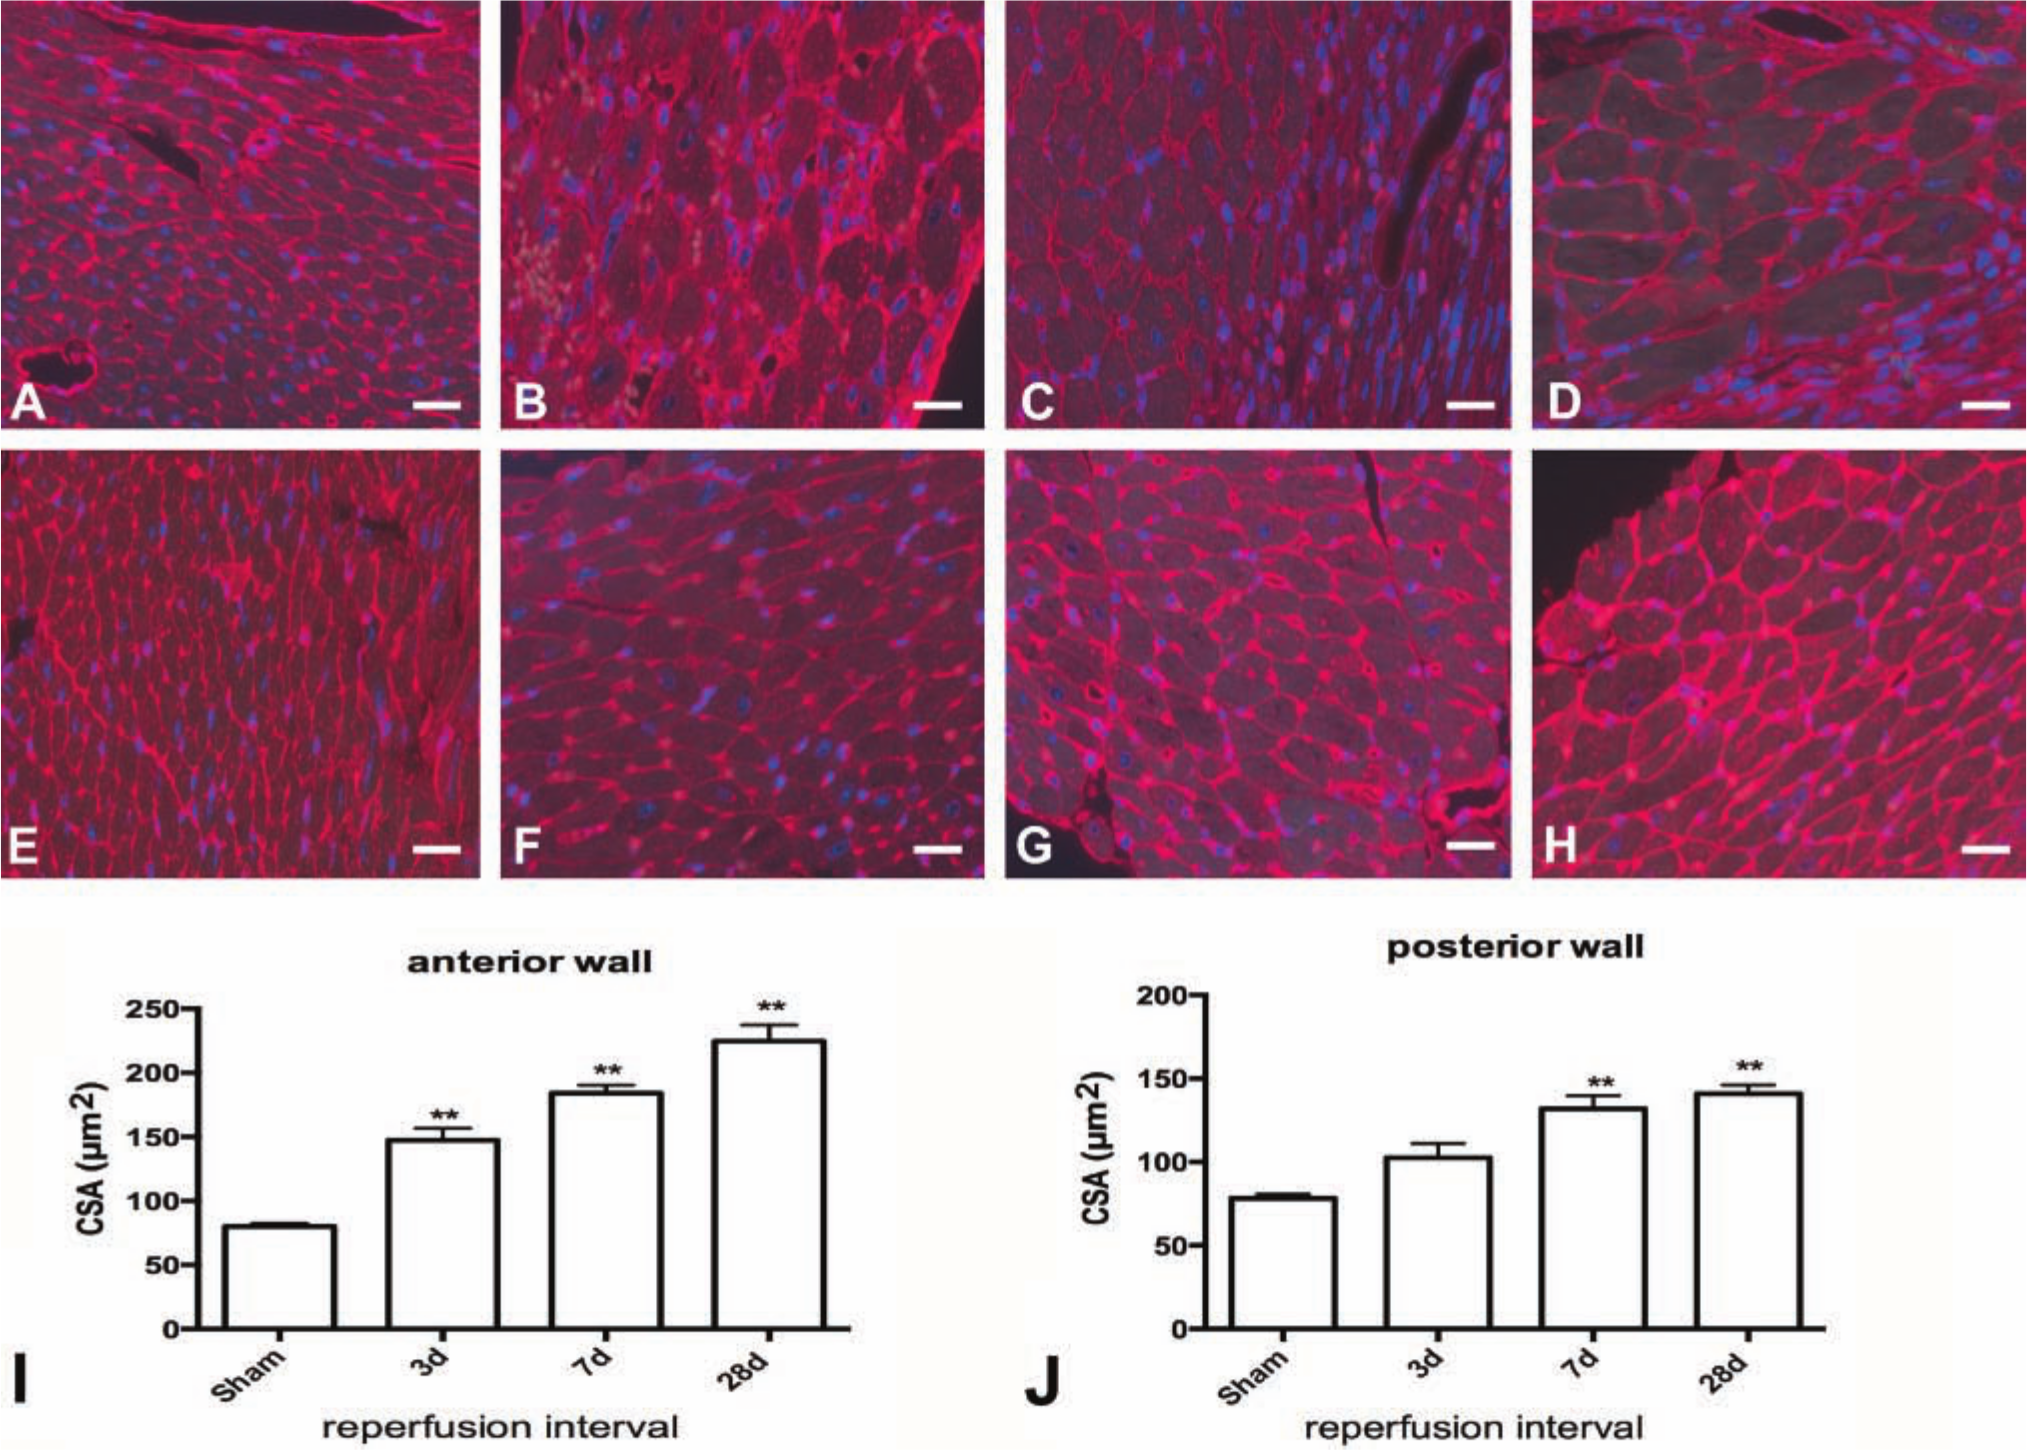
Cardiomyocyte hypertrophy in the remodeling noninfarcted myocardium. Cardiomyocyte cross-sectional area was assessed in the noninfarcted subendocardial and subepicardial areas using WGA lectin staining. Representative stained sections from the anterior infarcted wall (A-D) and the posterior wall (E-H) are shown is a sham animal (A, E) and in infarcted mice after 3 days (B, F), 7 days (C, G), and 28 days of reperfusion (D, H). I-J: Quantitative analysis showed that cardiomyocyte cross-sectional area (CSA) in the noninfarcted subepicardium of the anterior wall significantly increased after 3–28 days of reperfusion (**p<0.01 vs sham) J: In the noninfarcted posterior wall, CSA increased after 7–28 days of reperfusion (sham n=8, 3d n=8, 7d n=13, 28d n=12). Bars A-H = 20 µm.
Assessment of Hemodynamic Parameters Following Myocardial Infarction Suggests Systolic and Diastolic Dysfunction
Invasive hemodynamic assessment demonstrated that the first derivative of LV pressure over time (dp/dtmax), an indicator of systolic function, was significantly reduced after 28 days of reperfusion (Table 3). A weak, but significant, correlation between dp/dtmax and echocardiographically derived FS was noted (r = 0.34, p<0.05) (Fig. 8A). Infarcted mice also had evidence of diastolic dysfunction. After 3 days of reperfusion LVEDP and τ were significantly higher in comparison with that in sham animals (Table 3), whereas –dp/dtmax was markedly reduced (Table 3). LVEDP and τ remained elevated and –dp/dtmax remained reduced after 7–28 days of reperfusion indicating persistent impairment of diastolic function in the remodeling heart.
Hemodynamic Parameters Following Myocardial Infarction.
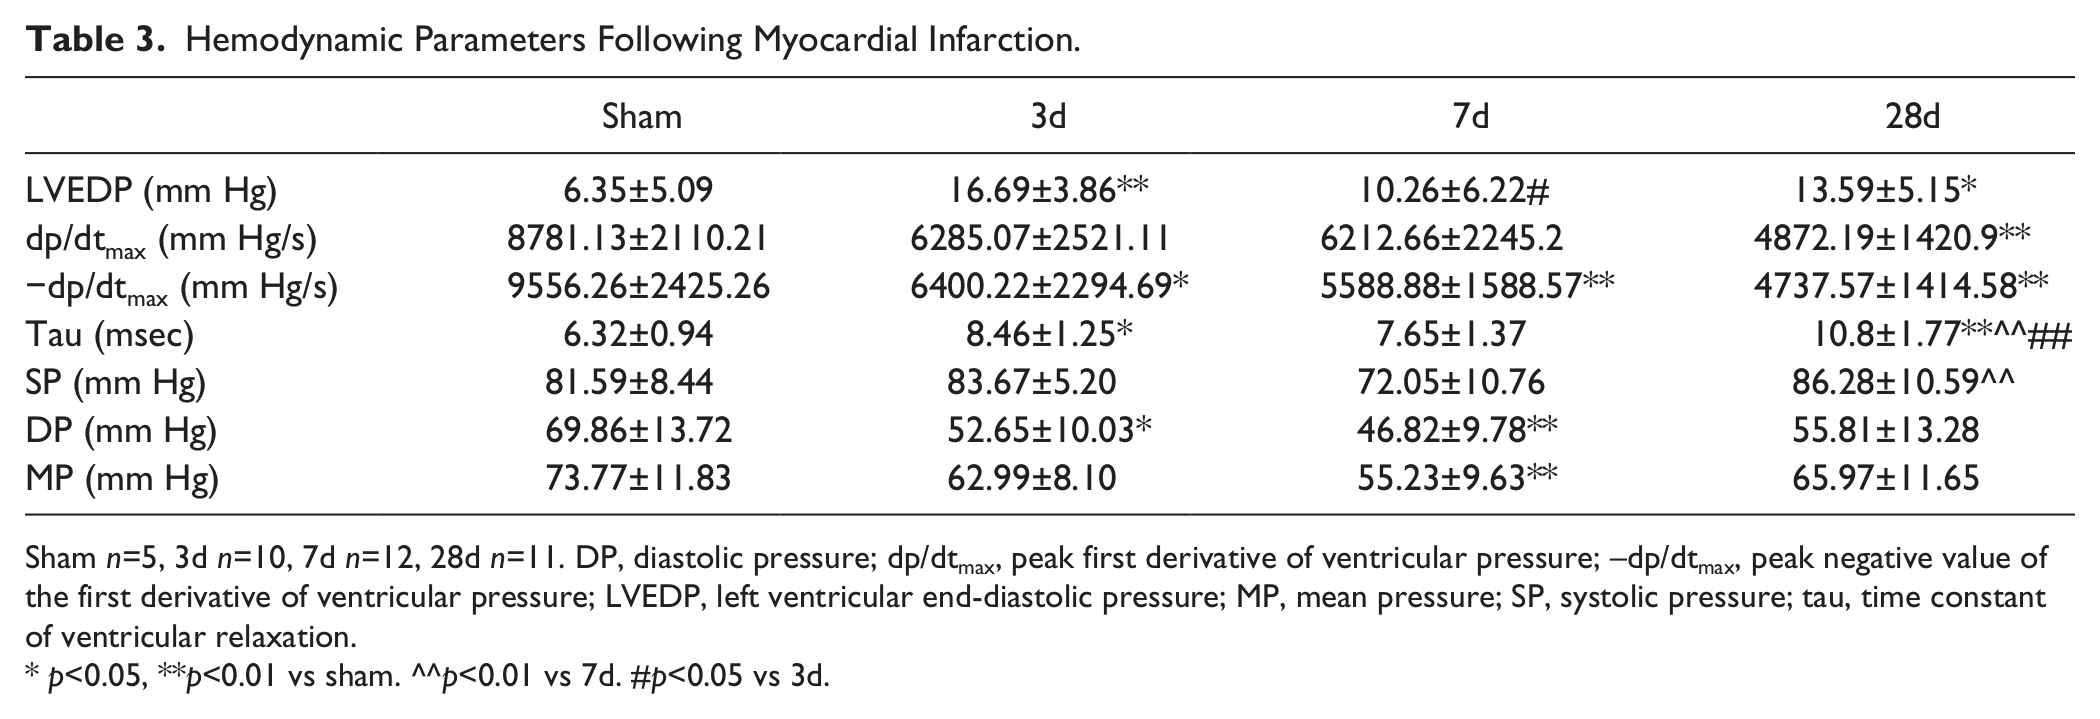
Sham n=5, 3d n=10, 7d n=12, 28d n=11. DP, diastolic pressure; dp/dtmax, peak first derivative of ventricular pressure; –dp/dtmax, peak negative value of the first derivative of ventricular pressure; LVEDP, left ventricular end-diastolic pressure; MP, mean pressure; SP, systolic pressure; tau, time constant of ventricular relaxation.
p<0.05, **p<0.01 vs sham. ^^p<0.01 vs 7d. #p<0.05 vs 3d.
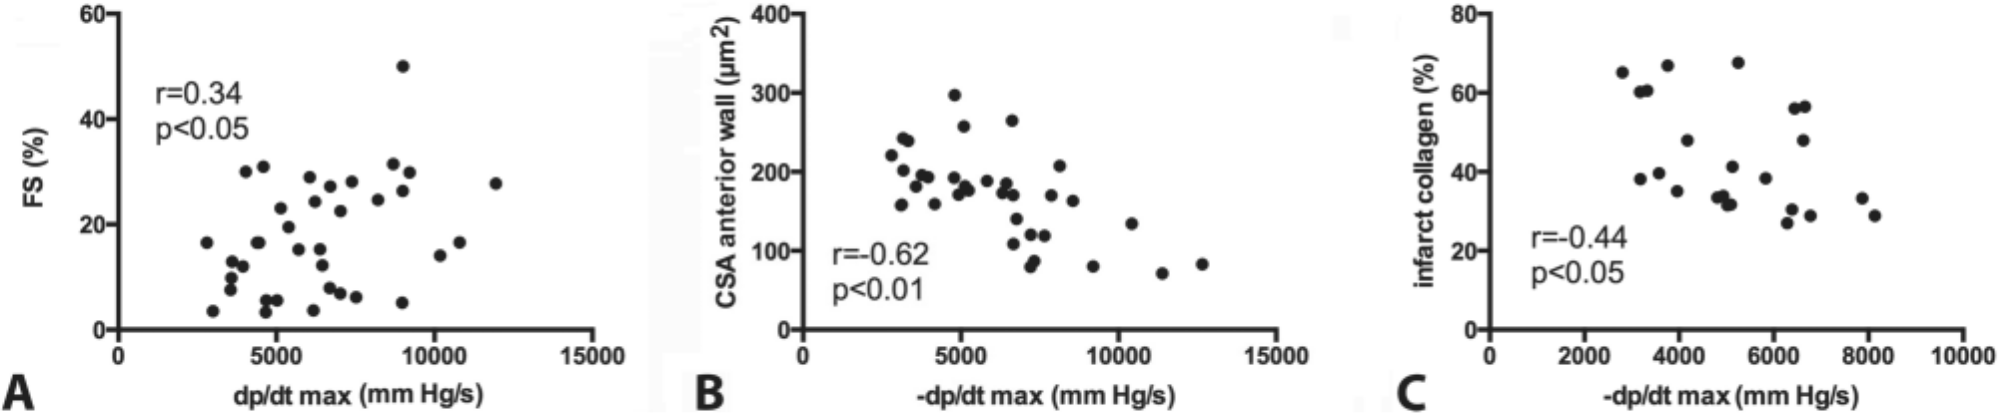
Relationship among diastolic dysfunction, fibrosis, and hypertrophy in the infarcted heart. A: There was a good correlation (r = 0.34, p<0.05, n=36) between dp/dtmax, assessed through invasive hemodynamic monitoring, and echocardiographically measured fractional shortening (FS). B. –dp/dtmax an indicator of diastolic function had a strong negative correlation with cardiomyocyte cross-sectional area (CSA) (r = −0.62, p<0.01, n=34), indicating a close relation between hypertrophic remodeling and impaired diastolic function. C. A significant correlation between dp/dtmax and collagen content in the infarcted heart was also noted (r = −0.44, p<0.05, n=23). dp/dtmax, peak first derivative of ventricular pressure; –dp/dtmax, peak negative value of the first derivative of ventricular pressure.
In Reperfused Mouse Infarcts, Indicators of Diastolic Dysfunction Correlate with Collagen Content and Cardiomyocyte Hypertrophy
The severity of diastolic dysfunction was not affected by the size of the infarct, but was dependent on the amount of collagen deposited in the infarcted heart and on the severity of cardiomyocyte hypertrophy. LVEDP, tau, and –dp/dt did not correlate with infarct size and FS (pNS). However, there was a significant correlation between LVEDP and infarct collagen content (r = 0.41, p=0.05). In addition, –dp/dtmax correlated negatively with cardiomyocyte size (Fig. 8B) and with infarct collagen content (Fig. 8C), suggesting that increased scar fibrosis and accentuated hypertrophy of the viable myocardium are associated with worse diastolic dysfunction.
Discussion
Because the adult mammalian heart has negligible regenerative capacity, cardiac repair following myocardial infarction is dependent on an inflammatory reaction that ultimately results in the formation of a collagen-based scar (Ertl and Frantz 2005; Frangogiannis 2012a; Timmers et al. 2012). Following infarction, the inflammatory and reparative responses are closely intertwined with chamber dilation and geometric remodeling of the ventricle. Defects in inflammatory and reparative cascades result in alterations in the mechanical properties of the ventricle and have profound consequences on postinfarction remodeling. Thus, understanding the pathogenesis of cardiac remodeling requires exploration of the role of inflammatory and reparative signals.
Development of genetically targeted mice has greatly contributed to our knowledge of cardiac pathophysiology, allowing dissection of the role of specific molecular signals and signaling pathways in heart disease. However, our ability to use genetically manipulated animals to study a disease process is dependent on development and systematic characterization of a clinically relevant model of the disease. The use of mouse models to explore the pathogenesis of postinfarction remodeling requires the optimal use of suitable methodologies to assess functional, anatomic, molecular, and morphometric endpoints. The rapid heart rate, the small size of the murine heart, and the technical difficulty in instrumentation of the mouse cardiovascular system pose significant challenges in assessing remodeling-associated parameters. Moreover, understanding of the time course of the events associated with healing and remodeling of the infarcted heart is essential for optimal design of experimental studies. Our investigation provides a systematic characterization of an experimental model of reperfused myocardial infarction in the mouse. We establish the optimal time points for assessing structural, cellular and molecular alterations associated with cardiac remodeling and studying the relationship between functional parameters and the composition of the healing scar. Moreover, we highlight for the first time the marked volume loss associated with the healing of mouse infarcts.
The Time Course of the Reparative Response in Reperfused Mouse Infarcts
Reperfused infarction in mice triggers an intense but transient inflammatory reaction (Figs. 3, 5) that is essential for healing of the infarct (Frantz et al. 2009; Frangogiannis 2012a, 2012b). Early induction of proinflammatory cytokines (such as IL-1β, TNF-α, and IL-6; Fig. 5) and chemokines (such as MCP-1; Fig. 5) (Dewald et al. 2005; Frangogiannis 2007) promotes leukocyte activation and extravasation into the infarcted heart. Inflammatory leukocytes, fibroblasts, and vascular cells express IL-1β in the infarcted myocardium (Fig. 5); IL-1β immunoreactivity is also localized in cardiomyocytes reflecting either new cytokine synthesis, or their binding to the surface of injured cardiomyocytes. Infiltrating neutrophils and macrophages clear the wound of dead cells and debris, and produce essential mediators for activation of myofibroblasts and endothelial cells. Because the proinflammatory environment in the early stages of infarct healing promotes matrix degradation and phagocytic clearance of dead cells, repair of the infarcted heart is dependent on endogenous STOP signals that mediate timely resolution of the inflammatory response (Frangogiannis et al. 2005; Dobaczewski et al. 2010). In reperfused mouse infarcts, myocardial expression of proinflammatory cytokine mRNA is significantly downregulated after 24–72 hr of reperfusion, whereas expression of inhibitory and fibrogenic mediators (such as IL-10 and TGF-β) is increased (Hao et al. 1999; Frangogiannis et al. 2000). The transition from the inflammatory to the reparative phase is characterized by recruitment and proliferation of myofibroblasts, resulting in formation of highly cellular granulation tissue (Willems et al. 1994; Ren et al. 2002; Daskalopoulos et al. 2012; Chen and Frangogiannis 2013) (Fig. 4). The time course of the reparative response is accelerated in mice when compared with large mammals (Dewald et al. 2004): After 3 days of reperfusion in mice, the majority of dead cardiomyocytes are replaced by granulation tissue containing abundant myofibroblasts (Fig. 2). Maturation of the infarct follows, as myofibroblasts and vascular cells undergo apoptosis, and the wound becomes progressively thinner. After 28 days of reperfusion, the healing mouse infarct consists of a relatively thin area of scar in the midmyocardium (Figs. 2, 3). Contraction and thinning of the wound are associated with extensive dilation of the left ventricle (Table 1) that progressively increases for the first 4 weeks following reperfused myocardial infarction (Table 2).
What Are the Optimal Time Points to Study Inflammation, Repair, and Remodeling of the Infarcted Mouse Heart?
To optimally investigate the inflammatory and reparative response in the remodeling infarcted mouse heart, a broad range of time points needs to be examined extending from 6 hr to 28 days after the initial event. Study of the postinfarction inflammatory response requires early assessment of mRNA expression of the molecular mediators of inflammation after 6 hr of reperfusion, study of cytokine and chemokine protein expression after 72 hr of reperfusion, and identification of the cellular elements of inflammation after 24–72 hr of reperfusion. To study the proliferative phase, assessment of fibrogenic mediator expression and of myofibroblast infiltration should be performed after 3–7 days of reperfusion. Assessment of cardiac remodeling requires serial measurement of cardiac dimensions for at least 4 weeks after reperfused infarction. It should be noted that these time points apply to reperfused mouse infarcts after 1 hr of coronary occlusion. Because progression of the inflammatory and reparative response in models of permanent coronary ligation is slower, the time course of events in nonreperfused mouse infarcts would be expected to be delayed in comparison to models of reperfused infarction.
Use of Morphometric and Echocardiographic Studies for Assessment of Dilative Remodeling
Our study demonstrates the power of systematic histological analysis of the infarcted heart in examining relationships among cellular responses, structure, function, and geometry of the ventricle. When optimally performed, systematic quantitative morphometry of the perfusion-fixed heart allows reconstruction of the geometry of the entire ventricle and provides accurate measurement of end-diastolic dimensions and wall thickness (Fig. 1). In addition, concurrent immunohistological analyses provide assessment of the size of the scar, quantitative evaluation of the cellular infiltrate and the collagen network, and localization of mediators of interest using immunohistochemical strategies (Fig. 5L-O). Echocardiographic analysis, on the other hand (Fig. 6), has several important advantages, allowing assessment of both systolic and diastolic dimensions in live animals and providing concurrent evaluation of cardiac function. Moreover, serial analysis of functional and anatomic endpoints provides essential information on the dynamic changes observed in the infarcted heart. However, due to the small size of the mouse heart and the eccentric dilative remodeling associated with myocardial infarction, echocardiographic assessment may not adequately assess the cardiac apex, thus lacking accuracy in measurements of chamber volumes. Despite this concern, our study demonstrated a good correlation between morphometric and echocardiographic indicators of cardiac remodeling (Fig. 6), suggesting that both strategies provide comparable information on the extent of cardiac dilation following myocardial infarction.
Functional Assessment of the Infarcted Heart Through the Combined Use of Echocardiographic and Hemodynamic Studies
Myocardial infarction results in development of both systolic and diastolic dysfunction (Tables 1–3). Functional assessment of the infarcted mouse heart poses major challenges related to the small size of the heart, the rapid heart rate, and the segmental distribution of myocardial injury. Echocardiographic analysis of global systolic ventricular function through assessment of FS appears to be accurate and reliable; echocardiographically derived FS shows correlates with the hemodynamically derived dp/dtmax. Hemodynamic assessment is optimal for quantitative measurement of diastolic function. Quantitative assessment of –dp/dtmax and LVEDP suggests that diastolic dysfunction occurs throughout the course of infarct healing (Table 3). At an early stage, diastolic dysfunction may be due to a loss of functional cardiomyocytes and the presence of interstitial edema. At a later stage, a mature collagen-based scar develops and the progressive deposition and cross-linking of collagen may contribute to deterioration of diastolic function (Holmes et al. 2005). The severity of diastolic dysfunction following infarction positively correlates with cardiomyocyte hypertrophy and with collagen content of the scar (Fig. 8B, C), but not with the size of the infarct. This finding highlights the significance of enhanced collagen deposition in increasing stiffness of the ventricle, which leads to elevation of filling pressures in the infarcted heart. Although compliant infarcts have been suggested to impair systolic dynamics, a large noncompliant infarct would be expected to limit diastolic filling and result in diastolic dysfunction (Bogen et al. 1980). Experiments using a rabbit model of nonreperfused infarction demonstrated that passive stiffness of the ventricle correlates with hydroxyproline content over the first week after infarction (Lerman et al. 1983). In contrast, studies in sheep found increased stiffness 1–2 weeks following anteroapical infarction, but did not demonstrate a correlation between infarct stiffness and collagen content, suggesting that additional factors (such as cardiomyocyte alterations) may determine the mechanical properties of the ventricle (Gupta et al. 1994; Holmes et al. 2005).
Unique Characteristics of Cardiac Remodeling in Mouse Models of Reperfused Infarction
In comparison with other species, repair of the infarcted heart in mice exhibits some unique characteristics. First, the time course of the inflammatory and reparative response is accelerated (Dewald et al. 2004), as cytokines and chemokines are rapidly upregulated and dead cardiomyocytes are cleared and replaced with granulation tissue after 72 h of reperfusion. Second, cardiac repair in mice is associated with marked tissue loss and the formation of a thin collagen-based scar (Fig. 2). A 65% reduction in infarct volume is noted between days 3 and 28 after reperfused murine infarction (Fig. 2). Although direct comparison with large animal models is hampered by differences in the characteristics of the experimental models, published evidence suggests that nonreperfused rat infarcts show a 42% reduction in infarct volume between days 1 and 21 (Fishbein et al. 1978), whereas, in dogs, the infarct size is reduced by 40% during the first 6 weeks of infarct healing (Jugdutt and Amy 1986). Third, when compared with large animal models of reperfused infarction (Dobaczewski et al. 2004; Dobaczewski et al. 2006), mice exhibit a rapid reduction in cellular content during scar maturation (Figs. 3, 4).
In conclusion, we suggest that optimal assessment of cardiac remodeling in reperfused murine infarction requires a wide range of functional, molecular, histological, and proteomic investigations. To study the time course of cellular events and structural alterations associated with cardiac repair and postinfarction remodeling, mice should be studied at several carefully selected time points ranging from 6 hr to 28 days of reperfusion. The reparative response following myocardial infarction is a dynamic and superbly orchestrated process, characterized by timely activation of molecular pathways and cellular events. Understanding the temporal window of each cellular and molecular response is critical for designing studies exploring the mechanisms of repair and remodeling of the infarcted heart.
Footnotes
Declaration of Conflicting Interests
The author(s) declared no potential conflicts of interest with respect to the research, authorship, and/or publication of this article.
Funding
The author(s) disclosed receipt of the following financial support for the research, authorship, and/or publication of this article: This work was supported by NIH grants R01 HL-76246 and R01 HL-85440, the Wilf Family Cardiovascular Research Institute and the Edmond J Safra/Republic National Bank of New York Chair in Cardiovascular Medicine.