
Abstract
Vascular endothelial growth factor A (VEGF-A) is a very important growth factor in angiogenesis and holds potential as both a predictive marker for anti-angiogenic cancer treatment and a prognostic variable. Consequently, reliable estimation of VEGF expression is crucial. Investigators immunostained whole tumor sections for VEGF-A, VEGF-B, and VEGFR-1 of invasive ductal carcinomas of the breast and scored the tumors manually with staining intensity as the only parameter and by a combination of qualitative and quantitative information. The investigators also introduce an automated method for analyzing VEGF expression (so-called AI score) using the same tumor sections. Analysis of 100% of the tumor area was performed and the results were compared with the reduced analysis of 25% of the tumor area. These analyses were performed at ×5 and ×10 magnification, and each analysis was repeated in a second run with a new delineation of the tumor area. The AI scores were correlated to the manual scoring of VEGF intensity, but reproducibility of manual IHC scores was rather poor. The AI scores were reproducible, and the restricted analysis of 25% of the tumor area at ×5 magnifications was the most efficient considering time consumption and data load.
Keywords
Angiogenesis, the formation of new blood vessels from preexisting vascular network, is essential to tumor growth and spread (Folkman 1971). The vascular endothelial growth factor (VEGF) system is part of the platelet-derived growth factor gene family, and vascular endothelial growth factor A (VEGF-A) is a very potent angiogenic growth factor that interacts with its specific receptors VEGFR-1 (flt-1) and VEGFR-2 (flk-1 or KDR) (Ferrara et al. 2003). Vascular endothelial growth factor B (VEGF-B), interacting with VEGFR-1, is another ligand in this gene family that is supposed to play a role in the maintenance of existing vessels, but this protein is less well described (Fischer et al. 2008; Li et al. 2009). VEGF-A, VEGF-B, VEGFR-1, and VEGFR-2 are expressed in a variety of normal cells, and overexpression in different malignant tumors has been described (Dvorak et al. 1995; Ferrara et al. 2003; Fischer et al. 2008; Li et al. 2009).
Several anti-angiogenic drugs have been developed and are being tested in clinical trials or used as standard treatment for different types of cancer. The increasing number of expensive drugs in cancer treatment emphasizes the need for predictive markers to select the patients who are most likely to benefit from the treatment. Because VEGF plays a key role in angiogenesis, reliable measurements of the ligands and the receptors are of crucial importance from both a clinical and a biological point of view.
Different techniques have been applied to VEGF-A, but the use of immunohistochemistry (IHC) is essential in routine diagnosis and research, because it allows single cell analysis combined with morphology. However, the method faces a number of challenges (Seidal et al. 2001). Quantification of the immunoreactivity is currently based on visual examination of IHC-stained tissue slides by the pathologist. Several different scoring systems have been used (e.g., Allred et al. 1998; Schneider et al. 2008). Some of these are based on evaluating the quality (intensity) of the immunoreactivity, whereas others combine the examination of intensity score with quantity (fraction) of cells staining resulting in a semiquantitative scoring system. Such scoring is associated with subjectivity and questionable intra- and inter-observer reproducibility. Methods for computer-assisted image analysis of VEGF-A have been described and have shown a capability to reduce some of the variation between measurements, resulting in improved reproducibility (Brey et al. 2003; Choudhury et al. 2009; Ghosh et al. 2008).
As part of a prognostic study evaluating VEGF expression in invasive ductal carcinomas of the breast, we searched for reliable measurements of VEGF. Moreover, we looked for a combined qualitative and quantitative approach for estimating VEGF expression, anticipating that such measures may be of considerable value when applying predictive markers in clinical studies of targeted treatments. Consequently, we quantified IHC staining of VEGF using three different scoring methods: 1) a manual score of staining intensity alone; 2) a manual score of staining intensity combined with quantification, and 3) an automated method of quantification. The aim of the present study was to investigate the reproducibility of manual and automated IHC scoring of VEGF with a perspective of clinical application.
Materials and Methods
Patients
Tumor blocks from 112 patients who were treated with primary lumpectomy or mastectomy for invasive ductal carcinoma at Vejle Hospital were identified at the Department of Clinical Pathology, Vejle Hospital.
Immunohistochemistry
Tumor tissue had been routinely formalin fixed (24–72 hr) and paraffin embedded. Four-µm-thick sections were mounted onto Superfrost Plus–coated slides (Menzel, Braunschweig, Germany) and dried for 60 min at 65C. Sections were dewaxed in Tissue-Tek Tissue-Clear Xylene Substitute (Sakura Finetek Europe, Alphen aan den Rijn, The Netherlands) and rehydrated through graded series of ethanol and rinsed in water. Endogenous peroxidase activity was blocked with 3% hydrogen peroxidase for 10 min. Heat-induced antigen retrieval was performed in a microwave oven in 10 mM Tris/EGTA (pH = 9) by heating for 10 min followed by 15 min of boiling. Sections were cooled for 15 min at room temperature and rinsed in Tris-buffered saline (TBS) with 0.05% Tween 20 for at least 5 min. Sections to be incubated in anti VEGF-B were additionally treated with 0.5% casein in TBS for 10 min to block non-specific binding sites.
Each antibody was initially tested with different pretreatments and dilutions to optimize the final staining protocol for each of the four antibodies used in the study. Thus, individual tissue sections were incubated with primary antibody for 30 min: anti-VEGF-A, rabbit polyclonal antibody, dilution 1:250 (A-20, SC-152, Santa Cruz Biotechnology Inc., Santa Cruz, CA); anti-VEGFR-1, rabbit polyclonal antibody, dilution 1:100 (Ab-1, RB-1527-P, Thermo Fisher Scientific, Fremont, CA), or anti-VEGF-B, rabbit polyclonal antibody, dilution 1:250 (H-70, SC-13083, Santa Cruz Biotechnology). Different IHC staining protocols for VEGFR-2 were tested, including various blocking steps, but optimal staining results were not obtainable. Significant non-specific background staining persisted in these experiments, and therefore VEGFR-2 was excluded from the reproducibility study.
Detection was performed using Super Sensitive Polymer-HRP IHC Detection System (BioGenex Laboratories Inc., San Ramon, CA). Super Enhancer link was added for 20 min and polymer-HRP for 30 min followed by visualization with DAB chromogen for 12 min. Sections were rinsed in water, and 0.5% cobber sulfate in TBS was added to enhance the staining intensity. Between incubations the sections were washed several times in TBS buffer. Finally, sections were counterstained with Mayer’s hematoxylin, dehydrated, and cover slipped.
Slides were stained in batches of 22–38 slides, and batches of the same antibody were stained on consecutive days. For each batch of slides, the sensitivity was tested by simultaneous staining of slides with tissue from liver, appendix, kidney, and tonsils (positive controls). The specificity was evaluated in the pre-study of optimizing staining protocols by omitting the primary antibodies. Because most stromal cells stained negatively, the stromal reaction was used as guiding, internal negative control.
Evaluation of Immunohistochemical Staining
The cytoplasmic staining intensity of invasive tumor cells was scored semi-quantitatively with two different scoring techniques: 1) an overall intensity score with 3 levels (1 = weak or no staining; 2 = moderate staining; and 3 = strong staining), and 2) a score combining the intensity score with quantitative information in four categories (1 = <10% of tumor with strong intensity [SI]; 2 = 10% ≤ SI < 1/3 of tumor; 3 = 1/3 ≤ SI < 2/3 of tumor; 4 = SI ≥ 2/3 of tumor). Strong intensity was defined as the strongest intensity relative to weaker staining intensity within each tumor slide. When staining intensity in a tumor was very homogeneous, a score of 4 was chosen, if it was possible to identify just a few cells with weak staining intensity. When there was doubt between two scores, the highest score was chosen with both scoring methods.
Batch 1 consisting of 28 sections stained for VEGF-A, VEGF-B, and VEGFR-1 was scored twice by two investigators separately at least 1 day apart with both scoring methods. The intensity score was additionally scored once for the remaining 84 tumors by both investigators. Observer 1 was a trained pathologist and Observer 2 was trained by the pathologist. IHC scoring was blinded for clinicopathological data.
Image Analysis
Immunostained sections were digitized using a Zeiss Mirax automated slide scanner (3DHISTECH Ltd, Budapest, Hungary) with an objective of ×20 magnification. Threshold for contrast was set at a minimum to ensure inclusion of the entire section. Digital image analysis was performed by importing the Mirax files into the image analysis software Visiopharm Integrater System (VIS), VisioMorph, version 3.4.4.0 (Visiopharm, Hørsholm, Denmark). At the scanning magnification (1 pixel = 10 µm x 10 µm), the tumor area was manually delineated (the so-called meander) (Figure 1A). Normal cells, ductal carcinoma in situ (DCIS), necrosis, and structures with immunoreactivity other than invasive carcinoma were excluded.
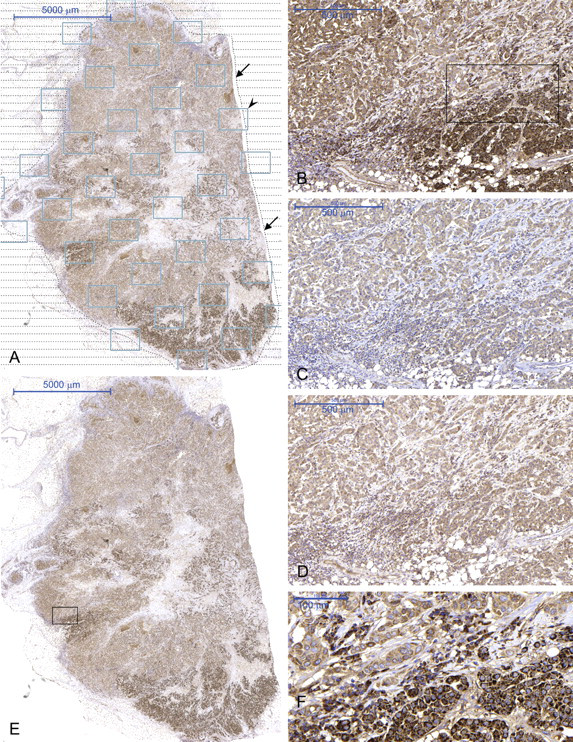
Whole tumor section with meander (arrows) and sample boxes (arrowhead) (A). Heterogeneity in the staining pattern of VEGF-A (B, E, F), VEGF-B (C), and VEGFR-1 (D). B–D are from approximately the same tumor area shown by a black box in E. AI score of B is 157.5, C is 187.9, and D is 182.6. The black box in B is shown at a higher magnification in F.
Because image analysis is very time consuming, a fraction of 25% of the total tumor area was chosen for analysis. To execute this selection, a 25% systematic uniform random sampling was chosen in the software and performed within the meander (meander sampling). Thus, the delineated tumor area was automatically covered by sample boxes with equal size and with equal distance, starting at a random point within the invasive tumor area, covering 25% of the total delineated tumor area (Figure 1A). This sampling resulted in a varied number of sample boxes for individual tumors, as only tumor areas within a sample box were included for further analysis.
Each sample box was analyzed at pixel level with each pixel containing information corresponding to the actual color in a red–green–blue color spectrum (RGB). To enhance the brown immunostained areas, we used the contrast red–green feature built into VIS, which is a mathematical transformation of the color information (subtraction of green). This transformed color information was then used by VIS to automatically separate all the pixels into three classes by running a mathematical algorithm, an unsupervised k-means clustering analysis (MacQueen 1967), which was incorporated in the software. In brief, k-means clustering is an algorithm able to classify or group objects based on attributes/features into k numbers of groups, where k is a positive integer number. The grouping is done by minimizing the sum of squares of distances between the data and the corresponding cluster centroid (Figure 2). This cluster analysis led to the separation of the pixels into three clusters, with only one cluster representing shades of brown corresponding to the positive IHC staining (Figure 3A-B). This cluster was used as the region of interest (ROI) for further analysis.

Demonstration of k-means clustering. (A) A data set of 21 observations. k initial values (*) are randomly selected in the data set (demonstrated for k = 3). (B) Each observation in the data set is clustered with the nearest initial values and k clusters are created. (C) A mean (¤) of each cluster is calculated and becomes the new value for clustering, and Steps B and C are repeated until convergence has been reached.
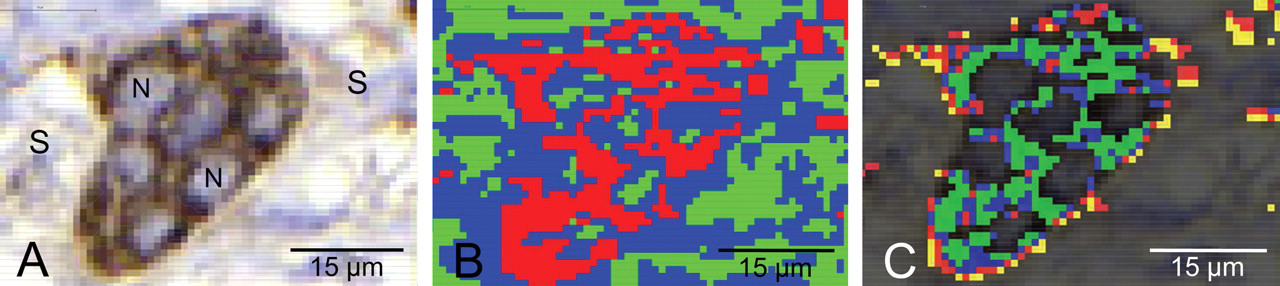
Demonstration of selection of IHC-stained areas. (A) Tumor cells within the delineated tumor area and within a sample box. Brown DAB-stained cytoplasm with negatively stained nuclei (N) and surrounding stroma (S). (B) K-means clustering with three clusters applied on A. Red pixels correspond to brown IHC-stained cell cytoplasm and represent the region of interest (ROI). (C) According to the red color band, pixels were divided into four classes representing weak (yellow pixels), light (red pixels), moderate (blue pixels), and strong (green pixels) IHC staining. The area and mean intensity of all the pixels within each class were calculated along with the total area of ROI.
Within the ROI, another unsupervised k-means cluster analysis was performed, this time with four classes according to the color information in the red color band, as red is the main component of brown in an RGB color spectrum. This led to separation of the ROI into four classes representing weak, light, moderate, and strong IHC staining (Figure 3C). The intensity of light passing through the slide was measured for each pixel. A data file was generated by VIS reporting mean intensity of the pixels in each class, the area of each class (1 pixel = 8.1 µm2 at ×5 magnification and 3.24 µm2 at ×10 magnification), and the total area of ROI for each sample box.
The resulting data files were exported to Microsoft Office Excel 2003. A weighed mean intensity (I) for each sample box relative to the area fraction (A) was calculated followed by a calculation of the overall mean intensity for the tumor, the AI score. The dimensionless AI score of a sample box was calculated as

where A nji was the immunostained area of the ith intensity class defined by the four classes k-means clustering (weak, light, moderate, and strong staining) in the jth sample box of the nth tumor, and I was the mean intensity. The AI score of a tumor with J sample boxes was

Because intensity was measured as light passing through the slide, low AI scores represented the strongest staining intensity.
To check the influence of staining heterogeneity and evaluate the efficiency of the sampling procedure, the first batch of slides of VEGF-A, 28 sections, was sampled with 100% and 25% at two levels of magnification. In the VIS, ×5 (1 pixel = 1.8 µm × 1.8 µm) and ×10 (1 pixel = 0.9 µm × 0.9 µm) magnifications were selected. A second run of each analysis was performed with a new delineation of the tumor area. A second run was also executed for VEGF-B and VEGFR-1 at ×5 magnification and 25% sampling (Table 1).
Performed Image Analyses
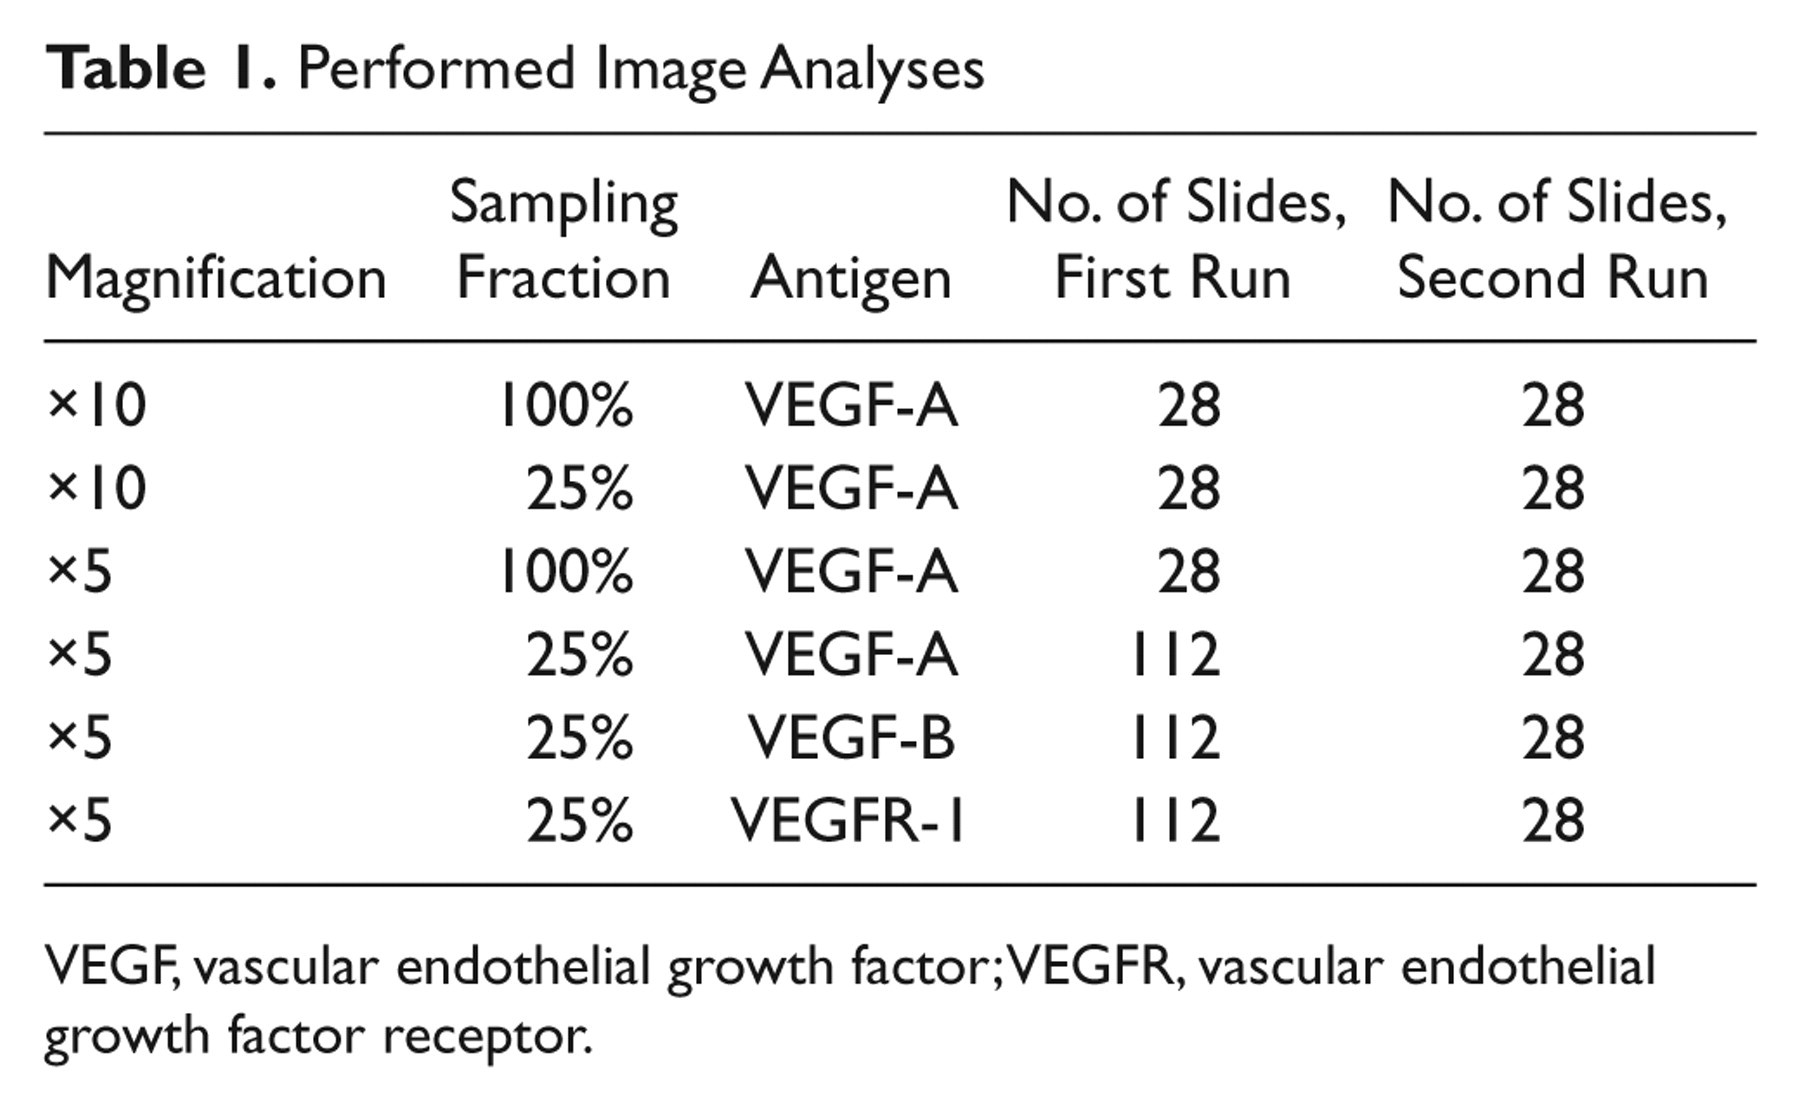
VEGF, vascular endothelial growth factor; VEGFR, vascular endothelial growth factor receptor.
Statistical Analysis
Intra- and inter-observer reproducibility of manual scoring was analyzed using κ statistics with linear weighting by applying the Jeroen Geertzen online κ calculator (http://cosmion.net/jeroen/software/kappa/). We regarded κ > 0.60 as an acceptable agreement. Mann-Whitney U test was used to compare median AI scores (×5 magnification, 25% sampling) and the manual score of intensity of Observer 1.
Spearman Rank correlation coefficient (r), linear regression, and Bland-Altman difference plots were used to describe the correlation between AI scores. Correlations between AI scores were considered acceptable if 1) the slope of the regression line equaled 1.0 within 95% confidence interval (CI); 2) the intersection between the regression line and the x- and y-axes equaled (0,0) within 95% CI; and 3) a significant correlation was obtained. We established that p < 0.05 indicated statistical significance, and all tests were two-sided. Statistical analyses were performed using the NCSS statistical software, version 07.1.15 (NCSS Statistical Software, Kaysville, UT).
Results
Immunohistochemical Staining Pattern
VEGF-A, VEGF-B, and VEGFR-1 predominantly showed a cytoplasmic staining pattern of invasive tumor cells, DCIS, normal epithelial cells of the lobules, and ducts of the mammary gland (Figure 1B–D, F). All tumors stained positively, and staining varied between very weak and strong. The majority of tumors stained rather heterogeneously (Figure 1B, E, and F). In some tumor cells, granules with strong staining intensity were observed for VEGF-A. The size of the granules differed, and the amount of granules in cells varied. No granules were observed in the stroma. Some stromal cells stained moderately, but most of them stained negatively. Artificial staining could be detected in the periphery of the tumor sections, but these areas were not included in the automated analysis.
Reproducibility of Manual Scoring, Based Solely on Staining Quality (Intensity)
Intra-observer reproducibility of the intensity score for VEGF-A in the first batch of slides was good (κ = 0.68, 95% CI 0.45–0.91, and κ = 0.78, 95% CI 0.57–0.98) for the two observers, respectively, but inter-observer κ value (0.57, 95% CI 0.43–0.70) failed to reach acceptable agreement, when scoring all 112 tumors. Observer 2 was able to reproduce the intensity score for VEGF-B (κ = 0.67, 95% CI 0.40–0.94) and for VEGFR-1 (κ = 0.71, 95% CI 0.48–0.95), whereas intra-observer agreement for Observer 1 showed κ = 0.54 (95% CI 0.29–0.80) and κ = 0.53 (95% CI 0.26–0.80), respectively. Inter-observer κ values of VEGF-B were very low (κ = 0.34, 95% CI 0.18–0.50), and the intensity score of VEGFR-1 showed only marginal reproducibility between observers (κ = 0.54, 95% CI 0.40–0.68). Results are shown in Table 2.
Reproducibility of Manual Intensity Score
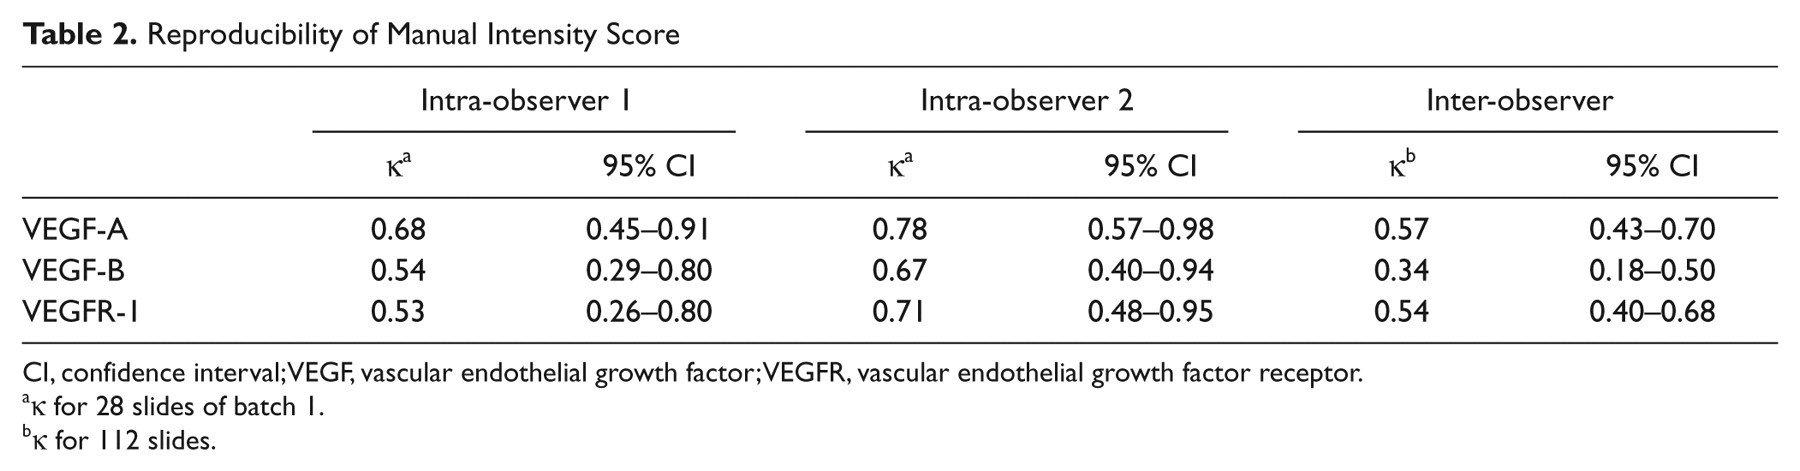
CI, confidence interval; VEGF, vascular endothelial growth factor; VEGFR, vascular endothelial growth factor receptor.
κ for 28 slides of batch 1.
κ for 112 slides.
Reproducibility of Manual Scoring, Based on a Combination of Quality and Quantity
Scoring of intensity in combination with quantification was impossible to reproduce for VEGF-A and VEGF-B. We obtained intra-observer κ values of 0.17 (95% CI 0.0–0.41) and 0.29 (95% CI 0.0–0.61) for VEGF-A, and the reproducibility study for VEGF-B resulted in κ values of 0.44 (95% CI 0.20–0.68) and 0.24 (95% CI 0.01–0.48), respectively. The inter-observer study showed κ = 0.22 (95% CI 0.0–0.51) for VEGF-A and κ = 0.23 (95% CI 0.0–0.47) for VEGF-B. For VEGFR-1 the intra-observer κ values were higher with κ = 0.53 (95% CI 0.26–0.80) and κ = 0.78 (95% CI 0.61–0.95), respectively, but the inter-observer reproducibility study found κ = 0.50 (95% CI 0.25–0.75). Results are shown in Table 3.
Reproducibility of Manual Scoring of Intensity and Quantity
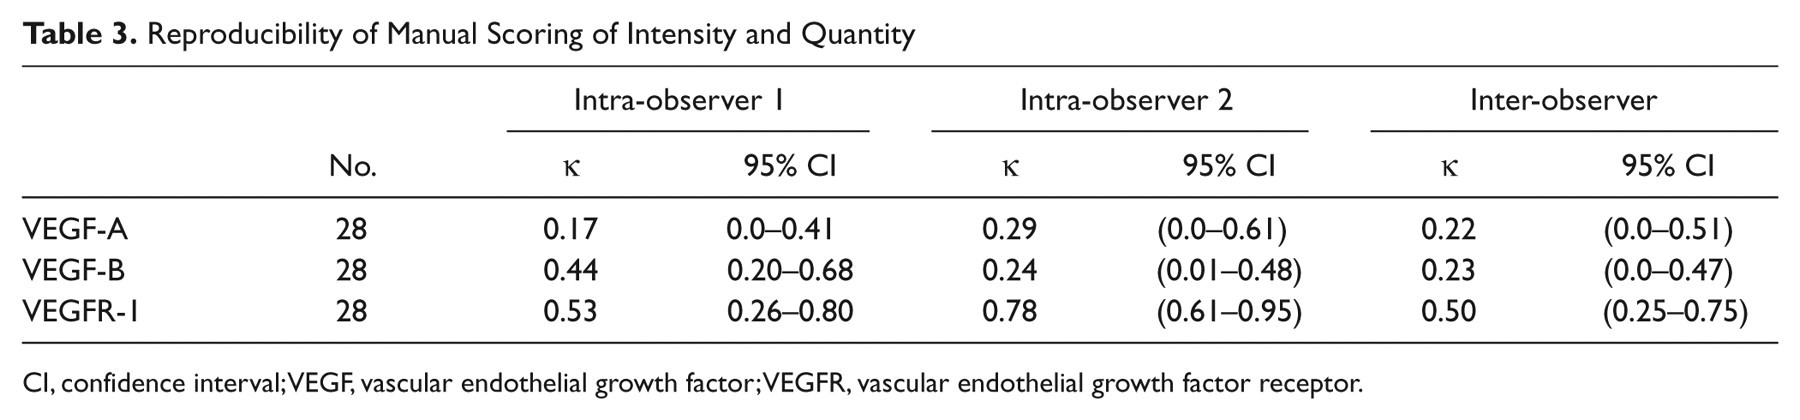
CI, confidence interval; VEGF, vascular endothelial growth factor; VEGFR, vascular endothelial growth factor receptor.
Feasibility of Image Analysis
Scanning the slides was the most time-consuming part of the image analysis but was fully automated. One batch of 28 slides was scanned in 5–16 hr, depending on the tumor sizes and quality of the slides, generating data files of approximately 20 GB. Only the analysis process was affected by the reduction in time consumption and data load. Analyzing 1 batch of slides with 100% sampling at ×10 magnification used 8 hr and 12 GB, whereas sampling 25% at ×5 magnification was done in 1½ hr and the data files maximally occupied 1 GB. Export of data files and calculation of the AI score was done in approximately 4 hr for one batch of 28 slides.
Reproducibility in Image Analysis
AI scores of VEGF-A ranged from 126.1 to 196.2 with a median of 165.5; VEGFR-1 ranged from 126.9 to 194.0, median 168.3; and VEGF-B ranged from 156.9 to 208.0, median 182.2.
All correlations between AI scores were acceptable with slopes of the regression lines equal to 1.0 within 95% CI and intersections not deviating from (0,0) within 95% CI. Moreover, all correlations were highly significant (2p < 0.00001). AI scores of the first and second run of VEGF-A, when sampling 100% and 25% of the tumor areas at ×5 and ×10 magnification, showed strong correlations (Table 4). The correlation coefficient between the first and second run of AI score of VEGF-B was r = 0.97 (95% CI 0.94 to 0.99) and the mean difference was –0.6 (95% CI –4.2 to 3.0). The correlation coefficient between the first and second run of VEGFR-1 was r = 0.98 (95% CI 0.95 to 0.99) and the mean difference –0.7 (95% CI –6.7 to 5.2). Figure 4 shows scatter plots with regression lines and Bland-Altman difference plots for VEGF-A, VEGF-B, and VEGFR-1.
Reproducibility of AI Score of VEGF-A
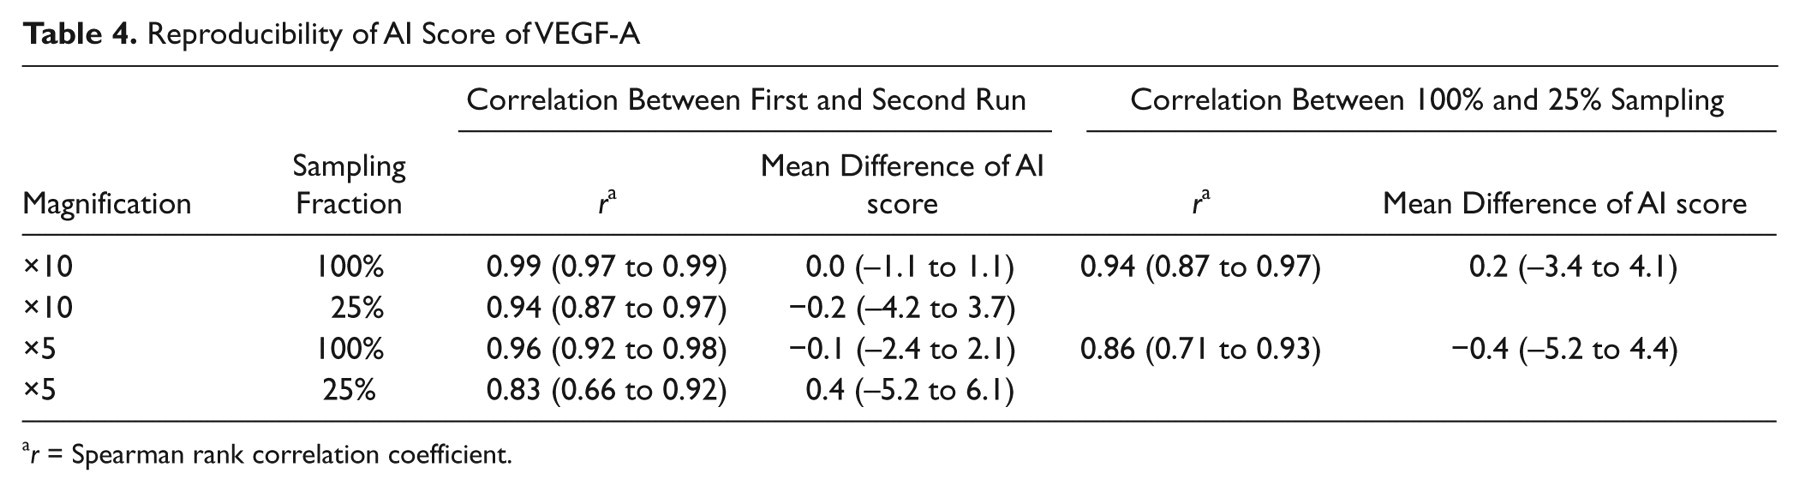
r = Spearman rank correlation coefficient.
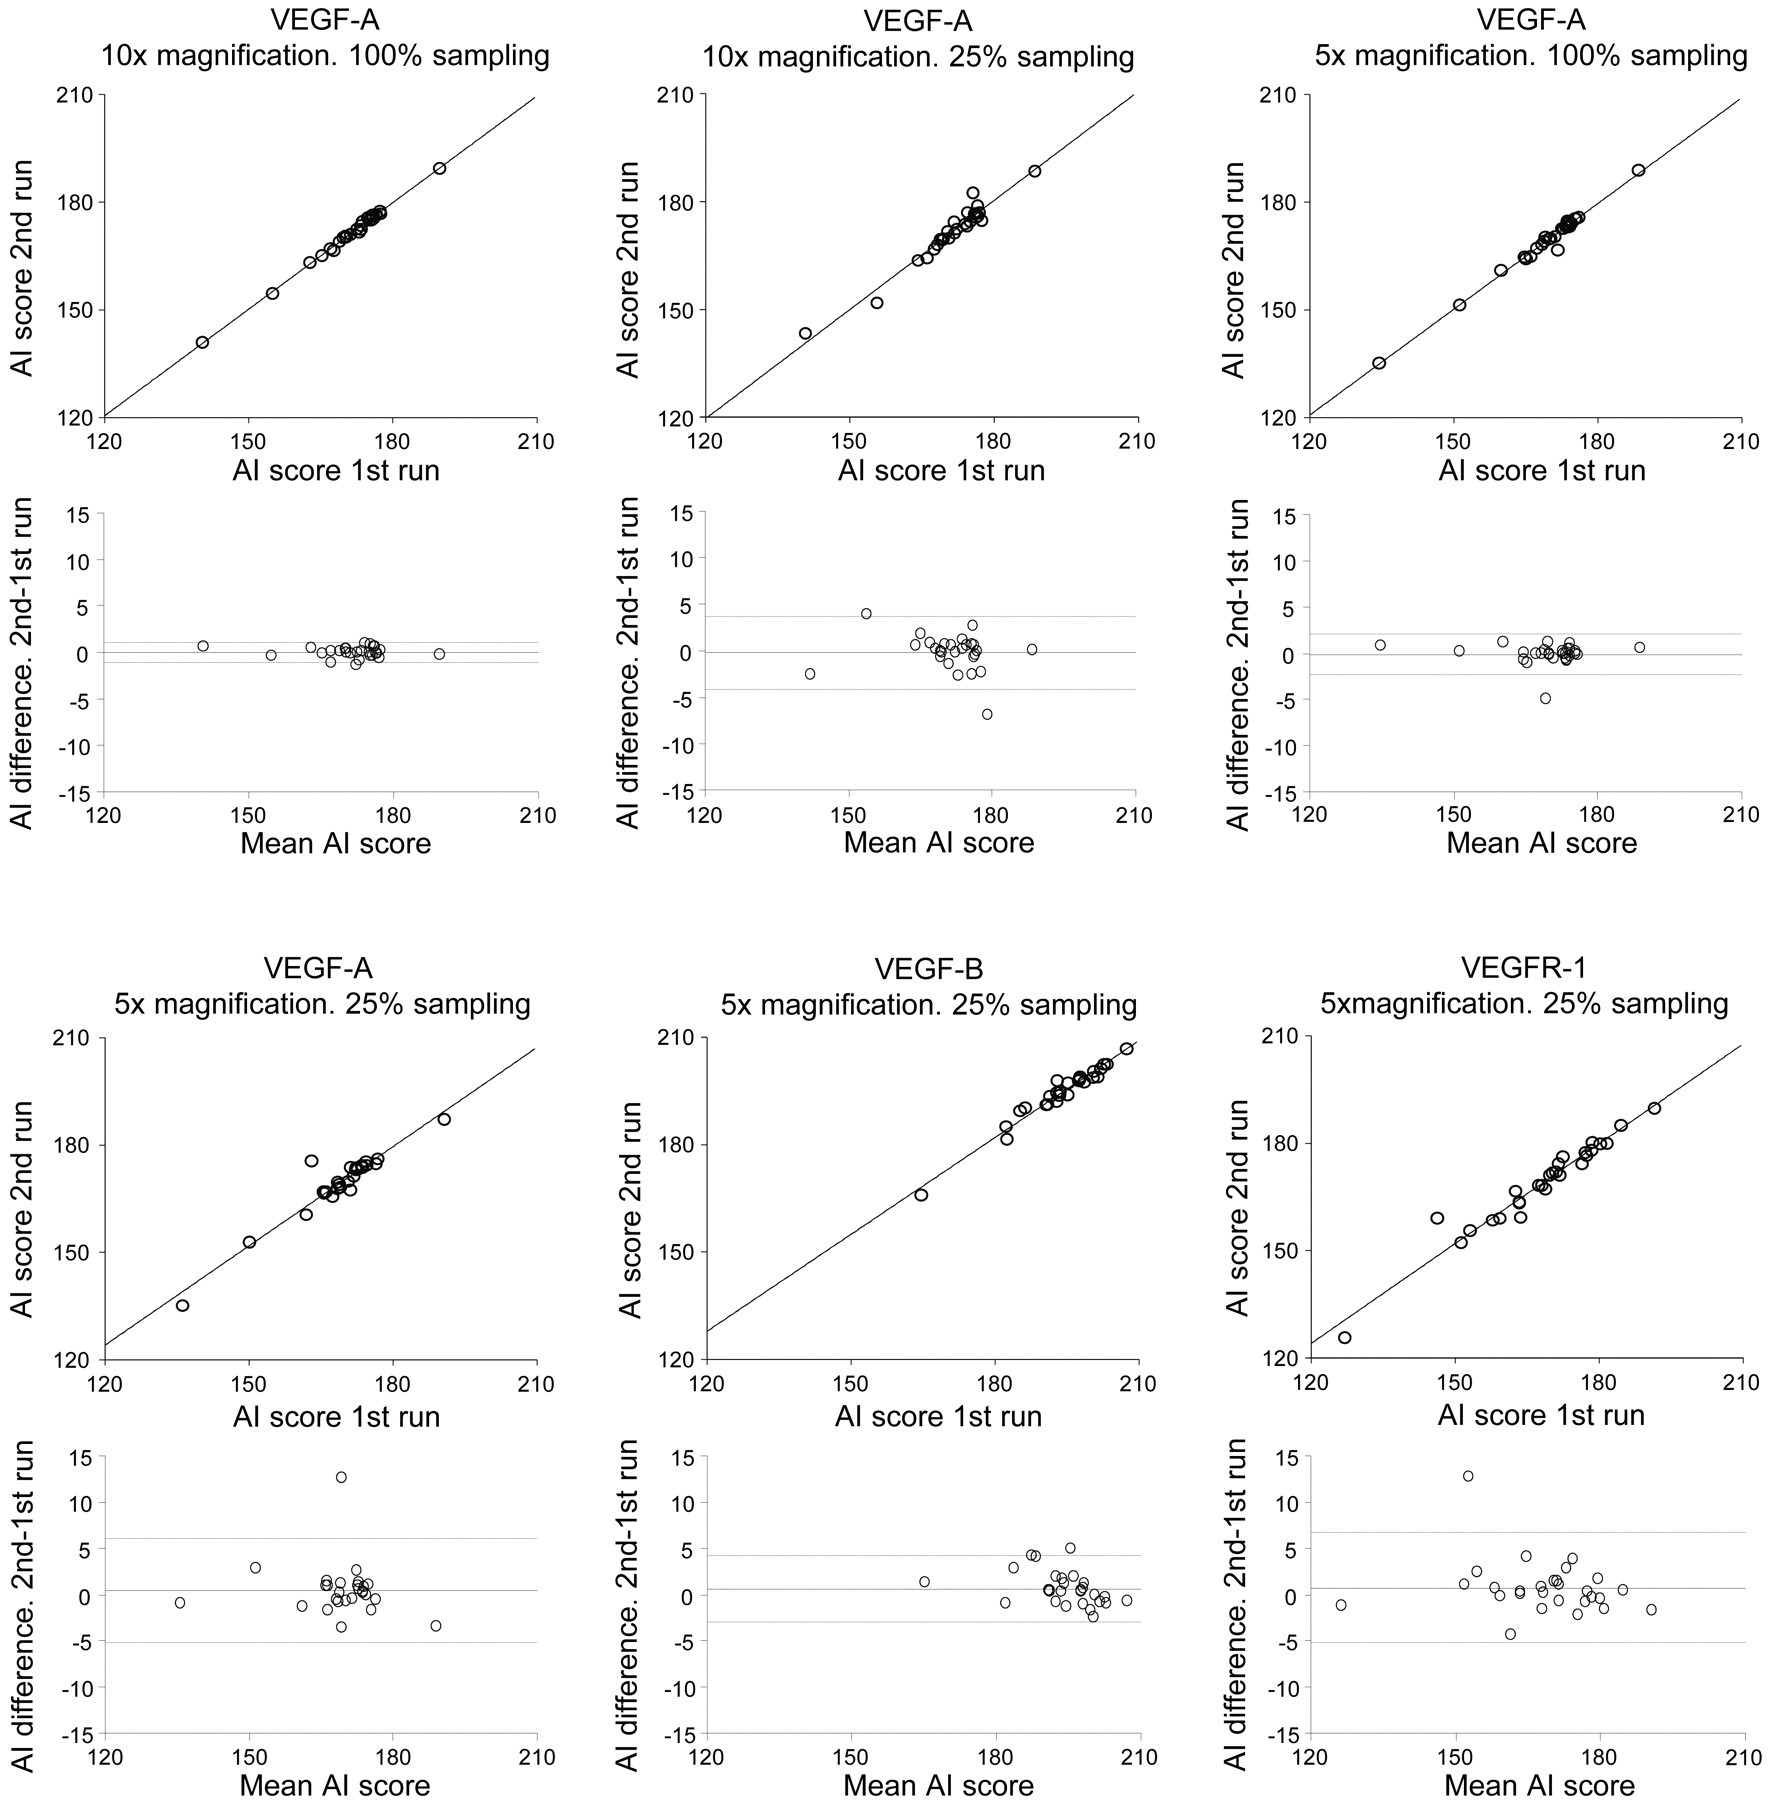
Scatter and difference plots with upper and lower showing 95% confidence interval. VEGF, vascular endothelial growth factor.
The correlation between AI score of VEGF-A based on 25% and 100% sampling at ×5 magnification was high (r = 0.86, 95% CI 0.71 to 0.93) with a mean difference of 0.4 (95% CI −4.4 to 5.2). Scatter and difference plots are shown in Figure 5. Therefore, a 25% sampling fraction at ×5 magnifications was chosen for analysis of the remaining VEGF-A sections and all the VEGF-B– and VEGFR-1–stained sections.
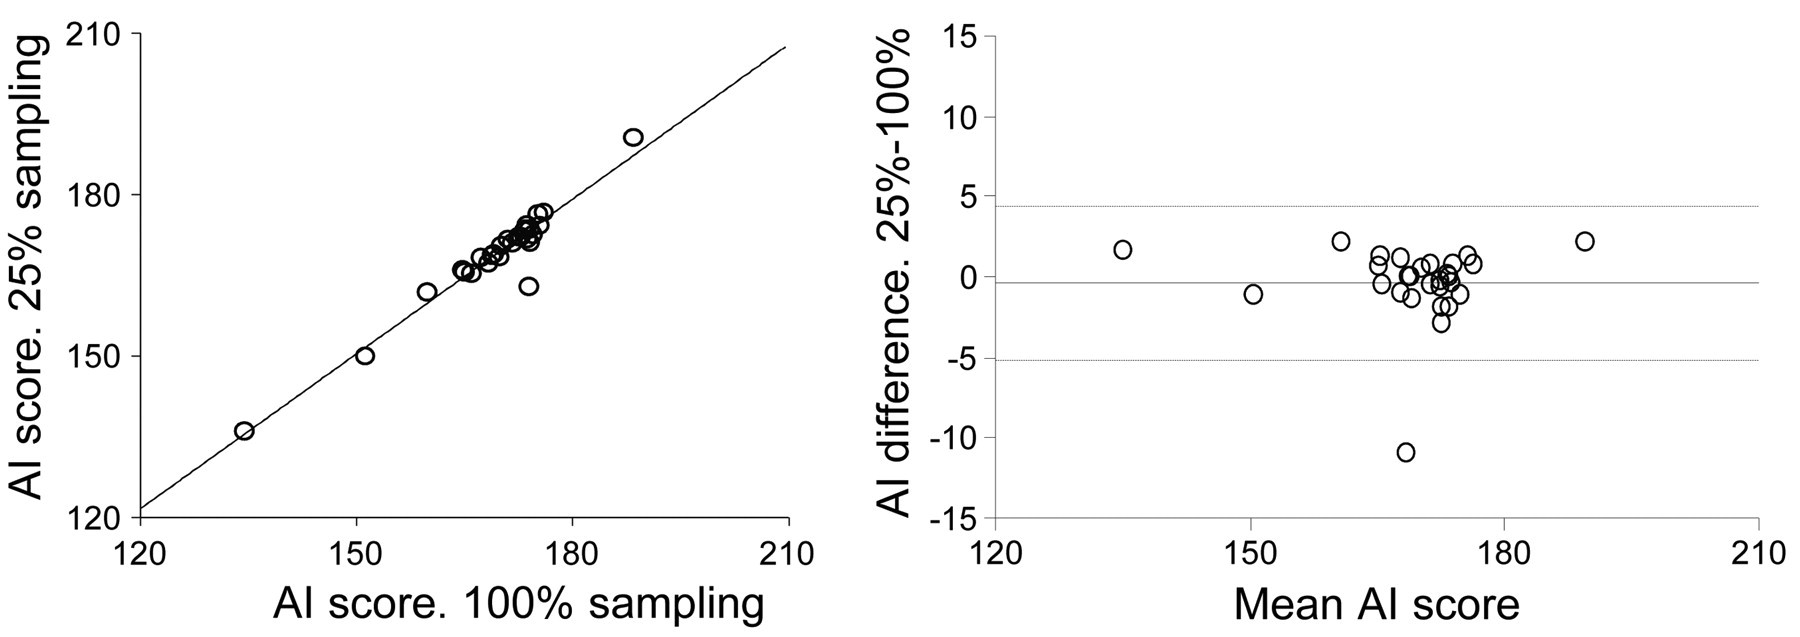
Vascular endothelial growth factor (VEGF)-A. Scatter and difference plot showing the correlation between 25% and 100% sampling at ×5 magnification. Dotted lines showing 95% confidence intervals.
Correlation Between Manual IHC Intensity Score and AI Score
The AI score of VEGF-A and VEGFR-1 showed an expected significant decrease in median AI score with increasing manual intensity score of VEGF-A and VEGFR-1. A decrease in median AI score was also seen for VEGF-B, but the medians of no/weak staining and moderate were not significantly different (p = 0.07). Results are shown in Figure 6.
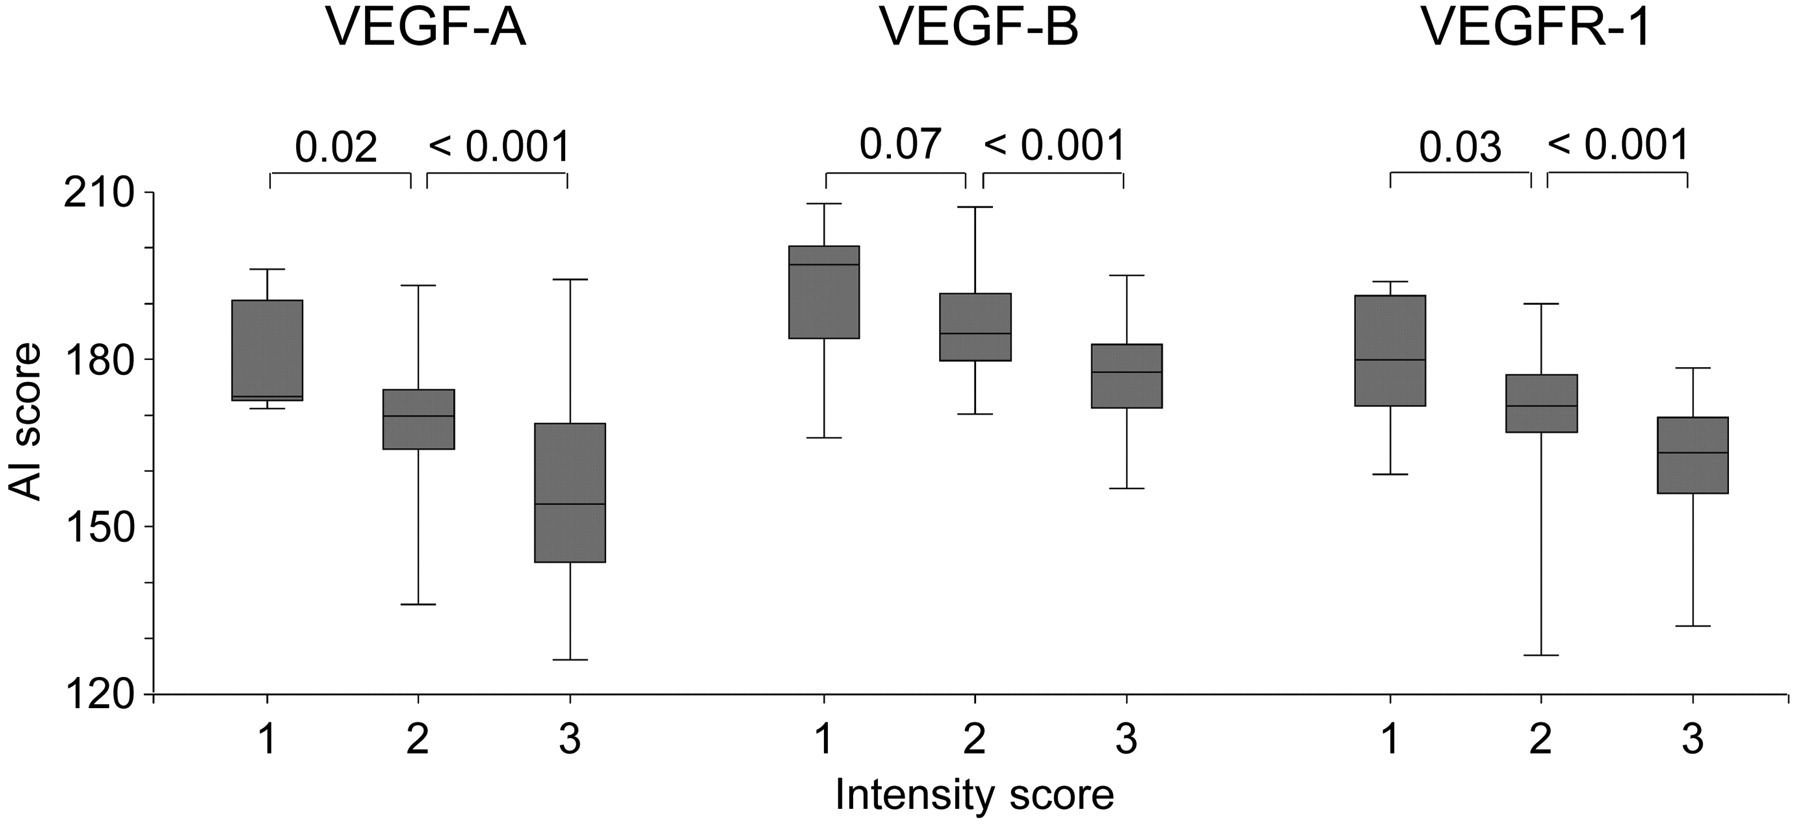
Box plot illustrating the association between immunohistochemistry intensity score (1 = no/weak staining, 2 = moderate staining, 3 = strong staining) and AI score of vascular endothelial growth factor (VEGF)-A, VEGF-B, and VEGFR-1. The p values are given for differences in median AI score.
The correlation between AI score and manual score based on the combination of intensity and quantity was not calculated given lack of reproducibility of the manual score.
Discussion
The VEGF system has been investigated for several years, but a standardized interpretation of the IHC staining of the ligands and receptors has not yet been validated. The presented data indicate that analyses based on conventional reading are associated with reproducibility problems that may cause problems for clinical application. Automated analysis may be needed to gain reproducible measurements motivating this study.
The staining intensity of different slides reflects the biological variation between tumors but is also influenced by fixation times in formalin, variation in section thickness, and day-to-day differences in the laboratory. Thus, staining intensity should optimally be analyzed within each slide to ensure measurement of the biological variation between tumors and not just variation due to the technical interference. Because of staining heterogeneity within the tumors, one has to take different levels of staining intensity into account. The main problem with the reproducibility of the manual scoring systems seems to be the influence of subjectivity in detecting the threshold for strong immunostaining within each slide. This was especially a problem for VEGF-B, which stained weaker and with a smaller range in staining intensity. Therefore, estimation of the fraction of tumor cells showing a strong immunoreaction remains highly unreliable. Our challenge in combining intensity with a quantification of stained tumor cells was to go through several visual fields and keep track of staining intensity and quantity in each field in order to sum them up to an overall score. Other studies report better inter-observer reproducibility (Ryden et al. 2005), but scoring was limited to tissue micro-arrays (TMAs). This technology naturally will provide a better reproducibility, because only a small fraction of the tumor is evaluated. However, the existence of tumor heterogeneity may potentially misclassify the tumor when based on TMAs.
The use of biomarkers has not yet been established in anti-angiogenic treatment. However, a clinically applicable immunoscore will most likely need to contain information on both intensity and quantity of stained tumor cells, as is the case for HER-2 expression and estrogen receptor in breast cancer treatment. We found that by using image analysis, reproducible measurements of intensity and quantity of IHC positive staining are obtainable.
We realized that achieving an IHC signal of VEGF in tissue sections is a considerable challenge. The use of several different antibodies and different procedures for tissue processing makes comparison of results from different laboratories difficult, often accentuated by inadequate descriptions of the staining protocols. We used the same rabbit polyclonal anti-VEGF-A antibody (clone A-20, Santa Cruz Biotechnology) as Rydén et al. (2005) and Bluff et al. (2009), but Rydén et al. reported inter-observer agreement of 89% using κ statistics. Bluff et al. reported overall inter-observer agreement of 85% and intra-observer agreement of 90% but did not use κ statistics in their evaluation.
Reproducibility of a scoring is pivotal to clinical implementation, but only a few studies have reported on reproducibility of the subjective VEGF scoring (Bluff et al. 2009; Perrone et al. 2005; Ryden et al. 2005). A common practice has been scoring by two observers independently, and in case of disagreement on a score consensus has been reached (Carrillo de Santa et al. 2009; Ryden et al. 2003), without reporting the extent of disagreement. However, most studies do not report any investigation of reproducibility (Adams et al. 2000; Blackwell et al. 2004; Callagy et al. 2000; Carpenter et al. 2009; Ghosh et al. 2008; Gunningham et al. 2001; Hornychova et al. 2008; Magkou et al. 2008; Mylona et al. 2007; Nieto et al. 2007; Ribeiro-Silva et al. 2006; Ryden et al. 2003; Safwat et al. 2009; Schmidt et al. 2008; Schneider et al. 2008; Shintani et al. 2004; Zhou et al. 2006).
In performing image analysis, we measure immunostaining in both invasive tumor cells and stromal cells. However, most stromal cells stained negatively and were thus excluded from analysis during the steps of pixel selection. In ductal breast carcinomas, the immunostained stromal cells were relatively few and the area of these stromal cells was very small compared with the area of tumor cells. In lobular breast carcinomas, the inclusion of stromal cells might be a problem because very few tumor cells with a sparse amount of cytoplasm are scattered in tissue containing several stromal cells and extracellular matrix. The AI score is a weighed mean of intensity relative to the area staining. This means that a single stromal cell staining with moderate intensity will contribute very little to the AI score compared with a larger epithelial tumor cell with more and stronger staining cytoplasm. Overall, this might not be a problem, because angiogenesis is dependent on the interaction between tumor cells, endothelial cells, pericytes, and other stromal cell types producing, for example, VEGF-A.
Separation of brown DAB-stained immunoreactive tumor areas of interest from the blue hematoxylin–stained background is essential in image analysis. We used a method similar to that of Smejkal and Shainoff (1997), where inclusion of the background staining was reduced by placing a green filter in the light path, and the green channel of the filtered brightfield images was extracted. In essence, this method is equal to our technique regarding separation of DAB- and hematoxylin-stained objects, because adding a green filter equals subtraction of green from red. Brey et al. (2003) compared different methods (Montironi et al. 1996; Ruifrok and Johnston 2001; Smejkal and Shainoff 1997) for separation of DAB-stained pixels and found that the correlation with manual separation of DAB-stained pixels was 0.8304 for the method described by Smejkal and Shainoff, whereas other methods showed correlations of 0.9577–0.9979. The technique used in our study was provided as a built-in feature of the Visiopharm software. We did not compare the manual and automated selection of pixels but found that the AI score decreased significantly with increasing manual intensity score, which indicates the relevance of the automated method.
Choudhury et al. (2009) described a method for image analysis of VEGF-A immunostains, in which the percentage area stained at 255 possible intensity levels was summed. The average of the 255 intensity levels was named the averaged threshold measure (ATM) score. Our method is very similar to this technique, with the difference that the ATM score is expressed as the average percentage tumor cells stained and we express the average staining intensity by the AI score. Choudhury et al. showed that even though tumor sections from the same tumor looked very heterogeneous, the ATM score did not vary much. We found that the mean intensity in different sample boxes in the same tumor varied considerably reflecting the heterogeneity of the tumor, but nevertheless the AI score was robust.
Choudhury et al. (2009) pointed out that large tumor sections needed to be submitted to sampling. We did a 25% random sampling and compared it with results with 100% sampling and found what we consider an acceptable correlation in terms of the gain in efficiency. The method described in this article is applicable to large tumor specimens due to sample fractioning. Invasive tumor areas need to be defined using the meander feature, which can be done very quickly and easily in the software we used, and a reasonable data load makes it feasible to handle a large number of immunostained tumor sections.
In conclusion, the need for biomarkers is obvious, and reliable measurements are crucial to enable application in clinical trials and routine settings. In the present study we described a method to gain reproducible measurements of VEGF-A, VEGF-B, and VEGFR-1 when analyzing whole tumor sections of invasive ductal breast carcinomas. We suggest further studies to focus on validation and the clinical impact of this method.
Footnotes
The author(s) declared no potential conflicts of interest with respect to the authorship and publication of this article.
The author(s) disclosed receipt of the following financial support for the research, authorship, and/or publication of this article: This study was sponsored by the Region of Southern Denmark and supported by the Cancer Foundation.