
Abstract
Glycosaminoglycans (GAGs), also known histologically as dermal mucin, accumulate in several inflammatory skin conditions. Because different GAG species have distinct immunologic effects, the authors examined two GAGs, hyaluronan (HA) and chondroitin sulfate (CS), using specific stains in cutaneous lupus erythematosus (CLE) and dermatomyositis (DM). In the dermis of one CLE subtype, tumid LE (TLE), they found only increased HA, but both HA and CS were significantly elevated in another CLE subtype, discoid LE (DLE). DM lesional dermis accumulated mainly CS but not HA. The authors then used glycomic gene expression microarrays to assess the expression of HA- and CS-related genes in CLE skin. Real-time quantitative PCR confirmed significantly increased expression of HAS2, CHSY1, and C4ST1 in the combined groups of CLE lesions (n = 8) compared to healthy controls (n = 4). Thus, the increase in HA in CLE presumably results from upregulation of HAS2, whereas CHSY1 and C4ST1 appear to contribute to increased CS. Based on their known immunomodulatory effects in other systems, HA and CS may thus participate in the pathophysiology of these inflammatory skin conditions.
Cutaneous lupus erythematosus (CLE) is a group of lupus variants in which cutaneous manifestations predominate. CLE may persist for years and cause impairment in quality of life, including vocational disability (Tebbe and Orfanos 1997; Meller et al. 2005). The Gilliam CLE classification system divides lupus erythematosus (LE)–specific skin lesions into three broad categories: acute cutaneous LE, subacute cutaneous LE (SCLE), and chronic cutaneous LE (Gilliam and Sontheimer 1981; Sontheimer and Provost 2004). In the current study, we have focused on SCLE and two chronic cutaneous forms of LE: tumid LE (TLE) and discoid LE (DLE). We have also examined another photosensitive autoimmune disease, dermatomyositis (DM), in which skin and striated muscles are affected by inflammation to varying degrees. DM skin lesions have a histologic appearance similar to SCLE.
Skin lesions of CLE and DM exhibit increased accumulation of dermal mucin (Ackerman et al. 2007). Dermal mucin is composed of glycosaminoglycans (GAGs), which are long, polyanionic, polysaccharide polymers consisting of repeating disaccharide units. GAGs have been classified into six different species depending on their structure: chondroitin sulfate (CS), hyaluronan (HA), dermatan sulfate (formerly CS-B), heparin, heparan sulfate, and keratan sulfate. All GAGs, except keratan sulfate, contain uronic acid residues, which are detected by Hale’s colloidal iron stain. GAGs are traditionally thought to provide mechanical resilience to connective tissue. In the setting of inflammation, however, some GAGs may function as pathogen-associated molecular patterns (PAMPs) and provide a signal of sterile injury (Taylor and Gallo 2006).
Experimentation in vitro has revealed some of the immunologic functional characteristics of specific GAG species. Low molecular weight (LMW) HA, but not high molecular weight HA, activates macrophages and dendritic cells (DCs) and plays a role in immune cell recruitment to sites of inflammation. CS, on the other hand, promotes neutrophil activation (Xiao et al. 2008), and the chondroitin-4-sulfate (C4S) form of CS activates monocytes to produce monokines (Rachmilewitz and Tykocinski 1998). Interestingly, CS also exhibits anti-inflammatory actions by counteracting the effects of tumor necrosis factor (TNF)–α and interleukin (IL)–1β in cell culture (Fioravanti and Collodel 2006; Xu et al. 2008). HA has not been shown to have such anti-inflammatory functions, nor has CS been shown to recruit immune cells to inflammatory sites. Thus, individual GAGs such as HA and CS likely have different effects in autoimmune disease because each has its own specific inflammatory functions in vitro.
Although GAGs are detected by Hale’s stain, it cannot distinguish among different GAG species. Thus, in the current study, we sought to identify the two specific GAG species, HA and CS, in the dermal mucin that accumulates in CLE and DM lesions. Not only is dermal mucin increased in these diseases, but the demonstrated in vitro functions of HA and CS may be important in the inflammatory process in CLE and DM in vivo. Then, we used glycomic gene expression microarrays (Comelli et al. 2006) to determine the expression of HA- and CS-related genes in SCLE, TLE, and DLE lesional skin and in non-lesional skin.
Materials and Methods
Collection of CLE and DM Patient Skin Specimens
Lesional skin biopsies from patients with SCLE, DLE, and TLE, as defined by the Gilliam classification system, and DM were obtained from patients in the dermatology clinic at the Hospital of the University of Pennsylvania. Healthy control skin was acquired from patients at the Philadelphia VA Hospital. Hematoxylin and eosin (H&E)-stained slides were prepared from all biopsies. This study was approved by the University of Pennsylvania Institutional Review Board (IRB), and all biopsies were obtained according to IRB protocol. The Declaration of Helsinki protocols were followed, and patients gave their written, informed consent. Biopsies were bisected and fixed in formalin as well as snap-frozen in liquid nitrogen.
Immunohistochemical Staining for CS
After slides were deparaffinized in xylene and hydrated in graded alcohol solutions, endogenous peroxidase activity was blocked using 3% hydrogen peroxide. Slides were blocked with 10% normal swine serum (Vector, Burlingame, CA) and incubated with the monoclonal IgM primary antibody CS-56 (Sigma, St. Louis, MO) diluted 1:1200 in 1% BSA solution for 30 min. CS-56 specifically recognizes C4S, chondroitin-6-disulfate (C6S), and chondroitin-2,6-sulfate (Avnur and Geiger 1984; Ito et al. 2005). The Universal LSAB+ Visualization System (Dako, Carpinteria, CA) was used to develop the slides. Negative control slides were processed concurrently with the substitution of mouse IgM isotype control antibody (Sigma) for the anti-CS antibody.
Immunohistochemical Staining for C6S
Staining was performed as for CS except that sections were predigested with 1 U/ml Chondroitinase ABC (Sigma), which released the C6S epitope, in reaction buffer (50 mM Tris, 60 mM sodium acetate, 0.02% BSA, pH 8) at 37C for 2 hr after a 20-min preincubation with reaction buffer alone at 37C. Slides were then incubated for 30 min with 10% normal swine serum, 10 min with 3% hydrogen peroxide, and then for 1 hr with Monoclonal Anti-Chondroitin Sulfate DDi-6S Antibody (1:100, Clone 3-B-3; Seikagaku, Tokyo, Japan). Negative controls were performed by incubating sections with PBS instead of Chondroitinase ABC.
Immunohistochemical Staining for HA
After deparaffinization and hydration, slides were blocked with 1% BSA solution; incubated with a 1:250 dilution of biotinylated hyaluronic acid-binding protein (Seikagaku), which detects both high molecular weight HA as well as HA oligosaccharides as small as decasaccharides (Hascall and Heinegård 1974), in 1% BSA solution for 30 min; and then streptavidin–horseradish peroxidase (HRP) for 30 min from the Universal LSAB+ Visualization System (Dako). Negative controls were achieved by pretreatment of sections first with 100 mM Na acetate buffer (pH 5) for 15 min in a 37C water bath and then with 100 TRU/ml Streptomyces hyalurolyticus hyaluronidase (Sigma) in 100 mM Na acetate buffer (pH 5) for 3 hr in a 37C water bath prior to incubating with peroxidase blocking reagent.
Semi-Quantitation of HA and CS Expression
The staining level of HA and CS in the upper and total dermis of all slides was semi-quantitatively graded in a blinded fashion by a dermatopathologist on a scale from 0 (absent) to 4 (high). The results were averaged for each disease subtype and for normal control skin. We used ANOVA and Dunnett’s post hoc test to determine significance.
Immunohistochemical Staining for CD3, CD4, and CD8
After slide deparaffinization and hydration, antigen retrieval was performed in Target Retrieval Solution, High pH (S3308; Dako) for 10 min (20 min for CD4) using a water bath. Slides were then blocked with 10% normal swine serum (Vector) for 30 min. Tissue sections were incubated for 2 hr at room temperature either with anti-CD3 antibody (1:50, Clone PS1; Novocastra, Newcastle-upon-Tyne, UK), anti-CD4 antibody (1:20, Clone 1F6; Novocastra), or anti-CD8 antibody (1:100, Clone C8/144B; Dako). Slides were then incubated with secondary antibody and then streptavidin-HRP from the Universal LSAB+ Visualization System (Dako). Sections were developed with freshly prepared NovoRed (Vector) for 5 min for CD3 or with DAB chromogen (Dako) for 5 min for CD4 and CD8. Slides were counterstained with hematoxylin. Appropriate isotype-matched controls were performed as negative controls. We determined the number of CD4+ and CD8+ cells in CLE lesions by counting cells per high power field.
RNA Extraction from Skin Dermis
Snap-frozen biopsies were cut into pieces 15 to 30 mg in size. The epidermis was split from the dermis of all biopsies to eliminate keratinocyte RNA. Each piece was placed in 1M NaCl/50 mM dithiothreitol (DTT) solution at 55C for 1 min, and then the epidermis was split from the dermis. The dermis was quickly placed into 300 µl of Qiagen’s Buffer RLT (Qiagen, Valencia, CA) with β-mercaptoethanol and homogenized with a rotor-stator homogenizer. Qiagen’s RNEasy Fibrous Tissue Kit was used to extract and purify total RNA and included a proteinase K digestion step for 10 min at 55C as well as on-column DNA digestion. RNA sample quality was assessed with an Agilent Bioanalyzer (Agilent Technologies, Palo Alto, CA).
Microarray Gene Expression Analysis
RNA from each sample was labeled using the MessageAmp II–Biotin Enhanced Amplification Kit (Ambion, Austin, TX) and hybridized to the GLYCOv3 oligonucleotide array, a custom Affymetrix GeneChip (Affymetrix, Santa Clara, CA) designed for the Consortium for Functional Glycomics (https://www.functionalglycomics.org). Hybridization and scanning to the GLYCOv3 chip were performed according to Affymetrix’s recommended protocols (Lockhart et al. 1996). Chips had a background less than 50 intensity units and a glyceraldehyde-3-phosphate dehydrogenase (GAPDH) 3′/5′ ratio less than 1.8. Robust Multichip Average (RMA) was used to convert the intensity values to expression values (Bolstad et al. 2003; Irizarry et al. 2003). ANOVA was performed using BRB Array Tools, developed by Dr. Richard Simon and Amy Peng Lam. We used ANOVA to identify genes on the chip arrays that were differentially expressed for SCLE, TLE, and DLE between lesional and control samples and between non-lesional and control samples.
Quantitative Real-Time RT-PCR
Of total RNA, 344 ng in a 55-µl reaction was reverse transcribed using the SuperScript First-Strand Synthesis System for RT-PCR (Invitrogen, Carlsbad, CA) with random hexamer primers. Real-time PCR was performed using Taqman Gene Expression Assays (Applied Biosystems, Foster City, CA) specific for HAS2 (Assay ID Hs00193435_m1), CHSY1 (Assay ID Hs00208704_m1), and C4ST1 (Assay ID Hs00218229_m1). A 25-µl reaction mixture was prepared for each cDNA sample containing 2 µl cDNA, 1.25 µl Taqman Primer-Probe Mix, 12.5 µl 2× Taqman Master Mix (Applied Biosystems), and 9.25 µl water. GAPDH endogenous control (Assay ID Hs99999905_m1) was run for each cDNA sample, and all reactions were performed in triplicate. Controls and CLE samples were analyzed on the same plate for each gene. Real-time PCR was performed on an ABI 7000 Sequence Detection System (Applied Biosystems) using the following program: (step 1) 50C for 2 min, (step 2) 95C for 10 min, (step 3) 95C for 15 sec for 40 repetitions, and (step 4) 60C for 1 min. The ΔΔCt method was employed to analyze the differential gene expression in CLE samples compared to controls. Statistical analysis was performed using the Kruskal-Wallis test and the Mann-Whitney U test.
Results
Glycosaminoglycans are increased in CLE and dermatomyositis skin lesions
We used Hale’s stain, which produces a blue color, to detect GAGs in lesions from six SCLE, five DLE, five DM, and five TLE patients and in healthy skin from five controls (Fig. 1a–e). We also stained separate sections for HA (Fig. 1f–j) and CS (Fig. 1k–o), using a brown chromogen, with hyaluronic acid–binding protein and the CS-56 monoclonal antibody, respectively. CLE and DM patient slides were separated into two groups for HA and CS staining: One group consisted of DLE and TLE lesions. The second group consisted of DM and SCLE lesions. Each group was then stained simultaneously, once for HA and then again for CS, with five healthy control patients, four of whom were the same patients. Normal healthy control skin staining was as previously reported for HA (Wang et al. 1992; Tammi et al. 1994) and CS (Daugaard et al. 1991).
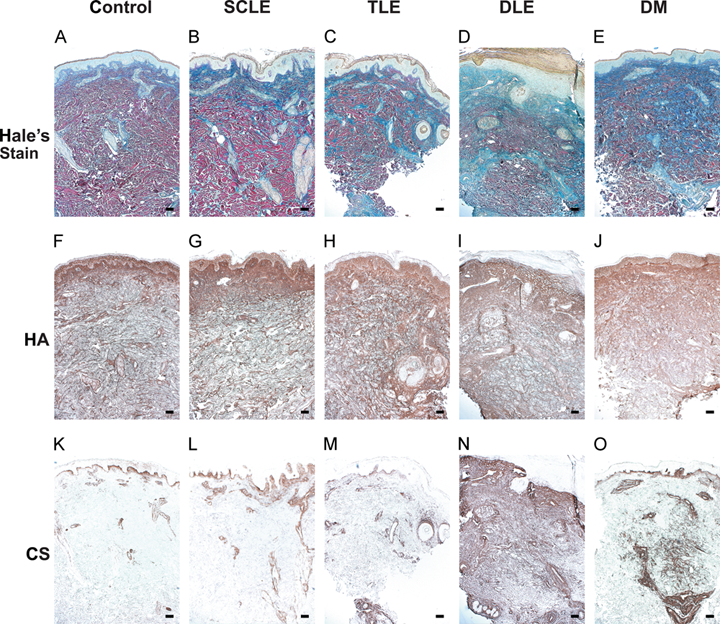
Glycosaminoglycans (GAGs), as well as HA and CS in particular, are increased in cutaneous lupus erythematosus (CLE) subtypes and DM skin lesions compared to healthy control skin. (a–e) GAGs stained blue by Hale’s stain are increased in representative skin lesions from CLE and DM patients compared to healthy control skin. (f–j) HA and (k–o) CS, stained for separately in the same CLE patients and controls with a brown chromogen, are increased in certain CLE subtypes and/or DM skin lesions. Bar = 200 µm. HA and CS negative control sections did not produce staining in lesional or healthy control skin (data not shown). HA, hyaluronan; CS, chondroitin sulfate; SCLE, subacute cutaneous lupus erythematosus; TLE, tumid lupus erythematosus; DLE, discoid lupus erythematosus; DM, dermatomyositis.
Compared to control skin, CLE and DM lesions exhibited increased mucin accumulation by Hale’s stain (Fig. 1a–e). SCLE lesions generally showed a minor accumulation of GAGs in the upper dermis (Fig. 1b) consisting mostly of HA and, to a lesser extent, CS (Fig. 1g,l). TLE lesions exhibited an increase in Hale’s staining (Fig. 1c), and HA staining was increased but not CS (Fig. 1h, m). DLE lesions had a striking elevation in Hale’s staining throughout the dermis compared to controls (Fig. 1d). This large accumulation of GAGs in DLE corresponded to a significant increase in the density of both HA and CS staining in DLE lesions (Fig. 1i, n). DM lesions displayed a significant increase in Hale’s stain and CS compared to controls (Fig. 1e, o). Not all Hale’s staining, though, was accounted for by HA and CS staining, indicating that there may be other GAGs also present in CLE and DM lesions.
The CS staining pattern in DM lesions was distinct from that in DLE (Fig. 1n, o): CS in DLE was dense and present throughout the entire dermis of most lesions, but DM lesional dermis exhibited fine, dispersed patches of CS. CS was also prominent in the endothelium of blood vessels in DM lesions (Fig. 1o).
Semi-quantitation reveals increased HA in TLE, HA and CS in DLE, and CS in DM lesions
Total and upper dermal staining of HA and CS among disease subtypes and controls was graded in a blinded fashion from 0 (absent) to 4 (high) and averaged for each disease subtype (Fig. 2). The statistical analysis was performed with ANOVA and Dunnett’s post hoc tests among the patient and control slides that were stained simultaneously. A significant increase in HA accumulation was present in the upper dermis of TLE lesions compared to controls (Fig. 2a). Compared to the other diseases analyzed, DLE was the only disease subtype that had large significant accumulations of both HA (Fig. 2a) and CS (Fig. 2b). Finally, DM lesions had a statistically significant increase in dermal CS (Fig. 2b). We did not find statistically significant increases in HA expression between DM and SCLE lesions and controls as well as in CS expression between TLE and SCLE lesions and controls.
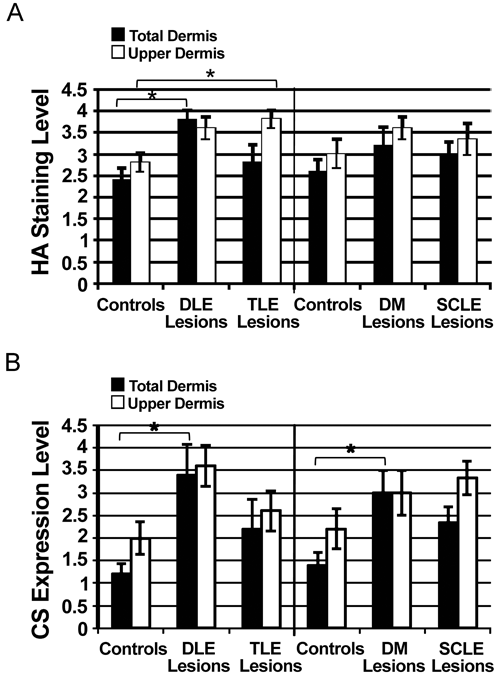
HA is significantly increased in DLE and TLE lesions, and CS is significantly increased in DLE and DM lesions. Semi-quantitative analysis of (a) HA and (b) CS staining on a scale of 0 (absent) to 4 (high). (a) HA was significantly elevated in the total dermis of DLE lesions compared to healthy controls (3.8 ± 0.22 vs 2.4 ± 0.27, p < 0.05) and the upper dermis of TLE lesions compared to controls (3.8 ± 0.22 vs 2.8 ± 0.22, p < 0.05). (b) Compared to controls, CS staining was significantly elevated in the total dermis of DLE lesions (3.4 ± 0.67 vs 1.2 ± 0.22, p < 0.05) and DM lesions (3.0 ± 0.5 vs 1.4 ± 0.27, p < 0.05). Data are reported as the mean ± SEM (n = 5 for controls and DLE, DM, TLE lesions; n = 6 for SCLE lesions). ANOVA and Dunnett’s post hoc test were performed between CLE subtypes and/or DM and controls. * indicates p < 0.05 by both tests. HA, hyaluronan; CS, chondroitin sulfate; DLE, discoid lupus erythematosus; TLE, tumid lupus erythematosus; DM, dermatomyositis; SCLE, subacute cutaneous lupus erythematosus.
C6S accumulates around blood vessels in DM more than in DLE
Because DLE and DM lesions exhibited increased dermal CS, we next examined the staining pattern of a specific CS isoform, C6S, using the monoclonal anti–chondroitin sulfate DDi-6S antibody in five DLE lesions, five DM lesions, and healthy controls (Fig. 3d–i). C6S highlighted blood vessels, adnexal structures, and the dermal–epidermal junction but did not accumulate within the dermis of DLE or DM lesions (Fig. 3e, f) except in one DM patient. Thus, other isoforms of CS are likely accumulating in DLE and DM. Interestingly, C6S highlighted blood vessels most strongly in DM lesions (Fig. 3g–i) and, to a lesser extent, in DLE lesions. Healthy controls had the lowest amount of C6S around blood vessels.
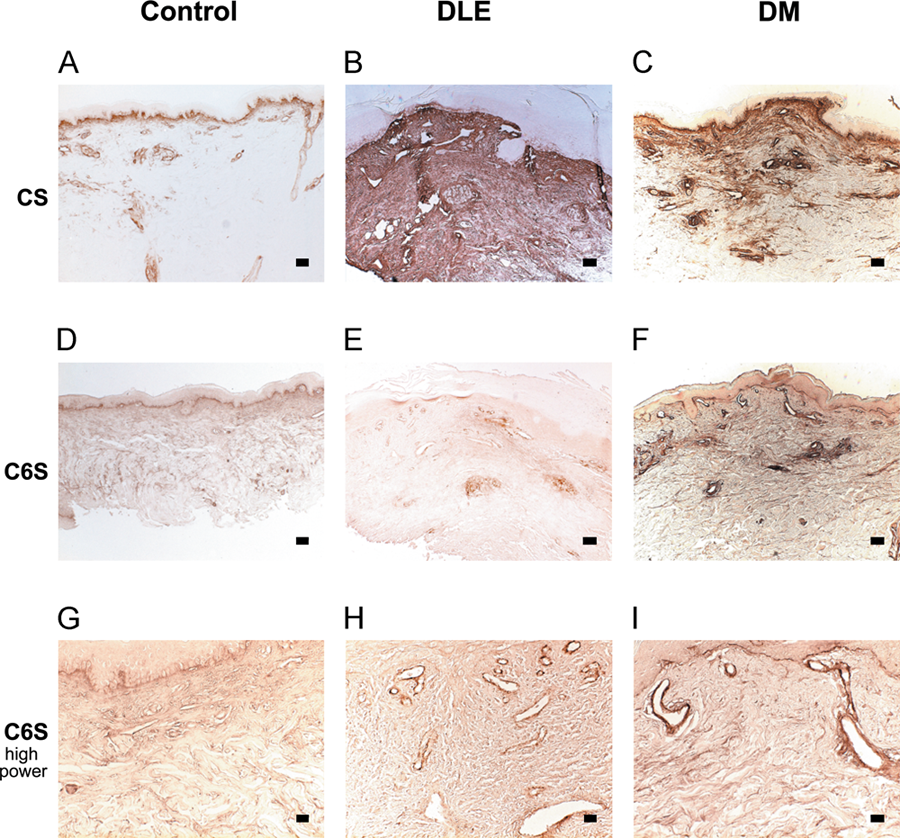
C6S accumulates around blood vessels in DM more than in DLE. CS staining was performed in representative (a) healthy control skin, (b) DLE, and (c) DM lesions using the CS-56 antibody. Bar = 200 µm. Compared to CS staining with CS-56, C6S staining (d–f) in the same DLE and DM patients is greatly reduced. Bar = 200 µm. (g–i) C6S outlines blood vessels most strongly in (i) DM lesional skin, modestly in (h) DLE lesional skin, and least in (g) healthy control skin. Bar = 50 µm. CS, chondroitin sulfate; C6S, chondroitin-6-sulfate; DLE, discoid lupus erythematosus; DM, dermatomyositis.
CD3+ T cells occur in areas of dense HA and CS staining
We also performed immunohistochemical staining for CD3, CD4, and CD8 in CLE and DM lesions and healthy control skin. Both CD4+ and CD8+ cells localized in clusters of cells that also stained for CD3. We did not find a significant difference in the number of CD4+ and CD8+ cells in CLE lesions (data not shown). Although healthy control skin did contain clusters of CD3+ cells near blood vessels, they were much fewer than in CLE lesions when compared visually.
We compared the location of CD3 staining to HA and CS staining in CLE and DM lesions. Most SCLE lesions displayed CD3+ cells in areas of denser HA and CS staining (data not shown). DLE lesions also had CD3+ cells located in areas of dense HA and CS staining, but HA and CS staining also extended beyond the locations of these cell clusters (Fig. 4a,c,e). In TLE lesions, CD3+ cells also occurred in the same areas as increased HA staining and, to a lesser extent, in areas of CS staining (Fig. 4b,d,f). In contrast, most DM lesions did not display CD3+ cells in areas of dense HA or CS staining (data not shown).
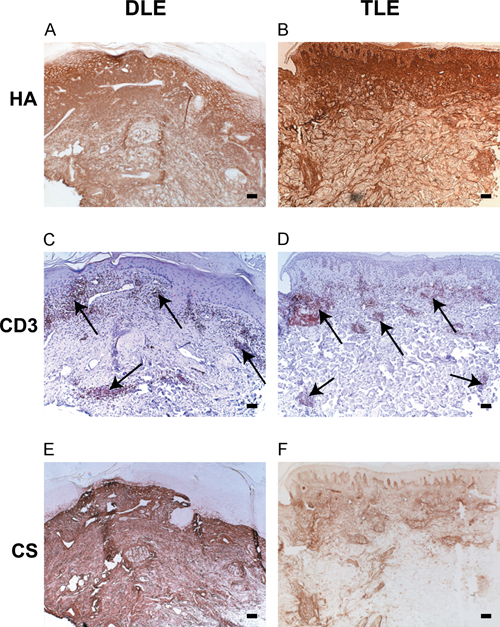
CD3+ T cells occur in areas of dense HA and CS staining. (a, b) HA and (e, f) CS staining in representative DLE and TLE lesions when visually compared to (c, d) CD3 staining (red) is present in areas of CD3+ T cells. Arrows indicate representative clusters of CD3+ cells. Bar = 200 µm. HA, hyaluronan; CS, chondroitin sulfate; DLE, discoid lupus erythematosus; TLE, tumid lupus erythematosus.
Microarrays reveal differentially expressed HA- and CS-related genes in CLE dermis compared to healthy control dermis
We performed a microarray experiment to determine which genes may modulate the accumulation of dermal HA and CS in CLE. Total dermal RNA was extracted from lesional and non-lesional SCLE, TLE, DLE, and healthy control skin biopsies. The RNA was labeled and hybridized to the GLYCOv3 chip (Comelli et al. 2006), which contains probes for ~1200 human transcripts, all highly annotated and directly related to glycobiology. Hits were validated using real-time quantitative PCR, and samples were pooled together to achieve greater statistical power.
Among the three hyaluronan synthase (HAS) genes responsible for HA synthesis (Weigel et al. 1997), only HAS2 expression was increased in CLE lesions compared to controls. Real-time PCR also confirmed the increase in HAS2 expression in CLE lesions, which was four times the control value (Fig. 5).
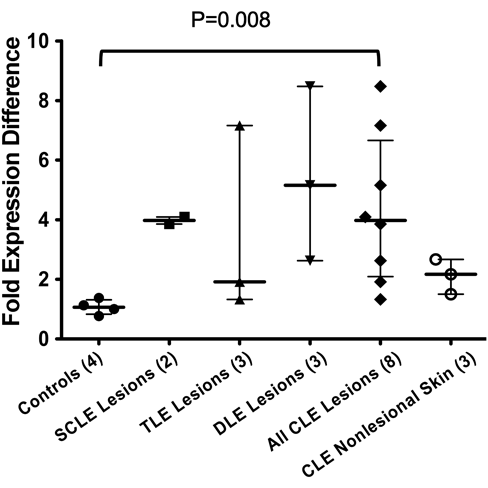
HAS2 gene expression is increased in CLE lesional dermis compared to healthy control dermis by real-time PCR. Increased HAS2 expression is significant among all CLE lesions (n = 8) compared to healthy controls (n = 4) (3.97 vs 1.06, median). Data are reported as median and 25th and 75th percentiles. The Kruskal-Wallis test (p < 0.05) and the Mann-Whitney U test (p = 0.008) were used to determine significance. SCLE, subacute cutaneous lupus erythematosus; TLE, tumid lupus erythematosus; DLE, discoid lupus erythematosus; CLE, cutaneous lupus erythematosus.
Chondroitin sulfate assembly involves chondroitin synthase (CHSY)1, CHSY2, chondroitin polymerizing factor (CHPF), and chondroitin sulfate glucuronyltransferase (CSGlcA-T) (Izumikawa et al. 2008). Among these four genes, only CHSY1 showed differential expression on the microarray in CLE lesions, which was validated by real-time PCR (Fig. 6a).
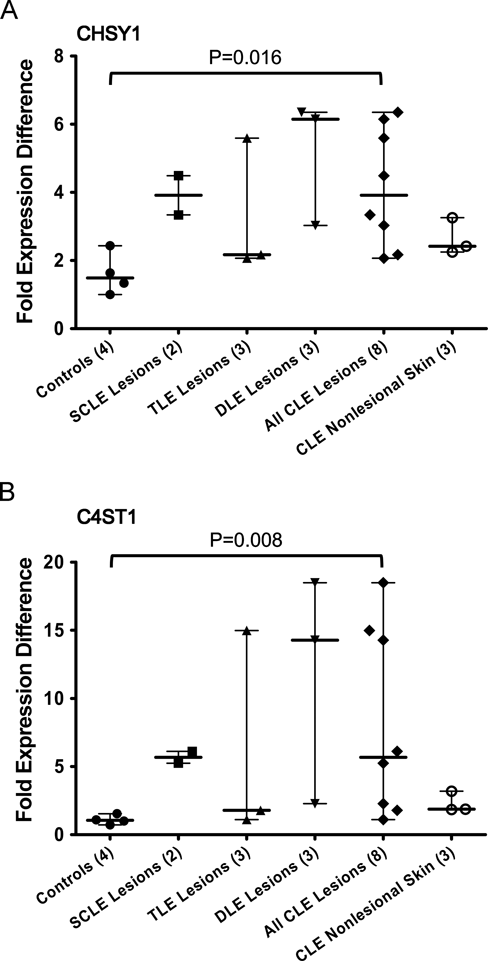
CHSY1 and C4ST1 are both upregulated in CLE lesions compared to healthy control dermis by real-time PCR. (a) CHSY1 expression is increased in CLE lesional dermis (n = 8) compared to healthy control dermis (n = 4) (3.92 vs 1.49, median). (b) C4ST1 expression is increased in CLE lesional dermis (n = 8) compared to healthy control dermis (n = 4) (5.68 vs. 1.05, median). DLE lesions have the largest increase of both CS genes. Data are reported as median and 25th and 75th percentiles. The Kruskal-Wallis test (p < 0.05) and the Mann-Whitney U test were used to determine significance (p = 0.016 for CHSY1; p = 0.008 for C4ST1). CHSY1, chondroitin synthase 1; C4ST1, chondroitin-4-sulfotransferase; SCLE, subacute cutaneous lupus erythematosus; TLE, tumid lupus erythematosus; DLE, discoid lupus erythematosus; CLE, cutaneous lupus erythematosus.
The most common chondroitin sulfate polymers contain sulfate groups on position 4 (C4S) or position 6 (C6S) of GalNAc residues, and both forms are recognized by the CS-56 antibody. Among the gene products known to transfer sulfate to these positions, the expression of chondroitin-4-sulfotransferase 1 (C4ST1), also known as carbohydrate sulfotransferase 11 (CHST11), was increased in CLE lesions almost six-fold compared to healthy control skin by real-time PCR (Fig. 6b). Carbohydrate sulfotransferases CHST 1, 2, 3, 5, 8, 9, and 13, genes known to be involved in sulfate transfer to CS residues, were not differentially expressed on the microarray.
Discussion
We have shown that two specific GAG species, HA and CS, accumulate in CLE and DM skin lesions. HA expression was significantly increased in DLE and TLE skin lesions, whereas CS was significantly increased in DLE and DM lesions compared to healthy control skin. Thus, these GAGs with proven immune functions in vitro exist at the site of inflammation in these diseases and may participate in their pathophysiology.
We found that DLE was the only condition with accumulation of both HA and CS. This increase in both HA and CS may contribute to the more resistant nature of this disease: (1) Among CLE subtypes, DLE represents a disproportionate number of patients with disease refractory to current therapies (Moghadam-Kia et al. 2009); (2) DLE patients have a higher Cutaneous Lupus Erythematosus Disease Area and Severity Index (CLASI) damage score than TLE and SCLE patients (Moghadam-Kia et al. 2009); (3) DLE lesions lead to scarring, whereas TLE and SCLE lesions heal without scarring (Kuhn et al. 2007); and (4) the inflammatory infiltrate in DLE is much more extensive and deeper than in other CLE subtypes and DM (Crowson and Magro 2001; Wenzel et al. 2006).
GAGs are produced from fibroblasts as well as endothelial cells, and HA specifically is synthesized also by dendritic cells and keratinocytes (Taylor and Gallo 2006). In addition, other immune cells such as T cells, B cells, and monocytes have the ability to synthesize proteoglycans, particularly those consisting of chondroitin sulfate (Levitt and Ho 1983). The GAGs accumulated in CLE and DM lesions could have been synthesized by cells already present in the skin such as fibroblasts, endothelial cells, or keratinocytes or by immune cells that were recruited to these inflamed skin sites such as dendritic cells, macrophages, or lymphocytes. We have observed that CD3+ T cells occur in areas of dense HA and CS staining but do not yet know if the GAGs preceded or followed the infiltration of T cells into the skin.
The roles of HA and CS in CLE and DM is not yet clear because both of these GAGs can have both pro- and anti-inflammatory effects in vitro depending on their specific form. Hyaluronan has been implicated in immune-mediated processes in various organ systems (Bray et al. 1991; de la Motte et al. 2003; Tesar et al. 2006; Taylor et al. 2007). The size of HA that accumulates in injured tissue is important because different sizes of HA can have opposite inflammatory functions. The protein used to detect HA in our study binds both high molecular weight HA as well as HA oligosaccharides as small as decasaccharides (Hascall and Heinegård 1974). High molecular weight HA is protective against acute injury (Jiang et al. 2005), whereas LMW HA or HA fragments can activate immune cells such as DCs (Termeer et al. 2002; Tesar et al. 2006) and macrophages (Hodge-Dufour et al. 1997; Jiang et al. 2007) via TLR4 and TLR2. CLE is a photosensitive disease, and ultraviolet B (UVB) irradiation likely contributes to CLE pathogenesis. The gene expression of HA degrading enzymes, or hyaluronidases, is induced by UVB irradiation in the skin and fibroblasts (Averbeck et al. 2007), and reactive oxygen species, which are increased by UVB, are capable of catabolizing HA (Agren et al. 1997). Thus, UVB irradiation could theoretically trigger HA fragmentation in CLE.
HA also functions in immune cell recruitment to sites of inflammation via its major receptor, CD44, which is known to participate in immune cell homing (DeGrendele et al. 1996; Gee et al. 2004; McDonald et al. 2008). Interestingly, CS can affect the binding of HA to CD44 (Esford et al. 1998; Ruffell and Johnson 2005), which also plays an important role in HA clearance and limiting of the inflammatory response (Gee et al. 2004; Jiang et al. 2007).
Using both microarray gene expression analysis and real-time PCR, we have found that HAS2 is upregulated in CLE lesions and is likely the gene responsible for the increase in HA. Interestingly, glucocorticoids can suppress HAS2 levels in cultured dermal fibroblasts (Zhang et al. 2000; Gebhardt et al. 2010), suggesting that one mechanism for their anti-inflammatory effects may be the reduction of HA production. As for CS, the increase in CHSY1 and C4ST1 may be responsible for the accumulation of CS in CLE. Moreover, an increase in expression of C4ST1, a gene involved in the synthesis of C4S specifically, is important because C4S can activate monocytes (Rachmilewitz and Tykocinski 1998).
In conclusion, this is the first published account that the specific GAGs HA and CS are increased in the skin lesions of CLE and DM patients. Knowledge of the role of glycobiology in the autoimmune response in CLE will likely be critical given what we currently know about the immune functions of HA and CS in vitro and their accumulation in this disease.
Footnotes
The author(s) declared no potential conflicts of interest with respect to the authorship and/or publication of this article.
The author(s) disclosed receipt of the following financial support for the research and/or authorship of this article: This work was supported by the Lupus Foundation of American; in part by a Merit Review Grant from the Department of Veterans Affairs Veterans Health Administration, Office of Research and Development, Biomedical Laboratory Research and Development; the National Institutes of Health (grant number NIH K24-AR 02207) to VPW; the National Institutes of Health training grant (grant number NIH T32-AR007465-25) to LMC; and the Consortium for Functional Glycomics Grant (grant number GM-62116) from the National Institutes of Health.