
Abstract
Oncostatin M (OSM) and leukemia inhibitory factor (LIF) belong to the interleukin-6 family of cytokines. The authors' previous in vitro work demonstrated that in mouse cells mouse OSM (mOSM) signals through a heterodimeric receptor complex incorporating the mOSM-specific receptor mOSMRβ while human OSM (hOSM) and bovine OSM (bOSM) use the mouse LIF receptor mLIFRβ rather than mOSMRβ. These in vitro data suggest that prior studies in mouse systems with hOSM or bOSM (the usual molecules used in early studies) reflect LIF rather than OSM biology. The current work assessed whether or not this divergence in actions among these three OSMs also occurs in vivo in mouse models. Adult female (C57BL/6J x DBA/2J) F1 mice were engineered to stably overexpress mOSM, hOSM, or bOSM by retrovirus-mediated gene transfer (n = 10 or more per group). After 4 weeks, molecular and hematologic profiles and anatomic phenotypes in multiple organs were assessed by standard techniques. Animals overexpressing either hOSM or bOSM had an identical phenotype resembling that associated with LIF activation, including significant hematologic abnormalities (anemia, neutrophilia, lymphopenia, eosinopenia, and thrombocytosis); weight loss; profound enlargement (lymph node, spleen) and/or structural reorganization (lymph node, spleen, thymus) of lymphoid organs; and severe osteosclerosis. In contrast, mice overexpressing mOSM did not develop hematologic changes, weight loss, or osteosclerosis and exhibited more modest and anatomically distinct restructuring of lymphoid organs. These data indicate that activities imputed to OSM and the mOSMRβ signaling pathway using in vitro and in vivo mouse experimental systems are unique to mOSM.
Keywords
Oncostatin M (OSM) is structurally and functionally related to interleukin-6 (IL-6), leukemia inhibitory factor (LIF), ciliary neurotrophic factor (CNTF), interleukin-11 (IL-11), and cardiotrophin-1 (CT-1). Such IL-6-type cytokines have been demonstrated to be crucial mediators during normal development, hematopoiesis, and immunity as well as in many disease states. 9 The OSM signaling pathway in particular has been implicated as an essential regulator for hematopoiesis 26, 29 —especially extrathymic, thymus-independent T-lymphocyte development 2, 3 —and hepatic, 26 neural, 4, 27 and reproductive tract 8 organization as well as an important contributor to autoimmune disease 31 and a potential factor in controlling neoplastic cell growth. 12 Doubtless other roles will be added to OSM's repertoire as our understanding of its biology improves.
Signaling by members of the IL-6 cytokine family is mediated by a heterodimeric receptor complex comprising a ligand-binding α subunit and a signal-transducing β subunit. 7, 10, 11, 16, 32, 38 Each of these cytokines binds its own specific α component. 11, 16, 41 However, multiple cytokines share the common β subunit, including gp130, 10 LIF receptor β (LIFRβ), 7 and OSM receptor β (OSMRβ). 20, 28 When cytokine is bound to the appropriate heterodimeric complex, the β component is phosphorylated and launches a signal transduction cascade that activates other cytoplasmic proteins, such as Janus kinases and signal transduction and transcription (STAT) molecules. 14, 37 In humans, functional interactions have been demonstrated for OSM with both the gp130/LIFRβ (OSM receptor type I 7 ) and gp130/OSMRβ (OSM receptor type II 28 ) complexes.
Of the cytokines in the IL-6 family, OSM shares the greatest structural homology with LIF. Genes encoding these two proteins occupy contiguous loci on human chromosome 22. 18, 34 Recently, we 20 and another group 28 determined the sequences of the mouse and human OSMRβ genes and demonstrated that their signaling subunits also exhibited good homology with that of LIFRβ. This finding was anticipated because the genes encoding OSMRβ and LIFRβ are located within a few hundred kilobase span on chromosome 5p in humans (http://www.avatar.se/HGNC/wr/chromosome/5p [last accessed May 20, 2008]) and a 1.7 cM span of the homologous portion of chromosome 15p in the mouse. 39 Taken together, these facts suggest that OSM/OSMRβ and LIF/LIFRβ originated from a common set of ancestral genes late in vertebrate evolution.
Despite their probable shared origin, divergent signaling pathways are activated when cultured mouse cells are treated with OSM or LIF. 20 For example, OSM but not LIF inhibits the growth of human melanoma cells 23, 43 and stimulates the autocrine growth of human sarcoma cells. 25 Interestingly, substantial overlap exists in the functions mediated by OSM/OSMRβ and LIF/LIFRβ. Both OSM and LIF induce differentiation of human myeloid leukemia cells, inhibit differentiation of mouse embryonic stem cells, 35 and enhance the expression of acute phase genes in primary hepatocytes. 1, 33 In many instances, the exact pathways by which OSM and LIF mediate their effects have not been defined with certainty. Productive interactions clearly will occur for the species-specific ligand/receptor pairings (human OSM [hOSM]/human OSMRβ [hOSMRβ] and human LIF [hLIF]/human LIFRβ [hLIFRβ]; mouse OSM [mOSM]/mouse OSMRβ [mOSMRβ] and mouse LIF [mLIF]/ mouse LIFRβ [mLIFRβ]). However, the similarity of OSM and LIF suggests that crosstalk might be possible within (e.g., mOSM/mLIFRβ, mLIF/mOSMRβ) or across (hOSM/mLIFRβ and hOSM/mOSMRβ; mOSM/hLIFRβ and mOSM/hOSMRβ) species.
Mouse cDNA sequences of OSM or OSMRβ were not cloned until recently. 20, 42 Thus, prior in vivo assessments of OSM biology were conducted using either hOSM or bovine OSM (bOSM) cDNA. 5, 6, 22, 40 Unfortunately, the close correspondence between the ligand and receptor genes as well as the similar functions of OSM and LIF raise the possibility that biological investigations of one pathway have, in fact, actually elucidated the functions of the opposing system in error. Prior in vitro work has shown that mOSM and mLIF do not act via the same functional receptor and that mOSM signals only through its specific receptor. 13 We previously tested this possibility in vitro using purified ligands and mouse NIH 3T3 cells and confirmed that hOSM signals via mLIFRβ but not mOSMRβ, whereas mOSM engages mOSMRβ but not mLIFRβ. 20 The current study was performed to determine whether this outcome is specific to the in vitro setting and/or chosen cell line or whether it actually reflects a distinct difference between the biologic capacities of these ligands in mice. Our data demonstrate that the phenotypes induced by murine OSM and nonmurine OSM in mouse experimental systems are distinct, indicating that all prior in vivo studies of nonmurine OSM in mouse systems may have actually demonstrated LIF-mediated effects.
Materials and Methods
Reagents
Recombinant mOSM, hOSM, or bOSM were generated in 293T cells as described. 20 Reagents and enzymes for polymerase chain reaction (PCR) and DNA restriction were purchased from Boehringer Mannheim (Indianapolis, IN). Chemicals were bought from Sigma (St. Louis, MO) unless otherwise indicated. The production of anti-mOSMRβ antiserum was described previously. 20 Antiphosphotyrosine antibodies were obtained from UBI (Lake Placid, NY). Anti-STAT3 and anti-LIFR antibodies were acquired from Santa Cruz Biotechnology (Santa Cruz, CA). Recombinant mOSM and hOSM were purchased from R&D Systems (Cambridge, MA). Oligonucleotides for mOSM (5′-GGG AAT TCC ACC ATG CAG ACA CGG CTT C-3′ and 5′-GCG CAG ATC TCT AGG CCC TGG TCG TCG-3′), hOSM (5′-GGG AAT TCC ACC ATG GGG GTA CTG CTC ACA C-3′ and 5′-GCG CAG ATC TAC CGG GGC AGC TGT CCC C-3′), and bOSM (5′-GGC GGC CGC CAC CAT GGG GGC ACA GCG TAT GC-3′ and 5′-GGG AAT TCA CCT GGC AGG GGC ACC CCA AAG G-3′) were synthesized by the DNA Technology Group at Amgen (Thousand Oaks, CA) using a 394 DNA Synthesizer (Applied Biosystems, Foster City, CA).
OSM signaling in NIH 3T3 cells
NIH 3T3 cells were treated with media from 293T cells containing mOSM, hOSM, or bOSM for 15 minutes and then lysed in NP40 lysis buffer (50 mM Tris [pH 8.0], 150 mM NaCl, 1% Nonidet P-40, 10 mg/ml aprotinin, 5 mM ethylenediaminetetraacetic acid, 200 mM sodium orthovanadate). Lysates were immunoprecipitated with antibodies against OSMRβ, LIFRβ, or STAT3, after which precipitates were collected on protein G-Sepherose beads (Santa Cruz Biotechnology) and boiled in sample buffer followed by gel electrophoresis. Proteins were electroblotted onto a polyvinylidene difluoride membrane (Amersham, Arlington Heights, IL), probed with antiphosphotyrosine antibodies, and detected by enhanced fluorescence using horseradish peroxidase-conjugated secondary reagents (Amersham).
Construction of OSM retroviral vectors
Full-length cDNA encoding mOSM, hOSM, or bOSM was amplified by PCR using synthetic oligonucleotides that introduced an EcoRI site and a Kozak sequence at the 5′ end and a BglII site at the 3′ end. The PCR products were digested with EcoRI and BglII and subcloned into the MSCV2.1 retroviral vector (kindly supplied by Dr. R. Hawley, University of Toronto, Toronto, Ontario, Canada) (Fig. 1). Expression of the OSM insert was driven by the retroviral long terminal repeat (LTR) promoter already present in the MSCV2.1 plasmid. The constructs were sequenced using a 377 Sequencer (Applied Biosystems) to confirm the absence of mutations. The vectors contained a G418-resistance (G418r) gene (phosphoglycerine kinase/neomycin resistance [pgk/neo] cassette) to allow selection of successful transfections.
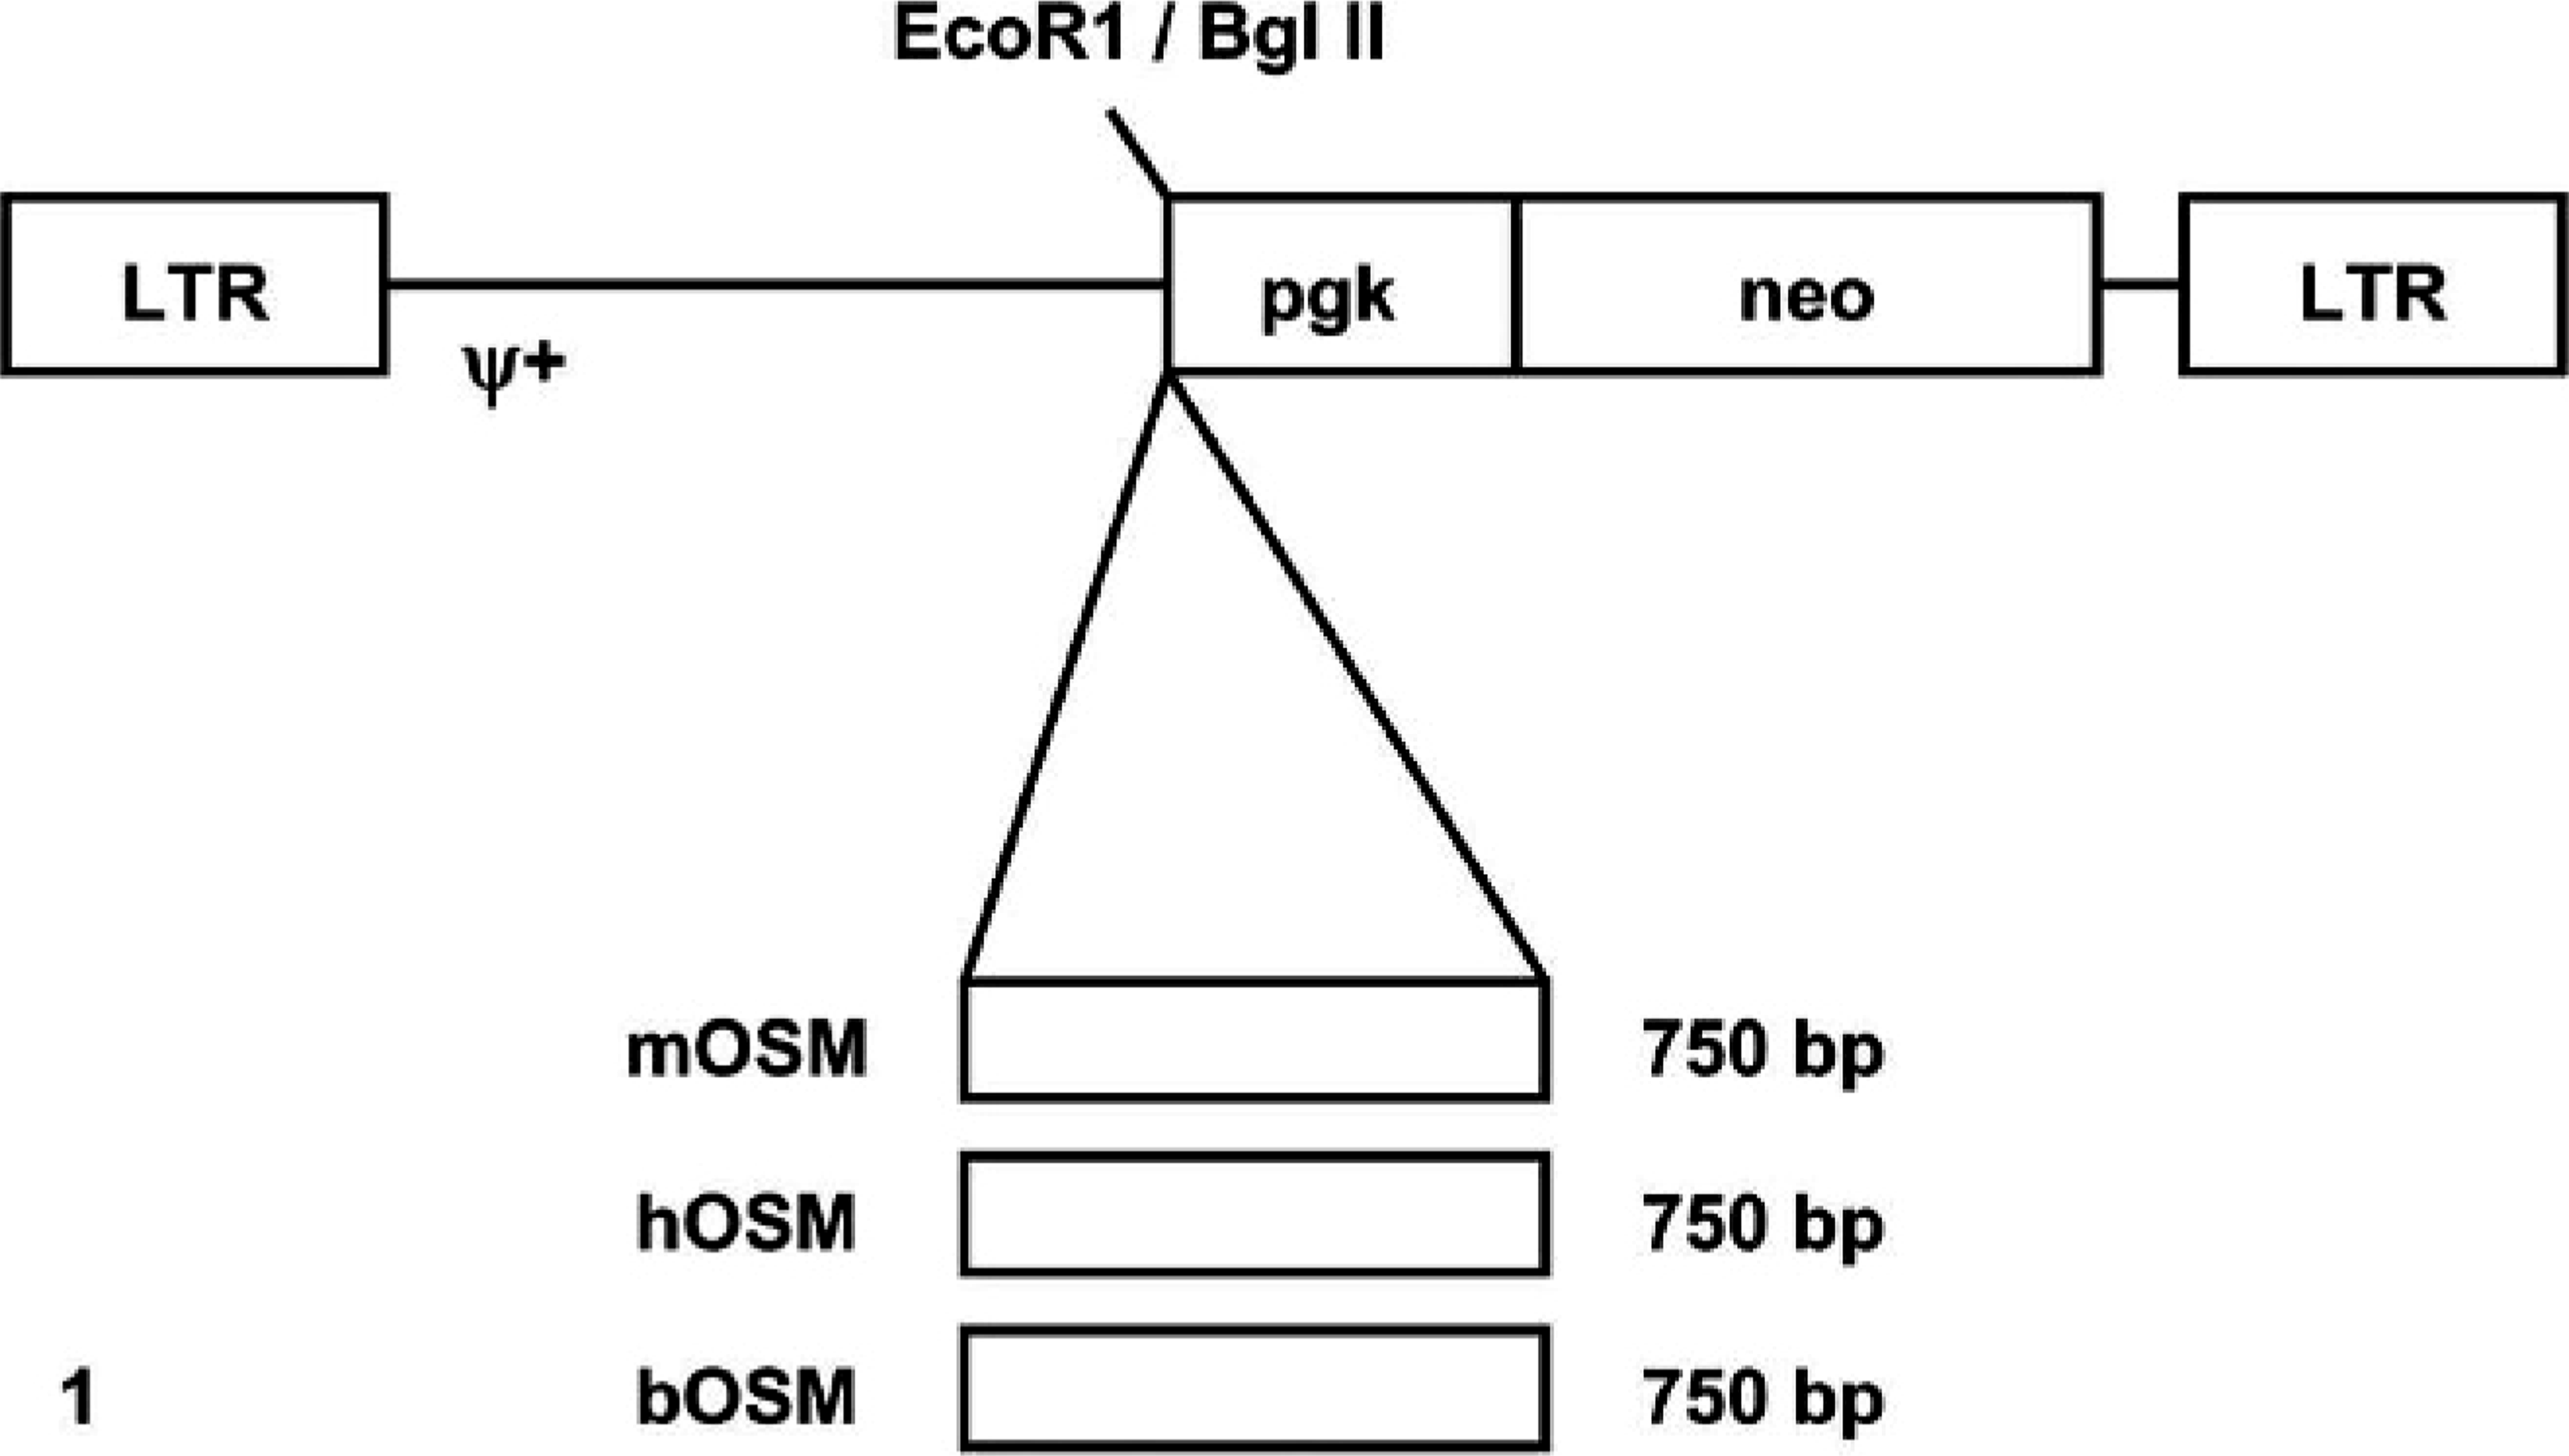
Construction of retroviral gene transfer vectors. A cDNA (750 bp) of one oncostatin M variant—either mouse (mOSM), human (hOSM), or bovine (bOSM)—was subcloned into the EcoRI/BglII site of vector MSCV2.1 just upstream of a pgk/neo cassette. Abbreviations: LTR, long terminal repeat; Ψ+, phi+ retroviral packaging signal.
Production of retroviral supernatants
Recombinant viruses carrying the parental vector MSCV2.1 (negative control) or an OSM-bearing construct (pMSCV-bOSM, pMSCV-hOSM, or pMSCV-mOSM) were transiently generated as described. 30 Briefly, 5×10⁶ BOSC 23 cells were seeded in a 100-mm-diameter tissue culture dish in 10 ml Iscove's modified Dulbecco's medium (IMDM, Invitrogen, San Diego, CA) supplemented with 10% fetal bovine serum (FBS) and incubated at 5% CO2 and 37°C overnight. BOSC 23 cells then were transfected with 4 µg DNA using the Effectene transfection kit (Qiagen, Valencia, CA). Viral transfection efficiency among multiple experiments was comparable (data not shown). At 24 hours after transfection, culture medium was replaced with 7 ml of fresh IMDM containing 10% FBS. Transfected cultures were incubated at 5% CO2 and 32°C for 36 to 70 hours. Viral titers—determined using NIH 3T3 cells as described previously 19 —ranged from 4.0 × 10⁵ to 10.0 × 10⁵ G418r colony-forming units per milliliter.
Bone marrow transfection and transplantation
This work was conducted according to federal guidelines for the care and use of animals in biomedical research 15 and preapproved by the Institutional Animal Care and Use Committee.
Eight- to 12-week-old female (C57BL/6J × DBA/2J) F1 mice (BDF1; Charles River Laboratories, Wilmington, MA) were housed under pathogen-free conditions (5 mice/cage). Bone marrow was harvested from femurs and tibias of donor mice 5 days after an intraperitoneal bolus of 5-fluorouracil (150 mg/kg). Marrow cells (6 × 10⁵/ml) were incubated in fibronectin-coated 100-mm-diameter Petri dishes containing fresh viral supernatant, 15% FBS, 0.1% bovine serum albumin (BSA, fraction V; Sigma), and 100 ng/ml each of recombinant rat stem cell factor (rrSCF), recombinant human IL-6 (rhIL-6), recombinant human IL-11 (rhIL-11), and recombinant human megakaryocyte growth and development factor (rhMGDF). All growth factors were produced by Amgen. Culture media were replaced daily for 3 days with fresh virus-containing supernatant and growth factors. At the end of the transduction, total nonadherent and adherent cells were harvested and resuspended in 0.5% BSA-saline and transplanted into γ-irradiated (2 × 5.5 Gy, 4 hours apart, Cs137) recipient mice by intravenous injection; each animal received 7.5 ± 2.0 × 10⁶ cells. After transplantation, peripheral blood was sampled by weekly retroorbital bleeding and assessed using a conventional hematology analyzer (Technicon H1E; Miles, Tarrytown, NY) to obtain complete blood cell counts, including automated leukocyte differentials.
Colony assay
Bone marrow cells (2.0 to 5.0 × 10⁴/ml) were plated in 1.0 ml IMDM plus methylcellulose containing 10% FBS; 10 mg/ml BSA; soybean lipids; iron-saturated human transferrin; insulin; 2.5 ng/ml rmIL-3; 100 ng/ml each of rrSCF, rhIL-6, and rhIL-11; 25 ng/ml of rhMGDF; and 2 U/ml recombinant human erythropoietin (rhEPO; Amgen) as previously described. 19 Independent cultures were established in the presence or absence of 500 µg/ml active G418 (Sigma). Granulocyte-macrophage or multilineage colonies were counted after 10 to 12 days. Retroviral transfection efficiency, estimated as the number of colonies grown in the presence of G418 divided by the number of colonies grown in the absence of G418, averaged approximately 85%.
Expression analysis
Because of the absence of reliable antibodies to mOSM and bOSM at the time the experiment was performed, OSM expression in reconstituted animals was assessed using Northern blots. Total RNA was extracted from bone marrow and spleen cells using a total RNA extraction kit (Qiagen). Total RNA (5 µg) was size-fractionated by electrophoresis in a formaldehyde/agarose gel and transferred onto a nylon membrane (Hybond-N+; Amersham). The membrane was prehybridized in Stark's buffer (50% formamide, 50 mmol/liter KPO4, 5× sodium citrate/sodium chloride [SSC], 1% sodium dodecyl sulfate [SDS], 5× Denhardt's, 0.05% sarcosyl, 300 mg/mL salmon sperm DNA) at 63°C for 1 hour and then probed with random hexamer-primed (Pharmacia, Piscataway, NJ), 32P-dCTP-labeled OSM and glyceraldehyde-3-phosphate dehydrogenase (G3PDH) cDNA probes in Stark's buffer overnight at 42°C. Probed blots were washed sequentially to high stringency (0.1× SSC, 0.5% SDS at 50°C) and exposed to radiographic film (X-OMAT AR; Eastman Kodak Co, Rochester, NY).
Pathology
Four weeks after retroviral transduction, mice were anesthetized with isoflurane, and blood was drawn by cardiac puncture for hematology analysis. Selected organs were removed and weighed. All major organs were examined for gross abnormalities, fixed by immersion in zinc formalin (Z-Fix; Anatech, Battle Creek, MI), and processed into paraffin for microscopic analysis. One 4-µm-thick section was stained with hematoxylin and eosin (HE) for routine histopathologic assessment. Serial sections of selected viscera were deparaffinized, blocked with CAS BLOCK (Zymed Laboratories, San Francisco, CA), and then incubated with rat anti-mouse B220/CD45R (2 µg/ml; PharMingen, San Diego, CA) or rabbit anti-human CD3 (1 : 250; Dako Corporation, Carpinteria, CA) primary antibodies for 1 hour at room temperature to demonstrate B or T lymphocytes, respectively. Serial section of bone were deparaffinized, pretreated for 15 minutes with trypsin (0.1%, in 1% calcium chloride), blocked with CAS BLOCK, and then incubated with a proprietary rabbit anti-human cathepsin K antibody (1 µg/ml) for 1 hour at room temperature to demonstrate osteoclasts. Biotinylated rabbit anti-rat (1 : 500) or goat anti-rabbit (1 : 200) secondary antibodies (Vector Laboratories, Burlingame, CA) were added for 30 minutes to detect the primary antibodies. Slides were quenched with 3% hydrogen peroxide for 25 minutes, incubated with avidin-biotin complex (Vector) for 25 minutes, visualized with diaminobenzidine tetrachloride (DAB; Dako), and counterstained with hematoxylin. Tissues initially were analyzed with foreknowledge of the transferred gene to identify OSM-mediated structural changes. Organs with lesions were then sorted “blindly” by a veterinary pathologist (B. Bolon) using criteria established during the uncoded examination.
Statistics
Results were expressed as group mean ± standard error (SEM). Clinical data (continuous variables) were assessed using a one-way analysis of variance followed by Dunnett's test, while histologic scores (ordinal variables) were analyzed using the chi-square test. A P value of .05 was used to delineate significant differences between groups.
Results
Consistent with our prior work, 20 mOSM used a different signaling pathway in vitro than did either hOSM or bOSM. Treatment of cultured mouse NIH-3T3 cells with mOSM induced phosphorylation of mOSMRβ and the downstream signal transducer STAT3, but not mLIFRβ (Fig. 2). In contrast, treatment with either hOSM or bOSM led to phosphorylation of mLIFRβ and STAT3, but not mOSMRβ (Fig. 2).
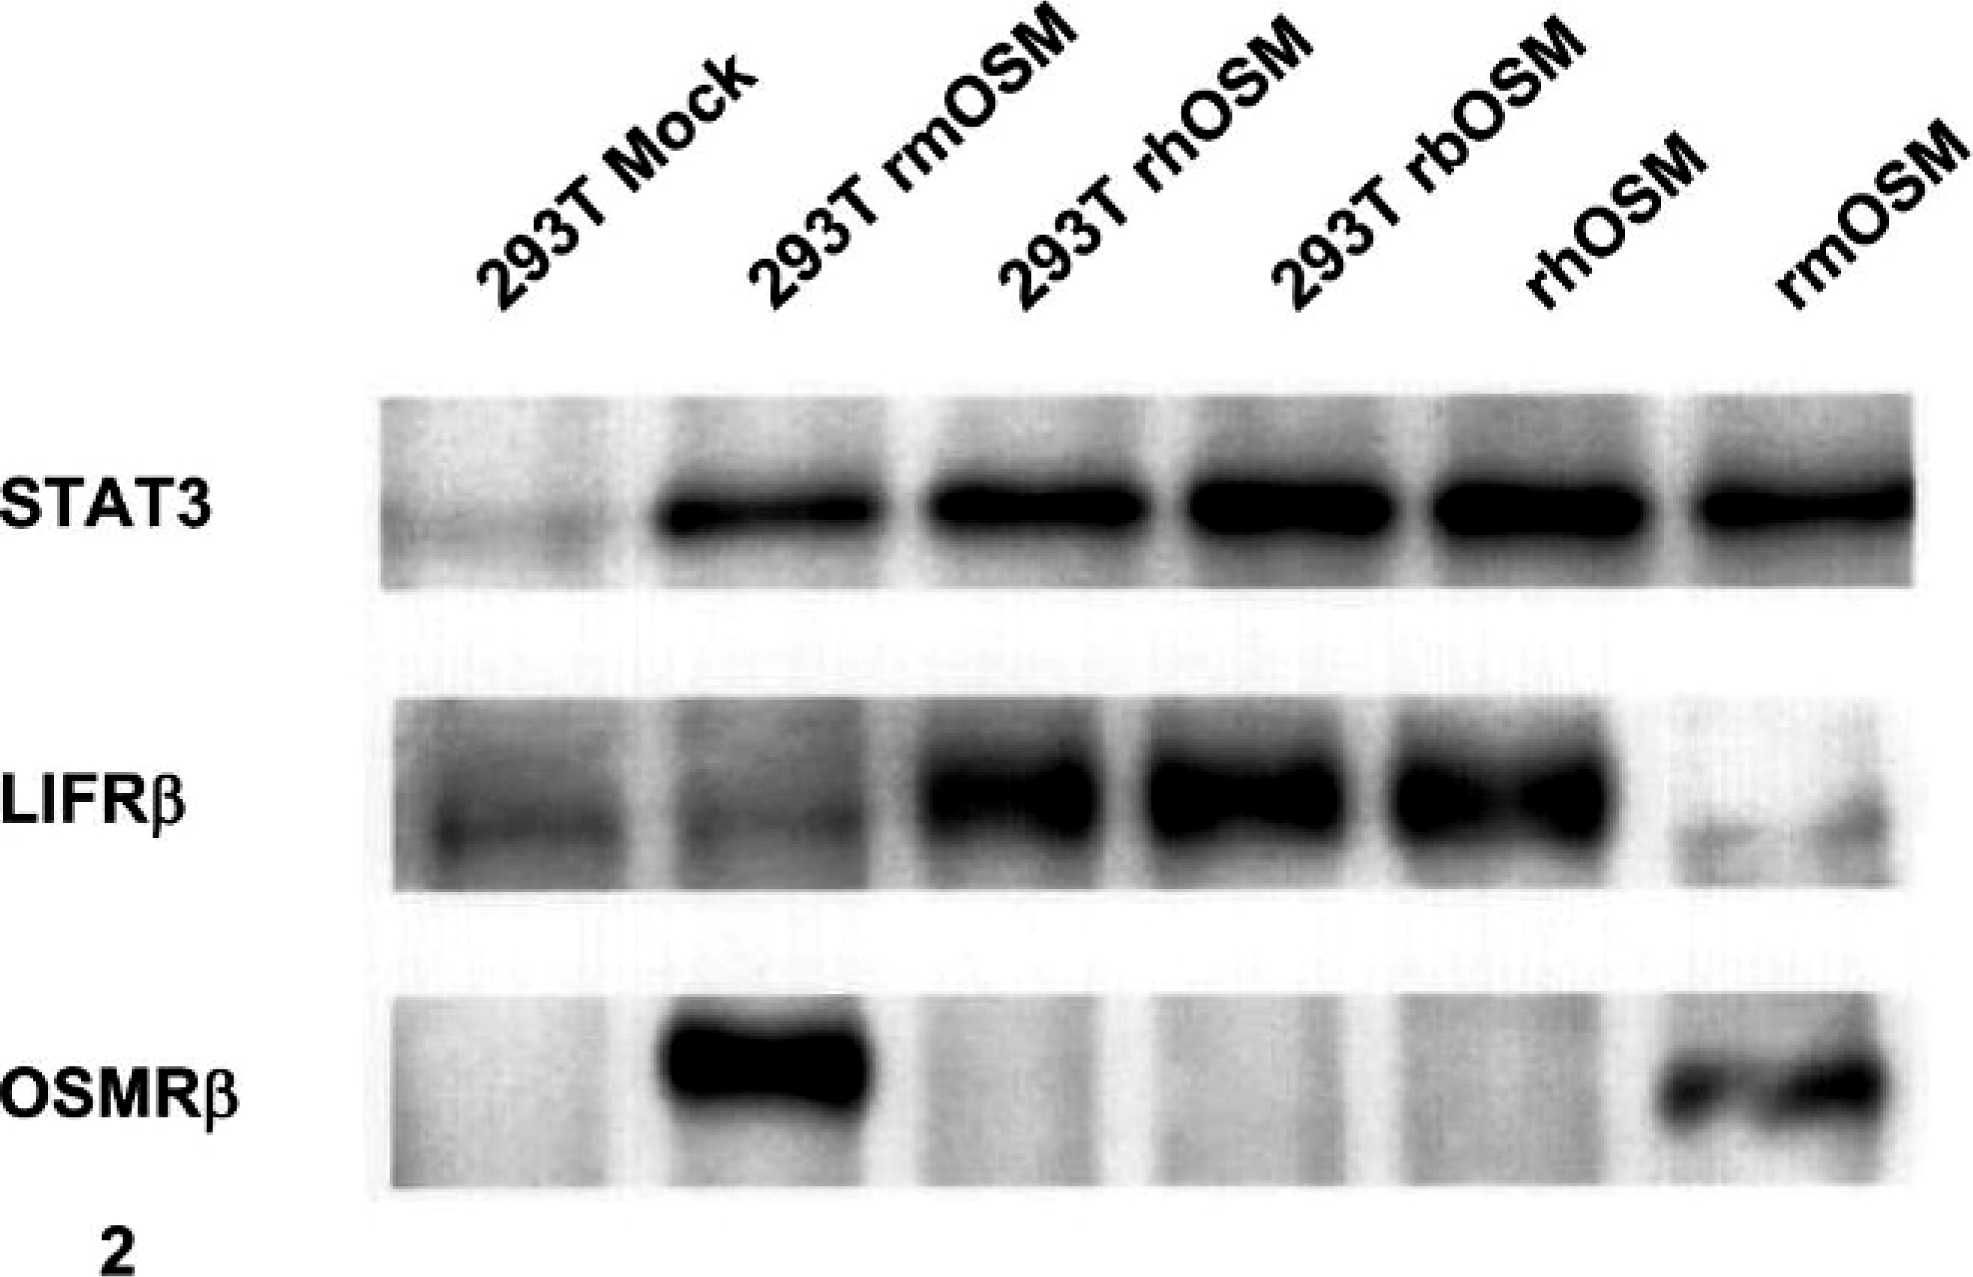
Immunoblot for ligand-induced receptor phosphorylation; NIH 3T3 cells. The mouse OSM-specific receptor OSMRβ was phosphorylated only after application of Amgen-fabricated (293T rmOSM) or commercially obtained (rmOSM) mouse oncostatin M, while treatment with human OSM (293T rhOSM [proprietary] or rhOSM [commercial]) or bovine OSM (rbOSM) led to phosphorylation of LIFRβ. The downstream effector STAT3, used in both the OSMRβ and LIFRβ signaling cascades, was phosphorylated by all OSM variants. The control lane designated 293T Mock did not contain an OSM cDNA.
Retroviral-mediated gene transfer of all three OSM variants was efficient and persistent. The transfection efficiency into bone marrow, as demonstrated by the in vitro granulocyte-macrophage colony-forming cell assay, varied between replicates but was equivalent for all the retroviral vectors: 65% to 80% for the control vector, 70% to 82% for mOSM, 68% to 85% for hOSM, and 74% to 84% for bOSM. Expression of vector-encoded OSM was readily detected in cells isolated from hematopoietic organs for at least 10 weeks after transplantation in mOSM-transduced animals (Fig. 3) or until death at approximately 4 weeks in animals that received hOSM or bOSM (data not shown). The level of expression in hematopoietic organs provided by the three OSM-containing vectors was similar (data not shown).
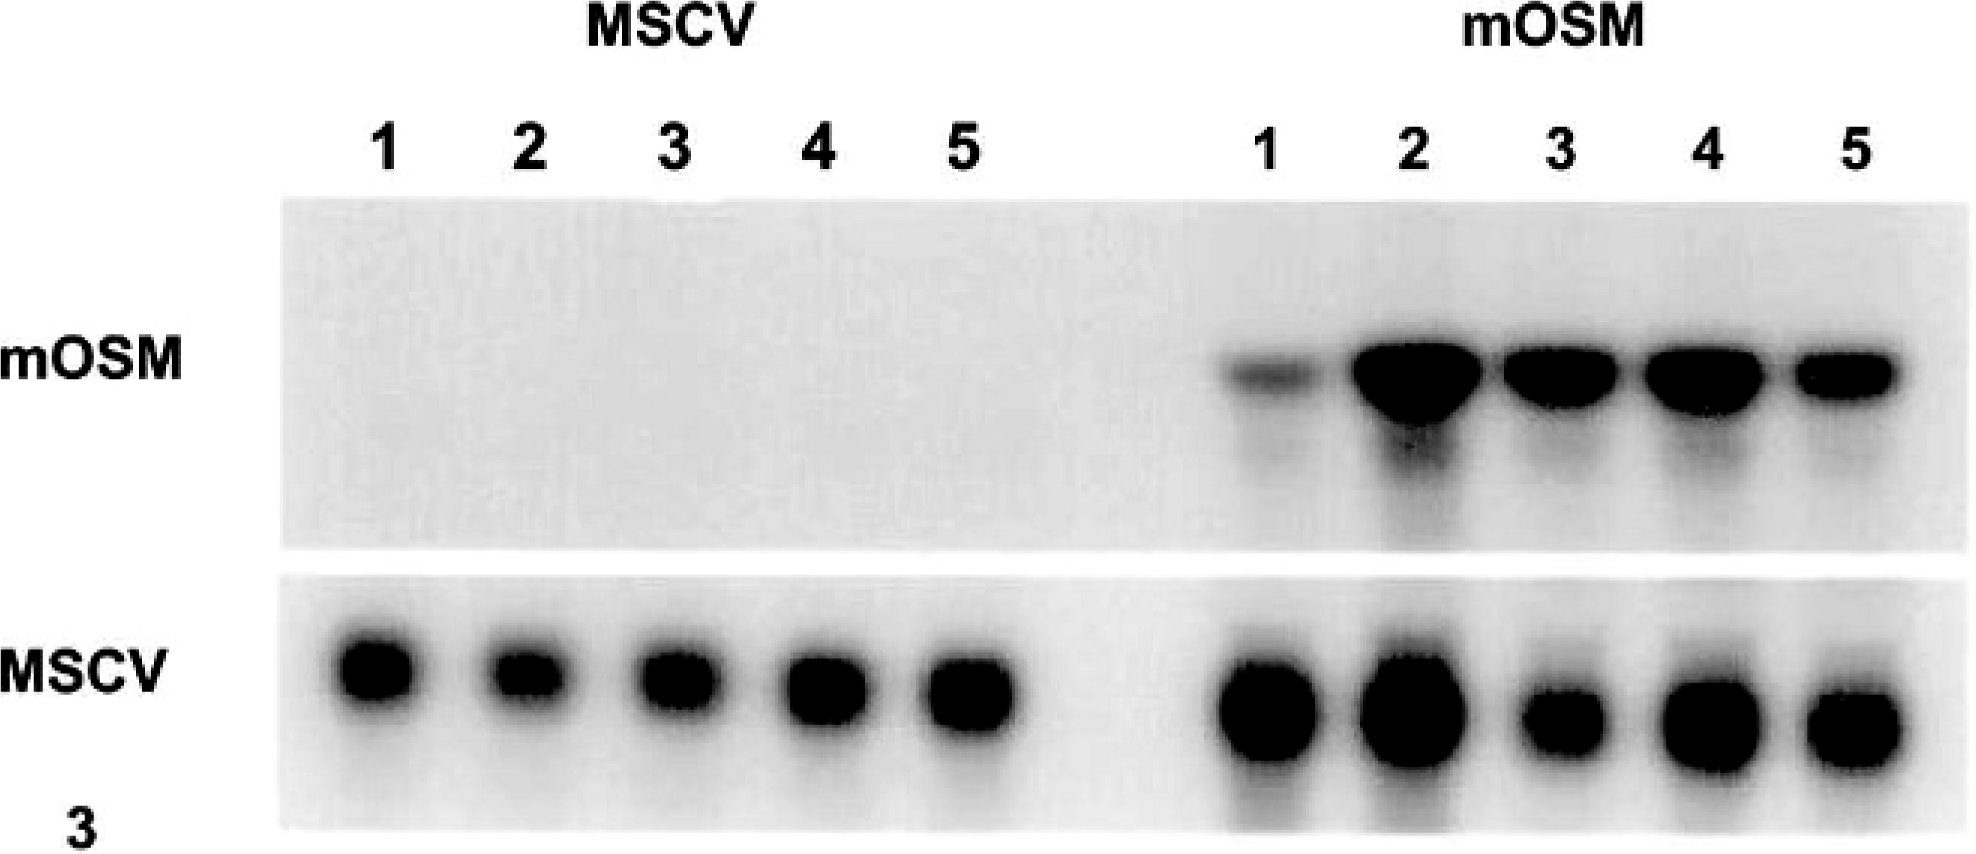
Northern analysis of retroviral-mediated mOSM expression in vivo. Mice given an MSCV2.1 vector bearing mOSM expressed appreciable levels of mOSM, whereas animals given an empty MSCV vector alone did not. The numbered lanes represent total splenic RNA preparations from individual mice. The RNA was harvested 10 weeks after intravenous introduction of the retroviral vector.
The hematologic profile induced by mOSM diverged significantly from those elicited by hOSM or bOSM. As early as 2 weeks after transduction, mice overexpressing hOSM or bOSM exhibited significant elevations in circulating numbers of platelets (Fig. 4) and neutrophils, while erythrocyte, lymphocyte, and eosinophil numbers were significantly reduced (Table 1). Circulating monocyte numbers were also substantially elevated in mice that received a nonmurine OSM, although the large interindividual variation prevented demonstration of a significant difference. This constellation of changes persisted throughout the study in mice that overexpressed hOSM or bOSM. When measured in mice overexpressing mOSM, these same hematologic parameters were comparable with those of control animals (Table 1).
Hematologic profile elicited in mice by mOSM diverges from those produced by nonmurine OSM variants. ∗ .
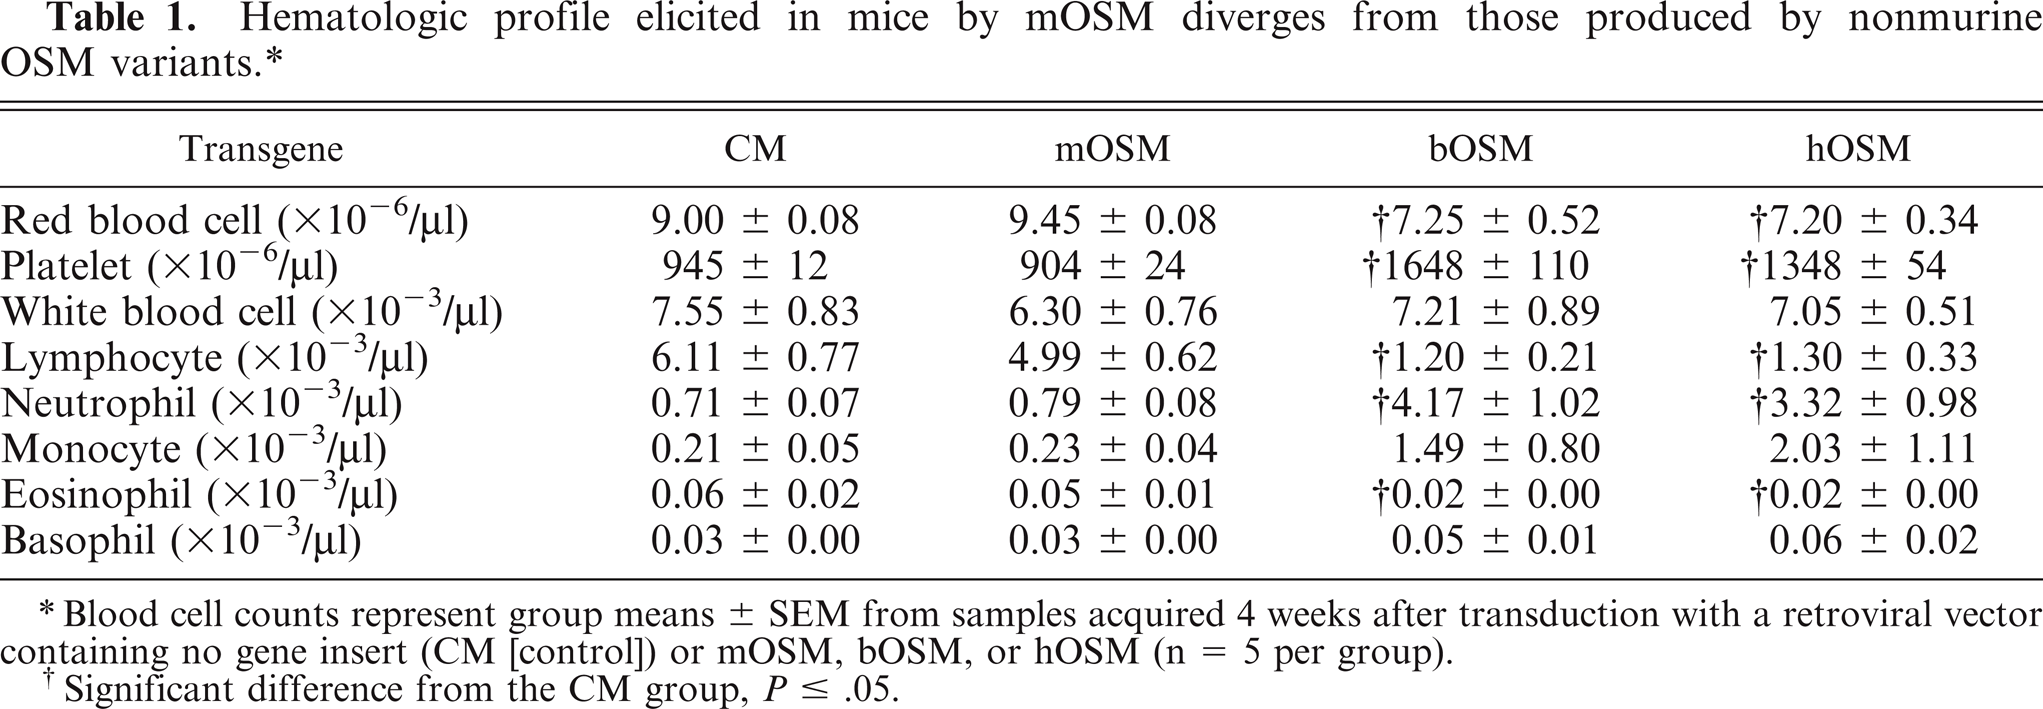
Blood cell counts represent group means ± SEM from samples acquired 4 weeks after transduction with a retroviral vector containing no gene insert (CM [control]) or mOSM, bOSM, or hOSM (n = 5 per group).
Significant difference from the CM group, P ≤ .05.
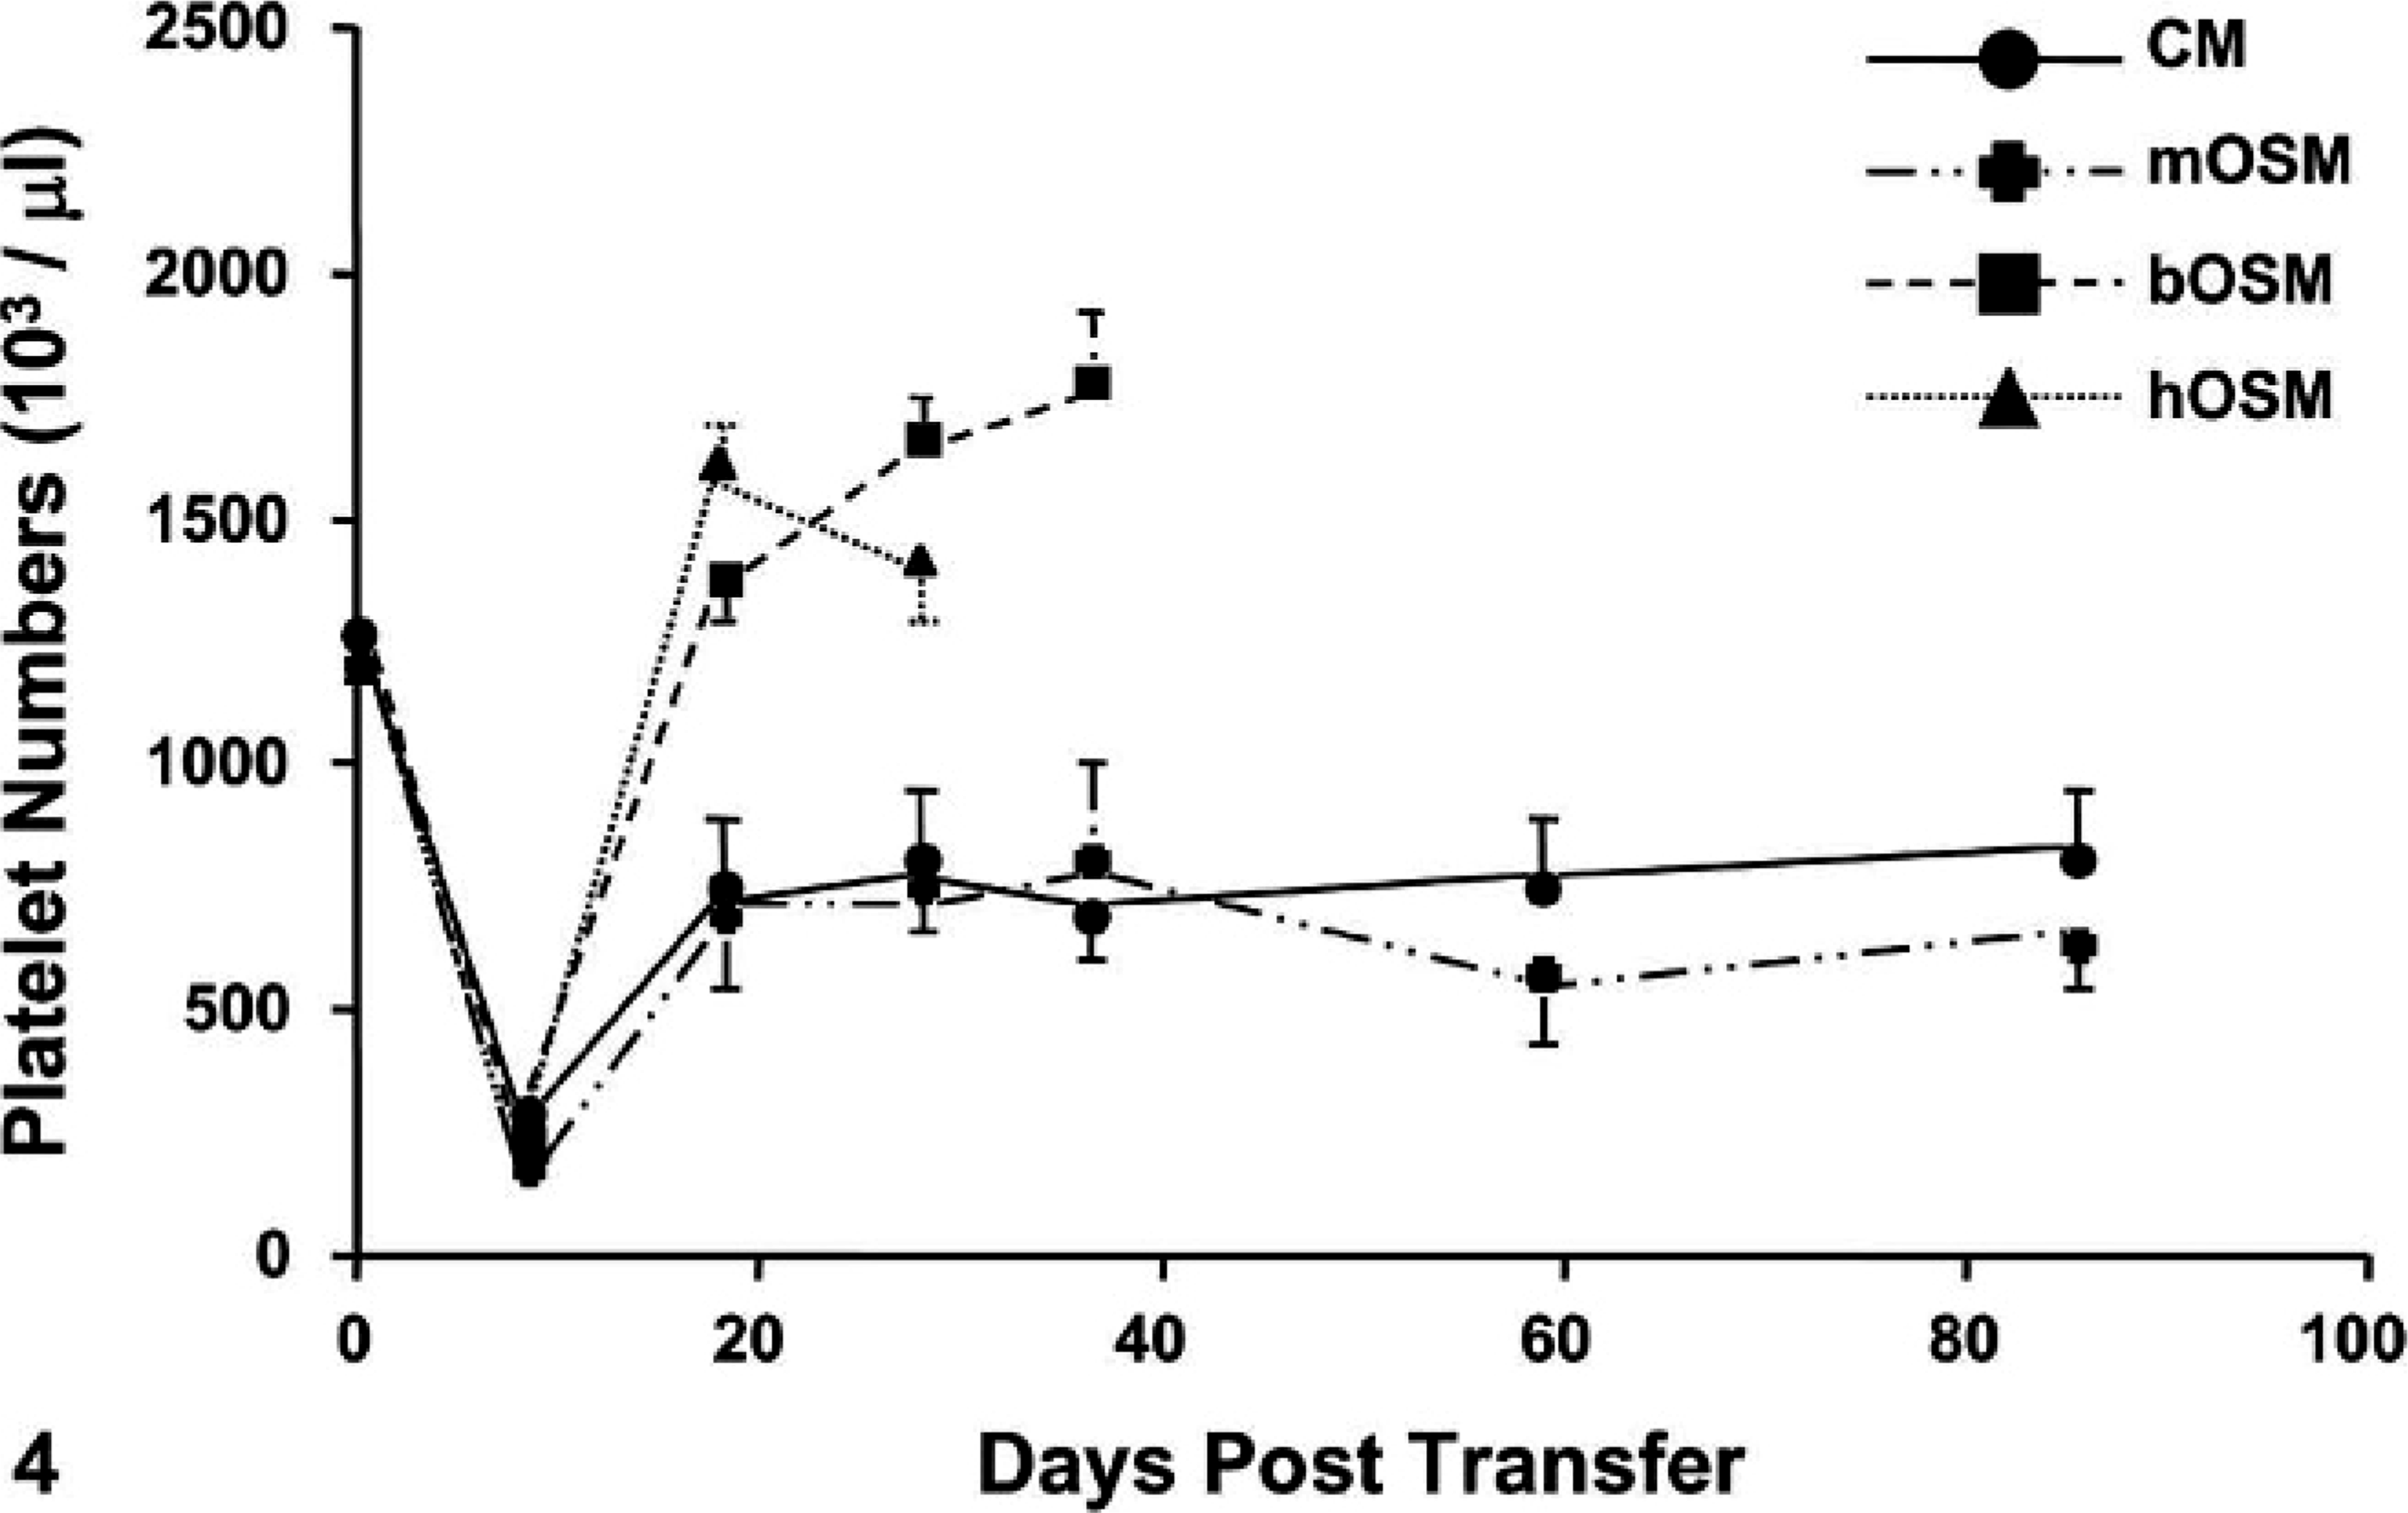
Comparison of circulating platelet numbers; mouse whole blood. Overexpression of hOSM or bOSM, but not mOSM, enhanced platelet production relative to the platelet numbers measured in control mice (CM). Values could not be determined for hOSM or bOSM overexpressing mice at later time points because all animals in these two groups had died. Values represent group means ± SEM.
Anatomic alterations were induced in multiple organs by all three OSM variants, but the structural phenotype incited by mOSM was distinct from those produced by hOSM and bOSM. Mice overexpressing hOSM or bOSM died at 4 to 5 weeks after transplantation, whereas animals overexpressing mOSM survived to at least 52 weeks. Body weights of mice overexpressing hOSM or bOSM decreased significantly by approximately 25% after transplantation (Fig. 5), whereas those of animals overexpressing mOSM were similar to control mice. Interestingly, all OSM-expressing animals had significantly higher absolute and relative spleen weights and lower absolute and relative thymus weights compared to those of mice that received the control vector (Table 2). A plethora of microscopic lesions were apparent in tissues of mice transduced with OSM, particularly in lymphoid organs (Table 3). Lesions in animals overexpressing either bOSM or hOSM were almost always equivalent in both pattern and degree; if present, changes in mOSM-transduced mice were uniformly of lesser degree. Additional OSM-associated alterations were noted in nonlymphoid organs, and again the bOSM and hOSM constructs yielded a similar phenotype that was distinct from that induced by mOSM (Table 4). Using a blinded paradigm for histopathologic analysis, sections of most organs could be separated into two (control and mOSM, nonmurine OSM) or three (control, mOSM, non-murine OSM) phenotypes with essentially 100% accuracy using HE-stained sections (Tables 3 and 4).
Body and organ weight changes induced by mOSM are less pronounced than those produced by nonmurine OSM variants. ∗
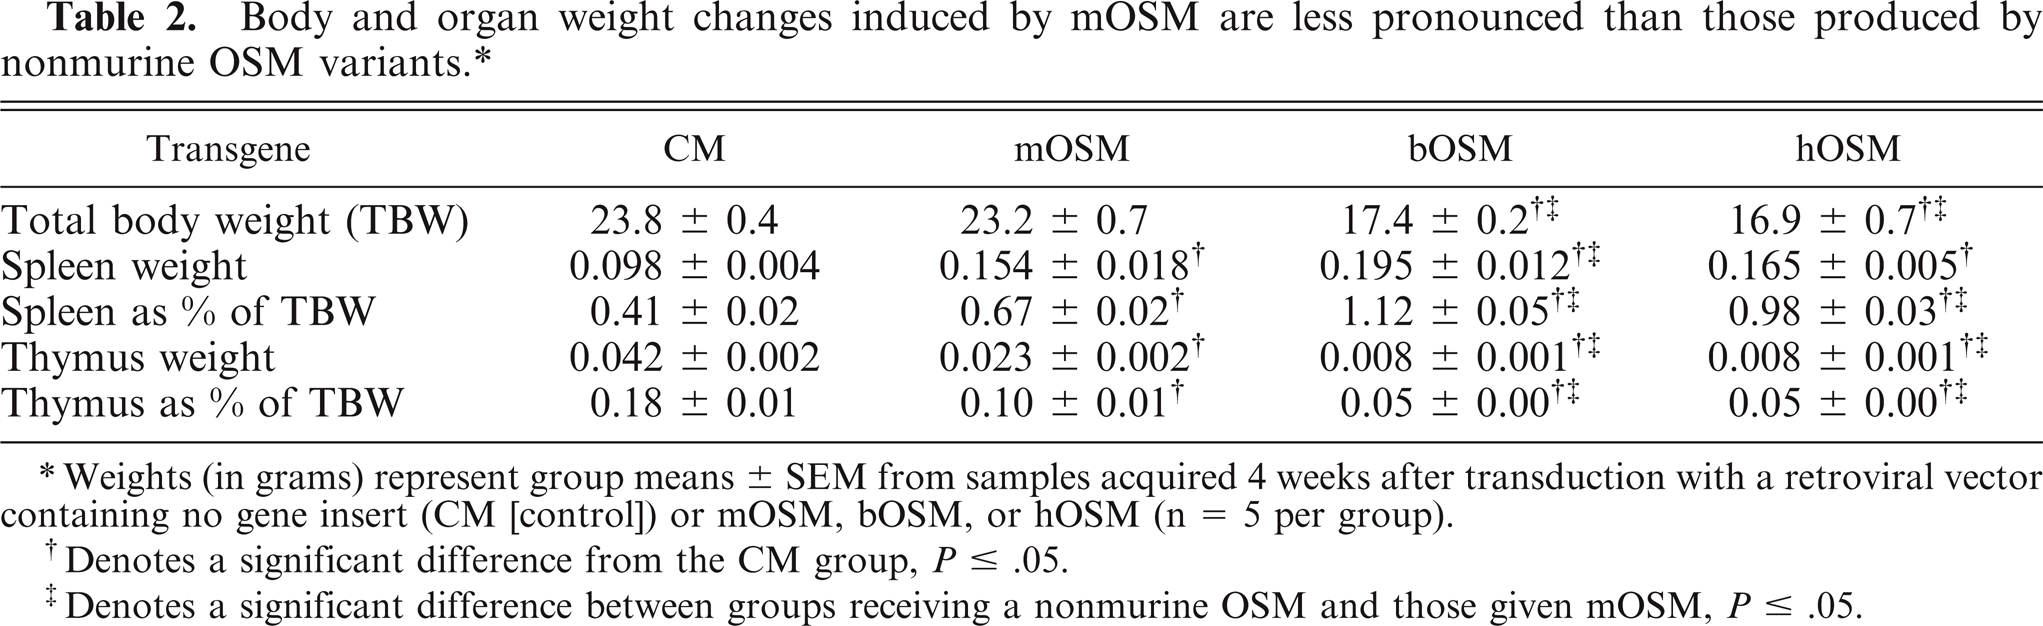
Weights (in grams) represent group means ± SEM from samples acquired 4 weeks after transduction with a retroviral vector containing no gene insert (CM [control]) or mOSM, bOSM, or hOSM (n = 5 per group).
Denotes a significant difference from the CM group, P ≤ .05.
Denotes a significant difference between groups receiving a nonmurine OSM and those given mOSM, P ≤ .05.
Anatomic reorganization of lymphoid organs induced by mOSM exhibits a different pattern from the structural phenotypes incited by nonmurine OSM variants. ∗
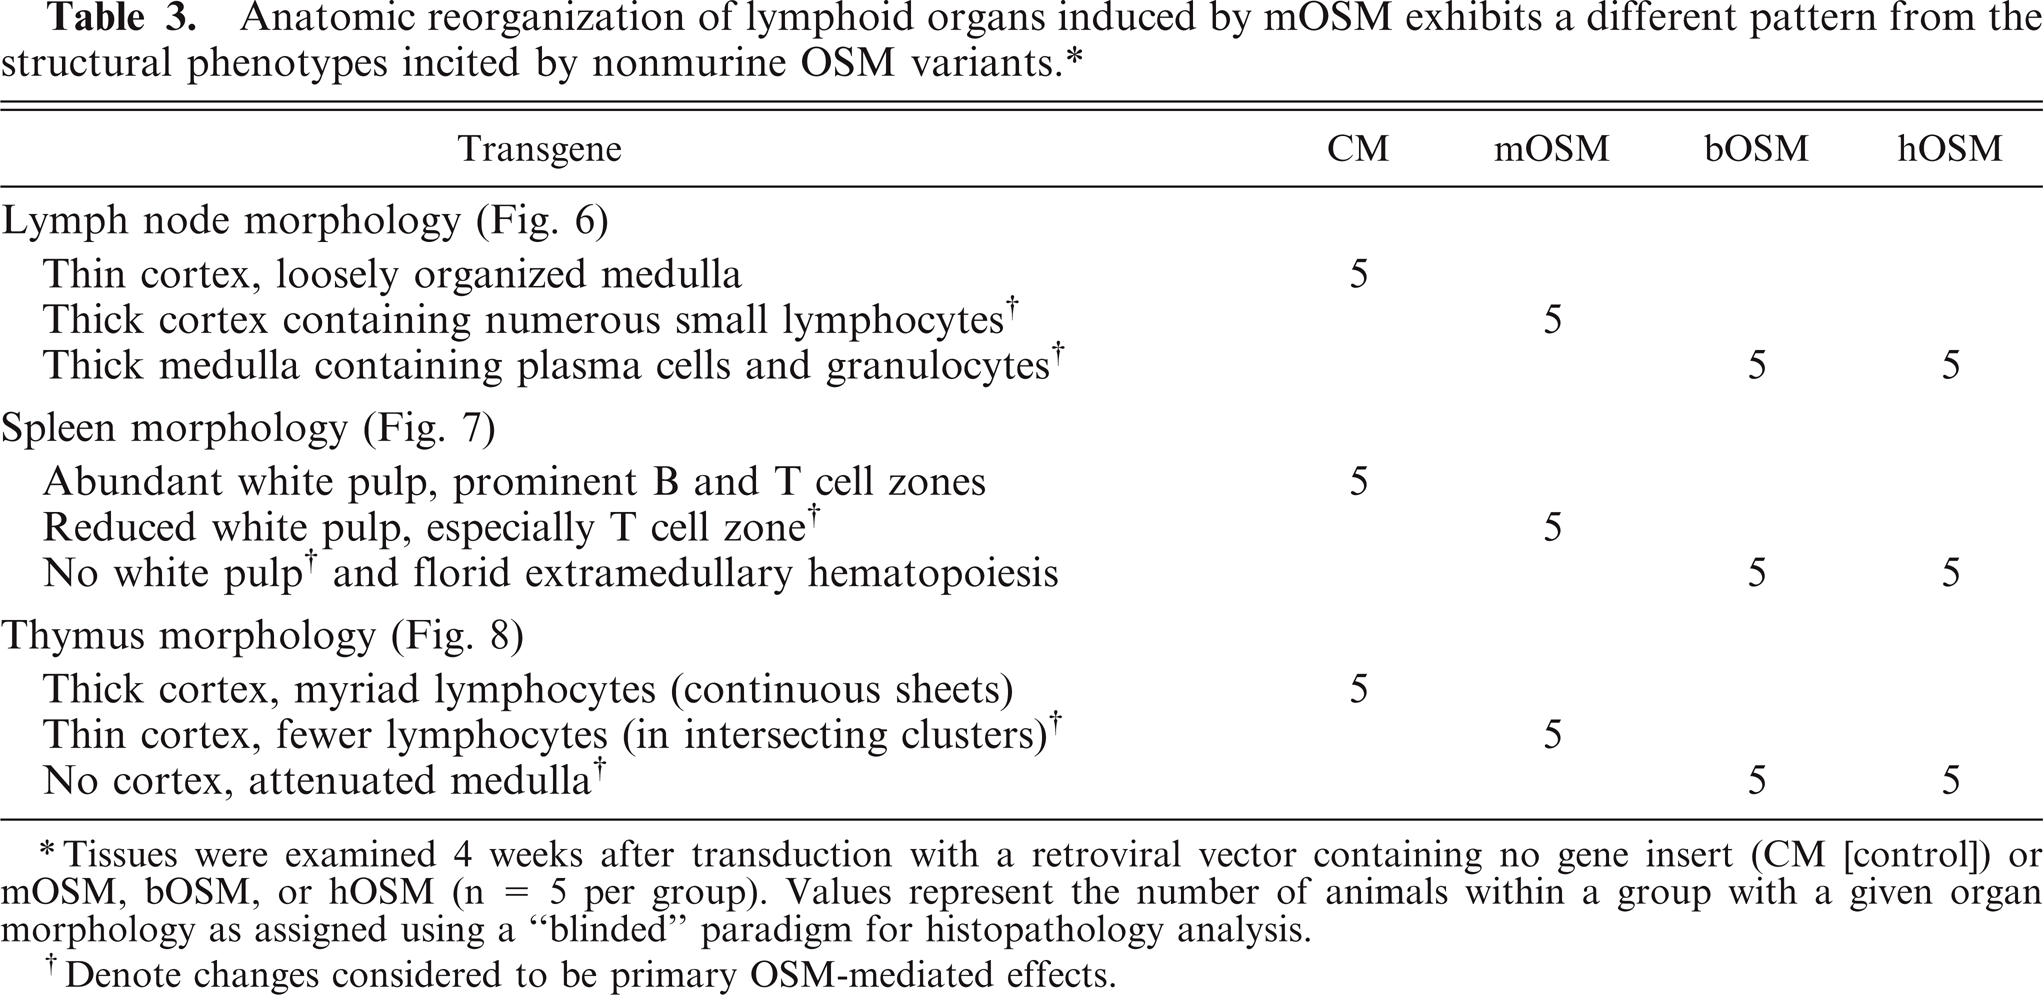
Tissues were examined 4 weeks after transduction with a retroviral vector containing no gene insert (CM [control]) or mOSM, bOSM, or hOSM (n = 5 per group). Values represent the number of animals within a group with a given organ morphology as assigned using a “blinded” paradigm for histopathology analysis.
Denote changes considered to be primary OSM-mediated effects.
Nonlymphoid organs have differing architectures in mice that overexpress either mOSM or a nonmurine OSM variant. ∗
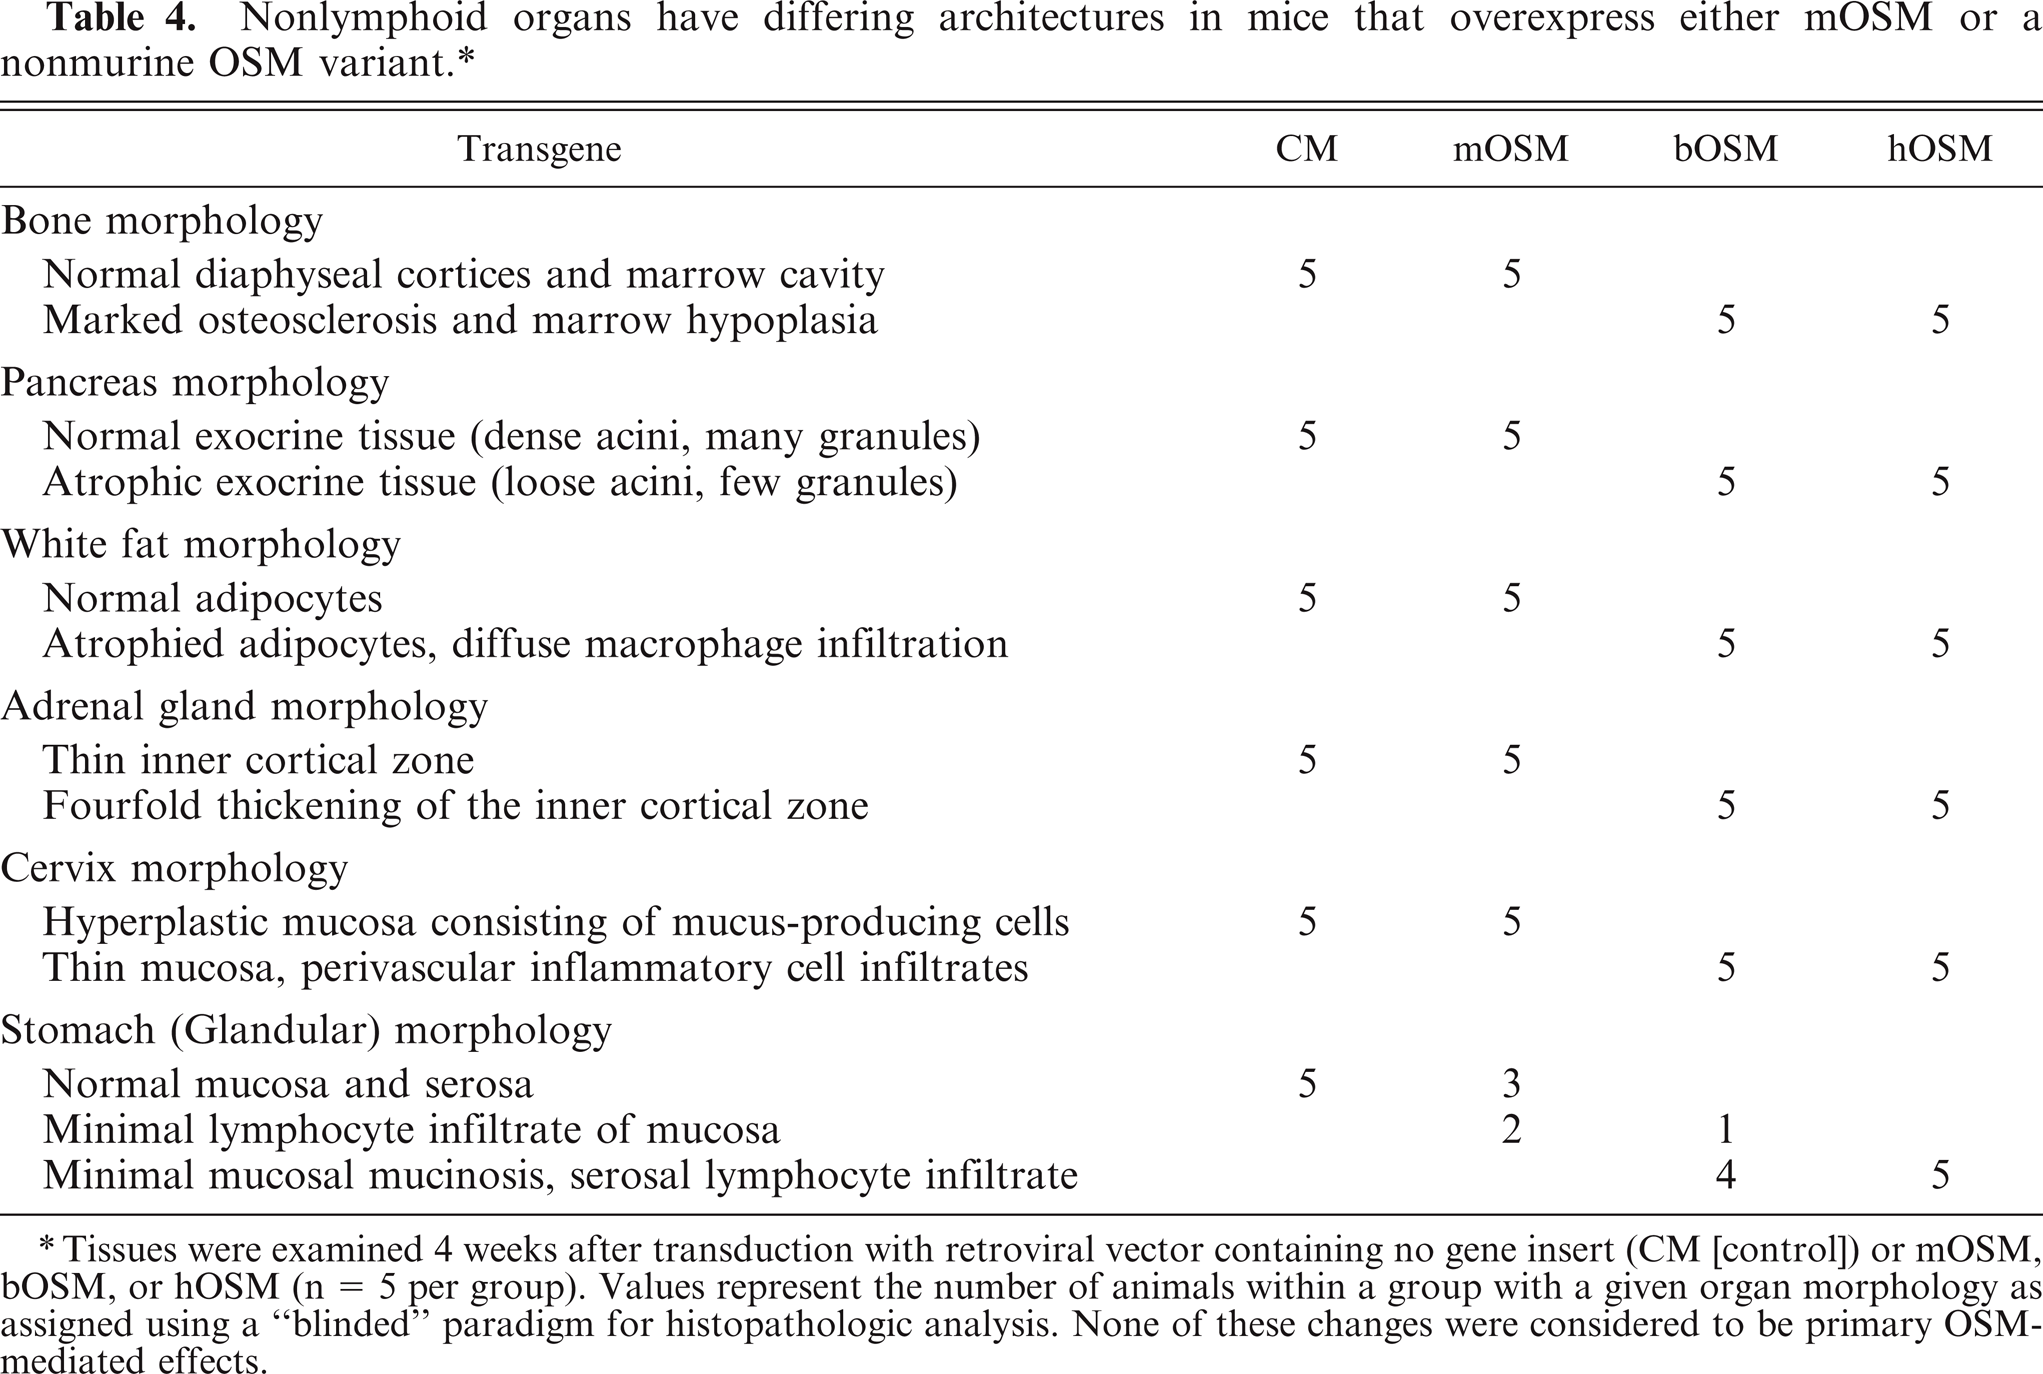
Tissues were examined 4 weeks after transduction with retroviral vector containing no gene insert (CM [control]) or mOSM, bOSM, or hOSM (n = 5 per group). Values represent the number of animals within a group with a given organ morphology as assigned using a “blinded” paradigm for histopathologic analysis. None of these changes were considered to be primary OSM-mediated effects.
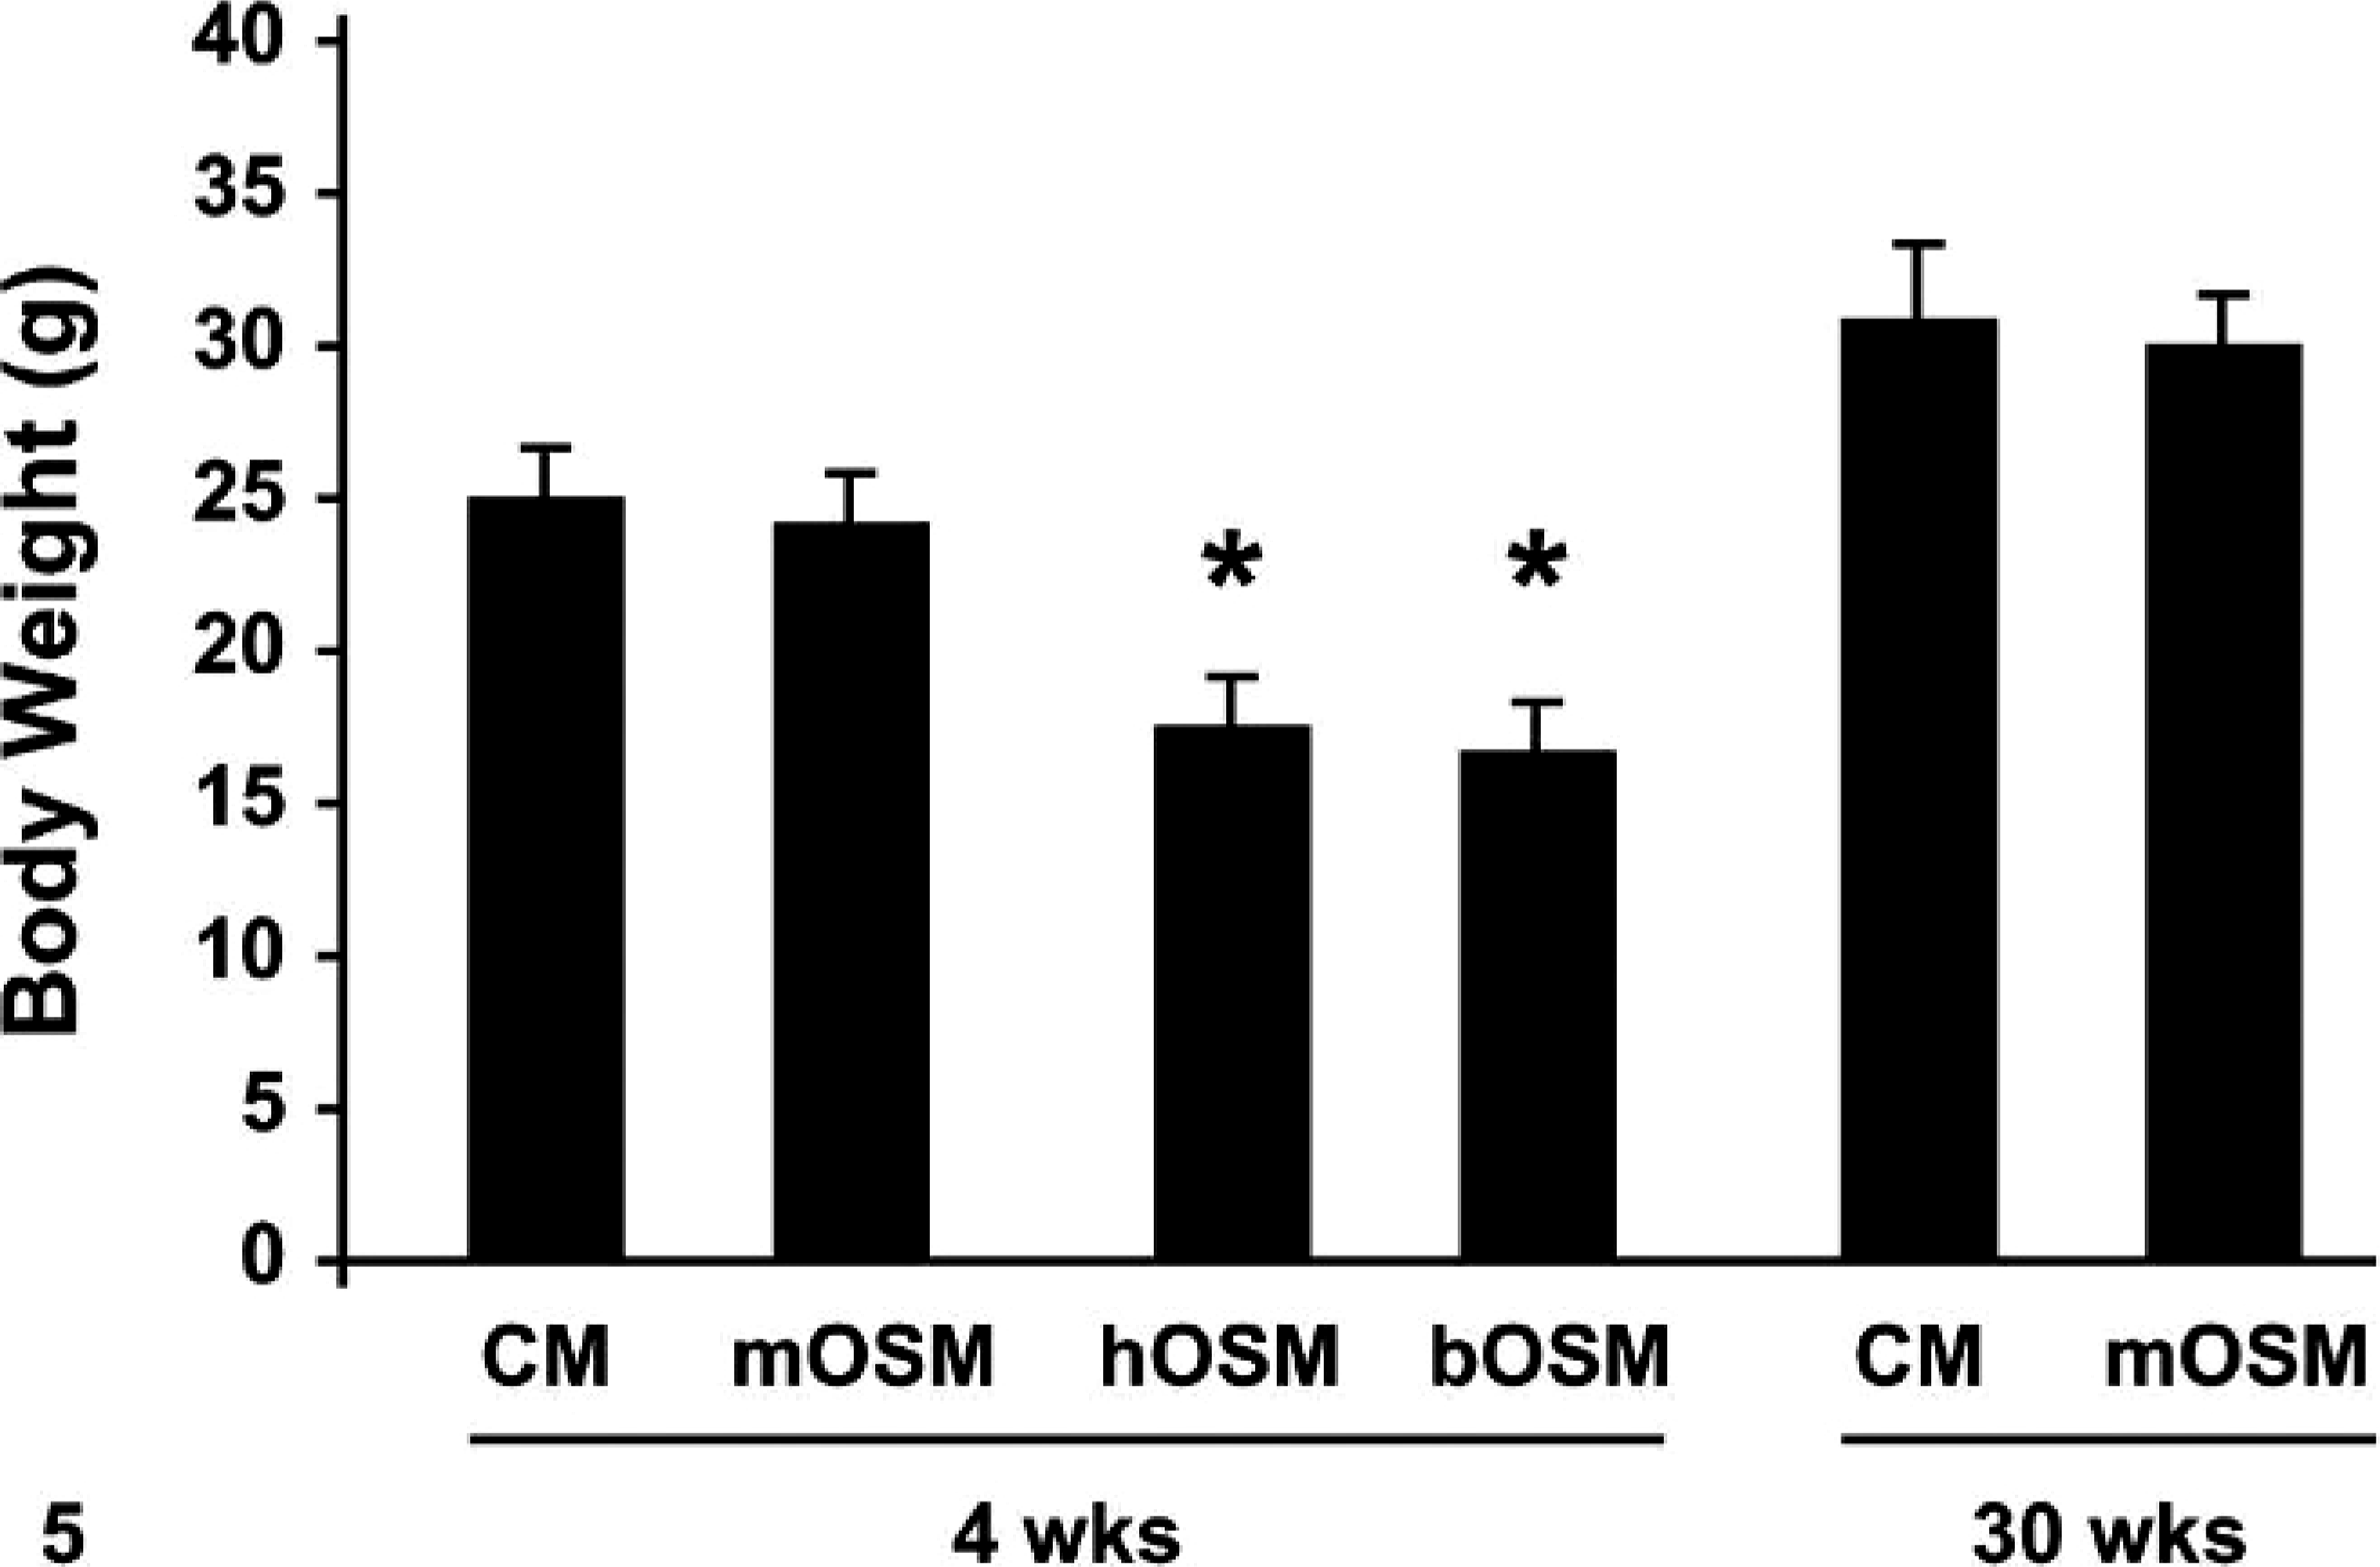
Comparison of total body weight. Overexpression of hOSM or bOSM, but not mOSM, led to significant body weight loss (denoted by asterisks) relative to time-matched control mice (CM) by 4 weeks after transplantation. Values could not be derived for hOSM or bOSM overexpressing animals at 30 weeks because all mice in these two groups had died. Values represent group means ± SEM.
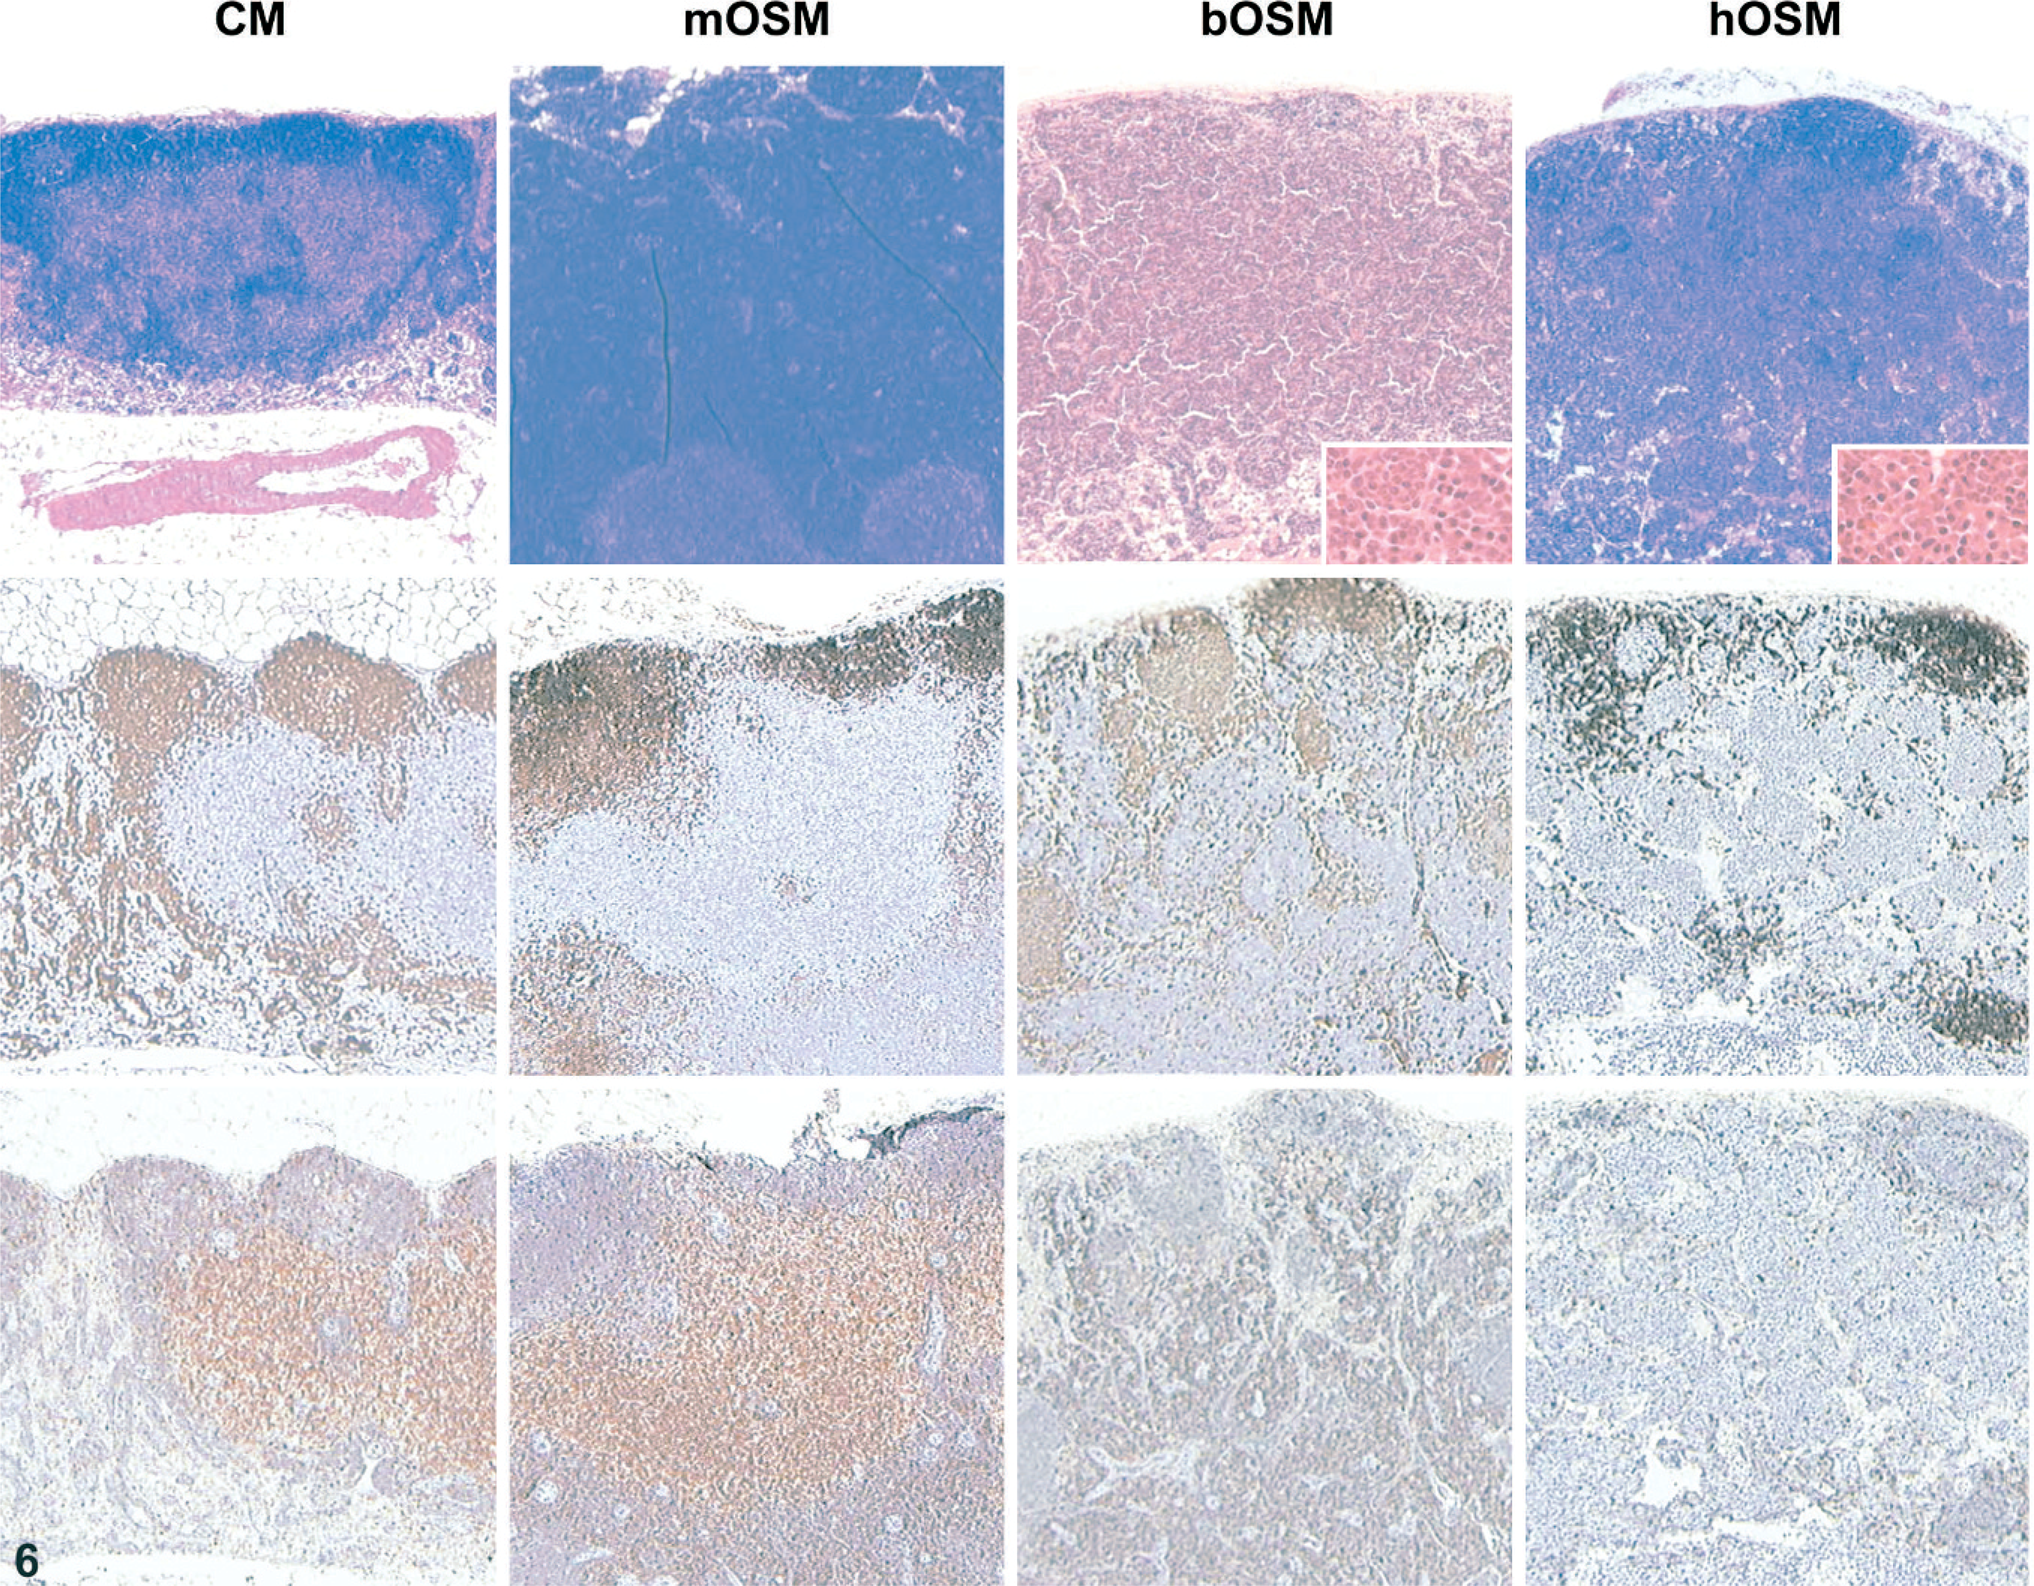
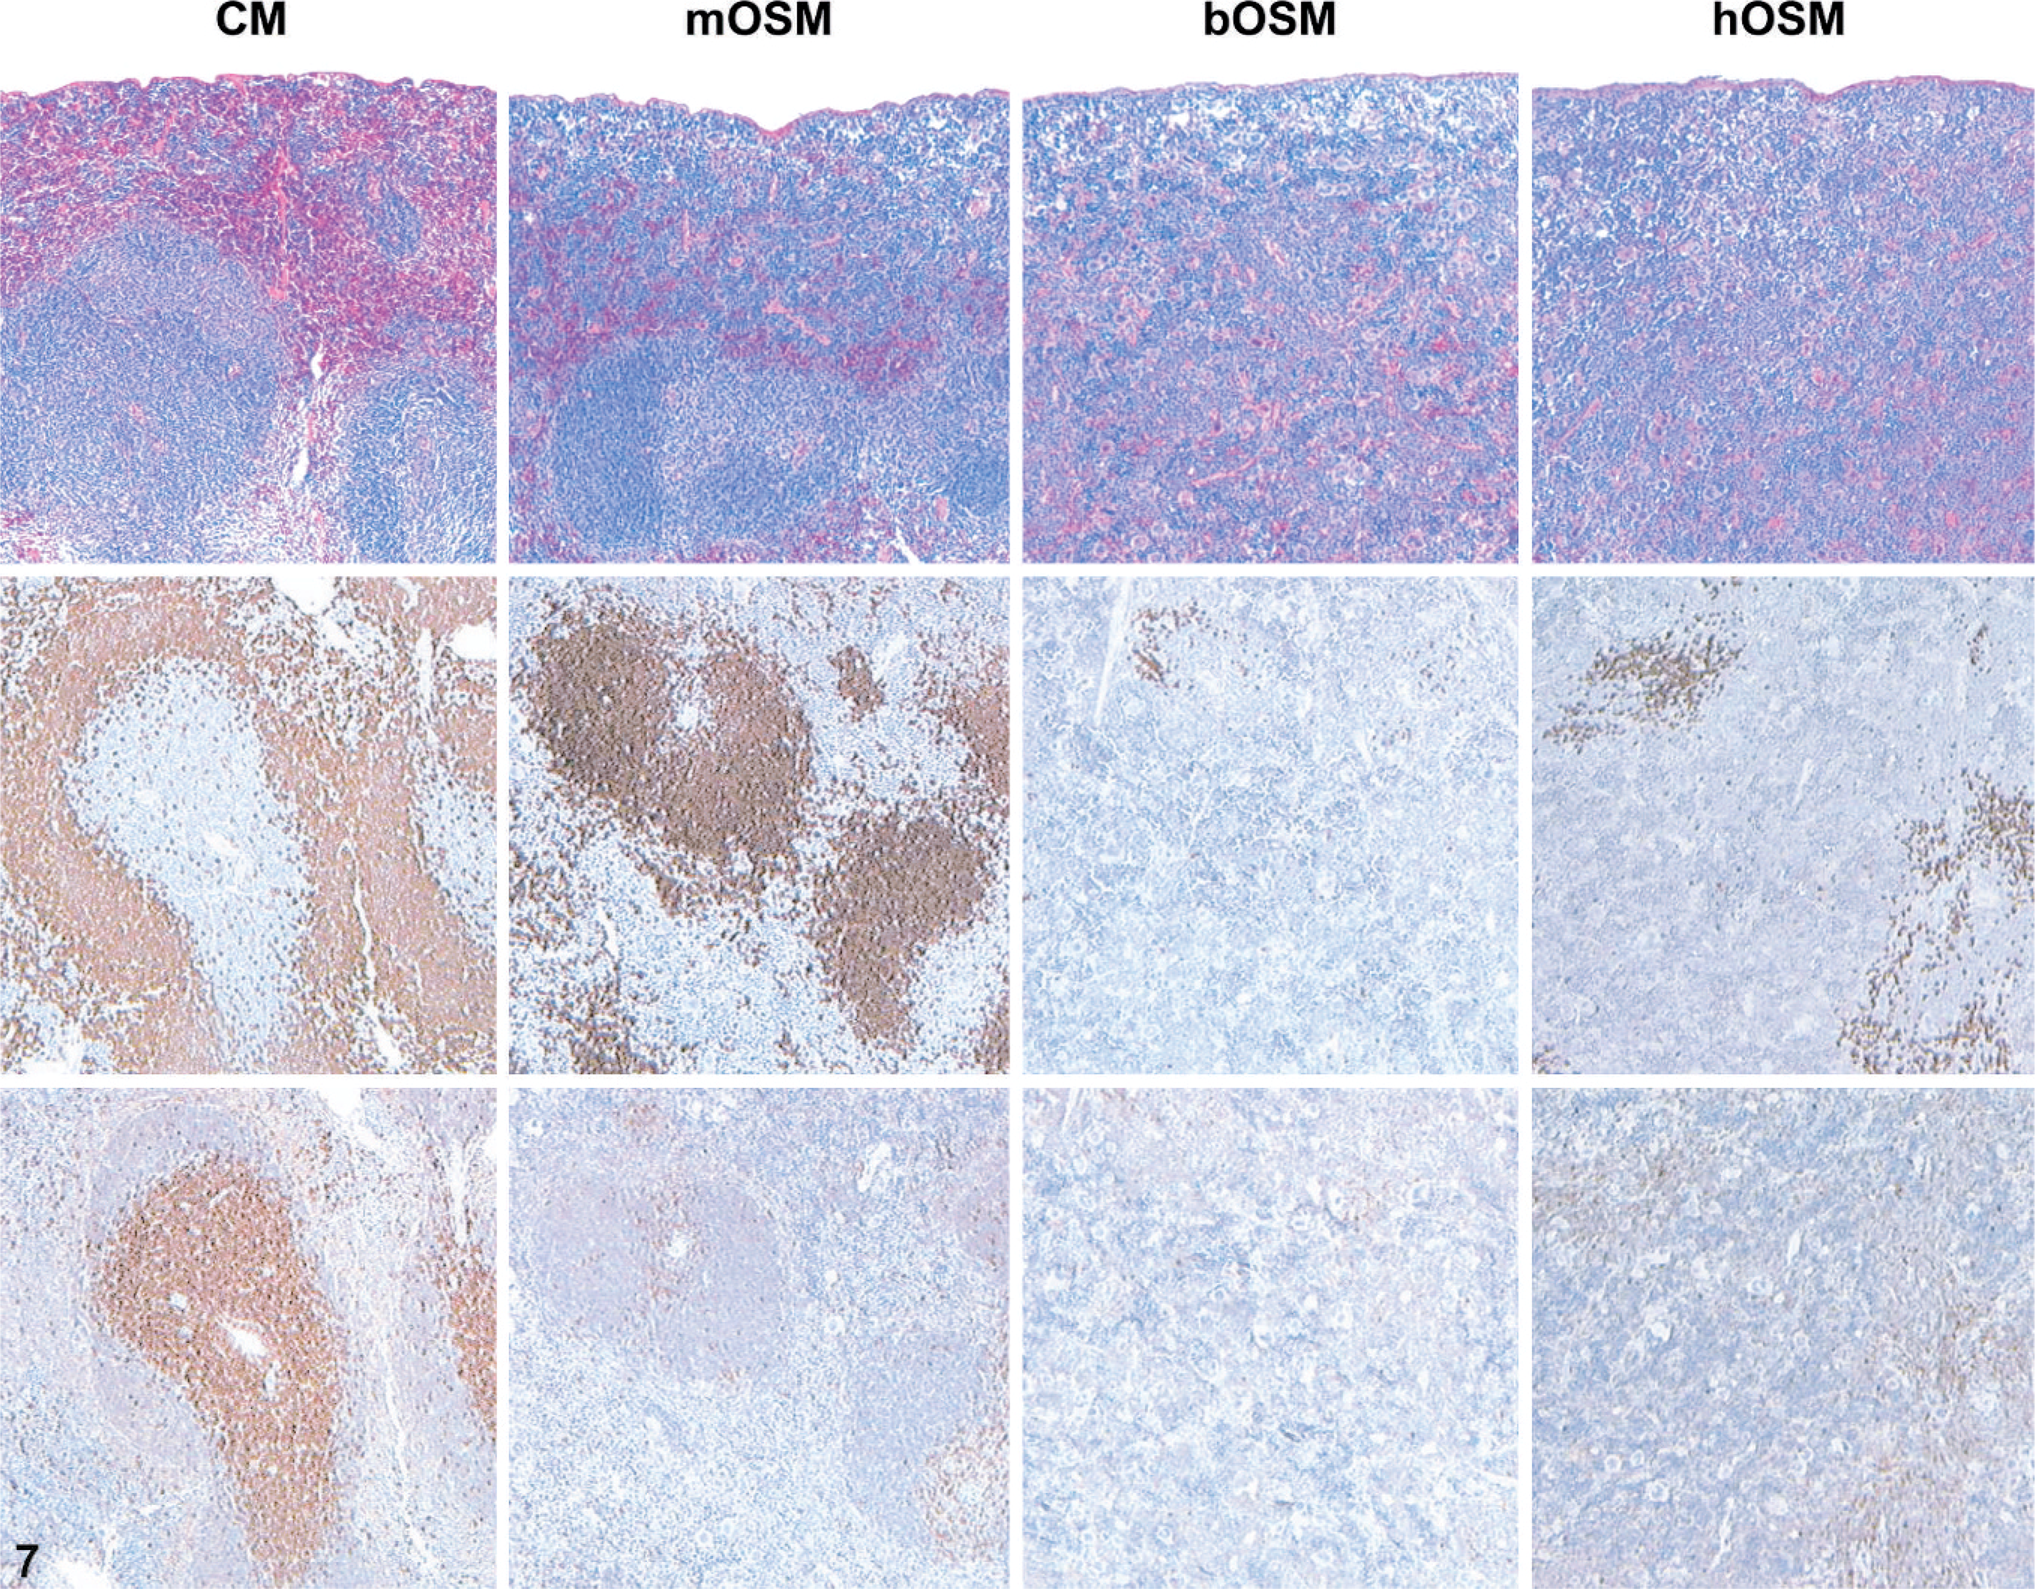
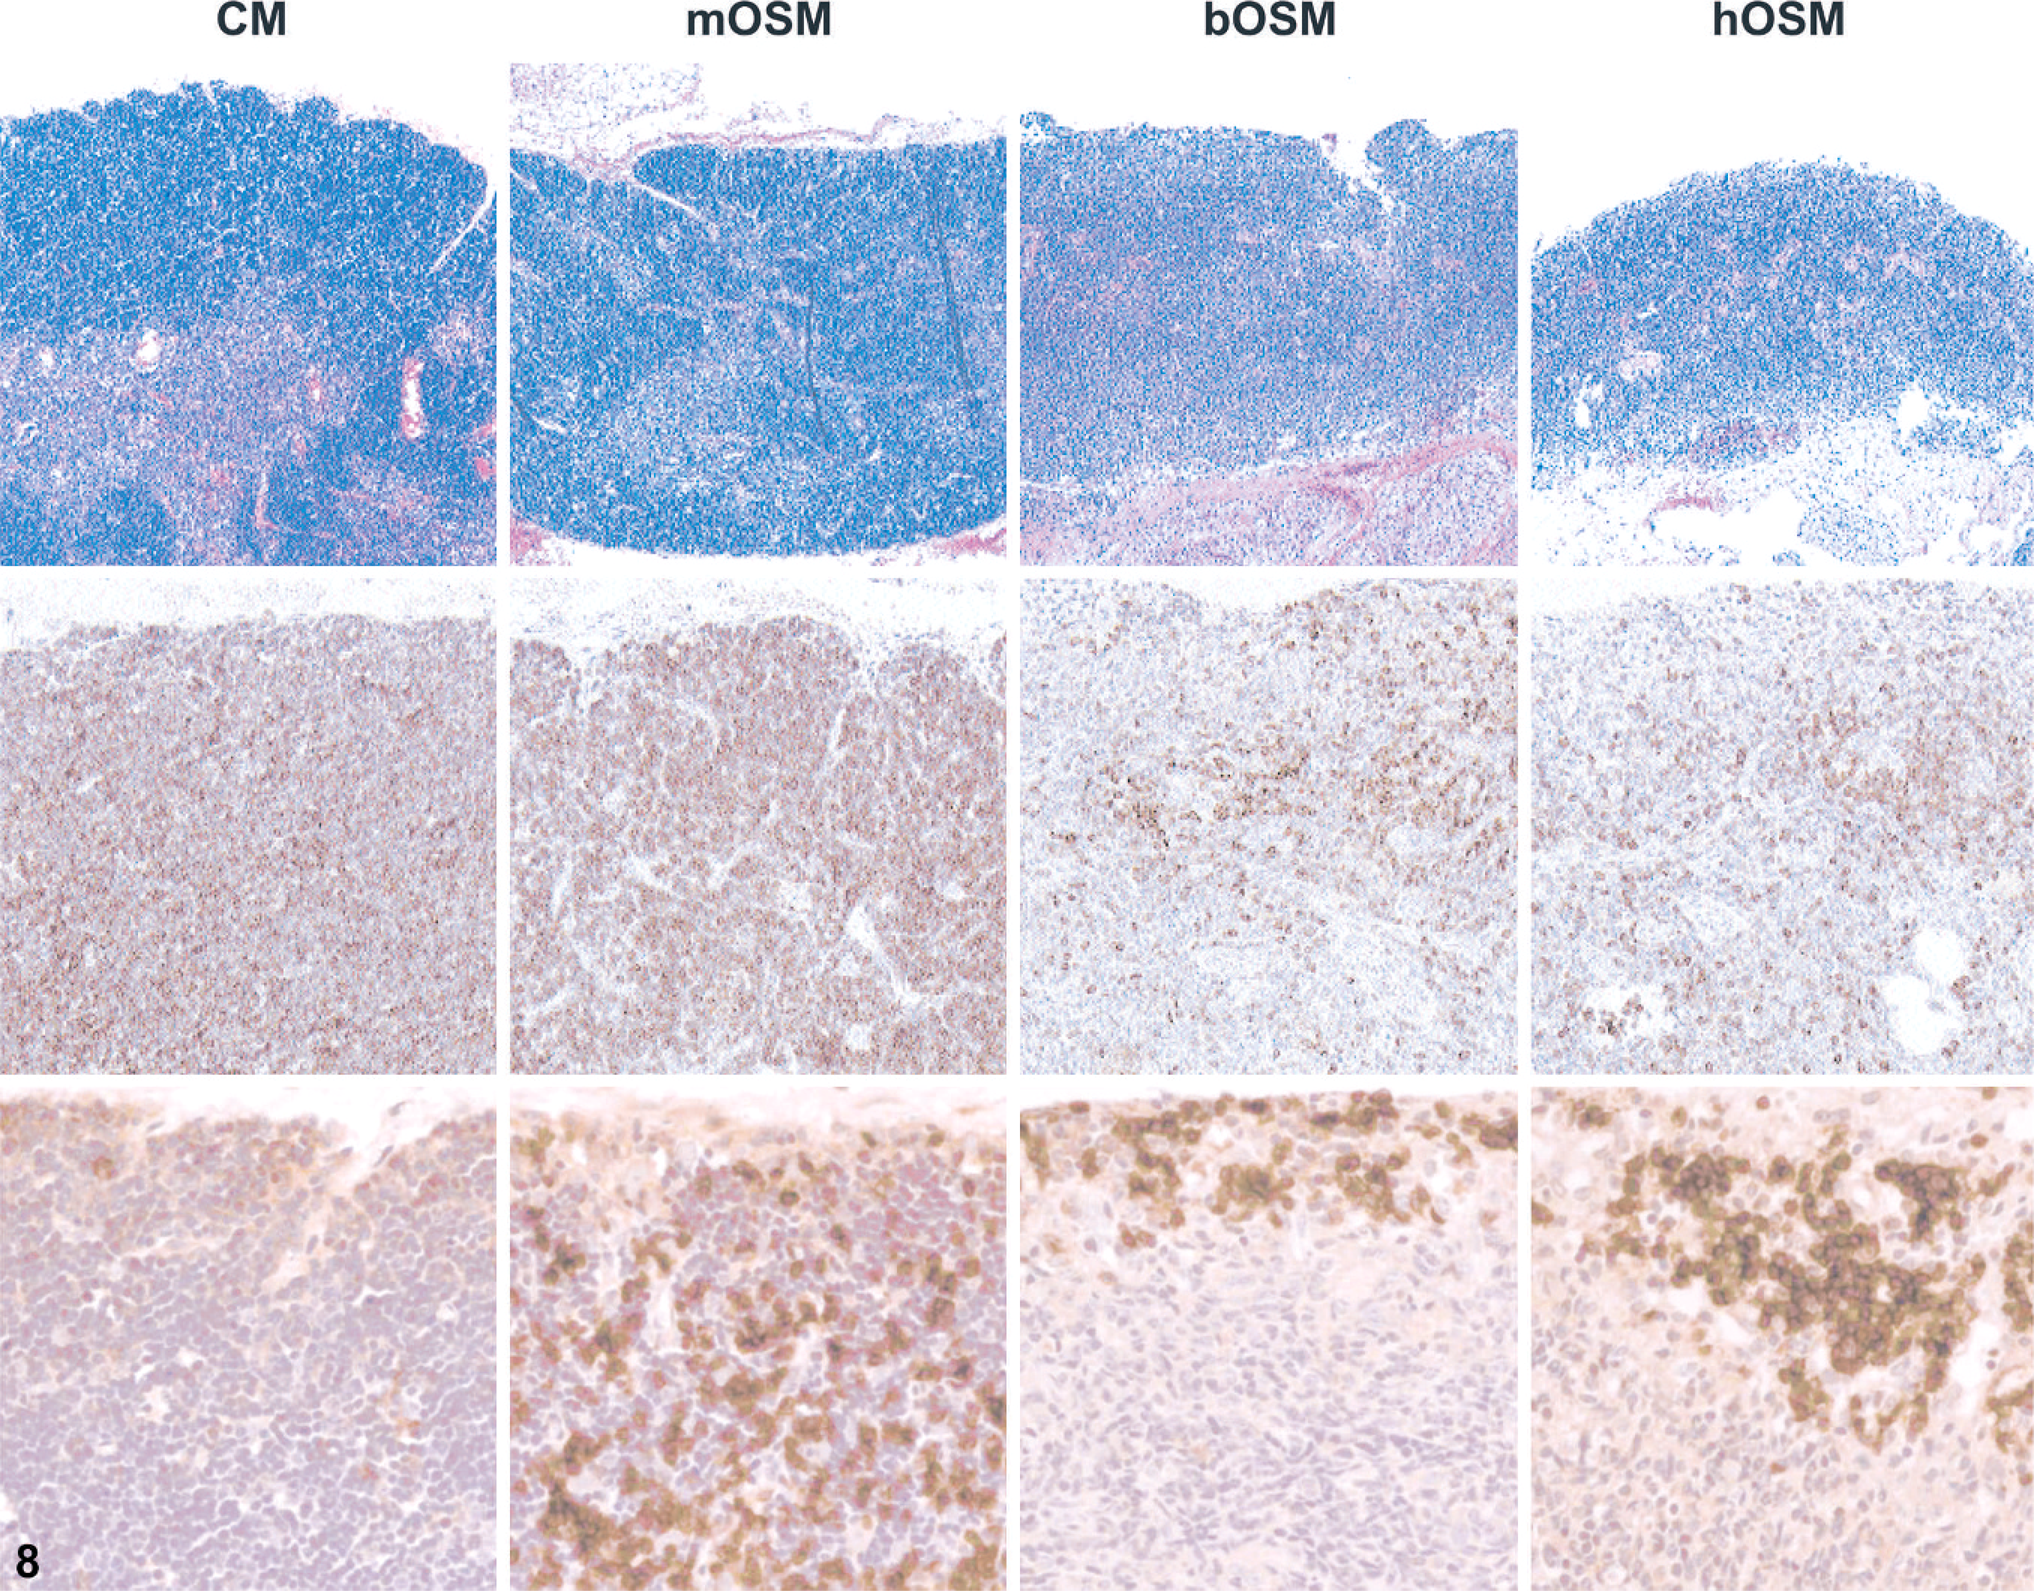
All three OSM variants induced substantial anatomic reorganization of the various lymphocyte compartments within lymphoid organs, and again the phenotype associated with mOSM diverged significantly from those provoked by hOSM or bOSM. For example, lymph nodes of animals overexpressing any of the three OSM variants were markedly enlarged. However, in mOSM-transduced mice the cortex and paracortex were markedly expanded by coalescing cords and nodules consisting of T cells and, to a lesser extent, B cells. In both bOSM- and hOSM-expressing mice the medulla was more prominent, though the cellular composition of the expanded regions varied substantially from individual to individual; the most numerous components were plasma cells and granulocytes (Fig. 6, inset) and—in bOSM animals only—T lymphocytes (Fig. 6). Spleens of all mice overexpressing any OSM variant were greatly enlarged by extensive extramedullary hematopoiesis, though the extent was less in mOSM mice. In the white pulp, the periarteriolar lymphatic sheath (T-cell domain) was attenuated in all OSM-expressing animals, whereas the peripheral white pulp (B-cell domain) appeared to be minimally or unaffected in mOSM mice but was absent in bOSM and hOSM animals (Fig. 7). The thymic cortex was reduced in thickness for all OSM-transduced animals, though the degree was modest in mOSM animals and pronounced in bOSM and hOSM mice (Fig. 8). The thymic cortices of mice given bOSM or hOSM but not mOSM also had many fewer T cells (Fig. 8). Scattered B lymphocytes were evident in the thymuses of all OSM-overexpressing animals; the B cells were widely dispersed in mOSM mice but concentrated near the periphery in animals expressing a nonmurine OSM (Fig. 8). The alterations in white cell populations were considered to be primary effects of OSM overexpression as they were induced by both the mouse and the nonmurine OSM variants. The florid extramedullary hematopoiesis in animals that received nonmurine OSM was interpreted as a tertiary consequence engendered by bone marrow ablation (see the following paragraph).
Lymph node, mouse overexpressing oncostatin M. Overexpression of OSM substantially altered lymph node morphology relative to control mice (CM) by 4 weeks after transplantation, but the pattern induced by hOSM or bovine bOSM differed from that elicited by mOSM. The lymph node of CM was partitioned distinctly into two zones, a thin outer rim of densely packed B lymphocytes and a larger, loosely aggregated central region containing T cells. Lymph node cortices and paracortices of mOSM expressors were markedly thickened by coalescing cords and nodules of lymphocytes comprising both B and T cells. In contrast, enlarged lymph nodes of bOSM- and hOSM-transgenic had a more prominent medulla filled with T cells intermingled with (in inset) plasma cells and granulocytes; the medullary cell composition varied considerably among individuals within both these groups. Stains: HE (top), anti-B220 (B cell; middle), anti-CD3 (T cell; bottom [serial sections relative to anti-B220 panels]).
Spleen; mouse overexpressing oncostatin M. Overexpression of OSM markedly changed splenic morphology relative to control mice (CM) by 4 weeks after transplantation, but the phenotype produced by hOSM or bOSM diverged from that incited by mOSM. The spleen of CM was partitioned distinctly into two zones, red pulp and white pulp, and the latter region was also divisible into a pale inner area (the periarteriolar lymphatic sheath, or PALS; T cells) and a dark outer rim (the peripheral white pulp, or PWP; B cells). The gross splenic enlargement seen in all OSM-transgenic mice resulted from extensive extramedullary hematopoiesis. The PALS was attenuated in mice expressing any OSM variant, while the PWP was absent in animals overexpressing bOSM or hOSM but not mOSM. Stains: HE (top), anti-B220 (B cell; middle), anti-CD3 (T cell; bottom [serial sections relative to anti-B220 panels]).
Thymus; mouse overexpressing oncostatin M. Overexpression of OSM noticeably distorted thymic morphology relative to control mice (CM) by 4 weeks after transplantation, but the configuration elicited by hOSM or bOSM departed from that induced by mOSM. The thymus of CM was partitioned distinctly into two zones, a thick outer rim of densely packed lymphocytes and a loosely aggregated core. The cortex contained myriad T cells. Thymic cortices of mOSM expressers were modestly reduced in thickness and less densely packed with T cells, while organs of mice with bOSM or hOSM lacked cortical tissue and contained almost no T cells. All mice that overexpressed an OSM had B cells in the thymic cortex; the wide dispersion of these cells noted in mOSM mice differed distinctly from their peripheral concentration in animals expressing a nonmurine OSM. Stains: HE (top), anti-CD3 (T cell; middle), anti-B220 (B cell; bottom).
Interestingly, overexpression of hOSM or bOSM resulted in effacement of the bone marrow. The initial change, evident in a few animals, appeared to be multifocal production of fibrous connective tissue consistent with osteosclerosis (data not shown). Fibrotic foci contained little or no bone. Most animals appeared to have more advanced changes, characterized by merging of connective tissue islands and formation of bony trabeculae within the fibrotic foci (Fig. 9). Numerous cathepsin K-labeled osteoclasts lined trabeculae, while endosteal surfaces in diaphyses of control and mOSM-expressing mice had no osteoclasts. The absence of osteosclerosis and osteoclast proliferation in mOSM-transduced animals suggests that this effect was a secondary response specific to nonmurine OSM rather than a primary OSM-mediated event. Additional secondary alterations in several nonlymphoid organs were evident in all or almost all mice given a nonmurine OSM but occurred in none of the animals treated with mOSM (Table 4).
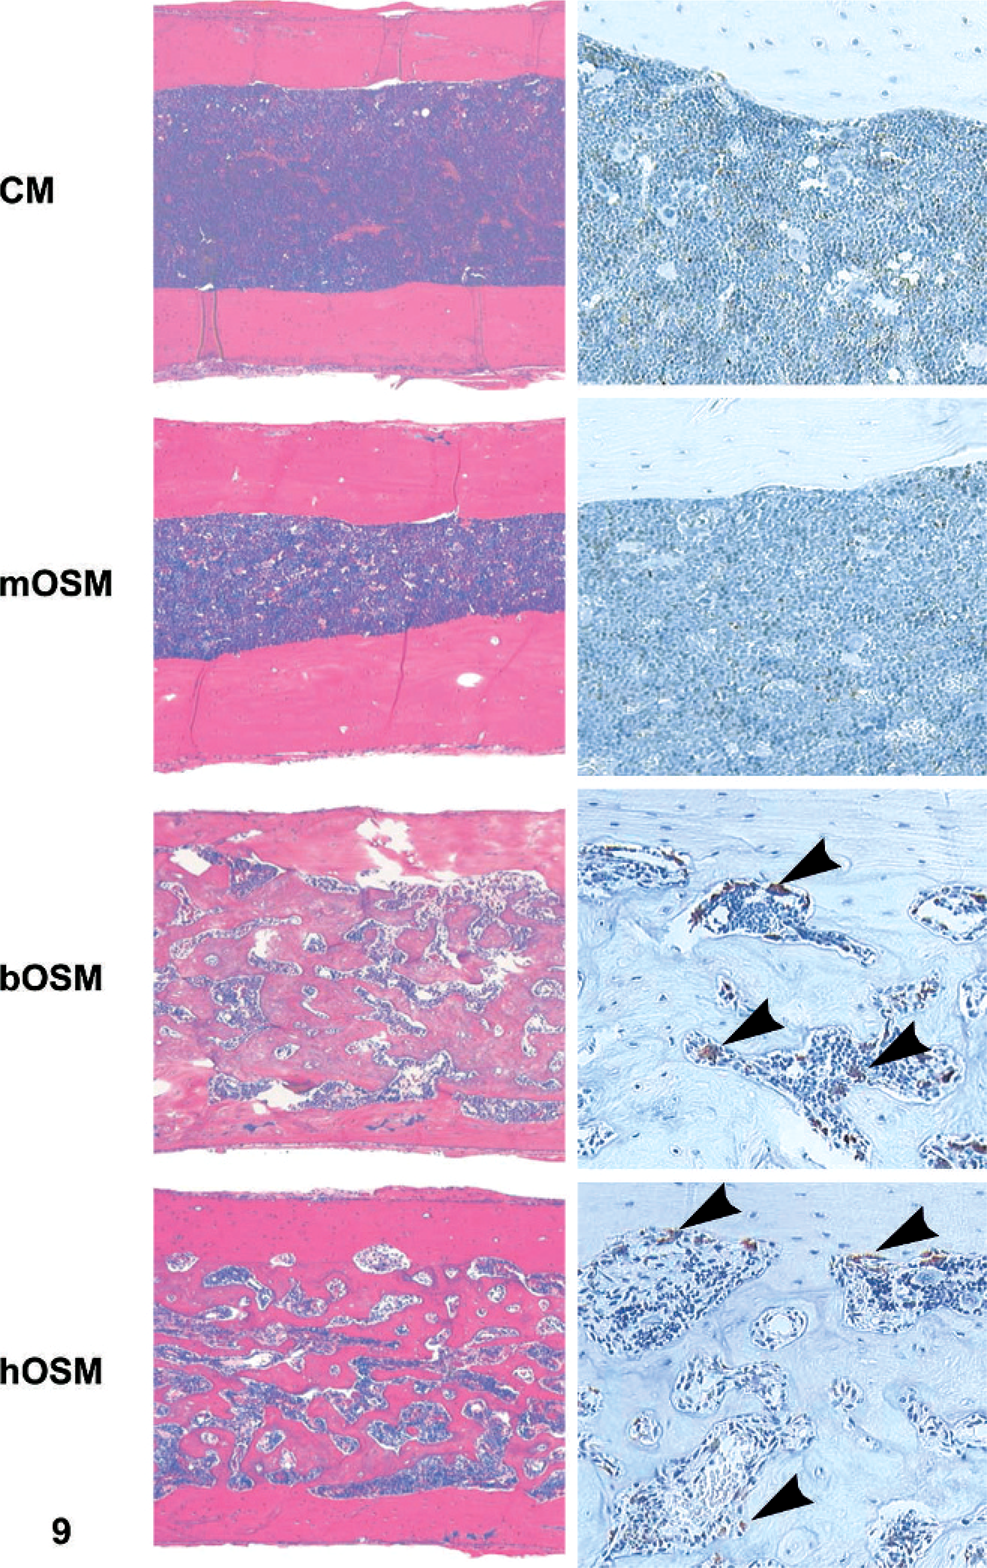
Tibial diaphysis; mouse overexpressing oncostatin M. Mice expressing bOSM or hOSM, but not mOSM, developed extensive fibrosis and/or osteosclerosis of the bone marrow. Intersecting trabeculae of woven bone essentially effaced bone marrow. Numerous cathepsin K–positive osteoclasts (arrowheads) lined the trabeculae, while endosteal surfaces in bone shafts of control and mOSM-expressing mice had no osteoclasts. Stains: HE (left column) and anti-cathepsin K (osteoclast marker; right column).
Discussion
OSM and OSMRβ (the OSM-binding β-chain subunit of the heterodimeric receptor) are closely related, respectively, to LIF and its preferred β-chain, LIFRβ. It has been postulated based on experiments with recombinant hOSM or bOSM applied to in vitro and/or in vivo mouse systems 5, 6, 22, 40 that OSM and LIF share many biological functions due to the structural similarity of their β-subunits and their sharing the same signal-transducing molecule. For example, OSM is reported to substantially enhance megakaryocyte production and bone growth while depleting thymic T cells based on data derived from bOSM-transgenic mice. 22, 40 Interestingly, mice injected with or made transgenic for LIF also develop thymic atrophy and have increased platelet counts, as well as splenomegaly and weight loss. 24, 36 This concordance of biological response between two closely related cytokines raises the possibility that crosstalk mediated by a trans-species interaction of nonmurine OSM with mouse LIFRβ is responsible for the LIF-like physiologic reactions that have been attributed to OSM. Indeed, previous in vitro work in our laboratory using purified ligands and mouse NIH 3T3 cells supported this premise 20 : hOSM signals via mLIFRβ but not mOSMRβ, whereas mOSM activates mOSMRβ but not mLIFRβ. Our current in vivo data extend this prior work and show that in vivo phenotypes in mice induced by mOSM and nonmurine OSMs diverge. Thus, prior studies of nonmurine OSMs in mouse systems may have unintentionally probed LIF signaling rather than authentic OSM biology.
In the present study, retroviral-mediated overexpression of mOSM, hOSM, or bOSM resulted in a prominent phenotype distinguished by several marked changes. Three alterations—lymph node enlargement, splenic white pulp atrophy, and thymic atrophy—were considered to be primary consequences of OSM overexpression as these sites were affected in mice transduced with any OSM (Table 3). However, the biological effects of mOSM in lymphoid organs clearly differed from those of non-murine OSM as shown by partially to completely distinct patterns of structural alterations (Table 3; Figs. 6–8). Interestingly, the anatomic changes elicited by bOSM and hOSM did not exactly correlate, as the prominent T lymphocyte population observed in the expanded lymph node medulla of bOSM-overexpressing mice was not as evident in the hOSM animals (Fig. 6). The exact molecular pathways responsible for these discrepancies among the various OSM is uncertain, especially given a previous report showing that mOSM, hOSM, and bOSM mediated extrathymic, thymus-independent maturation of T lymphocyte precursors in lymph nodes to a similar degree. 5 Our present data do support a major finding of the prior report, as B lymphocytes are scattered throughout the thymic cortex of OSM-overexpressing mice but not control animals (Fig. 8). However, the anatomic effects of these three OSM variants diverge between the previous study 5 and our experiment (e.g., increased [prior] versus decreased [present] thymic weights in bOSM- and hOSM-overexpressing mice). The differences between the prior 5 and current data likely reflect subtle disparities in the gene construct (driven by the Lck [leukocyte-specific protein tyrosine kinase] promoter in the prior study versus the retroviral LTR promoter in the current study) and engineering methods (pronuclear injection in the prior study versus retroviral transfer into adults in the current study). We consider the most suitable explanation for the dissimilarities to be that our hypothesis is correct: murine OSM induces one or more signaling cascades that are distinct from those mediated by nonmurine OSM, whether the system is evaluated in vitro (Fig. 2 and our prior report 20 ) or in vivo (Tables 1, 3, 4). Further studies will be required to ascertain the specific pathway(s) involved in mediating these variations in vivo.
Other marked changes limited to mice receiving bOSM or hOSM were interpreted as secondary effects. These changes included weight loss, pancreatic and white fat atrophy (consistent with cachexia), thrombocytosis, osteosclerosis, splenomegaly (from extramedullary hematopoiesis, likely secondary to osteosclerotic bone marrow ablation), adrenocortical atrophy, cervical mucosa attenuation and inflammation, and gastric mucinosis and inflammation. With the exception of the adrenal, cervical, and gastric modifications, these features equate to those described previously in mice after transgenic overexpression of bOSM 22, 40 or LIF. 24, 36 Additional work will be necessary to define what role, if any, LIF stimulation by nonmurine OSM plays in the pathogenesis of the adrenal, cervical, and gastric alterations.
As noted previously, mice that overexpressed mOSM also developed a pronounced phenotype. However, the lymphoid changes in the mOSM-transduced animals were distinct from those noted in mice that received a nonmurine OSM. Overexpression of mOSM resulted in atrophy of T cell depots in splenic white pulp and thymus; the other anatomic lesions characteristic of the phenotype induced by nonmurine OSMs in these organs were not engendered by mOSM. Mice that overexpressed mOSM also exhibited thickening of the lymph node cortex and paracortex by whorls of small lymphocytes (both B and T cells), a finding that was absent in animals receiving vectors bearing bOSM or hOSM (Fig. 6). Using our novel data to reappraise previously published literature, we conclude that the genuine physiologic function of appropriate OSM signaling in vivo (mOSM/mOSMRβ) primarily involves governance of lymphocyte subsets in secondary lymphoid organs, a finding in agreement with prior reports that chronic OSM overexpression modulates extrathymic T-cell development. 2, 3 In particular, the T lymphocyte lineage appears to be the principal target for OSM control as indicated by prominent changes in T cell-specific domains: atrophy of the periarteriolar region of the splenic white pulp (Fig. 7) and thymic cortex (Fig. 8). This interpretation is supported by the pronounced increase in T cells within the cortex of enlarged lymph nodes of mice that overexpress mOSM (Fig. 6). Our current work did not determine the mechanism(s) by which OSM might fulfill this task. Feasible explanations for these morphologic changes are that activating the OSMRβ pathway affects T lymphocyte production in the thymus and/or subsequent homing to other lymphoid organs. However, the distorted distribution of B cells in the lymph node cortex might also indicate a function for OSM signaling in B lymphocyte biology. Further work will be needed to fully elucidate mechanisms by which OSM/OSMRβ mediate these effects.
The substantial alterations in lymphoid organ structure elicited by OSM overexpression raised several other potential realms for future inquiry. Other leukocyte populations (e.g., dendritic cells, macrophages) and other cell populations might reasonably be anticipated to exhibit altered functions, distributions, and/or kinetics in the presence of excess OSM. For example, mice transgenic for bOSM under the control of the Lck promoter (Lck-bOSM) have increased numbers of high endothelial venules (HEV), 21 vascular elements that are particularly rich in OSMRβ. 17 The resemblance at low magnification between the lymph node anatomy of our bOSM-transfected mice and the Lck-bOSM transgenic animals from the prior experiment 21 suggest the possibility that HEV are enhanced in lymph nodes of some or all of our OSM-overexpressing mice. Again, the authenticity of such potential changes fell outside the main scope of our current work and therefore remains a fertile area for further study.
Importantly, our current data strongly imply that other roles imputed to OSM, such as regulating body metabolism (total weight, fat deposition) and platelet production, arise from nonmurine OSM binding to LIFRβ. This conclusion is supported by the absence of body weight loss and the atrophy of adipose and exocrine pancreatic tissues (all hallmarks of LIF-induced cachexia) in mOSM-transfected animals versus the presence of marked body weight loss accompanied by fat and pancreatic atrophy in mice overexpressing bOSM or hOSM. The considerable hOSM- and bOSM-induced thickening of the inner adrenal cortex (a major site of cortisol production) and universal shift of the cervical mucosa morphology to the metestrus conformation (suggestive of repressed estrus cycling) likely reflect sequelae of cachexia-induced stress; an immediate explanation for the mucosal mucinosis and lymphocytic infiltration of the glandular stomach was not apparent. Our present results leave open the possibility for a few overlapping duties for LIF and OSM, as overexpression of all three OSMs led to splenomegaly associated with extramedullary hematopoiesis. However, the nature of the splenic change elicited by mOSM likely differs from that incited by bOSM or hOSM. This interpretation is reasonable as the engorgement resulting from mOSM was substantially less than that afforded by the other two molecules and was not associated with bone marrow ablation (a marked finding in mice overexpressing bOSM or hOSM). Regardless, the pronounced divergence between the murine phenotype induced by mOSM and those produced by bOSM or hOSM clearly implies that the predominant consequences of homologous OSM signaling (mOSM/mOSMRβ) are readily discernible from those elicited by nonhomologous OSM signaling. Taken together, these data affirm that prior studies of nonmurine OSMs in mouse systems may have explored LIF biology rather than real OSM physiology and highlight the need for conformation of homologous ligand and receptor interactions as the definitive indicator of cytokine biology and phenotypic characterization in genetically engineered mice.
Footnotes
Acknowledgements
T. S. Juan and F. A. Fletcher designed experiments, performed research, analyzed data, and edited the paper. B. Bolon performed research, analyzed data, and drafted the paper. R. A. Lindberg, Y. Sun, and G. Van performed research and analyzed data. None of the authors has a conflict of interest in seeking to publish these data. The authors are grateful to both reviewers, as their extraordinary thoroughness has greatly improved the final paper.