
Abstract
Canine cutaneous mast cell tumor (MCT) is a common neoplastic disease in dogs. Due to the prevalence of canine MCTs and the variable biologic behavior of this disease, accurate prognostication and a thorough understanding of MCT biology are critical for the treatment of this disease. The goals of this study were to evaluate and compare the utility of the proliferation markers Ki67, proliferating cell nuclear antigen (PCNA), and argyrophilic nucleolar organizing region (AgNOR) as independent prognostic markers for canine MCTs and to evaluate the use of these markers in combination, as each marker assesses different aspects of cellular proliferation. An additional goal of this study was to evaluate the associations between cellular proliferation and c-KIT mutations and between cellular proliferation and aberrant KIT protein localization in canine MCTs. Fifty-six MCTs treated with surgical excision alone were included in this study. Each MCT was evaluated for Ki67 expression, PCNA expression, and KIT protein localization using immunohistochemistry; for AgNOR counts using histochemical staining; and for the presence of internal tandem duplication c-KIT mutations using polymerase chain reaction amplification. In this study, increased Ki67 and AgNOR counts were both associated with significantly decreased survival. On the basis of these results, we recommend that the evaluation of cellular proliferation, including evaluations of both Ki67 expression and AgNORs, should be routinely used in the prognostication of canine MCTs. Additionally, the results of this study show that MCTs with aberrant KIT protein localization or internal tandem duplication c-KIT mutations are associated with increased cellular proliferation, further suggesting a role for c-KIT in the progression of canine MCTs.
Canine cutaneous mast cell tumors (MCTs) are one of the most common neoplasms in dogs7,15,44,50 and have an extremely variable biologic behavior.33,40,58,70 Due to their high prevalence and variable biologic behavior, accurate prognostication and a thorough understanding of the molecular biology of canine MCTs are critical for the successful treatment of this disease. Currently, histologic grading is the primary prognostic and therapeutic determinant for canine cutaneous MCTs. The most commonly used histologic grading system defines grade I MCTs as well-differentiated tumors with a positive prognosis, grade II MCTs as intermediately differentiated tumors with a cautionary prognosis, and grade III MCTs as poorly differentiated tumors with a negative prognosis.40 Although histologic grades have been shown to be significantly associated with prognosis,2,40 the ambiguity of intermediate-grade tumors55,67 and the marked degree of interobserver variation, with as low as 50% agreement between pathologists in some studies, have led to questioning of the relevance of the current histologic grading system.23,36,37
The propensity for uncontrolled cellular proliferation is a hallmark of cancer,17 and as such, measures of cellular proliferation have been used extensively to prognosticate both human14,18,19,41,46,47,63,64 and veterinary neoplastic diseases.1,3,20,22,24,26,29,34,49,52,53,56 In veterinary medicine, the most commonly used methods to evaluate cellular proliferation include proliferating cell nuclear antigen (PCNA) and Ki67 immunostaining and argyrophilic nucleolar organizing region (AgNOR) histochemical staining.29,34 PCNA, is the auxiliary subunit of DNA polymerase delta5,43 and is also involved in several additional processes in the nucleus, most notably DNA repair.30 Although PCNA has an extended half-life6 and is involved in multiple nuclear functions,30 maximal PCNA expression is commonly seen in the DNA synthesis phase (S-phase)4,25,57 of the cell cycle (S-phase index). Ki67 is a nuclear protein that is expressed in all phases of the cell cycle but is not expressed in noncycling cells.16,54 The relative number of Ki67-positive cells in a given tissues is used to determine the proliferation index or the relative number of cells actively involved in the cell cycle (growth fraction).8,16,29,34,54 AgNORs are nucleolar substructures that are involved in ribosomal RNA transcription.11 AgNORs can be identified in histologic sections as discrete black nucleolar foci with a silver-based staining method, due to the silver affinity of associated proteins.42 The quantity of AgNORs per nuclei has been shown to be correlated with the rate of cell proliferation (inverse generation time) or the cell doubling time in vitro12,38,60 and the rate of tumor growth in vivo.39,59,61
In previous studies, PCNA and Ki67 immunostaining and AgNOR histochemical staining have been shown to be independent prognostic markers for canine MCTs.1,3,52,53,56 Although these studies have demonstrated the prognostic significance of these proliferation markers, the methods and results of these studies are varied, thereby confounding the interpretation and application of each individual study.
Cellular proliferation is a result of both the number of cycling cells (growth fraction) in a given tumor and the rate of cell cycle progression (generation time). In order to truly assess cellular proliferation, it is necessary to evaluate both the growth fraction (Ki67) and the generation time (AgNORs).8,63 At this time, only 1 study has evaluated AgNORs, PCNA, and Ki67 in a single cohort of animals,53 and no studies have evaluated the prognostic value of these markers in combination. The primary goal of this study was to re-evaluate the utility of PCNA and Ki67 immunohistochemical staining and AgNOR histochemical staining, independently and in conjunction with one another, as prognostic markers for canine cutaneous MCTs.
Our laboratory is also interested in understanding the role that the c-KIT proto-oncogene plays in the development of canine MCTs. The c-KIT proto-oncogene encodes the receptor tyrosine kinase KIT,68 which has been shown to be important for normal mast cell survival, proliferation, differentiation, and migration.9,10,32,35,62,69 Previously, our laboratory has shown that juxtamembrane domain c-KIT mutations are significantly associated with higher histologic grade MCTs,71 and internal tandem duplication (ITD) c-KIT mutations and aberrant cytoplasmic KIT protein localization are significantly associated with both decreased disease-free and overall survival rates.65,66 Due to the fact that KIT plays an important role in normal mast cell proliferation,35,62,69 we hypothesized that ITD c-KIT mutations and aberrant KIT protein localization are associated with increased cellular proliferation in canine MCTs. Therefore, an additional goal of this study was to evaluate cellular proliferation as measured by Ki67 and PCNA immunohistochemical staining and AgNOR histochemical staining in a series of canine cutaneous MCTs with and without ITD c-KIT mutations and with different patterns of KIT protein localization in order to test this hypothesis.
Materials and Methods
Case selection and follow-up data
Fifty-six canine cutaneous MCTs from 56 dogs were included in this study. All tumors included in this study were submitted to the Diagnostic Center for Population and Animal Health at Michigan State University between 1998 and 2001 for routine diagnostic histopathologic examination and were included on the basis of the following inclusion criteria: 1) confirmed diagnosis of canine cutaneous MCT, 2) treatment with surgical excision alone (no radiation or chemotherapy at the time of the initial tumor treatment), 3) availability of follow-up data, and 4) adequate formalin-fixed paraffin-embedded material available for all analyses. Follow-up data including age, sex, breed, weight, number of masses, location of mass, time before excision, medication at the time of surgery, diagnostic tests that were performed, subsequent local and distant tumor occurrences, tumor margins, survival time, and cause of death were obtained from referring veterinarians. The diagnosis and histologic grade of each MCT was independently re-evaluated according to the Patnaik histologic grading system for canine cutaneous MCTs40 prior to inclusion in this study in conjunction with a multi-institutional review of MCTs, in which 31 pathologists participated in the histologic grading of 95 canine MCTs.23 Histologic grades represent a consensus of those results.
Immunohistochemical staining
Five-micrometer sections of formalin-fixed paraffin-embedded tissue were cut, deparaffinized in xylene, rehydrated in graded ethanol, and rinsed in distilled water. c-KIT and PCNA immunostaining was performed using a Dako Autostainer (Dako, Carpenteria, CA). Endogenous peroxidases were blocked by incubating sections in 3% hydrogen peroxide for 5 minutes. For c-KIT immunostaining, antigen retrieval was performed by incubating with citrate buffer antigen retrieval solution (Dako) in a steamer for 20 minutes and cooled for 20 minutes. No antigen retrieval was used for PCNA. Nonspecific antibody binding was blocked with protein-blocking agent (Dako) for 10 minutes. Sections were either incubated with mouse monoclonal anti-PCNA antibodies (PC10 clone; Dako Cytomation, Carpenteria, CA) at a 1:100 dilution or rabbit polyclonal anti-c-KIT antibodies (Dako Cytomation) at a 1:100 dilution for 30 minutes (Fig. 1). A streptavidin-biotin labeling system (Dako) was used for immunolabeling, and reactions were visualized with 3′3′-diaminobenzidine (Dako)
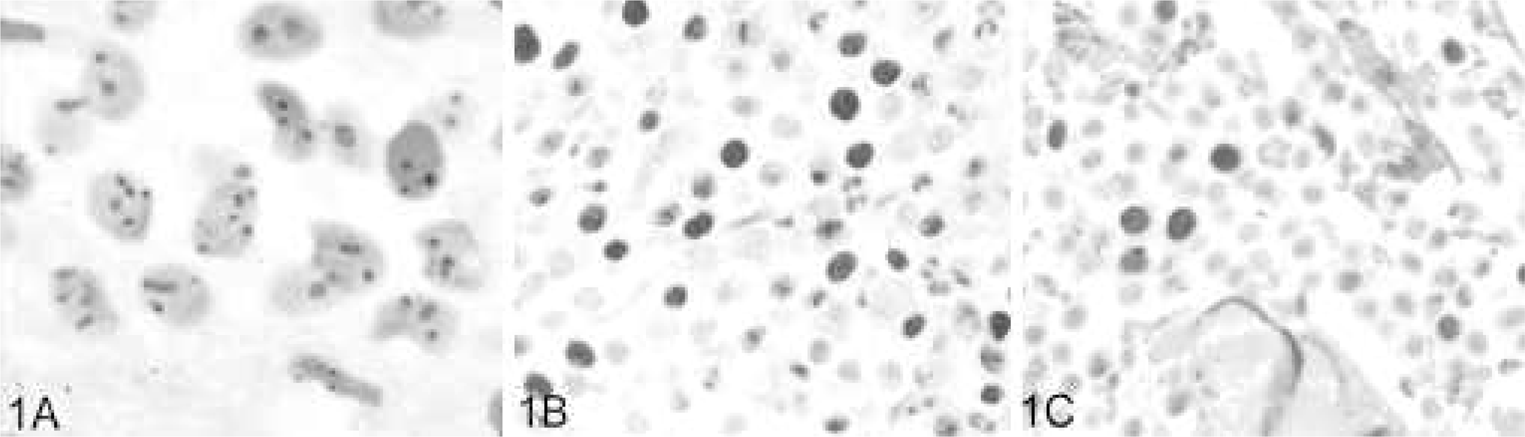
Histochemical and immunohistochemical staining for proliferation markers in
canine cutaneous mast cell tumors.
Ki67 immunostaining was performed with the Benchmark staining platform (Ventana, Tucson, AZ). Antigen retrieval was performed using the Ventana medium cell conditioner protocol (Ventana). Sections were subsequently incubated with mouse monoclonal anti-Ki67 primary antibodies (MIB1; Dako Cytomation) at a 1:50 dilution for 32 minutes. The immunoreaction was detected using a commercial alkaline phosphatase–based enhanced strepavidin-biotin secondary antibody system (Ventana) (Fig. 1). All slides were counterstained with Mayer's hematoxylin. Negative controls, consisting of canine cutaneous MCTs that were treated identically to the other tissue sections except buffer was used in place of primary antibody, were included in each run. Known canine cutaneous MCT sections were included in each run as a positive control for c-KIT. The basal layer of the epidermis served as an internal positive control for PCNA and Ki67.
AgNOR histochemical staining
AgNOR histochemical staining was performed using a previously described modified 1-step silver-staining technique.42 In brief, 5-μm sections of formalin-fixed paraffin-embedded tissue were cut, deparaffinized in xylene, rehydrated in graded ethanol, and rinsed in distilled water. Slides were incubated for 30 minutes at room temperature in the dark with freshly made AgNOR staining solution consisting of 0.02-g gelatin in 1 ml of 1% formic acid and 1-g silver nitrate in 2 ml of distilled water. Following AgNOR staining, slides were rinsed with distilled water, dehydrated with graded ethanol and xylene, and coverslipped (Fig. 1).
Evaluation of KIT immunostaining patterns
KIT immunohistochemical staining was evaluated as previously described for canine cutaneous MCTs.65 In brief, we identified 3 patterns of KIT protein localization: 1) KIT pattern I, which consisted of a predominately perimembrane pattern of KIT protein localization with minimal cytoplasmic KIT protein localization; 2) KIT pattern II, which consisted of focal-to-stippled cytoplasmic KIT protein localization; and 3) KIT pattern III, which consisted of diffuse KIT cytoplasmic KIT protein localization. Each MCT was classified on the basis of the highest staining pattern present in at least 10% (estimated on the basis of 100 neoplastic cells in a high-power field) of the neoplastic cell population or being present in large clusters. Cells on the margins of the tissue sections were not considered due to possible artifactual staining.
Evaluation of PCNA and Ki67 immunostaining
In order to apply the results of this study to a diagnostic setting, we performed all cell counting manually. For PCNA and Ki67 immunohistochemical staining evaluations, areas with the highest proportion of immunopositive neoplastic mast cells were identified at 100× magnification using an American Optical light microscope (American Optical Instruments, Buffalo NY). Upon identification of highly proliferative areas, the number of immunopositive cells present in a 10 × 10 mm grid area was counted using a 1-cm2 10 × 10 grid reticle at 400× magnification. The number of immunopositive cells per grid area was evaluated over 5 high-power fields and subsequently averaged in order to obtain an average S-phase index in the case of PCNA immunostaining and the growth fraction in the case of Ki67 immunostaining.
Evaluation of AgNOR histochemical staining
In order to determine the average AgNOR count/cell in each tumor, AgNORs were counted in 100 randomly selected neoplastic mast cells throughout the tumor at 1,000× magnification. Individual AgNORs were resolved by focusing up and down while counting within individual nuclei. Average AgNOR counts/cells were then determined on the basis of averaging the counts within these 100 random neoplastic cells as has been shown by numerous publications.31,51 Analysis of 30 cells was sufficient to have <5% of an analytic error,51 whereas analysing >500 cells reduced this error only marginally.31 These numbers correlate with the inverse generation time.
Laser capture microdissection and analysis of c-KIT mutations
Laser capture microdissection (LCM) was used to isolate neoplastic mast cells for DNA extraction and subsequent PCR amplification of c-KIT exon 11 and intron 11 in order to identify ITD c-KIT mutations as previously described.66 Five- to 7-μm sections of formalin-fixed paraffin-embedded MCTs were stained with hematoxylin and dehydrated in graded alcohol for laser capture microdissection. Two thousand to 4,000 neoplastic mast cells were extracted from each tumor sample using the PixCell laser-capture microdissection system with Macro LCM caps (Arcturus, Mountain View, CA). Extracted cells adhered to the Macro LCM caps and were incubated overnight in 50 μl of DNA extraction buffer (10-mM tris[hydroxymethyl]aminomethane [Tris], pH 8.0, 1-mM ethylenediaminetetraacetic acid, 1% Tween [United States Biochemical Corp., Cleveland OH]) and 1.5 μl of 15-mg/ml Proteinase K (Roche, Indianapolis, IN) at 37°C. Samples were centrifuged at 1,306 × g for 5 minutes, and Proteinase K was inactivated by heating at 95°C for 8 minutes.
PCR amplification of c-KIT exon 11 and intron 11
PCR amplification was performed using a previously described primer pair that flanks exon 11 and the 5′ end of intron 11,21 which includes the previously described ITD region of the c-KIT proto-oncogene in canine MCTs.13,21,27,28,45,66,71 PCRs were prepared in a 25-μl total reaction volume, with 5-μl LCM-extracted DNA, 5 pmol of each primer, 0.5 U of Taq polymerase (Invitrogen, Carlsbad, CA), and final concentrations of 80-μM deoxynucleotide triphosphate, 2-mM magnesium chloride, 20-mM Tris-hydrogen chloride, and 50-μl potassium chloride. Cycling conditions were as follows: 94°C for 4 minutes; 35–45 cycles at 94°C for 1 minute, 55°C for 1 minute, and 72°C for 1 minute; and 72°C for 5 minutes. Amplified products and ITD mutations were visualized by agarose gel electrophoresis on a 2% agarose gel after ethidium bromide staining.
Statistical analysis
This study used 2 different approaches to analysis: logistic regression models to describe associations between risk factors and the occurrence (yes/no) of MCT outcomes and the Cox proportional hazards models (SAS PROC PHREG; SAS, version 9.13, SAS Institute, Inc., Cary, NC) for survival analysis to describe the relationships between risk factors and the time to the occurrence of different MCT outcomes (time to event). Survival analysis produces point estimates of the hazard ratio (risk ratio) for risk factors in the model. The MCT outcomes used in this study included recurrence of local MCTs, occurrence of distant MCTs, and death resulting from MCT.
Univariable analyses
Before developing multivariable models, we evaluated each risk factor for its association with MCT outcomes. Both univariable logistic regression (for occurrence) and proportional hazards (for time to event) models were developed for each risk factor for each outcome, and the level of association was assessed through P value of the risk factors in the model. Risk factors with P ≤ .20 were considered for inclusion in the multivariable models.
Logistic regression analyses
Logistic regression models were developed for the occurrence of outcomes associated with MCTs, including recurrence of local MCTs, occurrence of distant MCTs, and death associated with MCTs. In addition to risk factors of interest, animal signalment (age, sex, weight) was included in the multivariable model to account for its effect on model outcome. Results were reported as odds ratios. An odds ratio < 1 means that the likelihood of the occurrence of an event is reduced, while an odds ratio > 1 indicates that the likelihood of an event is increased. Odds ratio = 1 indicates that the risk factor neither increases nor decreases the likelihood of the outcome.
Multivariable survival analysis models
Multivariable proportional hazards regression models were developed for survival analysis of different outcomes associated with MCTs. These outcomes were days to recurrence of local MCTs, days to occurrence of distant MCTs, and days to death resulting from MCT. As for the multivariable logistic regression models, animal signalment (age, sex, weight) was included in the multivariable models to account for its effect on model outcomes. The effects of risk factors on days to events were reported as hazard ratios. Comparable to odds ratios, hazard ratios < 1 indicate that the risk factor increases time to outcome, while hazard ratios > 1 indicate that the risk factor decreases time to outcome.
Results
Eighteen dog breeds were represented in this study, including 12 mixed breed dogs, 12 Labrador Retrievers, 10 Boxers, 6 Golden Retrievers, 2 Pugs, 2 Basset Hounds, and 12 additional breeds that were represented by single dogs. The median age of the dogs included in this study was 7.93 years and ranged from 2 to 14 years of age. Thirty-three female and 23 male dogs were included in this study. Eight of the 56 MCTs included in the study were histologic grade 1, 41 MCTs were histologic grade 2, and 7 MCTs were histologic grade 3.
The average PCNA counts of the MCTs included in this study ranged from 6.00 to 243.20 positive cells per grid area with average count of 64.94 positive cells/grid area and a median of 44.50 positive cells. AgNOR counts ranged from 1.25 AgNORs/cell to 4.05 AgNORs/cell, with an average count of 2.29 AgNORs/cell and a median count of 2.21 AgNORs/cell. Ki67 counts ranged from 3 to 97 positive cells/grid area, with an average of 24.66 positive cells/grid area and a median Ki67 count of 17.10 cells.
The prognostic significance of Ki67, PCNA, and AgNOR counts was first evaluated in a univariable statistical analysis in order to identify potentially significant variables for inclusion in a multivariable statistical model controlling for age, sex, and breed (Tables 1, 2). Since tumor growth is determined by both the number of proliferating cells within a given tumor and the rate of cellular proliferation,8,63 derived variables were created by multiplying the AgNOR counts (inverse generation time) by either the Ki67 (growth fraction) counts (Ag67) or PCNA (S-phase index) counts (AgPCNA) based on the equation: proliferation ∼ 1/generation time × growth fraction.8 According to multivariable analysis, increased Ki67 counts were significantly associated with both an increased incidence and rate of subsequent tumor occurrence at the original surgical site (P = .0111; P = .0017, respectively), an increased rate of MCT occurrence at sites distant from the original tumor site (P = .0081), and an increased incidence of MCT-related mortality (P = .0022). Increased AgNOR counts were significantly associated with both an increased rate of subsequent tumor occurrence at the original surgical site and at sites distant from the original surgical site (P = .0435; P = .0121, respectively) and with an increased incidence and rate of MCT-related mortality (P = .0028; P = .0017, respectively). Additionally, increased Ag67 counts were significantly associated with an increased incidence and rate of MCT occurrence at the original surgical site (P = .0230; P = .0021, respectively), an increased rate of MCT occurrence at distant sites (P = .0026), and the incidence and rate of MCT-related mortality (P = .0053; P = .0318, respectively), whereas AgPCNA counts were only associated with an increased incidence and rate of MCT-related mortality (P = .048; P = .0325, respectively). PCNA counts alone were not found to be of any prognostic significance following multi-variable analysis.
Univariable and multivariable logistic regression analysis between Ki67, AgNOR, PCNA, and Ag67 and incidence of subsequent tumor development and MCT-related mortality.∗
AgNor = argyrophilic nucleolar organizing region; PCNA = proliferating cell nuclear antigen; CI = confidence interval; MCT = mast cell tumor; agPCNA = AgNOR × PCNA.
Univariable and multivariable proportional hazards analysis between Ki67, AgNOR, PCNA, and Ag67 and time until subsequent tumor development and MCT-related mortality.
AgNor = argyrophilic nucleolar organizing region; PCNA = proliferating cell nuclear antigen; CI = confidence interval; MCT = mast cell tumor. agPCNA = AgNOR × PCNA.
In order to utilize these proliferation markers, distinct cut-off values that differentiate between tumors with a favorable prognosis and those with a poor prognosis are needed. Cut-off values that discriminated MCTs associated with patient mortality from those that were not associated with mortality were determined for each proliferation marker. These cut-off values were based on the mean value and 95% confidence interval (CI) of MCTs associated with patient mortality and those that were not. Only the Ki67 and the Ag67 indices had distinct cut-off values of 23 and 54, respectively, which allowed for a clear differentiation between these 2 populations of tumors with nonoverlapping CIs. According to multivariable analysis, MCTs with a Ki67 index > 23 cells/grid area or an Ag67 index > 54 were significantly associated with an increased incidence (P = .0206; P = .0130, respectively) and rate (P = .0074; P = .0109, respectively) of MCT occurrence at the original surgical site (Figs. 2, 3, respectively) and with an increased incidence of MCT-related mortality (P = .0016; P = .0012, respectively). Additionally, MCTs with a Ki67 index > 23 were also significantly associated with an increased rate of MCT occurrence at distant sites (P = .0138) and an increased rate of MCT-related mortality (P = .0171, Fig. 4).
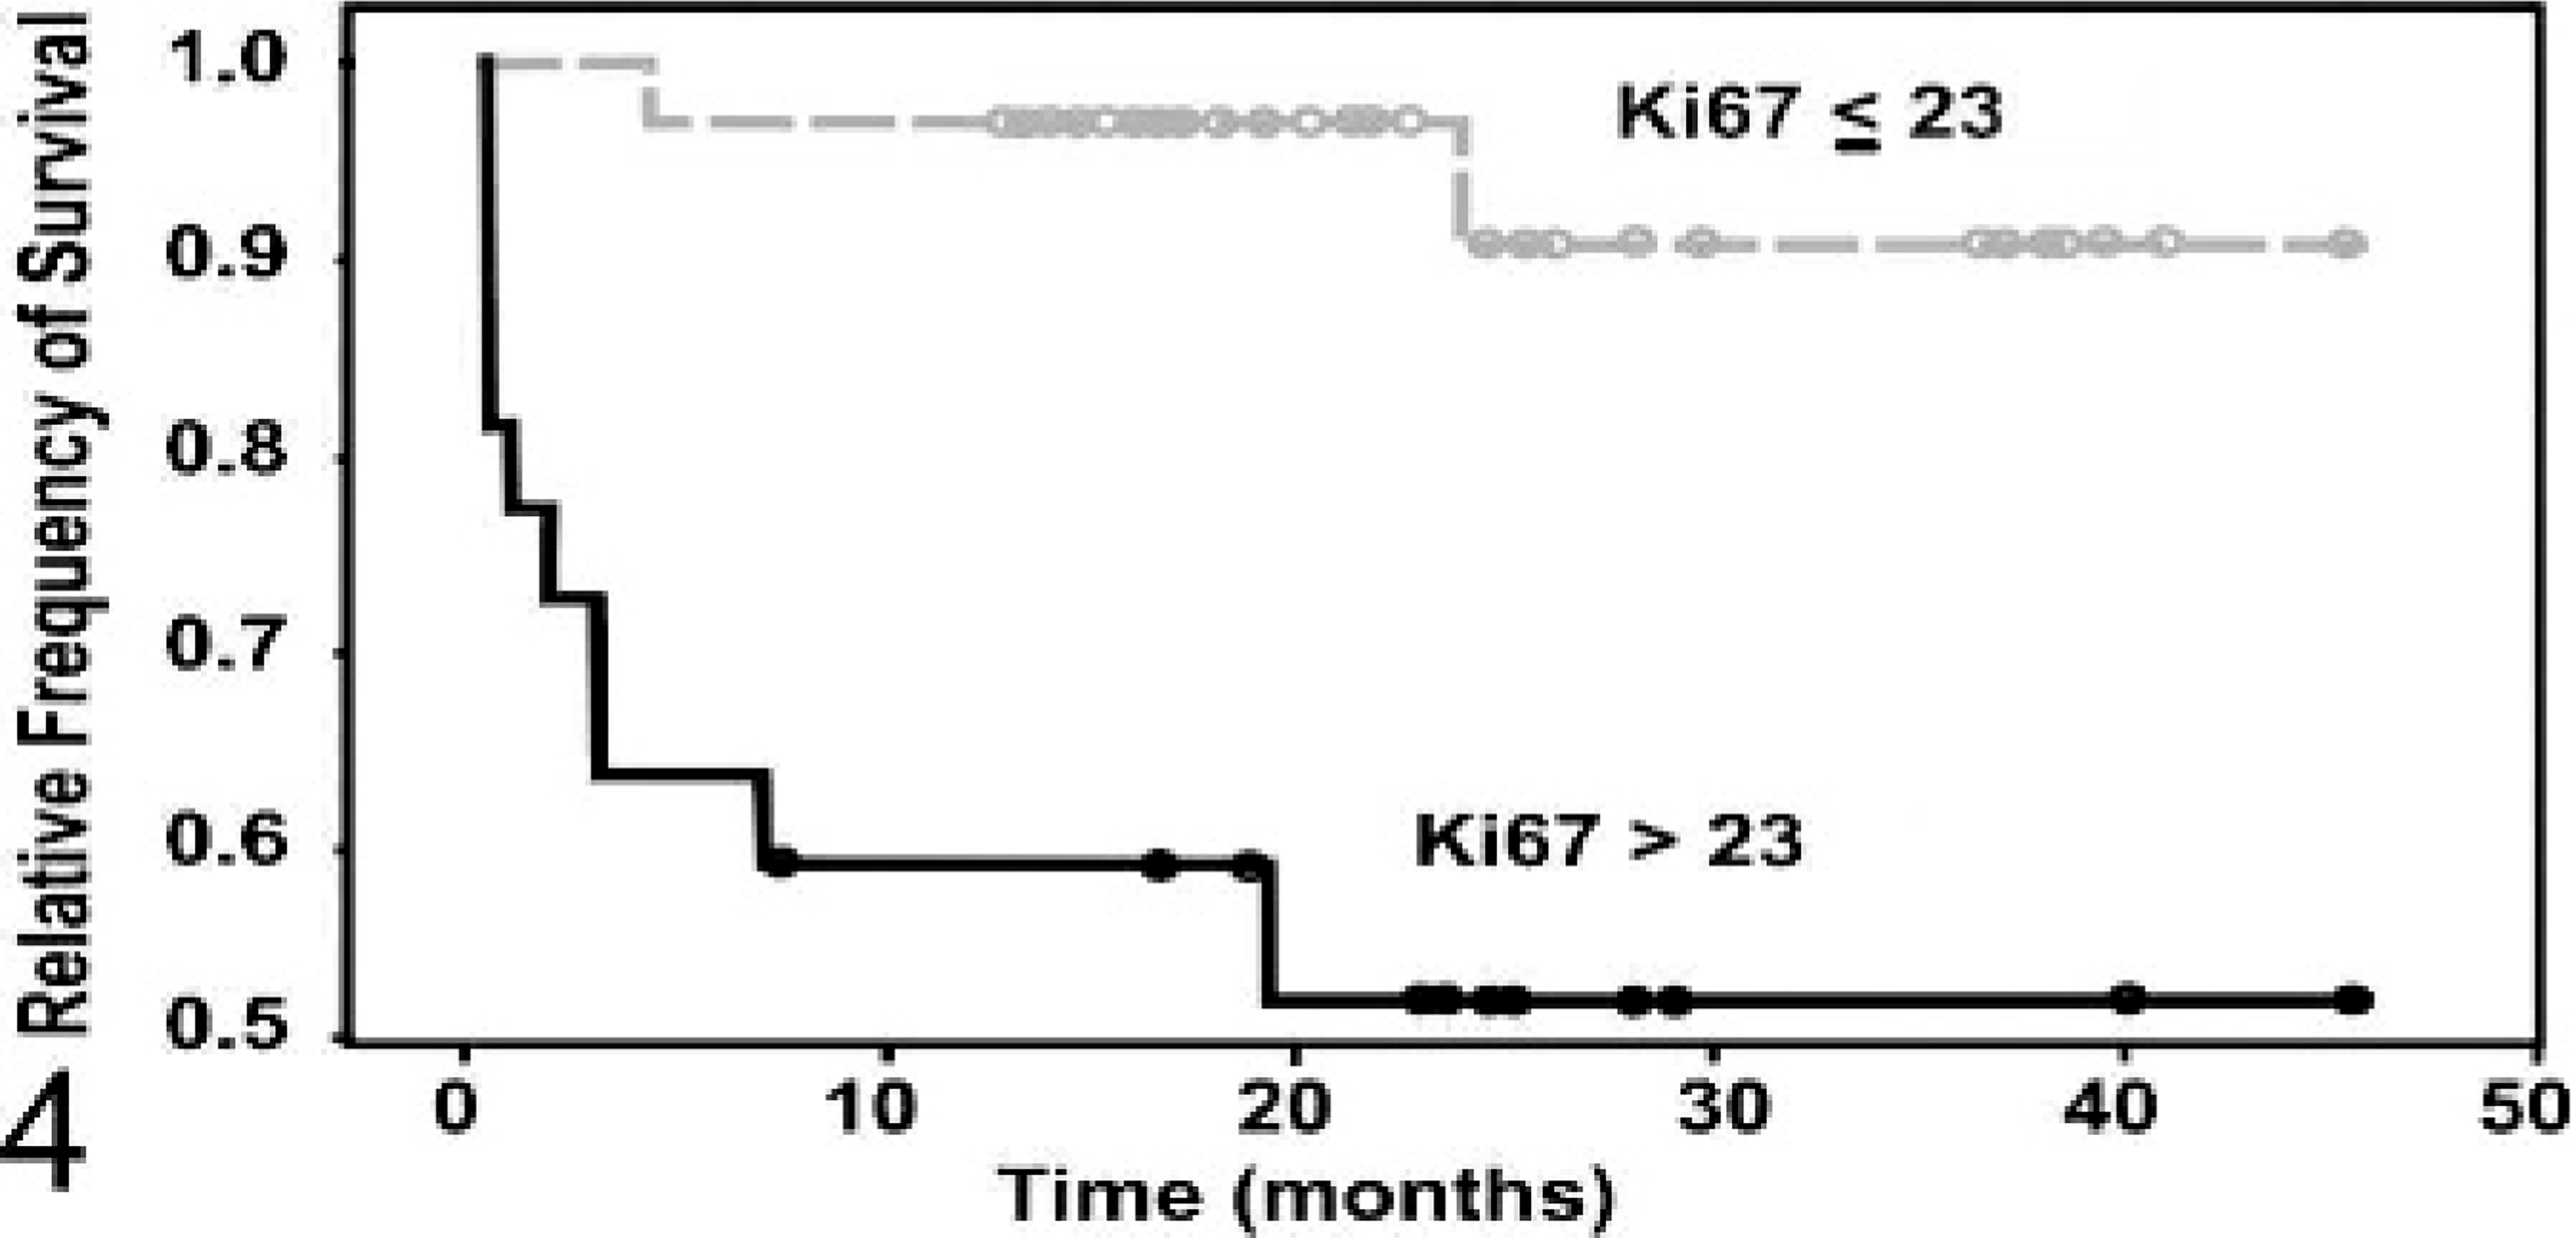
Fig. 4. Kaplan-Meier survival curve evaluating the time until mast cell tumor (MCT)–related mortality of canine MCT patients classified on the basis of Ki67 protein expression. Patients with >23 Ki67-positive cells per grid area (n = 22) had a significantly shorter survival duration compared with those with ≤ 23 Ki67 positive cells (n = 34) (P = .0171).
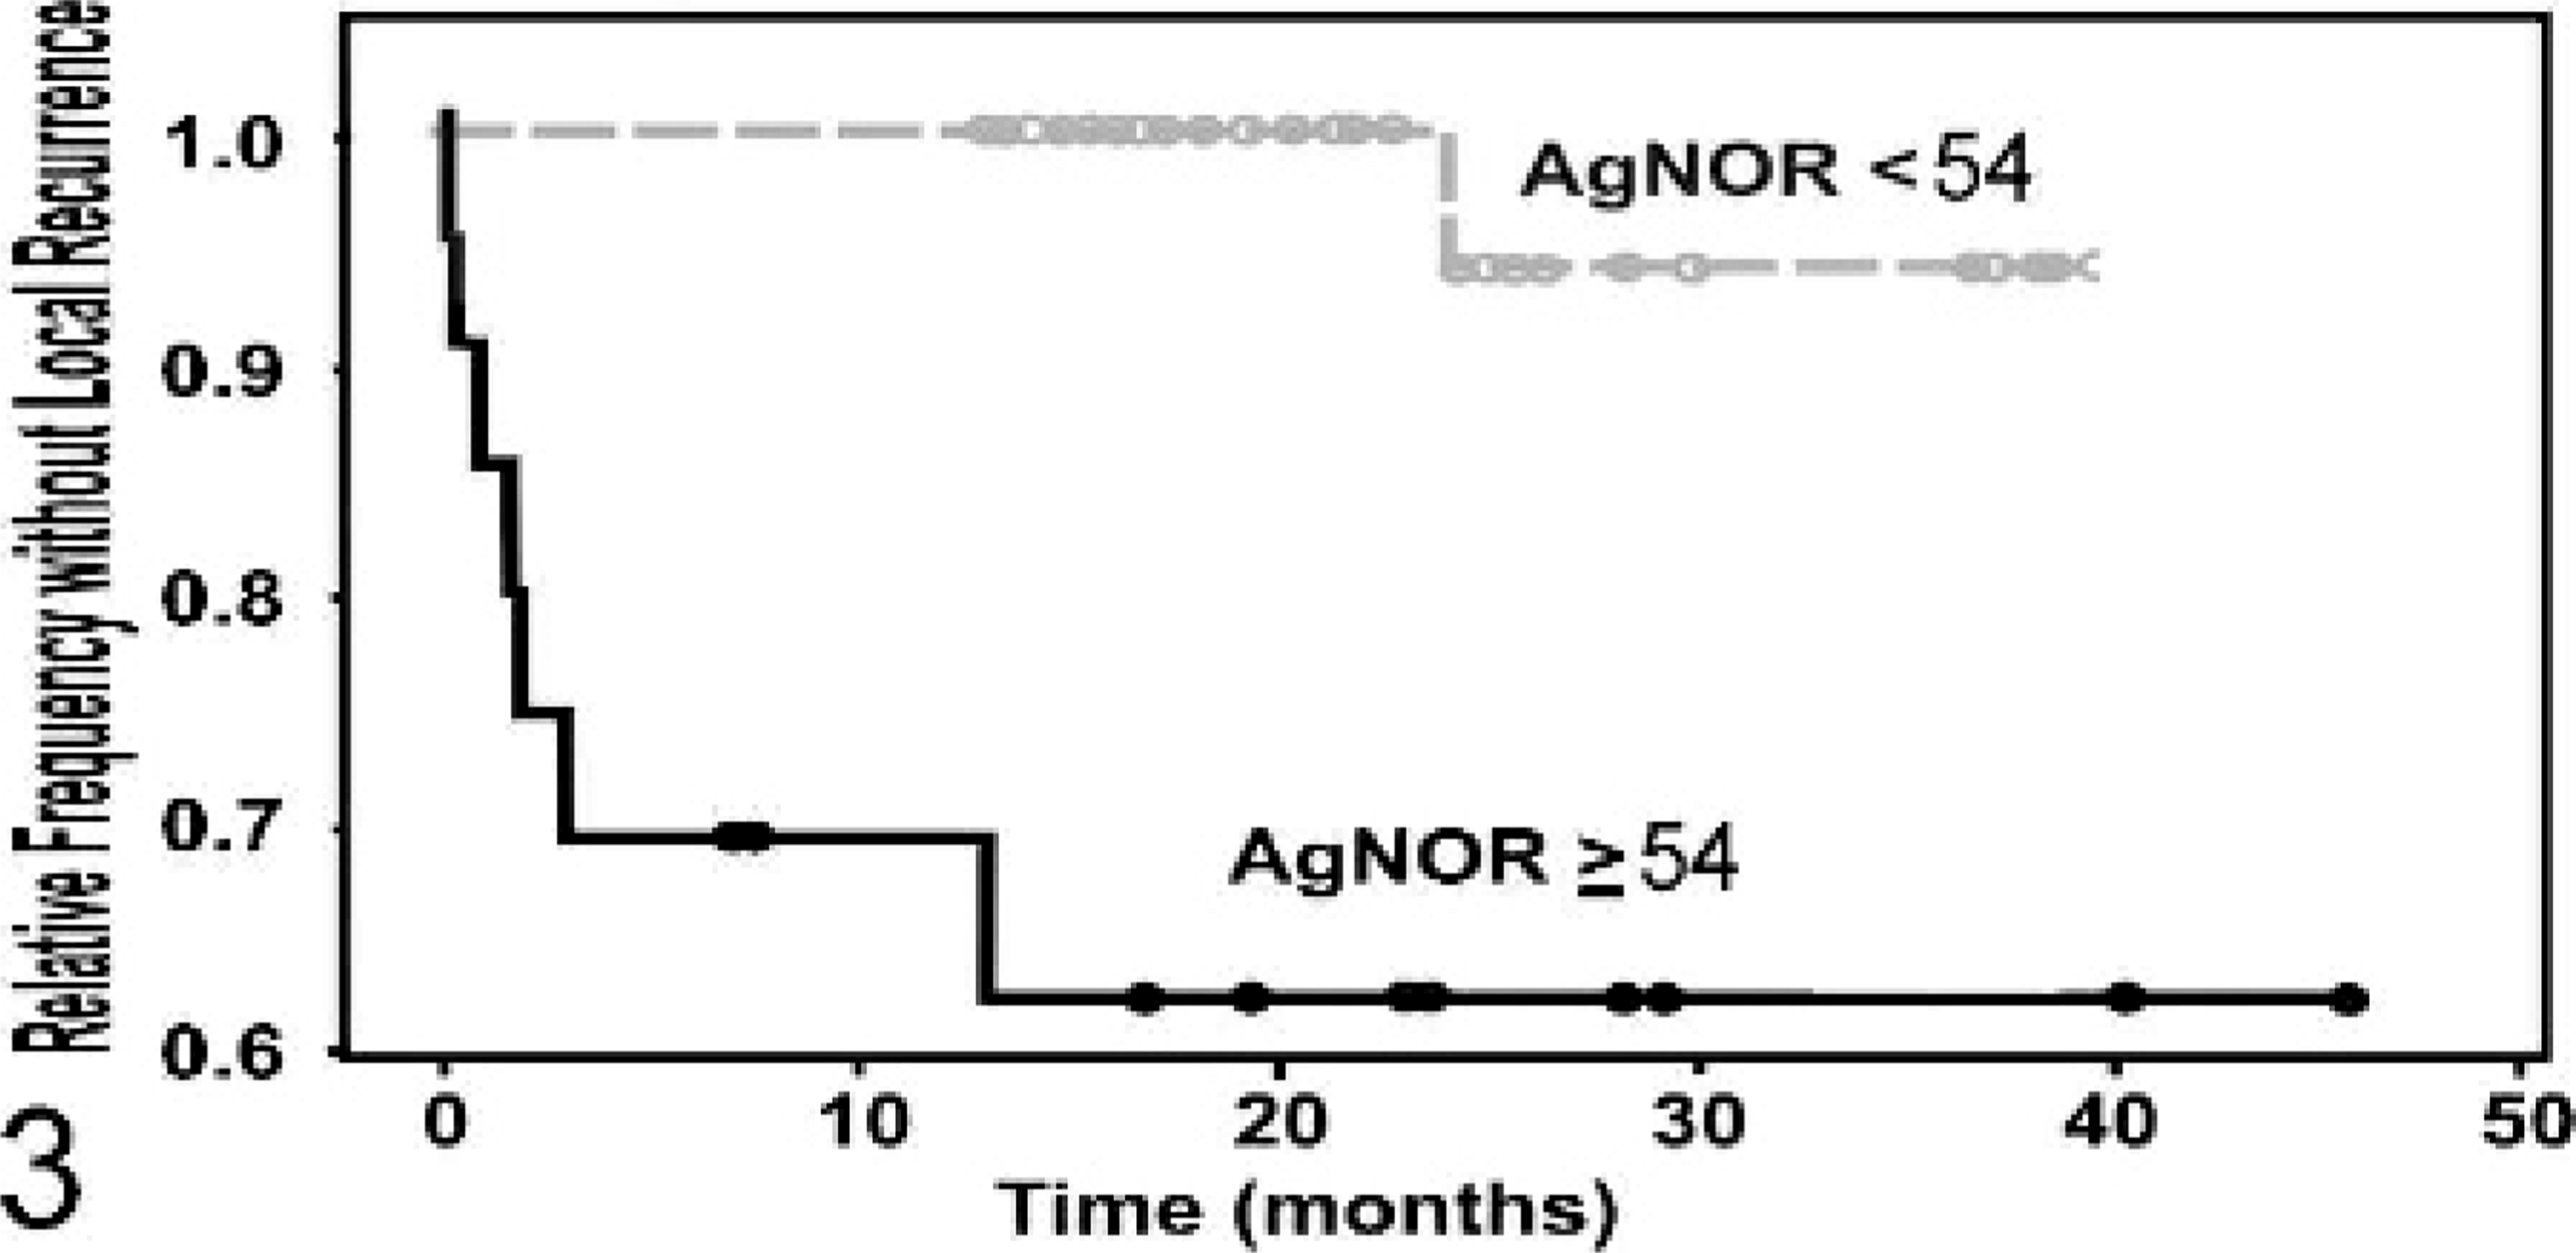
Kaplan-Meier survival curve evaluating the time until local recurrence of canine mast cell tumor patients classified on the basis of Ag67 values. Patients with Ag67 counts ≥54 (n = 22) had a significantly shorter time to local recurrence compared with those with <54 (n = 34) (P = .0109).
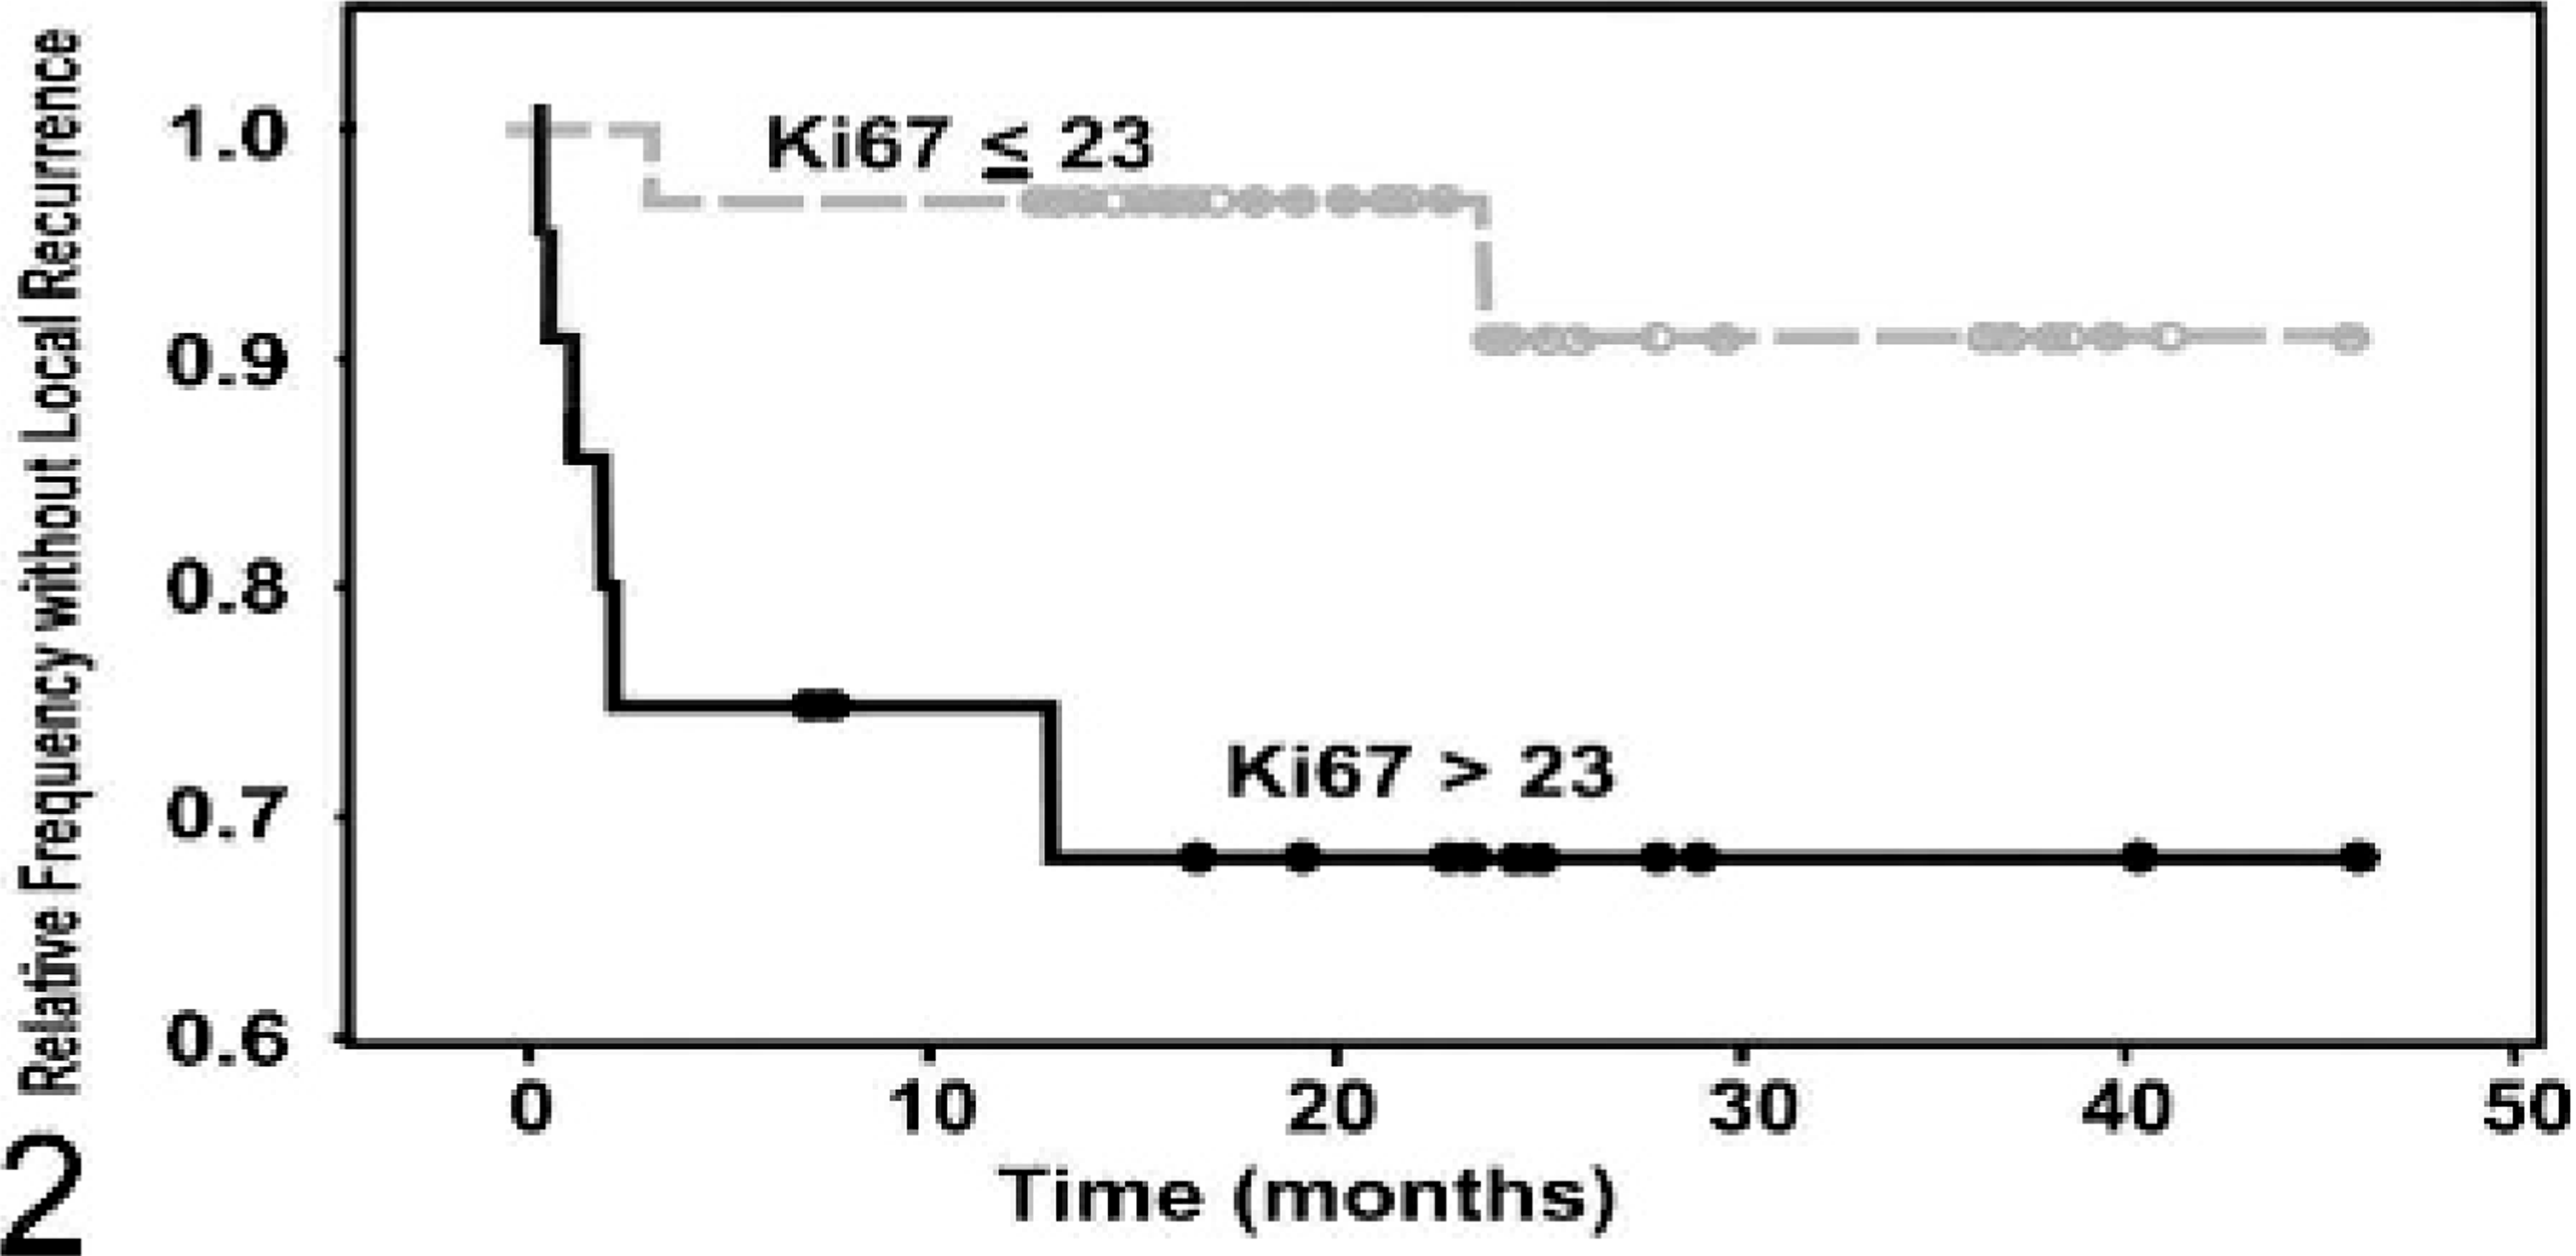
Kaplan-Meier survival curve evaluating the time until local recurrence of canine mast cell tumor patients classified on the basis of Ki67 protein expression. Patients with >23 Ki67-positive cells per grid area (n = 22) had a significantly shorter time to local recurrence compared with those ≤23 Ki67 positive cells (n = 34) (P = .0074).
Tumors were histologically graded according to the Patnaik histologic grading system.40 All histologic grade I MCTs had a Ki67 index ≤ 23 and an Ag67 index < 54, and all grade III MCTs had a Ki67 index > 23 and an Ag67 index ≥ 54. Twenty-six grade II MCTs had a Ki67 index ≤ 23, and 15 had an index > 23. Similarly, 26 grade II MCTs had an Ag67 index < 54, and 15 had an index ≥ 54. Two dogs with grade II MCTs with Ki67 indices < 23 died of MCT-related disease (7.7%), while 3 dogs with MCTs with an index > 23 died of MCT-related disease (20%). Four dogs with MCTs with indices > 54 died of MCT-related disease (27%), whereas only 1 dog with grade II MCT with an Ag67 index < 54 died of MCT-related disease (3.8%) at 24 months, which, based on log-rank statistical analysis, was statistically significant (P = .031).
In order to determine the associations between ITD c-KIT mutations and aberrant KIT protein localization, and cellular proliferation in canine MCTs, each MCT included in this study was evaluated for ITD c-KIT mutations using PCR and aberrant KIT protein localization using immunohistochemistry. Internal tandem duplication mutations were identified in the juxtamembrane domain of the c-KIT proto-oncogene of 9 of the 56 MCTs included in this study. According to multivariable analysis, canine MCTs with ITD c-KIT mutations had a significantly greater proliferation index (P = .0015), as measured by Ki67 immunostaining, and a significantly greater rate of cell cycle progression (P = .0025), as measured by AgNOR histochemical staining, than MCTs that lacked such mutations. Additionally, we found that increased cytoplasmic KIT protein localization, as compared with perimembrane protein localization that is seen in normal, non-neoplastic mast cells, was also significantly associated with an increased proliferation index (P = .0027), as measured by Ki67 immunostaining, and with an increased rate of cell cycle progression (P = .0038), as measured by AgNOR staining (Tables 3, 4).
Association betweenc-KIT mutations and proliferation markers for canine MCTs.∗
MCT = mast cell tumor; AgNor = argyrophilic nucleolar organizing region.
Association between aberrant KIT protein localization and proliferation markers for canine MCTs.∗
MCTs = mast cell tumors; AgNor = argyrophilic nucleolar organizing region.
Discussion
The results of this study suggest that cellular proliferation plays a significant role in the progression of canine MCTs. We have shown that the rate of cellular proliferation (generation time), as measured by AgNORs, and the proportion of cycling cells (growth fraction), as measured by Ki67, are both significantly associated with the progression of canine MCTs. In light of these results, we recommend that AgNOR and Ki67 indices should be routinely evaluated in canine MCT patients in conjunction with other prognostic markers such as histologic grading, c-KIT mutations, and KIT staining patterns.
The rate of tumor growth is influenced by both the generation time and the growth fraction8,63 (proliferation ∼ 1/generation time × growth fraction).8 Immunohistochemical staining with anti-Ki67 and anti-PCNA antibodies identifies cells at various phases of the cell cycle and, therefore, may be used to determine the proportion, or relative number, of cells that are actively proliferating (i.e., growth fraction and S-phase index); however it does not give any indication as to how fast the cells are progressing through the cell cycle. Conversely, the average number of AgNORs per nucleus is inversely correlated with the generation time but does not indicate what phase of the cell cycle a given cell is in and does not even differentiate between cycling and noncycling cells. Additionally, it is important to emphasize that growth fraction and generation time are largely independent of each other (e.g., large numbers of cells may be stalled for extended periods of time in a cell cycle phase, and just because cells are cycling faster does not mean that there is a greater number of cells cycling, as many cells may stop cycling after a single cycle). Therefore, since AgNOR, PCNA, and Ki67 staining provides mutually exclusive and complementary information, these measures may provide more useful prognostic and biologic information when used in concert as opposed to when they are used independently.8,63
In order to utilize proliferation indices in a routine, diagnostic setting, one needs distinct cut-off values to differentiate between tumors that are likely to have a favorable prognosis and those that are likely to have a poor prognosis. Such distinct cut-off values with nonoverlapping or minimally overlapping 95% CIs could only be defined for the Ki67 index, which had a cut-off value of 23 immunopositive cells/grid area, and the Ag67 index, which had a cut-off value of 54. On the basis of these cut-offs, Ki67 was better for identifying MCTs that were associated with a decreased survival duration, whereas Ag67 was a better marker for identifying MCTs with a decreased disease-free interval. Therefore, MCTs should be evaluated for both their Ki67 and Ag67 indices, in light of these cut-off values, in order to best identify patients that are likely to have subsequent MCT-related disease or are likely to succumb to their mast cell disease.
Although ITD c-KIT mutations and aberrant KIT protein localization have been well-characterized in canine cutaneous MCTs,13,21,27,28,45,66,71 little is known about downstream consequences of these mutations on the cellular level. All of the ITD c-KIT mutations that have been characterized to date have been shown to produce a constitutively activated KIT protein in the absence of ligands27,28,45 and have also been associated with downstream extracellular signal-regulated kinase phosphorylation.45 Previous studies by our laboratory have shown that both ITD c-KIT mutations and aberrant KIT protein localization in canine MCTs are associated with a worse prognosis, as compared with MCTs that lack such mutations or have normal perimembrane protein localization, respectively.65,66 The results of this study suggest that a downstream consequence of c-KIT mutations and aberrant KIT protein localization in canine MCTs may be an increase in cellular proliferation, by both increasing the rate at which the cells enter the cell cycle and by increasing the rate at which the neoplastic cells progress through the cell cycle. Although these results are extremely intriguing and provide preliminary in vivo data that support the hypothesis that c-KIT mutations and aberrant KIT protein localization are associated with an increase in cellular proliferation in canine cutaneous MCTs, further in vitro studies are needed to support these in vivo results.
In this study, ITD c-KIT mutations were identified in 16% of MCTs evaluated. In previous studies, the incidence of c-KIT mutations has varied dramatically from 3 to 33%.13,48,66,71 As previously discussed, this variation likely represents variations in study populations.66 The highest incidence of c-KIT mutations has been identified in cases of treated-at-referral oncology practices,13 which are likely to consist of a higher proportion of malignant MCTs. In contrast, this study consisted of MCTs submitted to a state diagnostic laboratory, primarily by private practitioners, which likely represent a broader spectrum of mast cell disease.
The results of this study demonstrate the utility of evaluating cellular proliferation, specifically Ki67 immunostaining and AgNOR histochemical staining, in the routine prognostication of canine MCTs. Although the results of this study confirm the results of previous studies that have shown the prognostic significance of cellular proliferation in canine MCTs,1,3,52,53,56 cellular proliferation should not be evaluated as a single prognostic factor for canine MCTs but should be evaluated in tandem with additional prognostic markers such as histologic grade, c-KIT mutations, and aberrant KIT protein localization. To date, no single marker will definitively distinguish between benign and malignant MCTs. Therefore, each prognostic marker should be considered in light of additional markers in order to evaluate the full scope of the disease and to make the best therapeutic determinations for a given patient.