
Abstract
Eleven reference genes (18s ribosomal ribonucleic acid [RNA], 28s ribosomal RNA, ubiquitin, beta-actin, glycerine aldehyde dehydrogenase, ATP-synthase subunit 5B, hydroxymethylbilane synthase, hypoxanthine-phosphoribosyl transferase, ribosomal protein L32, tryptophan 5monooxygenase activation protein (zeta polypeptide), and TATA-Box binding protein) were analyzed in use as references for gene expression profiling experiments using quantitative reverse transcription polymerase chain reaction (qRT-PCR) in canine mammary tumors. The transcription level of the candidates was measured in 22 histologically characterized excised tumor specimens from mammary gland tissue and 22 samples of non-neoplastic mammary tissue samples from the same individuals. Results were used to rank candidate reference genes using the GeNorm tool. It was determined that in samples of canine mammary gland tissue, a combination of hypoxanthine-phosphoribosyl transferase, ATP-synthase subunit 5B, ribosomal protein L32 and ubiquitin yields stable reference gene expression levels, whereas the use of glycerin aldehyde dehydrogenase or ribosomal RNA is unsuitable for normalization of qRT-PCR results in this tissue type.
Canine mammary tumors account for up to 52% of all tumors in the bitch and therefore represent one of the most important types of neoplasia in the dog. 16, 18, 29, 33 However, the pathogenetic mechanisms underlying the formation and the development of these neoplasms are not well understood. As tools to study molecular pathogenesis are becoming more readily available, there is an increasing interest in examining canine mammary tumors at the cellular level. One approach is to determine the transcription rate of certain target proteins putatively involved in the development of the disease using quantitative real-time polymerase chain reaction (qPCR). 4
qRT-PCR has developed into an important tool for transcriptomics analyses in a variety of systems. 23 Although qRT-PCR appears optimal for performing accurate, reproducible, and convenient gene expression profiling experiments, there are a number of problems and pitfalls involved in this method. 5 One of the most prominent of these is the choice of one or more adequate control gene(s) to normalize expression results against. 34 Therefore, there is an ongoing debate of the advantages and the disadvantages of using a certain gene or other ribonucleic acid (RNA) species to normalize qPCR results against. Although several attempts have been made, it is becoming increasingly clear that no one gene can be defined as an omnipotent reference for a wide variety of biologic systems. 13 Consequently, the necessity to choose an optimal set of reference genes for each experimental system has been realized, and tools have emerged to perform this choice in a statistically founded, standardized form. 24, 32 GeNorm (Primer Design, Ltd., Southampton University, Highfield Campus, Southampton Haunts, UK), developed in 2002, is a bioinformatics tool designed to rank candidate reference genes by using a normalization factor calculated on the basis of the geometric mean of the expression level of the candidate reference genes in an array of representative samples. 32 In this study, we used GeNorm to establish a set of reference genes that is suitable to use in qPCR experiments performed on canine mammary tumors.
Materials and Methods
Materials
Twenty-two matched pairs of neoplastic and non-neoplastic specimens from mammary gland tissue were collected from patients undergoing surgical mammary gland resection at the small animal clinic of the free university in Berlin, Germany. Patients were all clinically diagnosed with neoplasia of the mammary gland but were otherwise a mixed group of different ages, breeds, disease severities, and hormonal status. The choice of tissue area used for sample collection was performed based on macroscopical and palpatory inspection. Directly after excision, tissue samples were randomly cut into cubical portions with an edge length of approximately 3 mm. Portions were mixed by vigorous shaking and were subsequently processed by RNA isolation or histopathologic analysis. Tissue specimens were isolated and portioned from the resected mammary gland, as described above, within 120 seconds of surgical excision, and a random half of the sample portions was submerged in 4% formalin solution and stored at room temperature, while the other half was submerged in RNALater (Qiagen, Hilden, Germany) immediately after portioning and stored at -20°C until further processing.
Histologic evaluation
Sample portions in formalin (see above) were embedded in paraffin, cut into slices of 5-μm thickness using a microtome and were mounted on microscope slides. In this process, each sample of tumor tissue was dissected in randomly positioned unbiased tissue sections. Every fourth section in a sample was used (the first taken at random among the first 10 sections), and the rest were selected systematically by taking every fourth section counted from the tissue slices, with further processing for histopathologic evaluation (Cavalieri's principle). After mounting, samples were stained with hematoxylin and eosin and morphologically characterized according to the World Health Organization (WHO) classification scheme for canine and feline mammary tumors. 17 Accordingly, malignant tumors were classified as carcinoma in situ, complex carcinoma, anaplastic carcinoma, tubulopapillary carcinoma, or solid carcinoma.
RNA isolation
Total RNA was isolated from 100 mg of each sample (see above) using a column-based RNA isolation kit (Macherey & Nagel, Dueren, Germany) according to the manufacturer's instructions. Before RNA isolation, samples were homogenized in Lysis buffer using a bead beater (Retsch, Haan, Germany) and were precleaned using phenol-chloroform extraction. After RNA isolation, RNA concentrations were measured in a spectrophotometer (Eppendorf, Hamburg, Germany). Samples with an RNA concentration below 50 ng/μl or with an excitation value at 230 nm greater than the corresponding excitation value at 260 nm (230/260 > 1) were excluded from the analysis. Subsequently, samples were examined for RNA integrity in an Agilent Bioanalyzer 2100 (Agilent, Palo Alto, USA), as previously described. 30 Samples with an RNA integrity number below 5 were excluded from the analysis.
Reverse transcription and qRT-PCR
By using 100 ng of the isolated RNA, reverse transcriptions (RT) were performed using a commercial RT-kit (BioRad, Hercules, USA) that uses a combination of dT- and random primers, according to the manufacturer's instructions. RT reaction products were diluted from 20 μl to 200 μl for further use. The transcription level of all candidate reference genes was quantified in 5 μl diluted cDNA by using qPCR. The qPCR assays were performed by using a commercial SYBR-Green master mix kit (BioRad, Hercules, USA), according to the manufacturer's instructions. The qPCR protocol was the same for all qPCR assays in all samples: after incubation at 95°C for 3 minutes to activate the DNA polymerase, 40 cycles comprising 30 seconds at 95°C and 120 seconds at 58°C each were used to facilitate the PCR reaction. Data acquisition occurred at real time during the annealing/elongation incubation at 58°C. After completion of qPCR, a melt curve was generated by heating the samples from 55°C to 95°C in 0.5°C steps, each of which lasted 10 seconds and during which data acquisition was performed at real time. Results were documented as cycle threshold (threshold set to 100 relative fluorescence units) values of background subtracted qPCR fluorescence kinetics.
Establishment of qRT-PCR assays
To analyze the transcription rate of candidate reference genes in the samples, a qPCR assay was established for each of the genes examined. For this purpose, appropriate mRNA sequences were researched in GenBank, and primer sequences were determined in the coding regions of the target mRNAs with the Primer 3 primer design software using default selection settings (size 18–27 bp; Tm 57–63°C; GC% 20–80%) and a PCR product length of 100 to 200 base pairs. 1, 28 For the determination of the qRT-PCR assay efficiency for each gene examined, 2-step qRT-PCRs were performed in a 6-step, 10-fold dilution series of a pool of RNA samples from canine mammary gland tissue (1 μg to 10 fg RNA augmented to 1 μg total RNA amount with Carrier RNA [Qiagen, Hilden, Germany] where necessary). RT and subsequent qPCR was performed as described above. After amplification, the PCR products generated from the lowest step in the RNA dilution series (10 fg) were isolated using a commercial kit (Qiagen, Hilden, Germany) according to the manufacturers instructions and were commercially examined by cycle sequencing (SeqLab, Goettingen, Germany) to determine PCR specificity. The qRT-PCR assay efficiency was calculated from the CT-values of the 6-step, 10-fold RNA dilution series (see above) as previously described. 14 The qPCR assays with an efficiency under 90% or over 101% were reestablished with a different set of primers. A summary of the genes and corresponding primer sets used in the study is shown in Table 1.
Target gene data.∗
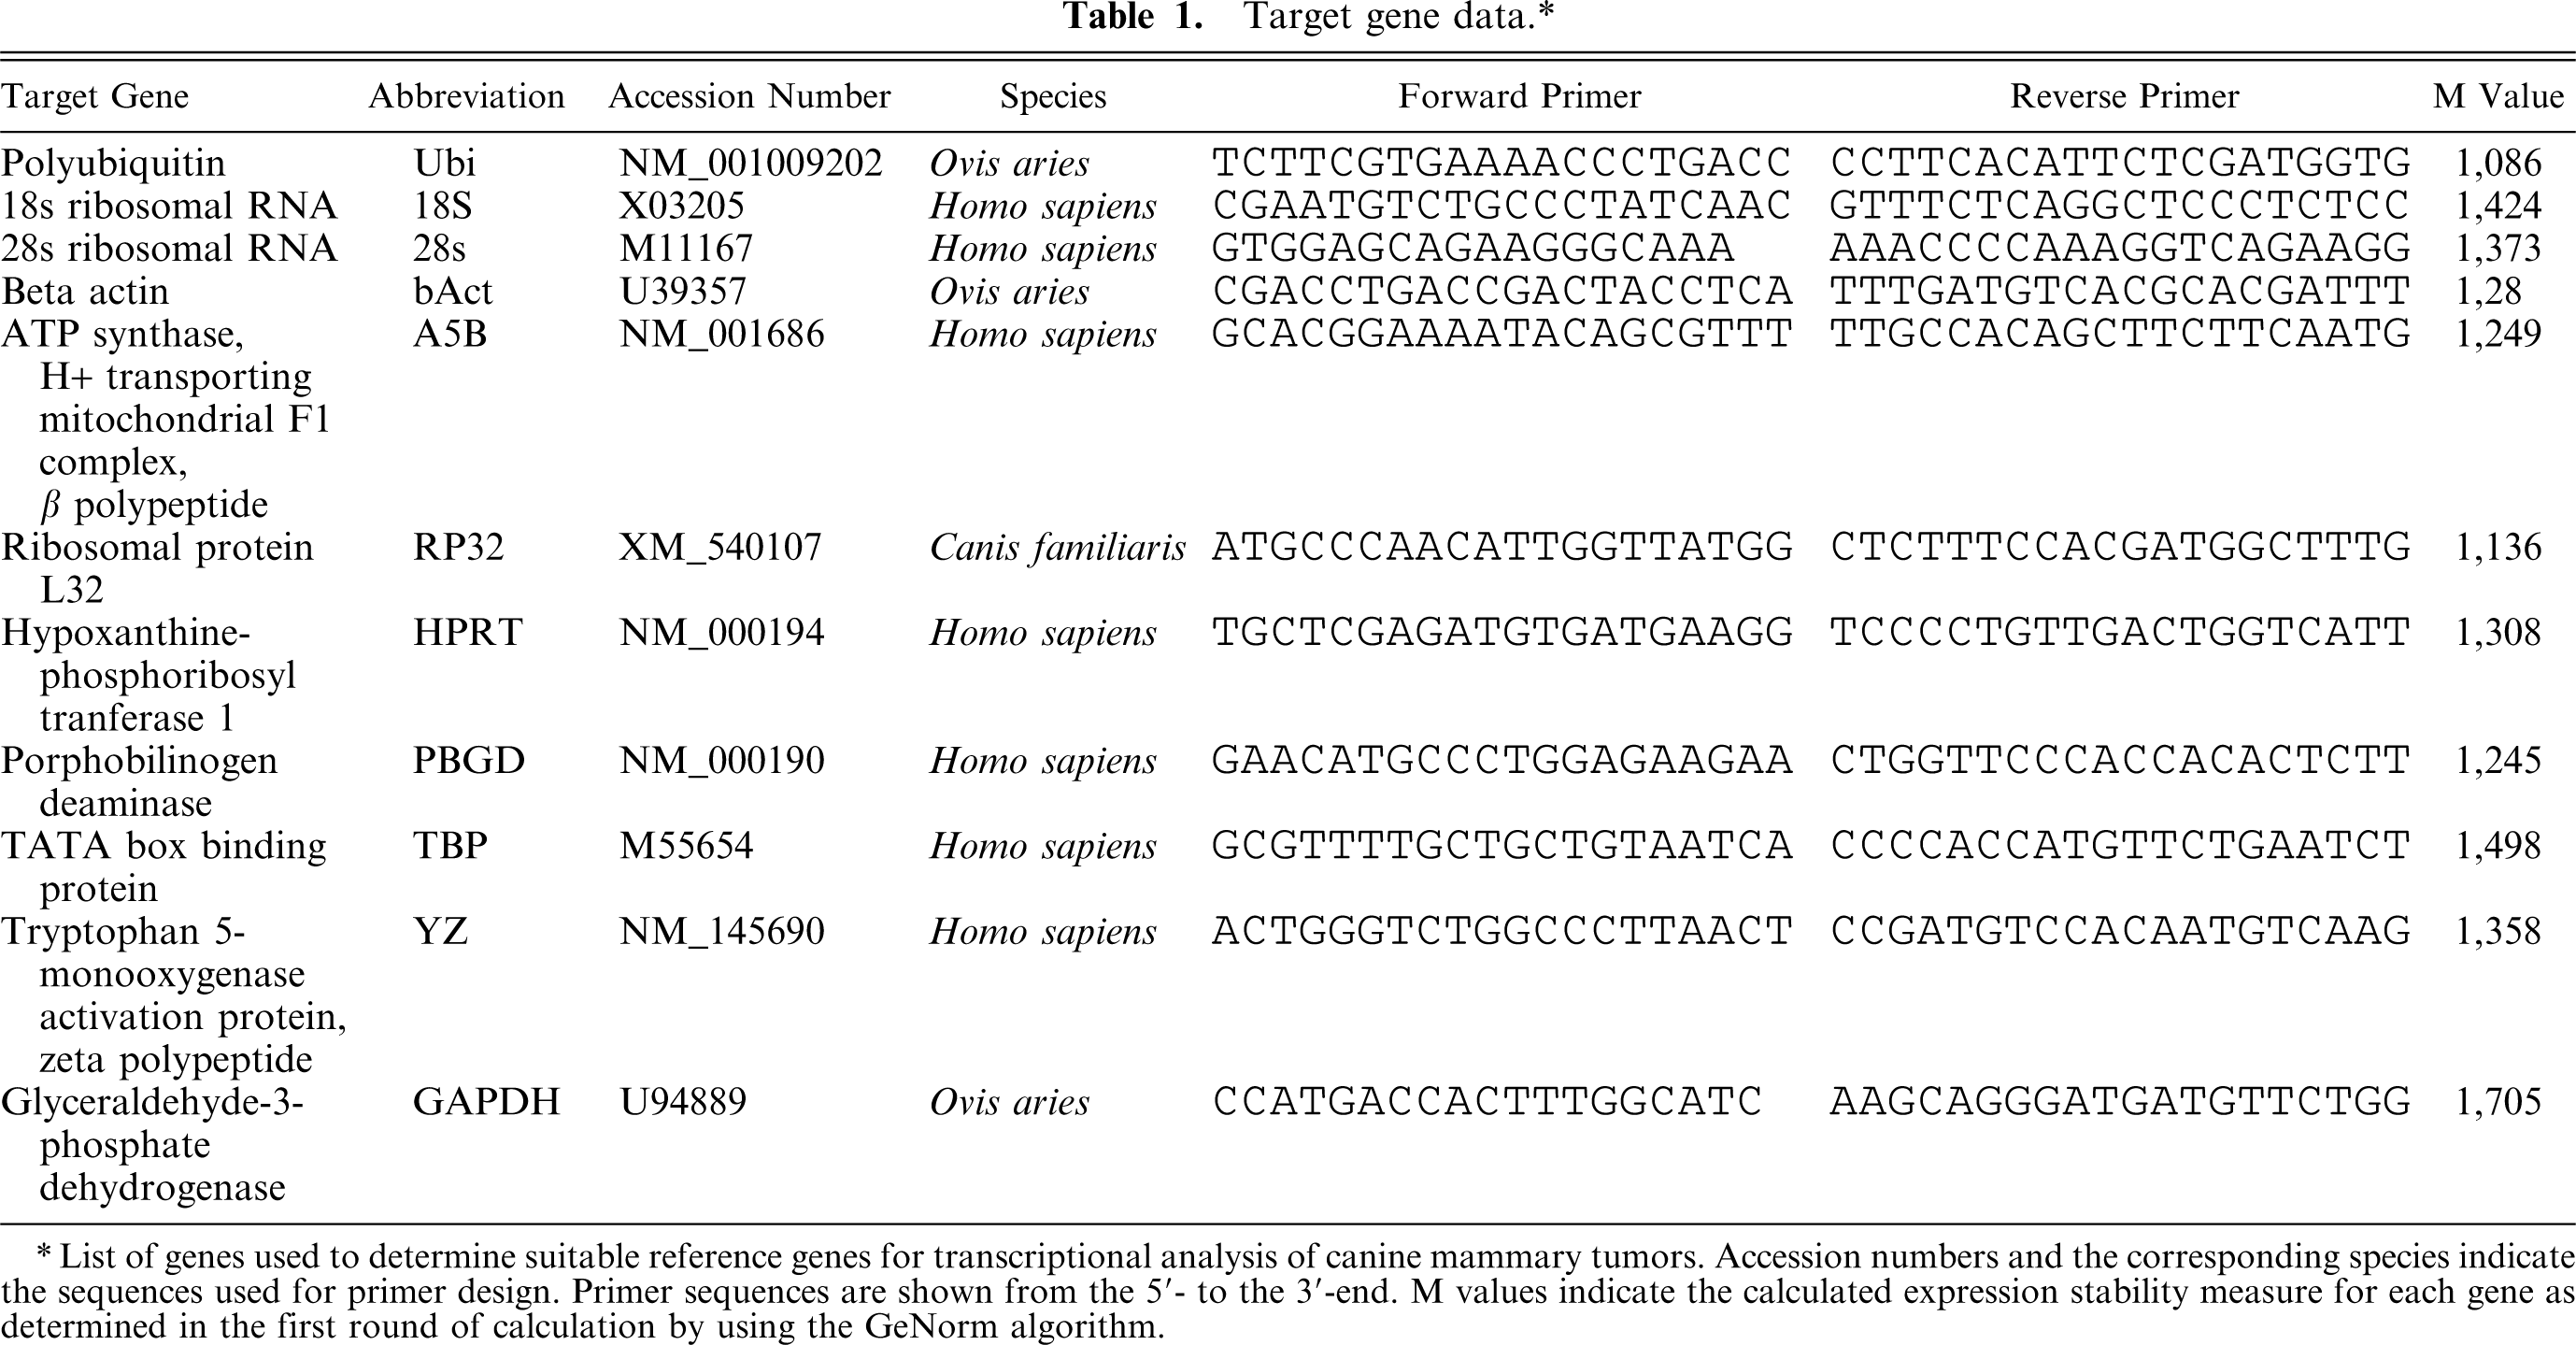
List of genes used to determine suitable reference genes for transcriptional analysis of canine mammary tumors. Accession numbers and the corresponding species indicate the sequences used for primer design. Primer sequences are shown from the 5′- to the 3′-end. M values indicate the calculated expression stability measure for each gene as determined in the first round of calculation by using the GeNorm algorithm.
Analysis of results
By using the CT values generated by qPCR, relative expression levels were calculated using the comparative CT-method as previously described. 14, 32 In this method, the lowest CT value of a particular target gene in all samples examined is set to a comparative expression level of 1, and the expression levels of the same target gene are relatively quantified in all other samples according to the dCT method. 14 Subsequently, the internal control gene-stability measures (M) were calculated by using the GeNorm tool as previously described. 32 In this process, an array was calculated that consists of the log2-transformed expression level ratios of every combination of 2 internal control genes in every sample. Subsequently, the standard deviation of all the elements of the array was calculated for each combination of control genes. Finally, the arithmetic mean of all standard deviations involving a particular control gene was calculated and termed M. In the following steps, the control genes with the highest M value were sequentially removed from the calculation. After each removal, the internal control gene-stability measures (M) were recalculated and the results were used to determine the next candidate gene for omission. Because the internal control gene-stability measures need a pair of control genes to be calculated, omission continued only until 2 control genes were left in the array calculation. At the end of this process, the average M value was plotted to the gene omitted from the calculation process at a particular step. As mentioned above, the final step in this plot shows the 2 control genes with the lowest M-values in the final step of internal control gene-stability measure calculation.
To determine the optimal number of control genes for normalization, the pairwise variation Vn /n+1 was calculated between each set of 2 sequential normalization factors for all samples within the canine mammary tumor tissue panel as previously described. 32 To do this, the normalization factors for the previously ranked combinations (see above) of 2 to 11 reference genes for each sample were calculated as geometric means of the relative expression values of these genes in the different samples. Subsequently, an array was calculated that consists of the log2-transformed normalization factor ratios of every sequential combination of 2 normalization factors in every sample. Finally, the standard deviation of the array data for each normalization factor combination was calculated and termed Vn /n+1. V values were plotted to illustrate the change in expression stability of normalization factors in comparison to the number of control genes examined. Consistent with the recommendation stated previously, the cutoff for V was set to 0.15. 32
Results
Macroscopical and palpatory inspection
The 22 mammary tumors examined in this study had an average diameter of 2 cm (0.5–8 cm) and were mostly (18/22) compact and well delimited from the surrounding tissue. Only a small group (4/22) exhibited diffuse infiltration and were poorly delimited.
Histologic classification of samples
All samples examined were identified as canine mammary gland tissue. Of the 22 samples macroscopically identified as non-neoplastic canine mammary tissue, all 22 samples were confirmed as such in the histologic characterization. However, half of these samples showed small aberrations from the physiologic norm: 4 samples showed signs of cystic dilatation and 7 samples were histopathologically characterized as fibrotic. Of the 22 samples macroscopically identified as neoplastic tissue, 2 were histologically identified as carcinomas in situ (WHO class 1.1), 5 were found to be complex carcinomas (WHO class 1.2), 7 samples were identified as tubulopapillary carcinomas (WHO class 1.3.1), whereas 8 samples proved to be solid carcinomas (WHO class 1.3.2). An overview of histologic diagnoses is presented in Table 2.
Histologic analysis.∗
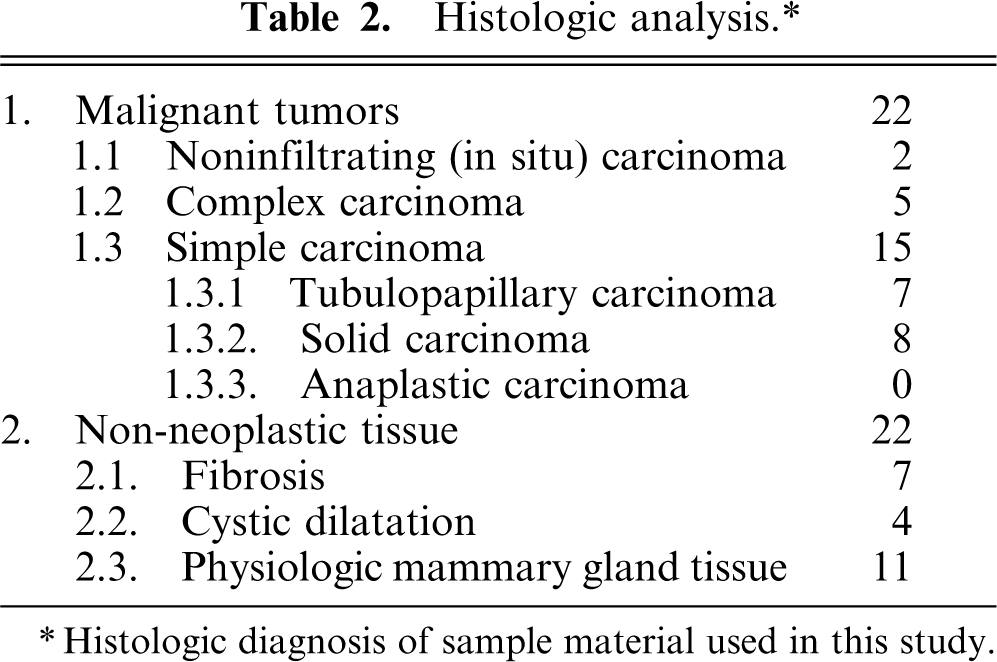
Histologic diagnosis of sample material used in this study.
Establishment of qPCR assays
All qPCR assays yielded specific products of the expected sequence and the qRT-PCR efficiency of all assays was between 90% and 101% (data not shown).
Raw qPCR data
Ct values for the different reference genes were in highly variable quantity ranges, depending on the gene or the RNA species examined. While ribosomal RNA (18s and 28s-rRNA) yielded CT values averaging around 9.5, 1 group of genes (ubiquitin, bAct, GAPDH, RP32, and A5B) clustered around an average CT value of 21.4, and a second group (PBGD, HPRT, YZ, and TBP) showed lower expression levels with CT values at approximately 28.1.
Relative expression values
Relative expression values were calculated as described above and yielded an inhomogeneous picture with no one sample showing the highest level of expression for a majority of target genes. In contrast, while there were some samples that showed highest expression levels for more than 1 candidate reference gene, other samples that showed maximal expression levels for 1 gene had particularly low expression levels for another gene (data not shown).
Expression stability and ranking analysis
Expression stability was measured as M values for all reference genes in the GeNorm tool as described above. The reference genes examined showed expression stability measures (M values) between 1,086 (Ubi) and 1,705 (GAPDH) when all genes were included in the calculation of M. A summary of M values based on the calculation of all pairs of reference genes is presented in Table 1.
During stepwise omission of the reference gene with the highest M-value and subsequent recalculation of average expression stability values for the remaining control genes as described above, HPRT, A5B, RP32, and ubiquitin (Ubi) were determined as most stable among the genes examined, whereas GAPDH and both species of ribosomal RNA were found to have the lowest expression stabilities and were, therefore, the first genes to be omitted from the calculation of M in the following steps (see Fig. 1).
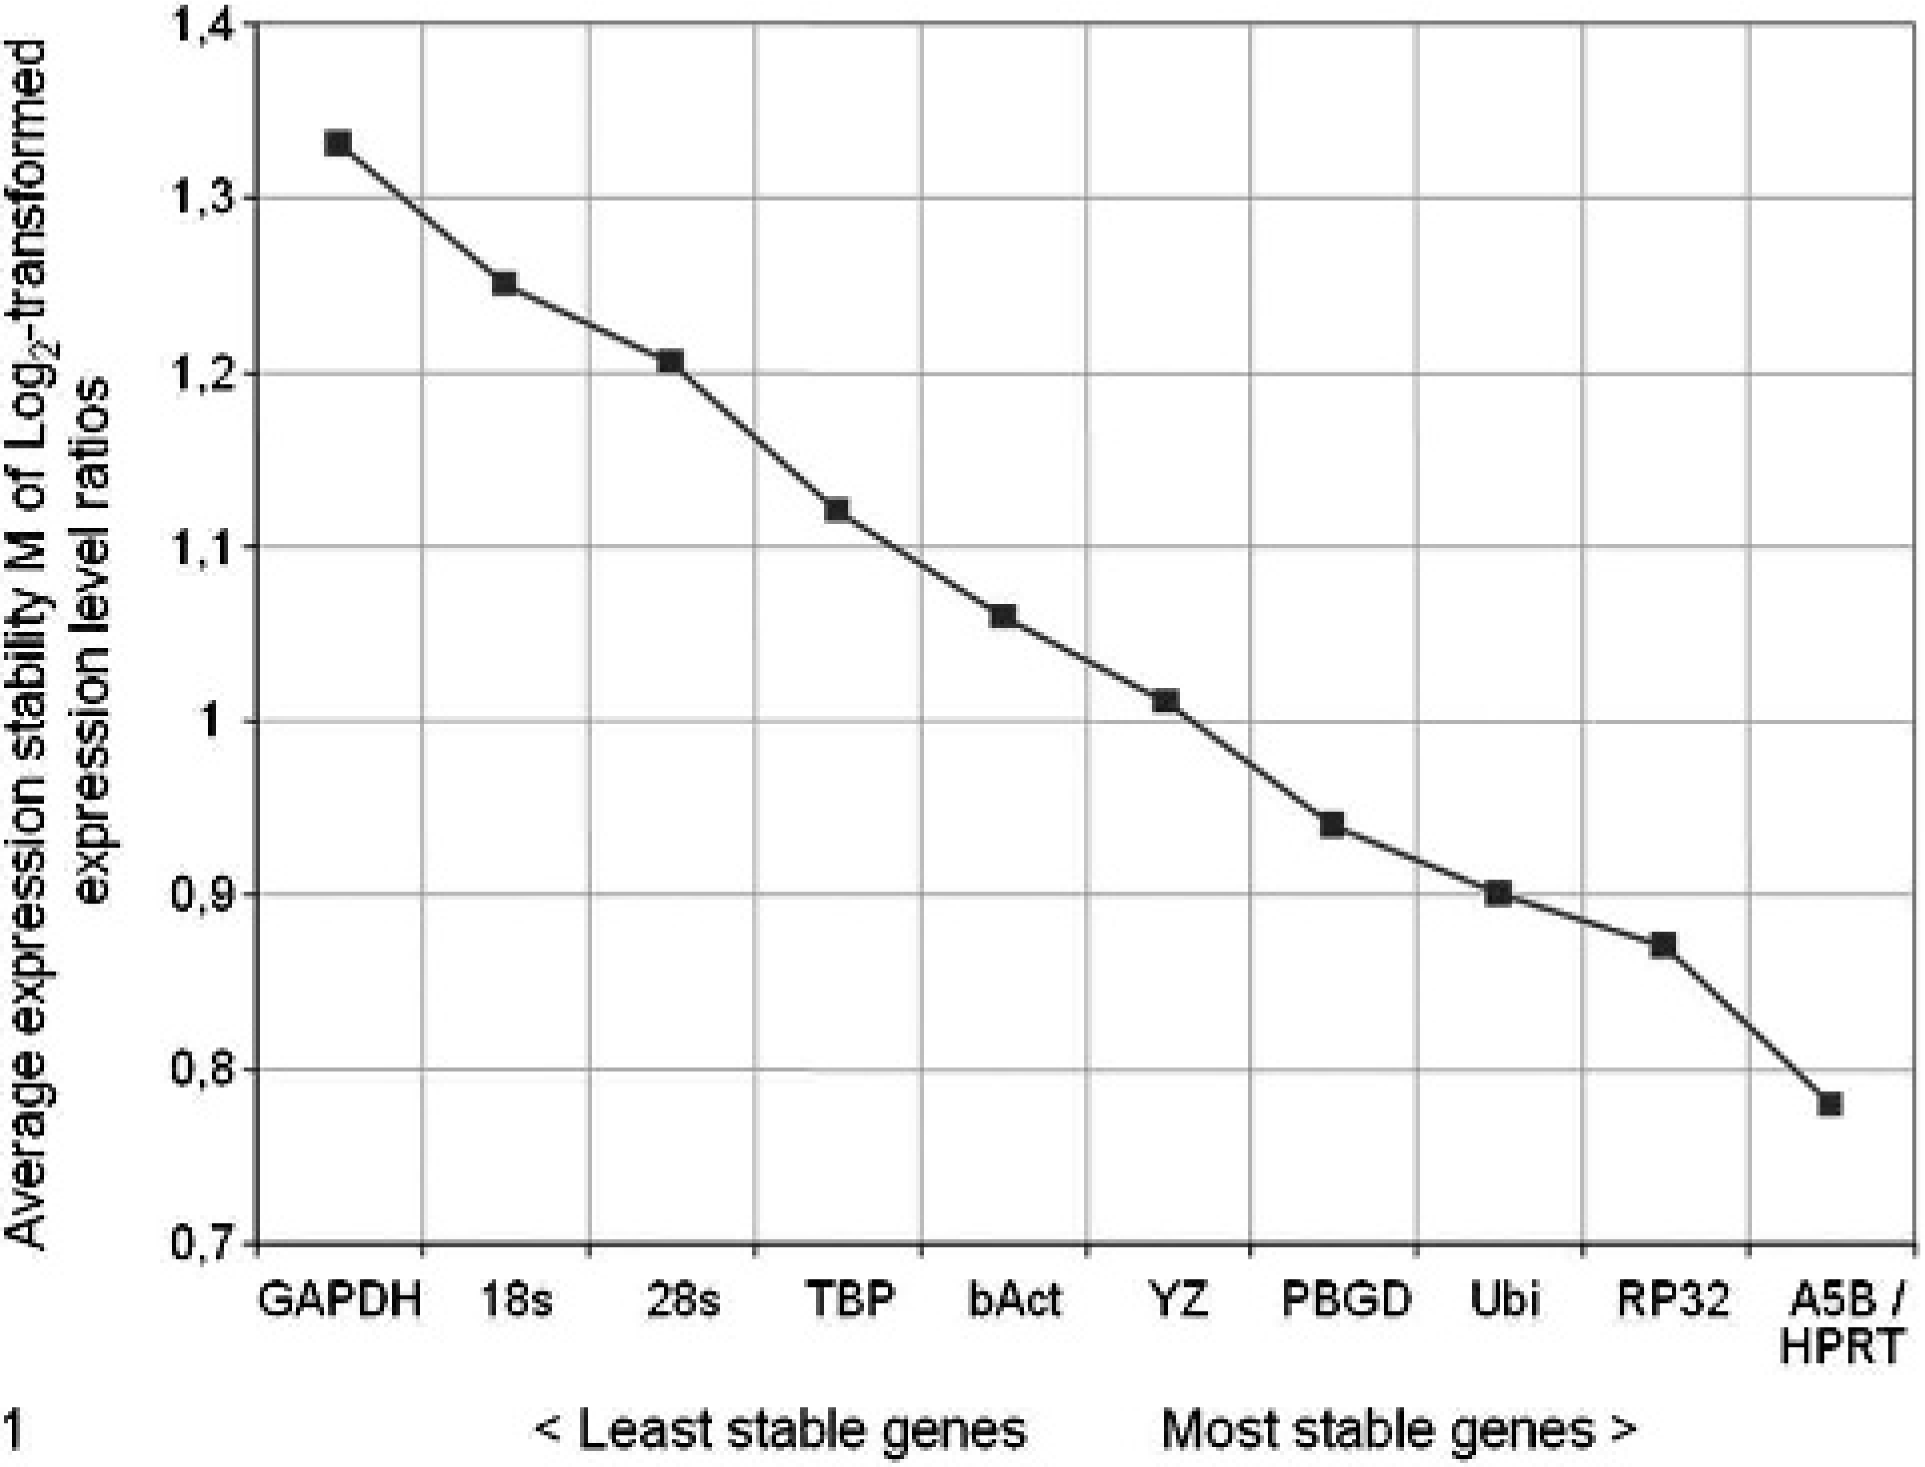
Development of the average internal control gene-stability measures (M) upon sequential exclusion of reference genes with the largest expression level variance. After calculation of M, the reference gene with the highest M value is excluded from the analysis and M is recalculated by using the remaining reference genes. This process is repeated until only 2 reference genes are left, which cannot be further ranked. 32 HPRT and A5B represent the most stable pair of reference genes.
In the calculation of pairwise variations between 2 sequential normalization factors (V values), as described above, it was determined that the variation remains above the specified cutoff value of 0.15 (see above) when less than 7 reference genes were used for the calculation of normalization factors. However, the most significant drop in V (-0.073) can already be observed when 4 instead of 3 reference genes are used for calculation (see Fig. 2).
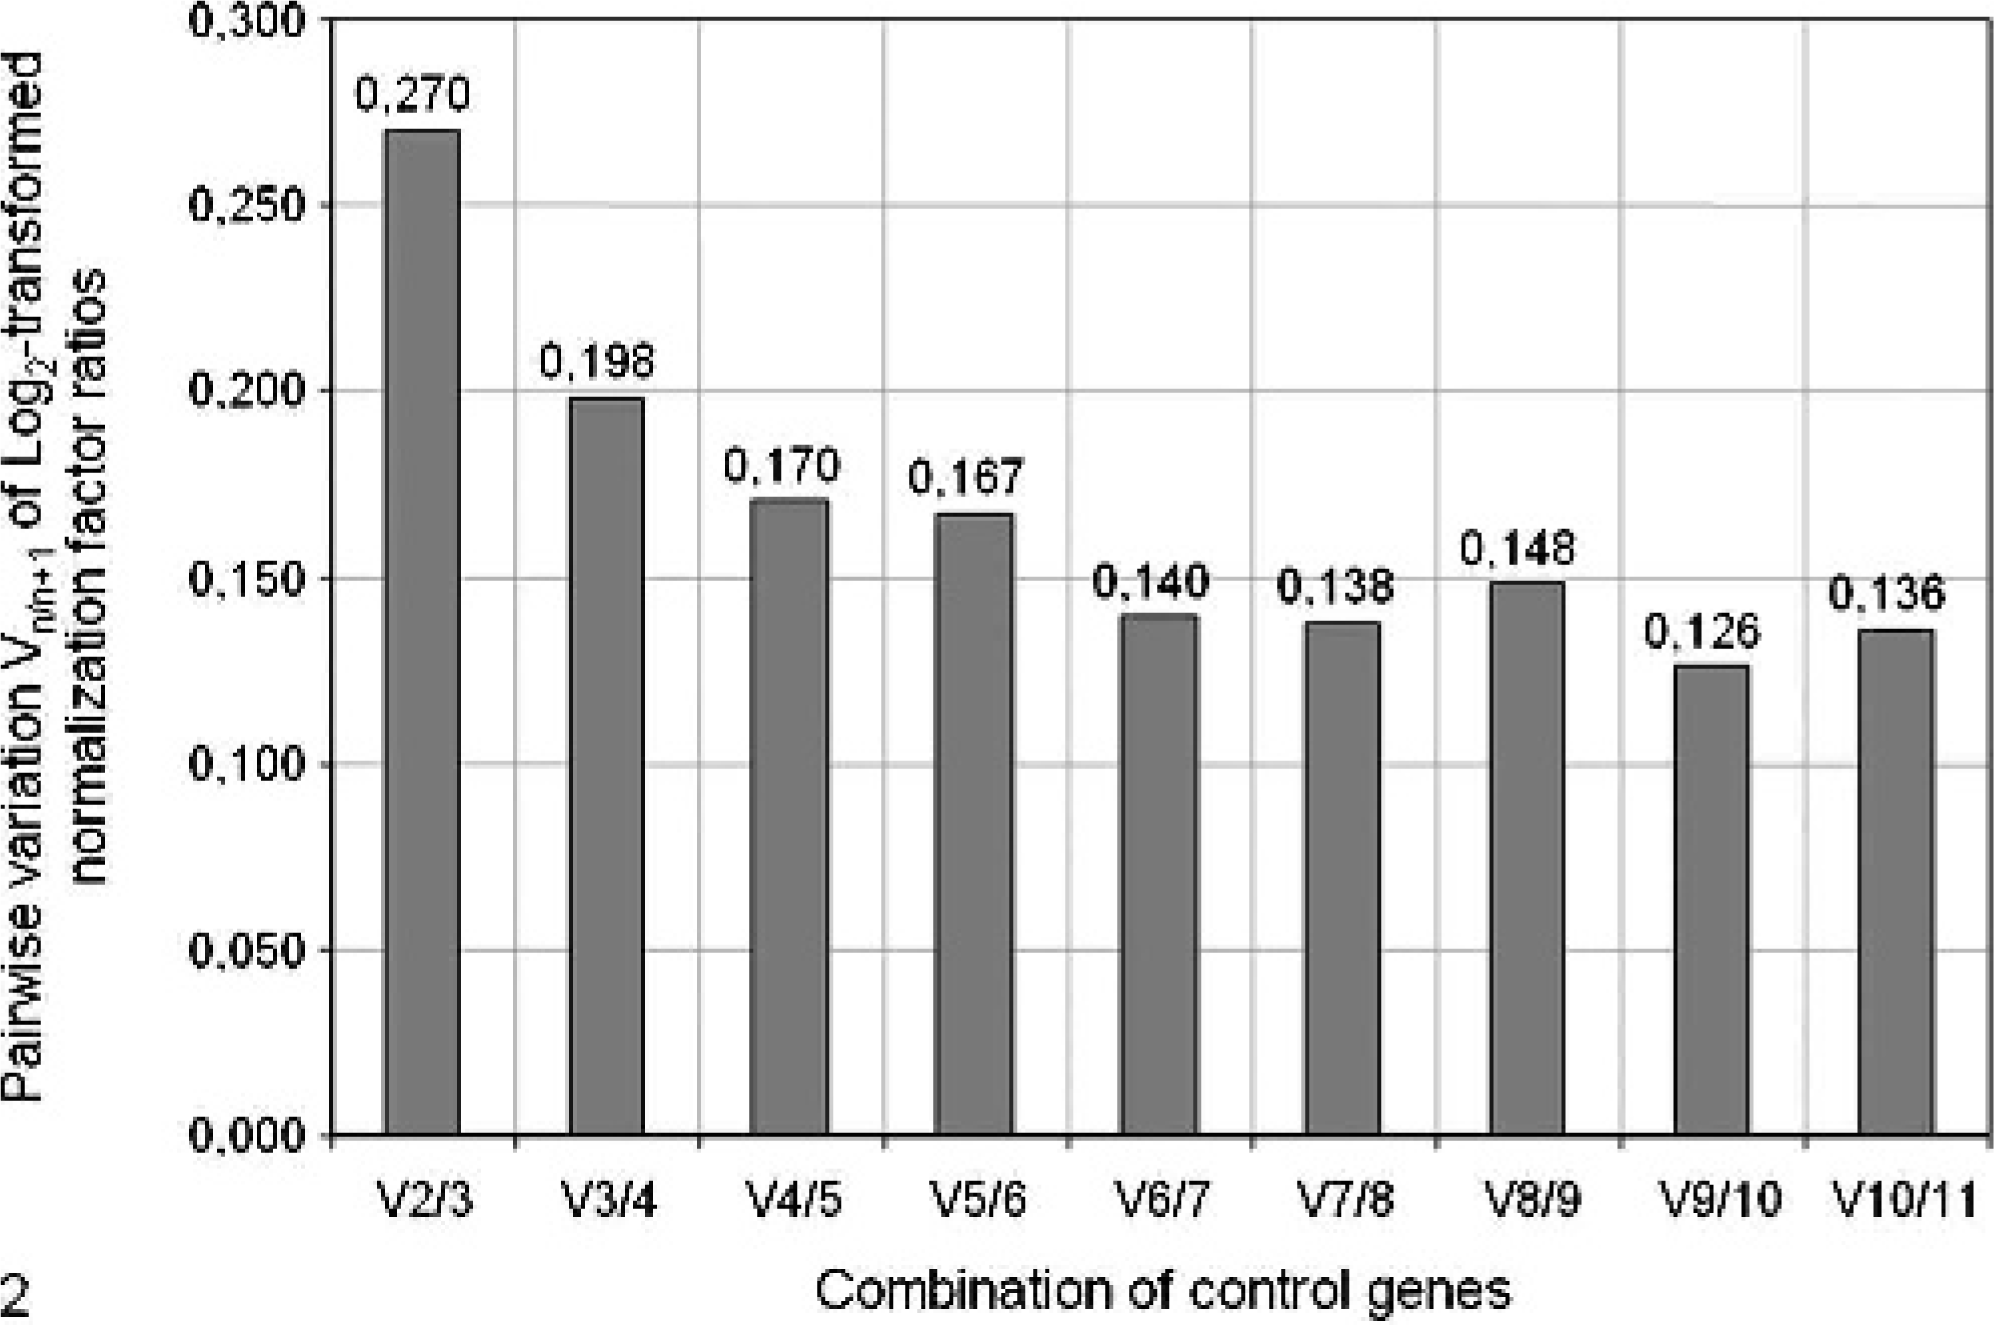
Determination of the optimal number of control genes for normalization by calculation of the pairwise variation (V) of normalization factor ratios for different numbers of control genes. By using the ranking established earlier (see Fig. 1), the contribution of each gene to the variance of normalization factor ratios is calculated to illustrate the sense of adding or removing a particular gene from the final set of reference genes. Ubi induces the greatest decrease in V (-0.073 from V2/3 to V3/4), whereas 7 reference genes are needed to reduce V to <0.15, as recommended previously. 32
Discussion
It is generally accepted that the selection of suitable reference genes is an important prerequisite to a successful gene-expression profiling study design. A failure to select appropriate reference genes can result in false results, particularly when transcription rate variations between sample groups are small. 6, 12, 13, 15, 26, 31 With the appearance of appropriate bioinformatics tools, choosing a set of reference genes has become more standardized, easy to handle, and, consequently, more popular. 11, 19, 25, 27, 34 To determine suitable reference genes for transcription-profiling experiments in clinical samples of canine mammary tumors, we analyzed a series of widely used reference genes to subsequently determine the best set for use in gene-expression profiling experiments in this system.
Because of the variability in patient material and compliance, the use of clinical samples is disadvantageous regarding sample standardization. 7, 10 The use of laser capture microdissection and pressure catapulting is one method to overcome this, at least in part. 20 However, particularly in studies based upon a clinical context, there is often no alternative to the use of excised tissue samples for the determination of mRNA quantities. Therefore, we chose to assay the optimal combination of reference genes in excised tumors from mammary gland tissue taken from patients undergoing surgical mammary gland resection after having been clinically diagnosed with a tumor of the mammary gland.
Upon collecting clinical tumor samples, the decision as to which tissue specimen is chosen for further examination is based on macroscopic and palpatory inspection and is consequently prone to error. Therefore, histologic standardization of the samples used is an important prerequisite for successful generation of reproducible data. 10 In order to take this into account, we examined each of the samples used in the study histologically by using a randomized selection protocol for the sample portions analyzed. In previous studies, it has been described that canine mammary tumors have a tendency to being of variant tissue origin. 9, 16 Although the samples used in this study tended to be simple carcinomas, it became clear that finding suitable reference genes for study designs utilizing tissue samples excised from canine mammary tumors would have to accommodate the occurrence of variable forms of neoplasia. Therefore, we incorporated different tumor forms, predominantly solid carcinomas and complex carcinomas, in our study and used a total of 22 tumor samples and 22 matched non-neoplastic samples to ensure a wide and representative database. Although a considerable portion of the non-neoplastic tissue samples showed histologic aberrations from the physiologic norm, none of these were consistent with signs of preneoplasia or neoplasia. Furthermore, although inflammatory mammary carcinoma has not yet been described in dogs, care was taken to ensure that none of the control samples fulfilled the criteria of this condition as described in humans and cats. 2, 22
Another risk involved when different portions of the same sample are examined transcriptionally and histopathologically is bias during the allocation of sample portions to the different examination techniques. To overcome this, we decided to use a randomized sample portioning approach by dicing the compact pieces of tissue to portions with an edge length of approximately 2 mm, to mix vigorously, and to halve the resulting random mix. The size chosen ensures that, on the one hand, histopathologic scrutiny is not compromised because of a loss of tissue context, whereas, on the other hand, the random mixing needed to be able to correlate qRT-PCR and histopathologic results is ensured.
Specific, sensitive, and efficient qRT-PCR assays for all the genes involved in the determination of reference genes are an important prerequisite for data validity. Therefore, the qRT-PCR assays used were validated as described in methods before use in this study. Because the assays were to be used in different species for other studies and because some of the appropriate canine sequences were not available, primer design in most of the qRT-PCRs focused on other species than Canis familiaris (see Table 1). As a result, it is likely that the performance of some primer pairs would have improved if they had been selected from canine sequences. However, the determination of qRT-PCR assay sensitivity, specificity, and efficiency was performed by using canine mammary gland tissue samples only and is, therefore, applicable to this study. The determined efficiencies (90–101%) ensure that the data generated by using these assays are of sufficient accuracy.
For the determination of an optimal set of reference genes for transcriptional analyses in canine mammary gland tissue samples, we chose to use an established and standardized tool, GeNorm, which was specifically designed and extensively validated for this purpose and has been used successfully in a number of other studies. 3, 8, 21, 25, 34 In the GeNorm algorithm, candidate reference genes are interdependently characterized and ranked concerning expression stability, allowing the determination of the combination of most stable reference genes. Subsequently, the question of how many control genes it is sensible to examine is addressed by using statistical methods. 32
In the first step of calculations in the GeNorm algorithm, raw CT values as generated during quantitative PCR are transformed to comparative CT values. This step ensures that all further calculations are performed on the biologically accurate basis of relative expression levels as opposed to the technical basis of raw CT values.
In the next step (calculation of internal control gene-stability measures [M]), the expression stability of each candidate reference gene is calculated in dependence of the other reference genes involved in the study. M represents a quantitative measure for the expression level variation of sets of control genes and is used to characterize the stabilizing or the destabilizing contribution of a particular reference gene to the variation in expression stability of all reference genes examined, with a greater M value indicating a greater contribution to total expression level variance and an M value of 0 indicating identical expression level ratios.
The following step (sequential exclusion of most instable genes and recalculation of M for the remaining control genes) is a fixed instruction to examine all sensible combinations of control genes in their expression stability characteristics. The sequential exclusion of most instable genes as described is an effective optimization tool used to determine which combination of reference genes is best used among the total list of reference genes examined. In this step, it is important to note that a recalculation of M takes place after each omission of most instable reference gene and that the M values for each remaining reference gene change in every step. This is because of the previously mentioned fact that the calculation of M for each gene is in dependence of all other genes involved in the assay at the corresponding analysis step. Because of the same fact, the sequential omission of reference genes in the GeNorm tool does not continue until only 1 maximally stable gene is left in the analysis but ends when 2 reference genes are left. Theoretically, it would be possible to calculate an expression stability measure for each gene independently of the other genes in the analysis as variance of the relative expression levels of the 1 particular gene in all samples. However, this approach would not take into account the fact that adequate normalization will have to rely on more than 1 reference gene in the overwhelming majority of experimental settings. 32 Therefore, the more complex approach taken in the GeNorm tool is superior to the one described above, because it yields a more secure prediction for a sensible, comprehensive set of reference genes to use in subsequent experimental analyses in the same system.
After calculation of the internal control gene-stability measures (M) for all sensible combinations of reference genes, the GeNorm algorithm determines the standard deviation of the array data for each normalization factor combination (Vn /n+1), where normalization factors are the geometric mean of the relative expression levels of all reference genes examined in a particular calculation step in each sample. The aim of this calculation step is to determine how the addition of a further control gene influences the overall variation in normalization factors for a particular set of reference genes. Therefore, calculation starts with the combination of the 2 most stable reference genes and first determines the change in the normalization factor variance when a third, slightly less stable gene is added to the calculation. In the following steps, less and less stable genes are added to the calculation of normalization factors, and the overall variance is determined for each new gene added. The aim of this calculation is to achieve an overall variation of less than 0.15 with as few genes as possible. 32 In this study, 7 reference genes (HPRT, A5B, RP32, Ubi, PBGD, YZ, and bAct) are needed to achieve a log2-transformed normalization factor ratio variance of less than 0.15 (0.140). However, a further aspect that must be taken into account is the decrease in variance of normalization factors that is achieved when a further reference is added to the calculation. From this perspective, it is noteworthy that the addition of the fourth reference gene (ubiquitin) induces the greatest decrease in normalization factor variance (-0.073). In conclusion, taking into account that the number of control genes analyzed and the variance of normalization factors is always a trade-off, we conclude that the use of HPRT, A5B, RP32, and ubiquitin to normalize expression levels in tissue specimens of canine mammary tumors is the best compromise between accuracy and expenditure.
In summary, it can be said that canine mammary tumors represent a relevant and intriguing system for gene-expression profiling studies. However, the histologic complexity of many canine mammary tumors presents a pitfall for successful normalization of transcription profiling results that needs to be addressed by choosing the set of reference genes carefully. We have presented data that determined HPRT, A5B, RP32, and ubiquitin to be a suitable set of reference genes for this experimental system.
Footnotes
Acknowledgements
This work was supported by the Margarete Markus Charity and the Akademie fuer Tiergesundheit.