
Abstract
Transcriptional profiling of entire tumors has yielded considerable insight into the molecular mechanisms of heterogeneous cell populations within different types of neoplasms. The data thus acquired can be further refined by microdissection methods that enable the analyses of subpopulations of neoplastic cells. Separation of the various components of a neoplasm (i.e., stromal cells, inflammatory infiltrates, and blood vessels) has been problematic, primarily because of a paucity of tools for accurate microdissection. The advent of laser capture microdissection combined with powerful tools of linear amplification of RNA and high-throughput microarray-based assays have allowed the transcriptional mapping of intricate and highly complex networks within pure populations of neoplastic cells. With this approach, specific “molecular signatures” can be assigned to tumors of distinct or even similar histomorphology, thereby aiding the desired objective of pattern recognition, tumor classification, and prognostication. This review highlights the potential benefits of global gene expression profiling of tumor cells as a complement to conventional histopathologic analyses.
Keywords
Although the virtual explosion in development of new molecular biological tools during the past decade has greatly expanded our understanding of the genetics and pathophysiology of tumorigenesis, histopathology remains the most reliable tool (the “gold standard”) for definitive diagnosis and classification of tumors. Classification of cancers has relied primarily on morphological characteristics of the tumor, including tumor size, lymph node status, histology, and more recently, expression of specific markers associated with clinical course. 26 Traditionally, pathologists build up a relational database correlating histopathology of tumors with available patient data, such as recurrence rates, infiltrative nature, metastatic or nonmetastatic behavior, postsurgical survival, and treatment response. These subjective measurements of cell morphology and behavior are ultimately combined to provide the framework for diagnostic, prognostic, and therapeutic decisions. However, our ability to predict tumor behavior based solely on histopathology remains elusive at best.
In tumors that follow a multistage model of progression, such as cancers of the colon or breast, only a subset of precancerous lesions progress to malignancy. For example, human colorectal cancer (CRC) is characterized by pathologically defined stages, including the formation of preneoplastic aberrant crypt foci (ACF), preinvasive adenomas, and carcinomas. 34, 53, 72 However, a significant percentage of ACF and adenomas do not progress to metastatic tumors. 49, 53, 92 In the case of CRC, TGF-β type II receptor mutations and microsatellite instability are generally associated with a better prognosis, whereas allelic losses of chromosomes 8q and 18q are often considered markers of poor prognosis. 127, 133 Unfortunately, no reliable markers can unequivocally distinguish the malignant potential of such lesions. 72 Therefore, it is of critical importance to develop a robust methodology that can provide the means to stratify the potential risk of precursor lesions. Such an approach can be extended to other forms of cancer. For example, human breast tumors typically progress through a premalignant atypical ductal hyperplasia, followed by preinvasive ductal carcinomas in situ, culminating in invasive ductal carcinoma. 5, 26, 68 Although markers such as the estrogen receptor, human epidermal growth factor receptor 2 (her2/neu), proliferating cell nuclear antigen (PCNA), and vascular endothelial growth factor (VEGF) have provided some utility in predicting the clinical course of the disease, they do not allow sufficient stratification of patients into groups that would benefit from a particular course of therapy. 26 Gene expression profiling with the use of microarray technology has greatly improved our ability to classify tumors by generating unique molecular fingerprints that have delineated tumor subtypes. 29, 54, 95, 97
In this review, we discuss the potential benefits of global gene expression profiling of tumor cells as a complement to conventional histopathologic analyses. It is argued that such a combined approach will further enhance our understanding of the molecular pathogenesis of neoplasia. It should also be emphasized that the same principle or technology can be applied to the study of nonneoplastic diseases, including infectious and autoimmune diseases.
Gene Expression Profiling
Genes under epigenetic and transcriptional regulation produce their various forms of coding and non-coding RNA molecules. All of these RNA molecules, with their differentially regulated synthesis and degradation, form hierarchical systems that function through topologically complex and interactive pathways that ultimately determine organ, tissue, and cell function. An aggregate effect of the complex multitude of molecular aberrations that control gene transcription might ultimately contribute to tumor phenotype. Traditional techniques that focus on a single gene or a limited composite of genes could limit our view of these complex interactions. Several global approaches, such as differential hybridization, subtractive hybridization, differential display, and serial analysis of gene expression, have been developed with a goal toward identifying differentially expressed genes in normal and diseased tissues. 61
Each of these methods suffers from inherent limitations, such as requiring large amounts of RNA and being labor intensive. 61 Since its development in the mid-1990s, microarray technology has gained considerable interest in the scientific field. Microarray technology enables a snapshot of the entire cellular transcriptome on a single microarray chip, furnishing investigators with a global perspective of the complex interactions among thousands of genes simultaneously. 25, 100 Microarray technology conveys a gene expression “fingerprint” that potentially characterizes a specific physiologic or pathologic state of an organ, tissue, or cell, thereby allowing the establishment of new subtypes of previously recognized diseases with prognostic correlations. 13, 17, 62, 95 In fact, the RNA profile obtained from microarrays is a static representation of the biological state of the sample and yields the highest information and throughput of any classification assay. 29 Thus, microarray technology can be a powerful ancillary tool by allowing the identification of gene signature in tumor cells that, in turn, could provide important etiological and diagnostic clues. With this experimental approach, studies that use microarrays and other technologies are now focusing on the dynamic behavior of neoplasia as a consequence of therapeutic intervention. 29, 48
Laser Capture Microdissection
Data output from microarray experiments is a direct reflection of the input RNA, which is dependent on the cellular composition of the particular tumor. Solid tumors generally comprise a heterogeneous mixture of tumor cells, including stromal tissue, inflammatory cells, blood vessels, and necrotic tissue. Therefore, if the goal of the microarray experiment is to analyze genetic changes within pure populations of cancer cells, isolation of RNA from complex tissues (i.e., grossly dissected tumors) might compromise the usefulness of the expression profiles thus generated. Furthermore, expression profiles from whole tumors might vary considerably between samples, a result of differences in the relative proportions of cell types present within each tumor specimen.
The confounding influence of cell heterogeneity can be resolved by applying methods that achieve high-resolution separation of cells on the basis of morphology or fluorescent markers. Techniques such as flow cytometry/cell sorting and the use of affinity-labeled magnetic beads allow separation of subpopulations of cells from a complex mixture of cells. However, these approaches are not necessarily practical for solid tissues. A relatively new technology, laser capture microdissection (LCM), directly addresses the issue of cell heterogeneity because it allows precise identification of cells by light microscopy followed by microdissection and harvesting of pure populations of cells. 15, 30 Microdissection was initially performed by manually scraping with needles an area of interest from a glass slide. Later, this process was mechanized with the use of micromanipulators. 39, 102, 118 These techniques were fraught with errors and were labor intensive. The first laser-assisted microdissection method was published in 1992, 104 after which the technology advanced tremendously. Several different types of LCM systems are available, providing the investigator with the ability to procure pure population of cells for further genetic analyses and global gene expression profiling.
Thus, coupling LCM to microarray technologies imparts to the investigator a sophisticated tool for obtaining genetic information from individual populations of cells. By using these combined approaches, it is now possible to correlate variations in gene expression with specific histologic stages of disease, an approach that could ultimately shed new light on the etiopathogenesis of cancer. 83, 108 Most notably, the advent of LCM allows the rapid, reliable, and accurate procurement of pure populations of cells from specific putative, preneoplastic lesions. These technological advancements thus provide the opportunity to perform molecular genetic analysis at early time points during the tumorigenic process. 15
LCM tissue preparation
Careful tissue preparation is critical to the successful outcome of subsequent molecular-based applications. A robust method that consistently yields high-quality RNA for microarray analysis is to freeze quickly the tissues in a cryoprotectant medium such as optimal cutting temperature. Both RNA and DNA of good quality can be extracted from such specimens for most downstream molecular-based applications. The frozen tissue sections are fixed briefly in 75% ethanol and stained rapidly with a modified hematoxylineosin staining procedure (
The final dehydration steps with ethanol and incubation with xylene are critically important for successful dissection. Samples with residual moisture will be subject to hydrostatic forces that make it difficult to separate the microdissected tissue from the glass slide. Furthermore, fixatives such as formalin extensively cross-link RNA, DNA, and proteins, thereby limiting analysis of nucleic acids.
76
However, DNA from formalin-fixed tissues is amenable to downstream applications such as direct sequence analysis for mutations and loss of heterozygosity studies. Alternatively, newer fixation protocols, such as ethanol fixation or the recently developed HEPES–glutamic acid buffer-mediated organic solvent protection effect (HOPE) fixative, have been developed that allow preservation of tissue morphology and RNA quality.
85
A comprehensive list of standard protocols for tissue preparation and staining of both frozen and formalin-fixed tissues are provided elsewhere (
LCM methodology
After the stained histologic section is visualized under a conventional light microscope, the region of interest is either transferred to a thermoplastic polymer film, with the use of a low-energy infrared laser pulse, or cut with a high-energy ultraviolet laser and catapulted into a tube. Although, these two systems use slightly different technologies for procuring the cells, the end result is the same. In this review, we will describe the thermoplastic film system as an example. With this system, the area of film that absorbs the laser energy expands and adheres to the underlying cells (Fig. 1A). The laser pulse typically lasts several hundred microseconds to 2 milliseconds, and the transient heat generated in the film is rapidly dissipated through the glass slide heat sink, leaving the biomolecules undamaged. 75 When the device coated with the film is lifted off the glass slide, the tissue shears at the edges of its attachment to the polymer, leaving all of the untargeted area still attached to the glass slide (Fig. 1B). The exact morphology of the transferred cells is maintained and held on the transfer film (Fig. 1B). The device with the film is then mated to tubes with appropriate buffers to obtain DNA/RNA or proteins for subsequent experiments. Subsequent molecular analyses are not affected by the microdissection process because LCM typically creates only minimal chemical bonds with the targeted tissue. 118

Microdissection and linear amplification process.
Thus, LCM aids in the analysis of cellular function in complex organs by separation of morphologically or histochemically identifiable subunits that can be subsequently analyzed in array-based experiments. 108 The inception of the Cancer Genome Anatomy Project (CGAP), sponsored by the National Center for Bio-technology Information, has been instrumental in the development and implementation of LCM technology. The CGAP goal is to establish an exhaustive and high-quality database of genes expressed by normal, pre-neoplastic, and neoplastic human tissues. LCM has provided a particularly useful experimental tool for this project because of its fine resolution with respect to cellular dissection. At the CGAP Web site, an exhaustive library of partially sequenced clones has been generated with the use of microdissected normal, pre-neoplastic, and neoplastic tissues. 6, 67, 82, 87, 88, 99, 101, 105, 130 The ability to study global gene expression at the cellular level with LCM has been demonstrated through studies reported in the fields of breast cancer 26, 68 and colon cancer. 77
Linear Amplification of RNA
The ability to study global gene expression at a cellular level with LCM is often compromised by the limited yield of RNA extracted from the low numbers of captured cells. This is especially true in the study of focal preneoplastic lesions. The development of experimental strategies to amplify RNA thus become imperative. Since the publication of the original method, 123 several approaches have been developed to amplify RNA in a linear fashion without creating an inherent bias in transcript levels. 27, 52, 118, 125 These methods are largely based on the T7 RNA polymerase system. Briefly, linear amplification (LA) technology consists of three distinct phases: first strand synthesis, second strand synthesis, and in vitro transcription. During first strand synthesis, mRNA within the total cellular RNA is converted to cDNA with a reverse transcriptase enzyme and a DNA primer that contains an oligo-dT and a T7 promoter sequence (Fig. 1C). Following first strand synthesis (conversion of mRNA to cDNA), the resultant single-stranded cDNA is converted to double-stranded cDNA with the use of DNA polymerase and a second exogenous (degenerate) primer. This double-stranded cDNA contains a T7 promoter site that will be recognized by T7 RNA polymerase to generate thousands of copies of each transcript during the in vitro transcription phase. The amplified RNA generated is in the antisense orientation and usually represents several hundred bases of the 3′ region of the parent mRNA. The antisense RNA (aRNA) generated after one round of amplification can be used as template for another round of amplification, as described above, to yield a further 1,000- to 3,000–fold amplification (Fig. 1C). Thus, a 1 : 9 million-fold amplification of the native mRNA population can be attained through two rounds of amplification. Successful amplification can be verified by ultraviolet spectrophotometry, gel electrophoresis, or commercially available lab-on-a-chip technology.
LA of RNA enables the generation of 30–100 micrograms of aRNA from 500 pg to 10 ng of total cellular RNA or 50 to 1,000 cells. An advantage of LA, unlike other amplification techniques such as polymerase chain reaction (PCR), is its high fidelity. 66, 123, 125 The relative proportions of rare as well as abundant transcripts within the native mRNA pool are maintained throughout the amplification process. Reproducibility and linearity of LA have been verified and well documented in the literature and in commercial protocols. 27, 50, 52, 118
Amplifying RNA from certain cell types (e.g., enterocytes) could pose a particular challenge because these cells contain only a low proportion of mRNA within their total cellular RNA (<0.5%). These limitations can be further accentuated when analyzing pre-neoplastic lesions that contain only limited numbers of cells. One way to address this challenge is to prepare serial sections of a tissue specimen from which the same lesion is laser captured, followed by pooling of extracted RNA before LA.
Recently, the nonuniform quality of amplified aRNA as a result of interprotocol variability of LA was described. 52 These differences could potentially impair direct comparisons of results between research groups that use different amplification strategies. Therefore, to facilitate the comparison of expression data, it was recommended that a “standard reverse transcription reaction” be used for small-sample–transcriptome pro-filing experiments as part of the Minimal Information about a Microarray Experiment (MIAME) set of standards that has been established for microarray-based experiments (see details in the Microarray section). 52 The use of commercial kits for LA might address these issues of standardization.
Microarray
In this section, we describe the critical components of a successful microarray experiment, including microarray platforms, data collection, analysis, and visualization. The two most commonly used array-based platforms are oligonucleotide and cDNA (complementary DNA) arrays. It is important to note that in the microarray literature, a “target” is usually defined as the synthesized oligonucleotide or cloned cDNA sequences anchored to the glass slide, whereas the “probe” is the labeled RNA or cDNA from the experimental sample. Oligonucleotide arrays have shorter target sequences (typically between 25 and 60 bp) and are manufactured commercially by several methods, including photolithography, ink-jet printing, and spotting pens. 12, 36, 46, 118 Targets typically consist of a single long oligonucleotide or multiple shorter oligo-nucleotides per gene. Increasing the target density of oligonucleotide arrays allows a greater density of genes per array. The advantages of oligonucleotide arrays are a higher target density and greater specificity relative to cDNA arrays. 12, 64 Cross-platform comparisons of microarrays have revealed discrepancies in results, necessitating buyer discretion. 31, 116, 118
In cDNA arrays, discrete DNA sequences (PCR products of 500–5,000 bp) representing specific sets of genes are spotted on a chemically coated glass microscope slide with spotting pens. 28 The large size of the target cDNA sequences provides extensive complementarity for hybridization, generally producing positive signals under most experimental conditions. However, there are several disadvantages to the cDNA platform. The large size of the targets could result in cross-hybridization between genes that share varying degrees of homology, raising the possibility of generating spurious results. This could be especially problematic for high-throughput studies that involve the analysis of hundreds, or even thousands, of samples. Furthermore, denatured target sequences might rean-neal, potentially affecting the interaction of the probe and its target sequence. 66
Oligonucleotide and cDNA arrays can be hybridized with either the test and reference samples simultaneously on the same array or separately on different arrays, depending on the manufacturer's specifications. The mRNA isolated from test and control samples are processed to yield cDNA molecules that are labeled with fluorescent dyes. Oligonucleotide arrays use one or two fluorescent dyes of a specific wavelength, allowing their signals to be clearly distinguished. The one-dye method allows array-to-array comparisons, with one array usually serving as the reference or control array. The two-dye method allows comparisons within arrays and typically compares expression profiles of two samples on the same array. The most popular fluorescent dyes used to label, test, and reference samples are cyanine-3 (green) and cyanine-5 (red). After hybridization, slides are scanned with a confocal scanner that illuminates every spot and measures fluorescence intensity for each dye. These signal intensity measurements determine the relative abundance of the mRNA species within the test sample relative to the control/reference. Figure 2 depicts the flow chart of the microarray schema for the two-dye per channel or one-dye per channel microarray scenarios. Briefly, cyanine-5-labeled cDNA/aRNA from the test sample is mixed with cyanine-3-labeled cDNA/aRNA from the reference (control) sample and is hybridized to a microarray (Fig. 2A). The hybridized microarray is scanned under two channels, and the raw fluorescence intensity under each channel is calculated. Because two-color microarrays are based on the principle of competitive hybridization between two samples, the expression level of a particular gene (spot) in a test sample relative to the reference sample (red versus green) is measured by evaluating the relative fluorescent intensities in each channel. Higher magnification of a hybridized microarray slide (Fig. 2A) demonstrates a wide array of colors (between the red and green spectrum) that corresponds to multiple genes (spots). For example, a yellow spot indicates comparable expression level for a particular gene in both test and reference samples (i.e., red + green = yellow), whereas a redder or greener spot indicates a greater number of mRNA transcripts for that gene in the sample labeled with cyanine-5 and cyanine-3, respectively. Lack of color (black) at a specific gene spot indicates lack of that specific mRNA transcript in both test and control samples (Fig. 2A). In one-color hybridization, test and reference samples are labeled with the same fluorophore, hybridized to separate arrays, and scanned under the appropriate channel, and the ratios of fluorescent intensity in the test and reference arrays are computed to generate the relative gene expression level (Fig. 2B).
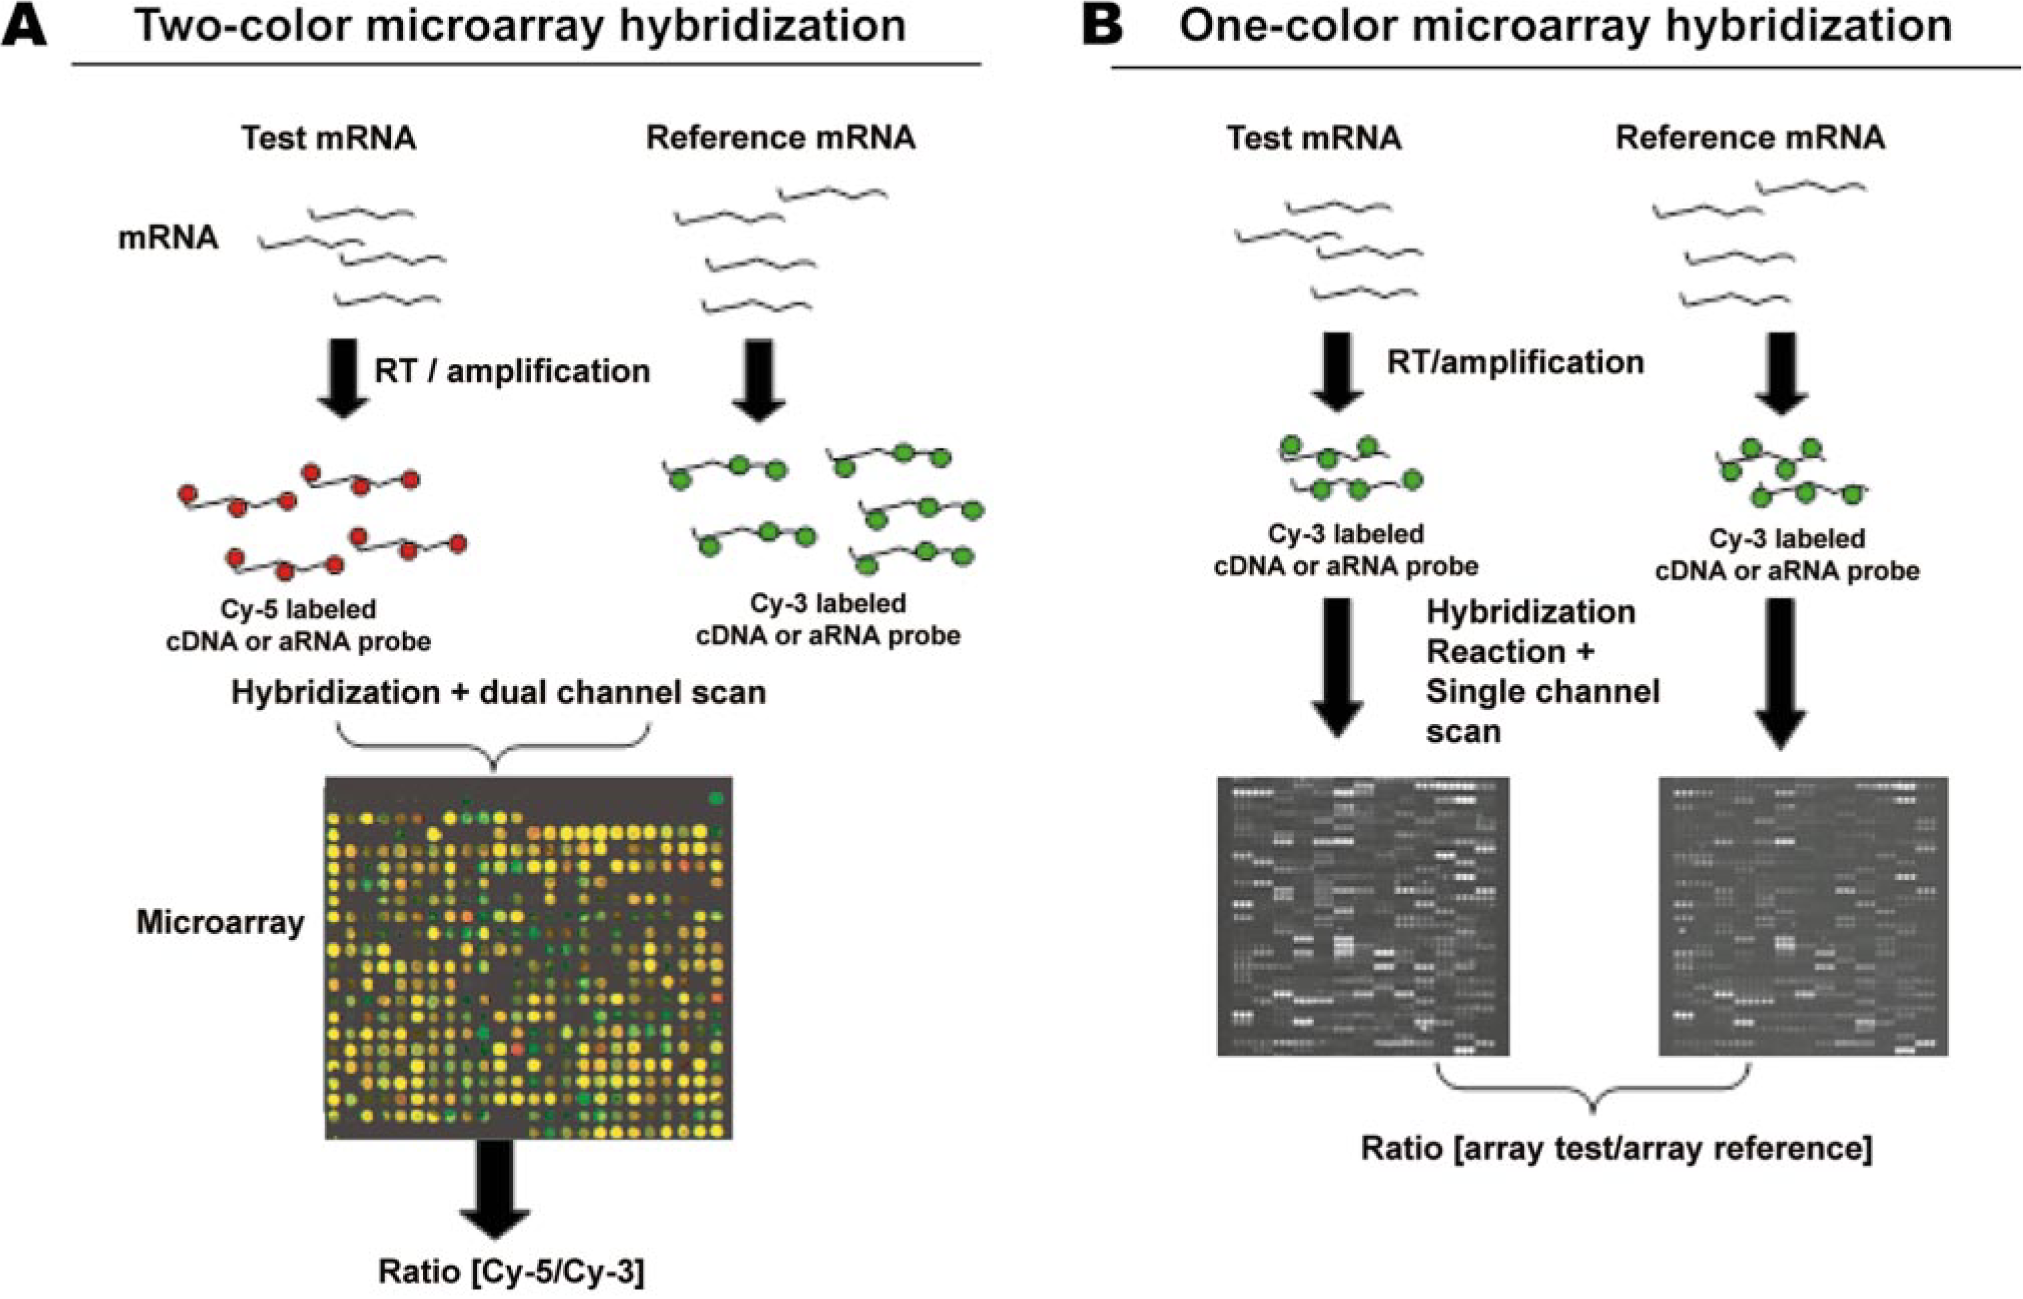
Schematic representation of a microarray experiment. One- or two-color microarray procedures start with test and reference mRNA that undergo reverse transcription (RT) or linear amplification to generate complementary DNA (cDNA) or antisense RNA (aRNA), respectively.
After the array hybridization phase of the study is completed, image acquisition, analysis, normalization, modeling, and identification of differentially expressed genes are required. An integral component of microarray-based experiments is the increasingly sophisticated software tools that provide relatively robust image visualization and analysis.
Image analysis
Image analysis software facilitates acquisition of raw signal data from each spot. A high-quality image is critical because it enhances the efficacy of the microarray experiment and decreases the need for manipulation of the acquired data. A final signal value is ultimately dependent on several important variables, including spot features (location, orientation, size, and shape), uniformity of composition of the oligonucleotide/cDNA, dye biases, resolution of the scanner, and chip alignment. Algorithms taking into account the spatial distribution and cumulative signal, and the number of pixels that collectively represent each oligonucleotide/cDNA determines the ultimate signal intensity level. If multiple oligonucleotides represent an individual gene in a microarray, further processing is done, and signal-to-noise thresholds are used to determine the presence or absence of expression for that particular gene. For example, an algorithm could determine the presence or absence of gene expression from the average signal level of a number of oligonucleotide probes representing a gene versus the background signal level of the chip surface. The smallest copy number of sample cDNA that can be detected determines sensitivity, whereas specificity is decided by the amount of cross-hybridization between oligonucleotides. Thus, image analysis entails identification of internal standards and removal of ambiguous and poor-quality spots. The remaining high-quality signal-level data is stored permanently for further analysis or for comparison in other experiments. This is especially important for reference controls in experiments. 58, 109 Details of image acquisition and data preprocessing have been reviewed extensively elsewhere. 58, 109
Data normalization
The next step in data analysis is normalization of the signal data acquired from multiple array experiments. The normalization process is essential for a successful microarray analysis because the amount of RNA initially processed or the cDNA/aRNA applied to the array(s) is often unequal. Furthermore, differences in hybridization kinetics and labeling/detection efficiencies are important issues inherent to replicate or multiple microarray experiments. The ultimate aim of data normalization is to efficiently remove bias between each individual microarray experiment. 129 Less sophisticated normalization strategies that use housekeeping genes are being replaced by more complex approaches. The currently used normalization strategies are often dependent on the microarray technology used and have been reviewed elsewhere. 14, 59, 91, 109, 129 Commonly used normalization approaches include nonlinear smoothing; data transformation to alter the signal distribution; and nonparametric, parametric, and mixed methods. 14, 59, 91, 109, 129
Data analysis
Further processing of normalized data allows reduction of additive and multiplicative errors in microarray comparisons, as illustrated by the model-based expression index. This is a statistical model that is generated to allow probe-level analysis on multiple arrays. 59 The microarray data obtained with a small number of experimental cases and a large number of genes do not conform to classical biostatistics, which is usually characterized by a large number of experimental cases and a small number of variables. Conventional statistical analyses provide the probability (P) that a difference in gene expression occurred by chance. 121 For example, P = 0.01 is significant in the context of a small number of test genes. However, during expression analysis of 10,000 genes, a P = 0.01 indicates that 1% (100 genes) of the genes will show a difference between test and control samples by chance and not because of actual biological differences (type I statistical error). Therefore, as many false positive and false negative results as possible must be eliminated. To address this issue of false discovery rate (FDR), Tusher et al. 121 developed a novel statistical method specifically for microarray analysis, referred to as significance analysis of microarrays (SAM). They were successful in using FDR to identify nonsignificant genes by analyzing permutations of the measurements. SAM also allows filtering of genes that are above or below a user-defined n-fold change (delta value). This is especially important because of the constant danger in microarray analysis of not including genes that are minimally altered but highly relevant.
The next important step in the analysis of the voluminous data set is pattern recognition. Pattern recognition algorithms are loosely classified into two categories: unsupervised, or clustering (implying no a priori classification of data), and supervised, or classification (with data from known a priori classifications and applying predictors from these data to new data). A hybrid of these two approaches is also commonly used. 109 These algorithms could recognize a pattern in the data that correlates with a disease or a previously unrecognized subtype of a disease, thus complementing histopathologic classification. A cornucopia of algorithmic terms exists, including hierarchical and non-hierarchical clustering, K-means clustering, self-organizing maps, principal component analysis, one- and two-dimensional dendrograms, heat maps, linear discriminant analysis, support vector machines, decision trees, and neural networks. Although statistical tools are constantly evolving to analyze microarray data, the ultimate aim is to develop a specific and universally accepted analytic approach for disease diagnosis and prognosis.
Data presentation
The final step in microarray experiments is presentation of data. This is extremely important because of the voluminous nature of the data set. Most commonly, expression data from microarray experiments can be pictorially summarized within a two-dimensional table, in which each row represents a single gene and each column represents the expression levels of the entire set of genes within a single sample. A color scale correlates color intensity to gene expression. This approach allows easy visualization of the gene expression data in an intuitive manner, thereby allowing a global perspective on the transcriptome for multiple samples (see example in the Molecular profiling of cancerous and precancerous lesions in humans and laboratory animals section).
Although microarray technology has the potential to analyze the entire transcriptome, the only limiting factor is the number of target elements present on the array. However, with the genome sequences of human, mouse, rat, and dog now completed, construction of arrays that represent the entire genome is now feasible. Thus, expression profiles of the entire genome (transcriptome) can be probed on a single array, and the acquired data can then be superimposed on the genome sequence of the species that is being studied, thereby providing a new kind of genomic map. For example, if a subset of genes is deregulated (up-regulated/down-regulated) in a test sample, and a subset of these genes can be localized within a specific chromosomal locus, chromosomal segment aberration (duplication/deletion) can be suspected. This can be verified by comparative gene hybridization (CGH) analysis or array CGH. Similarly, on the basis of known transcriptional targets, deregulation of a subset of genes might also suggest a defect within a particular control element (transcription factor, tumor suppressor genes, protoon-cogenes, etc.). Thus, by carefully examining patterns of global gene expression, it might be possible to identify potential genetic aberrations. Such bioinformatics approaches are now feasible because of the efforts of the Gene Ontology (GO) Consortium (
One major criticism of microarray technology is the lack of uniformity of microarray data between experiments and across platforms.
12,
43,
118
In an attempt to standardize microarray data acquired from different academic and commercial platforms, the Microarray Gene Expression Data (MGED) Society has advocated the use of a set of minimum standards for each microarray experiment.
7,
16,
58
The standards are available at the MIAME Web site (
Postarray Experiments
An important requirement of microarray technology is the careful validation of test results by complementary quantitative methods. The expression changes observed in multiple gene sets are usually validated by reverse transcriptase PCR (RT-PCR), quantitative real-time PCR (QRT-PCR), northern blot analysis, or in situ hybridization (ISH). 20, 21
The relationship between the expressed levels of mRNA and protein is nonlinear in many cases, especially because protein levels are often affected by post-translational modifications. 57, 74 Therefore, data acquired from gene expression studies should be used cautiously in formulating hypotheses and drawing conclusions pertaining to gene function. For these reasons, the field of proteomics is gaining favor as an important adjunct to transcriptome profiling. Direct mass spectrometric and two-dimensional polyacrylamide gel electrophoresis analyses are widely used techniques that can be used in parallel with expression profiling. 57, 74 In addition, IHC can also be used to independently confirm cell type–specific expression of proteins in tissues. In fact, the gaining of popularity of tissue microarrays for IHC allows a high-throughput validation of microarray targets at the protein level. 113, 120, 122
Special Considerations for Overcoming Inherent Limitations
A drawback of the described method in which LCM and LA (LCM-LA) is combined with microarray technologies is the absolute requirement for frozen tissue sections. This limitation is especially problematic from a clinical perspective because the availability of fresh-frozen specimens could be limiting. However, recent technical advances in LCM-LA have enabled the extension of this approach to formalin-fixed, paraffin-embedded tissue sections. 69
The potential for RNA degradation is another important issue that must be considered. RNA degradation is important in LCM-LA experiments because the microdissected cells (a few hundred to thousands) are much fewer compared with conventional tissue/cell culture samples. However, this complication can be addressed by keeping the time required for tissue harvesting and tissue preservation (i.e., snap freezing) to a minimum. This is especially important when studying tissues with high levels of endogenous RNases, such as the pancreas and gastrointestinal tract. Fortunately, one can minimize RNA degradation with the use of RNase inhibitors and denaturants during the extraction procedures and subsequent amplification reactions, taking extreme care to control for contamination in the work area. Another disadvantage of this technology is the cost. Technical advances should bring down the cost and provide the possibility of retrospective analyses of tumor tissues. This will greatly expand the utility of this approach within the clinical setting.
Molecular Profiling of Cancerous and Precancerous Lesions in Humans and Laboratory Animals
During the past decade, numerous microarray-based studies have attempted to identify unique patterns of gene expression that can be used to assist in patient classification, treatment, and prognosis. For example, among patients with diffuse large B-cell lymphoma, therapeutic response is typically nonuniform. 3, 4, 29 However, it was not possible to distinguish between these two populations of patients before therapy. Microarray-based experiments were able to identify unique gene expression signatures among “responders” and “nonresponders,” thereby aiding the classification of these patient subgroups into distinct prognostic categories. 3, 4 A similar approach was successful in distinguishing acute myeloid leukemia (AML) from acute lymphoblastic leukemia (ALL) in humans. 40 In this study, unique gene expression profiles (class predictor sets) were established by microarray analysis for known cases of AML and ALL. These class predictor sets were then used to successfully classify unknown leukemic blood samples. 40 Similarly, microarray studies in human melanoma cell lines have successfully identified subsets of genes that play an important role in growth rate, contact inhibition, and metastasis. 25 Microarray experiments on primary solid tumors (for example, breast cancer) have also reinforced the use of genetic signatures to classify tumor subtypes. 37, 87, 96, 111 Advances in gene expression–based tumor classification have also been documented in lung, 38 liver, 55, 84, 106 prostate, 19, 130 ovary, 126 colon, 132, 134 skin (melanoma), 22 and brain. 65, 94, 96
Alterations in the gene expression profiles of human colon tumors from oligonucleotide and customized cDNA microarrays were recently reported. 6, 82 Molecular changes that occur concurrently with the adenoma–carcinoma progression sequence in human CRC were monitored by expression profiling of early colonic adenomas and late adenocarcinomas. 62 The resultant set of unique discriminatory genes that were differentially expressed in adenomas and carcinomas of the colon were used as an objective, highly sensitive, and specific diagnostic scoring system (molecular diagnosis score). Using this molecular diagnosis score, the authors correctly predicted whether the unknown samples were adenomas or adenocarcinomas. Similarly, in another study, primary nonmetastatic and meta-static (to liver) human colon adenocarcinomas were compared by microarray analysis. 60 Several putative metastasis genes (PRDX4, CKS2, MAGED2, and EST BF696304) were subsequently identified. Distinct gene expression profiles within areas of dysplasia in colonic adenomas that were likely to be involved in progression from the adenoma to carcinoma stage were reported by the LCM microarray approach. 56 Recently, differences in global expression profiles between cancers arising from the left and right colon were established, followed by near perfect molecular classification of human colonic adenocarcinomas that were positive or negative for lymph node metastasis. 133 Interestingly, this classification was derived without previous pathological information and on the basis entirely of gene expression data.
In early microarray studies with heterogeneous cell populations of tumors, the need to identify gene expression in a pure population of cells was complicated by several technical issues. These included the total RNA quantity needed for microarray assays, the lack of LA schemes to obtain the necessary amount of RNA, and a method to capture the cells of interest with intact RNA. Technical advances in microdissection of complex tissues, particularly with the development of LCM-LA, provide the investigator with the ability to undertake array-based expression analysis with in vivo–derived genetic material originating from histologically complex tissue. The LCM-LA approach has been used successfully to analyze gene expression profiles in several different cancers, including carcinomas of the cervix, colon, breast, ovary, prostate, and esophagus. 67, 82, 88, 105, 107
The combination of LCM-LA and microarray technologies has allowed the generation of epithelium-specific in situ gene expression profiles of premalignant, preinvasive, and invasive stages of breast cancer. 68 Results demonstrated significant gene alterations at the earliest phenotypically recognized stage of progression of breast cancer (atypical ductal hyperplasia). However, these changes were maintained throughout the later stages of progression (ductal carcinoma in situ and invasive ductal carcinoma) without unique discriminatory signature profiles segregating the precancerous lesions. Their results implied that different stages of progression are most likely clonal in origin and confirmed the putative malignant nature of these lesions. The authors were thus able to study the molecular relationship between morphologically distinct stages of breast cancer progression within an individual patient and between multiple patients. 68 Evaluation of estrogen receptor (ER)–positive invasive breast cancers from patients treated with adjuvant tamoxifen by LCM-LA, allowed the identification of the simple HOXB13 : Il17BR two-gene expression ratio from the entire microarray data set. 69 This ratio was used to accurately predict tumor recurrence in the setting of tamoxifen therapy and to identify individuals at risk for tumor recurrence. This finding was especially important because approximately 40% of patients with ER-positive breast cancers do not respond to therapy and can even become resistant to tamoxifen, resulting in disease progression. This ratio proved more powerful than the currently used clinicopathological features, such as tumor stage, grade, and her2/neu.
With the use of a similar approach, work from our laboratory recently demonstrated the ability to segregate preneoplastic colon lesions of similar histology but divergent risk potential from two mouse strains that are differentially susceptible to the colonotropic carcinogen azoxymethane (AOM). 80 AOM-induced preneoplastic ACF from two strains of mice (A/J and AKR/J) were subjected to LCM-LA. Colonic epithelia from saline-treated animals were similarly processed for use as reference controls. The amplified RNA was subsequently labeled with fluorescent dyes and hybridized to a 15K microarray slide with 4,992 gene elements represented in triplicate. The array slides were scanned, and the raw fluorescence intensities were calculated. The data was processed and subjected to normalization, and the ratios of the lesion to the normal saline-treated colons were determined for each strain for subsequent comparisons across the strains. The similarity in expression profiles between the control colons from A/J and AKR/J strains allowed comparison of lesions to each other. The scatterplot of fluorescent gene intensities shown in Fig. 3 demonstrates a simple way of intersample comparisons. For example, the expression profiles of two histologically similar microadenomas from A/J mouse colon were highly correlated (Fig. 3A). As expected, the expression profile between histologically dissimilar samples remained skewed (Fig. 3B). Furthermore, using the unsupervised method of clustering (centroid algorithm), we identified several subsets of genes that were distinct between ACF of similar histomorphology across the two strains with variable risk. The dendrogram (relationship tree) in Fig. 4 shows a subset of genes that were mostly up-regulated (red) in A/J and down-regulated (green) or unchanged (black) in AKR/J dysplastic ACF. The mathematical relationships between lesions are computed on the basis of the overall gene expression patterns, and the length of the branches of the dendrogram is inversely proportional to the similarities in the samples with respect to gene expression level. Thus, the dendrogram in Fig. 4 shows clear segregation of dysplastic ACF from the two mouse strains, and this was exclusively based on the unique gene expression profiles. These data imply that lesions of similar morphologies might have distinct molecular signatures that ultimately determine their biological outcome. 80 In the same model, the microarray approach was used to study the functionality of two important tumor suppressor pathways, p53 and TGF-β. 41, 77 We demonstrated that despite high levels of p53 protein in AOM-induced colon tumors in A/J mice, microarray analysis of a panel of transcriptional targets of the p53 gene were found to be nonregulated, providing further evidence for inactivation of the p53 pathway independent of mutational inactivation. 77 Similarly, lack of activation of the TGF-β pathway was demonstrated in AOM-induced murine colonic tumors. 41
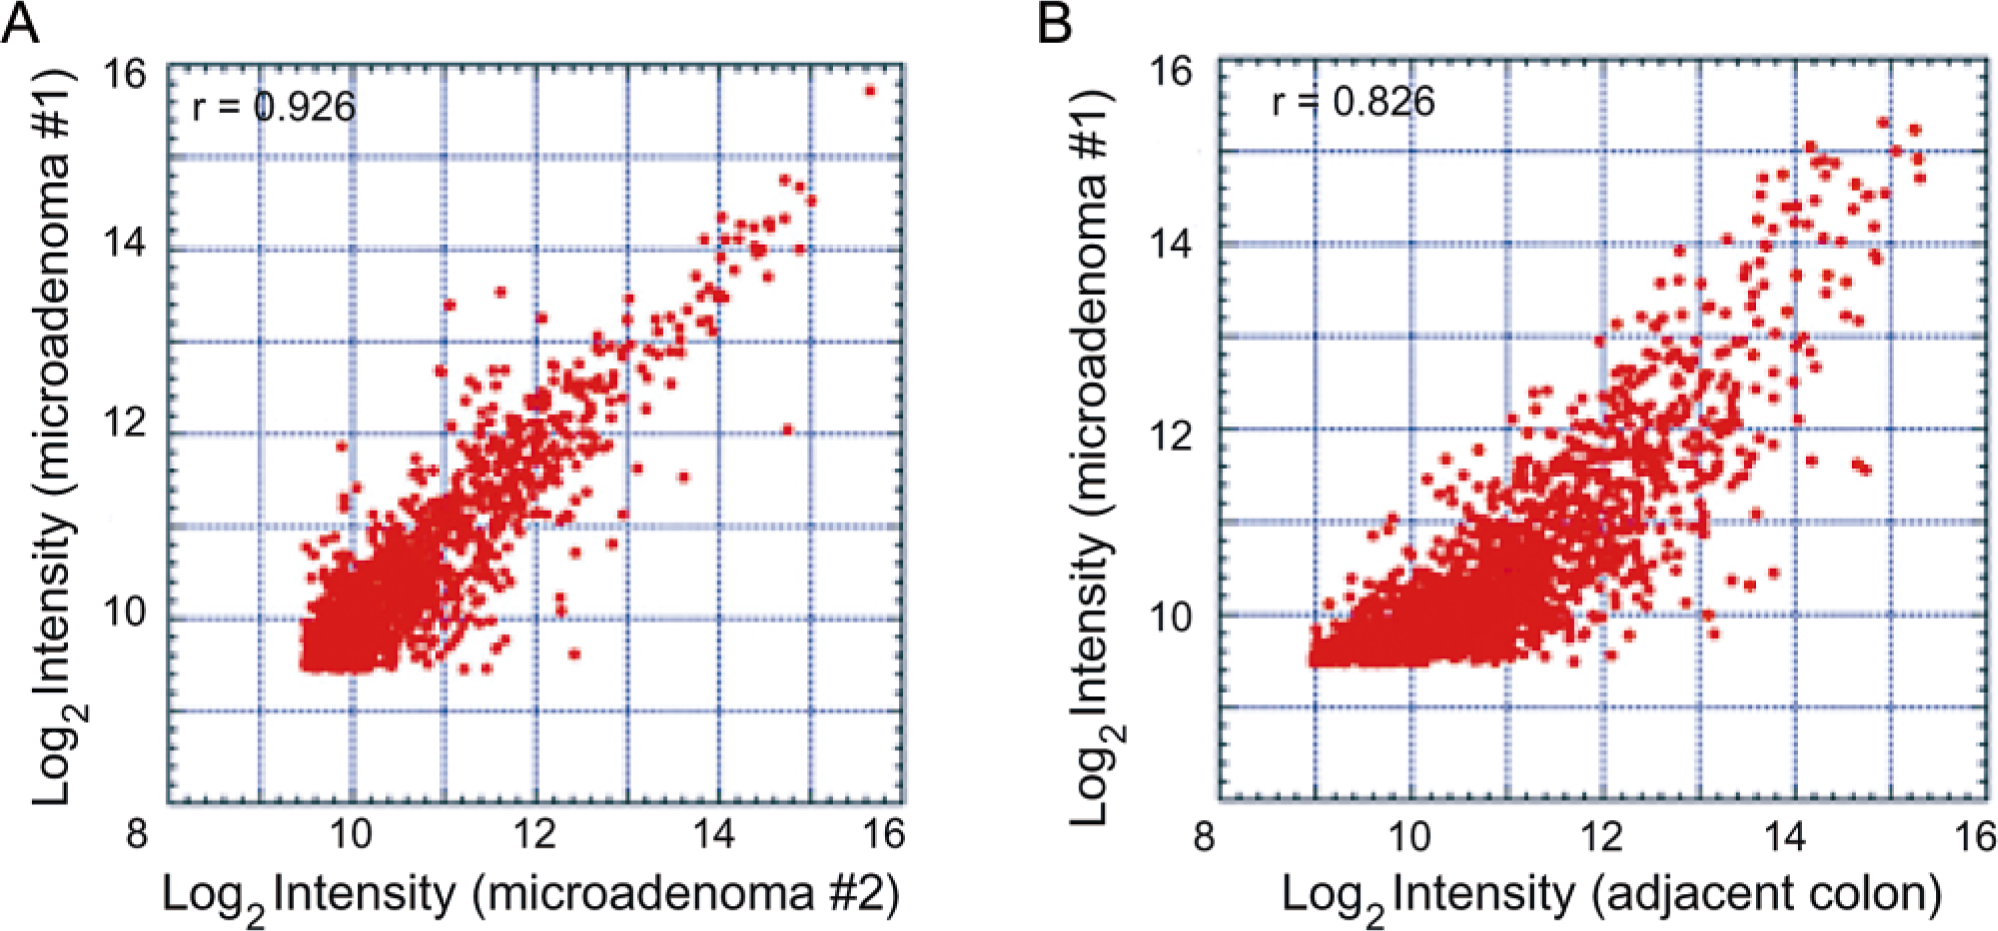
Graphic representation of differential gene expression by scatterplot analysis.
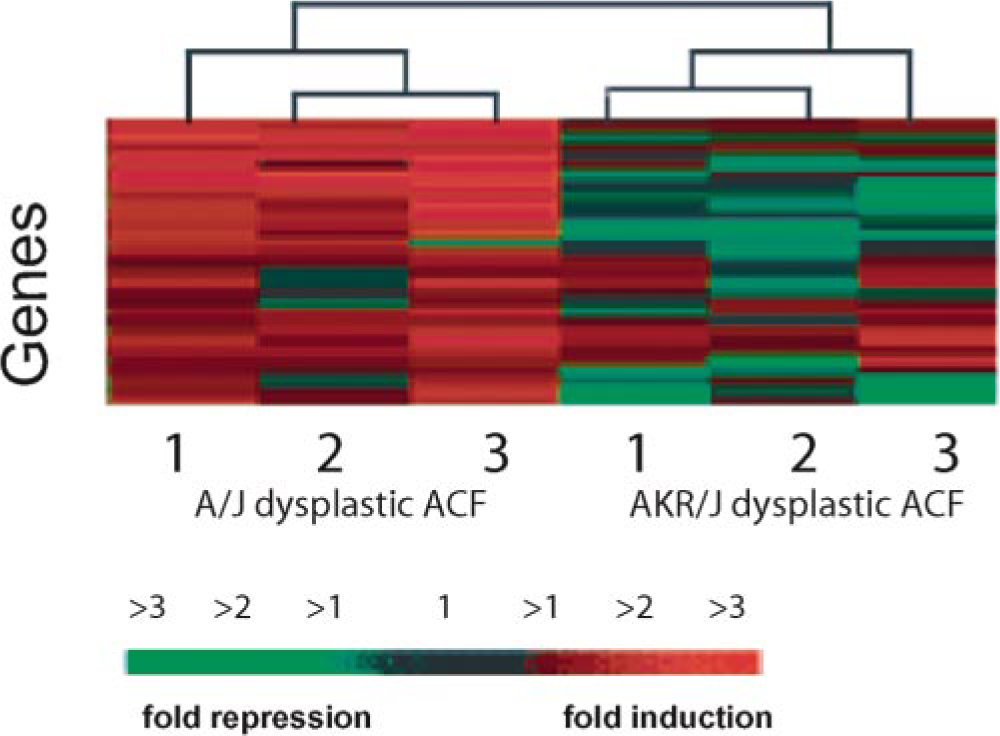
Dendrogram and heat map of gene expression. Expression levels of a subset of genes from three laser-captured, dysplastic aberrant crypt foci (ACF) from azoxyme-thane-treated A/J and AKR/J mouse strains, each, by Genesite software (BioDiscovery) are shown. The RNA from A/J and AKR/J strains were labeled with cyanine-5– and cyanine-3–labeled dUTP during reverse transcription and hybridized to a cDNA array. Each row and column represents a gene and a lesion, respectively. Dendrograms or relationship trees are generated with software that evaluates the Pearson's correlation coefficient between same genes across different samples. The expression level of most of the genes in the A/J ACF are similar to each other (red = highly expressed) and distinct from the low (green) levels or no change (black) in AKR/J ACF. The generated dendrograms (note branches), on the basis of this distinct expression profile, allow clear segregation of ACF in the two mouse strains. Color bar at the bottom correlates color intensity to gene expression.
LCM-LA technology in human and rodent tissues has begun to yield significant benefits. Studies that focus on identification of unique gene expression signatures in tumors can now complement the subjective, histomorphologic phenotype. Expression profiles can be of prognostic significance when specific signatures are compared with available patient data, such as rate of recurrence, metastasis, patient survival, response to therapy, and so on.
Gene Expression Analysis in Veterinary Medicine
High-throughput expression analysis has great potential in the field of veterinary oncology to advance our knowledge of tumor biology and enhance the quality of life of affected animals. Unfortunately, the use of microarrays in the veterinary field has been limited by two main factors: lack of availability of species-specific microarrays and the high cost of analysis. The availability of human, mouse, and rat genomes allow manufacture of microarrays specific for these species. Fortunately, the sequencing of the genomes of other domestic animals, such as the pig, sheep, cat, and cow, is on-going (
A canine-specific cDNA microarray comprising 60 cardiovascular-related genes was developed to study expression profiles of myocytes during myocardial ischemia and necrosis. 8 Approximately 50% of the genes, including the ecto-5′-nucleotidase and endothe-lin-1 genes, PAI-1, and AT receptors, were found to have an altered expression under conditions of ischemia. 8 The ability of microarray analysis to evaluate simultaneously the expression patterns of the entire transcriptome has resulted in several attempts to increase the number of probe sets represented on these custom-built canine microarrays. A larger canine cDNA array consisting of 12,473 genes was recently designed to identify subsets of genes that are transcriptionally regulated by hepatocyte growth factor in a commonly used canine renal epithelial cell line. 10
Cross-species hybridization studies
Because currently available microarrays for domestic animals are capable of probing relatively few genes, cross-species hybridization strategies have been used to increase the number of represented genes. One group designed a custom canine array consisting of 13,729 canine genes and 9,045 human-derived probe sets. 45 This array was employed to identify biomarkers of acute phase response in the liver following administration of lipopolysaccharide to dogs. To maximize cross-species hybridization efficiency, the human-derived probes were designed for the more homologous terminal end of the coding region relative to the canine probes that were designed for the nonhomologous 3′ untranslated region.
A similar cross-hybridization microarray experiment was performed with a high-density human oligonucleotide microarray to evaluate gene expression patterns of bovine monocyte–derived macrophages incubated with Mycobacterium avium subsp. paratuberculosis. 128 In another study, specific gene expression profiles in mitogen-stimulated and -unstimulated bovine peripheral blood mononuclear cells (PBMC) were evaluated with a bovine-specific cDNA array comprising genes involved in immune, endocrine, and inflammatory responses. 117 With the use of this experimental system, the authors demonstrated similar gene expression patterns in ovine and porcine PBMC, thereby advocating use of the cross-species hybridization strategy.
Although cross-species hybridization has merit in the veterinary field, especially with only limited availability of species-specific microarrays, a serious limitation is that only homologous genes across species will produce positive signals. Interpretation of negative results could thus be complicated and a result of the absence of cross-species hybridization to nonhomologous probe sets.
To overcome the disadvantages associated with these cross-species hybridization experiments, several investigators have custom designed bovine microar-rays comprising a few hundred to several thousand bovine-specific probe sets to study multiple aspects of mammary gland development, pregnancy-associated changes in multiple organs, and the immune–endocrine axis. 11, 44, 71, 114, 131
Current and future applications in veterinary oncology
Despite recent articles describing the use of microarrays in bovine and canine species, high-throughput microarray technology has only rarely been applied to the study of domestic animal neoplasms. Recently, an array comparative genome hybridization (CGH) approach was used to evaluate gene copy number changes in canine lymphoma. 119 The array CGH is a powerful technique that allows high-resolution molecular karyotyping and has encouraged further development in veterinary oncology. However, array CGH–based technology cannot be used to perform gene expression analyses. Interestingly, the converse has been demonstrated in humans with cDNA gene arrays for CGH analysis. 47, 63, 110, 122 Such an approach allowed direct correlation between mRNA transcripts and amplification/deletion of genes at the genomic DNA level. 47, 63, 110 For example, CGH with cDNA microarrays identified several novel genes, whose overexpression was attributable to gene amplification in human breast cancer. 47 Such approaches allowing simultaneous evaluation of both the transcriptome and the genome are critical in gaining insights to multiple diseases.
In the veterinary oncology literature, techniques such as IHC and ISH are typically used to complement traditional histomorphologic analysis. Commonly used markers include cell surface molecules (for immuno-phenotyping), intermediate filaments (to ascertain histogenesis), proteins involved in cell proliferation (PCNA, Ki-67, and AgNOR), cell cycle (cyclin D1, p21, and p27), growth stimuli (c-Myc, K-ras, and β-catenin), growth inhibition (p53 and Rb), apoptosis (caspase-3 and Bcl2), and vascularization (VEGF and bFGF). 93 Although IHC and ISH have been useful in prognostication to some extent, their reductionist nature precludes a global perspective on the neoplastic cell state.
As clearly described here, the application of high-throughput, microarray technology can allow for evaluation of complex multidimensional cell circuits and greatly hasten the discovery of potential biomarkers of prognostic significance. Numerous examples of neoplasia in the veterinary field are potential candidates for such high-throughput analysis. Although it is beyond the scope of this review article to present an exhaustive set of examples, there are several key examples of tumors where grade or histologic features correlate with survival, metastatic rate, disease-free interval, and/or speed of local recurrence. These examples include canine cutaneous mast cell tumors (MCT), lymphoid tumors, canine histiocytic diseases, heman-giosarcomas, mammary gland carcinomas, and vaccine site sarcoma (VSS).
The long-term tumor behavior of MCT is dependent on the subjective histomorphologic classification scheme. 86, 112 Grade II and III tumors have a worse prognosis than grade I. However, discordance in tumor grade between experienced pathologists runs approximately 50–60%, resulting in reproducibility issues. 112 The use of molecular markers such as AgNOR, PCNA, Ki-67, c-kit, and p53 has been attempted to predict biological behavior of MCT in terms of recurrence, metastasis, and survival. 1, 112 Similarly, in the example of canine histiocytic diseases (cutaneous histiocytosis, systemic histiocytosis, splenic histiocytosis, and malignant histiocytosis), there are marked differences in prognosis and outcome. Diagnosis is often based on organ involvement and microscopic features. 2, 70 The use of microarray-generated profiles in these examples might provide clues for ascertaining histogenesis of the tumors and could yield multiple biomarkers that might be useful in predicting risk, response to treatment, and remission rates. This might prove to be a valuable supplement to histology that could provide additional objectivity to the current histomorphologic classification scheme.
With the use of an immunophenotyping approach (by IHC), differentiation of feline lymphoid tumors that were nonresponsive and responsive to chemotherapy was unsuccessful. 24 Application of microarray technology to such neoplasms might enable identification of the inherent genetic difference between the nonresponders and responders. In canine lymphosarcoma, identification of cell lineages (immunopheno-typing) has prognostic significance; dogs with B-cell lymphosarcomas have a better prognosis than those with T-cell neoplasms. 103 Significant differences in prognosis between B- and T-cell subtypes of canine lymphomas were demonstrated in a recent study. 89 Definitive diagnoses and predictive outcome in such cases are dependent on histomorphology and/or cyto-chemical stains. However, these are often limited by the availability of antibodies and can yield equivocal results. Similarly, differentiation of hemangioma and hemangiosarcoma in any species can be difficult, especially when based on biopsy or cytologic examination because these can be confounded by excessive hemorrhage, inflammation, and inadequate sampling. 23 Canine mammary tumors are challenging for clinicians and pathologists because of complex histologic classification, low specificity of cytologic diagnosis, and unpredictable biologic behavior. 135 Several studies in canine mammary tumors have attempted to investigate the correlation between histologic invasiveness (stage) and proliferation markers such as AgNOR and Ki-67 with some success. 98 In all of the above examples, use of microarray-based technology might allow identification of unique signature profiles that aid in molecular classification of these neoplasms with an ultimate aim of accurate diagnosis and/or prognosis.
Feline VSS has been an important neoplasm, epidemiologically linked to feline leukemia virus and feline rabies vaccines. 78, 79 Despite extensive research in the field in the last decade, etiopathogenesis of VSS is largely speculative and circumstantial. Application of microarray technology might allow comparison of VSS to nonvaccine-site sarcomas and thereby allow valuable insights into the pathogenesis of VSS.
There does not seem to be a paucity of appropriate diseases in veterinary medicine to which this technology can be successfully applied. The microarray approach has the potential to yield a robust panel of markers for specific conditions; such newly discovered markers can be tested in tissues by the more practical and inexpensive tools (such as IHC- or PCR-based assays) to assist the veterinary clinician. Despite these apparent applications, it is important to highlight that the use of microarrays in diagnostic human oncology is still in its infancy, and microarrays are even further away from practical application in veterinary oncology.
Comparative oncology
Application of microarray to study animal neoplasms has gained impetus with the recent establishment of the comparative oncology program (
Application in Nonneoplastic Diseases
Despite the extensive application of LCM-LA technology to neoplasms, it must be emphasized that microarray studies are not necessarily restricted to the study of neoplastic diseases. A number of recent microarray studies have focused on infectious and auto-immune diseases, pharmacologic applications, and parasitology. 9, 73, 90 Microarray technology has been used to understand the complex genetic processes underlying the interaction between microorganisms and their host. 18 DNA microarray platforms have been used in the study of emerging infectious diseases to identify and characterize novel viruses rapidly. 124 Microarrays have been used to study various aspects of microbial pathogenesis and have been especially useful in the identification and discovery of “pathogenicity genes.” 32, 33, 51 Furthermore, microarrays have been tremendously useful in the testing of the “molecular Koch's postulates” for various virulence- and pathogenic trait–associated genes. 32 Microarrays have also been extremely useful in investigating the mechanisms of drug action and identifying unique gene expression fingerprints that can predict adverse drug-associated reactions in patients. 32, 33, 51
Conclusions
Pathology has been the cornerstone of diagnostic practice for more than a century. Subjective evaluation of cell morphology and behavior by pathologists is ultimately combined to provide the framework for diagnostic, prognostic, and therapeutic decisions. Can rapidly developing molecular technology render pathologists obsolete? In our opinion, this is a highly unlikely scenario, at least in the near future. As the field continues to mature, microarray-based applications are likely to refine and tune current tumor classifications, rendering further objectivity to the current subjective criteria of disease evaluation. Information that is being accumulated from thousands of microarray experiments will continue to provide a powerful and expanding database that will ultimately be compiled within a public repository, annotated, and stored in accordance with MGED recommendations. Furthermore, laser capture technology provides investigators with a superb dissection tool that can be used to procure samples for subsequent array-based genomic, transcriptional, and ultimately proteomic analyses, which can be combined to generate a unique tumor fingerprint. The compilation of such an exhaustive multidimensional and universally available database, combined with morphologic and clinical data, will ultimately provide the research community with valuable new insights into infectious, autoimmune, and neoplastic diseases. Thus, it is of paramount importance for the veterinary field to remain at the forefront of this revolutionary approach and start by creating appropriate tumor repositories to facilitate future multi-group and multidisciplinary studies.
Footnotes
Acknowledgements
We thank the National Institutes of Health (grant CA 81248) and the Robert Lee and Clara Guthrie Patterson Trust (DWR) for support. We also thank Drs. David B. Schauer, Laura Lemke, and James G. Fox for their valuable comments and Elaine Robbins for technical help with the figures.