
Abstract
The pathophysiologic similarities of many human and canine cancers support the role of the domestic dog as a model for brain tumor research. Here we report the construction of a custom canine brain-specific cDNA microarray and the analysis of gene expression patterns of several different types of canine brain tumor The microarray contained 4000 clones from a canine brain specific cDNA library including 2161 clones that matched known genes or expressed sequence tags (ESTs) and 25 cancer-related genes. Our study included 16 brain tumors (seven meningiomas, five glial tumors, two ependymomas, and two choroid plexus papillomas) from a variety of different dog breeds. We identified several genes previously found to be differentially expressed in human brain tumors. This suggests that human and canine brain tumors share a common pathogenesis. In addition, we also found differentially expressed genes unique to either meningiomas or the glial tumors. This report represents the first global gene expression analysis of different types of canine brain tumors by cDNA microarrays and might aid in the identification of potential candidate genes involved in tumor formation and progression.
Dogs share significant anatomical and physiological similarities with humans and are excellent models for human diseases. Unlike most experimental models, cancers in the canine population are spontaneous diseases, making them a valuable resource in the identification of genes associated with oncogenesis. 13, 18 Sequencing of the canine genome has generated great interest in characterizing similarities and differences between human and canine cancers. 14 Thus, the canine genome project aids in the development and characterization of companion animal models for cancer research and in the design of new cancer therapeutic drugs. 6, 7
Primary tumors of the central nervous system are common in dogs and are histologically similar to those found in humans. Brain tumors occur in all dog breeds, although some breeds have a predisposition for certain tumor types. Most tumors occur in dogs over the age of 6 years. 28 Meningiomas are the most common brain tumors found in dogs, with the majority being intracranial and arising from arachnoid cells. 12, 28 Histologically, these tumors are diverse due to their ability to undergo both mesenchymal and epithelial differentiation. In humans, 15 distinct meningeal variants have been classified by the World Health Organization (WHO) with three grades of malignancy. 22 In domestic animals, nine histological patterns have been described with seven of them similar to the variants included in the human meningioma classification system. 15 Of these, the meningothelial and transitional variants are the most commonly described in dogs. 23
A recent study showed that canine and human meningiomas have similar immunophenotypes and may therefore share similar genetic alterations leading to tumorigenesis. 1 Microarray analysis of human meningiomas has identified several genes previously known to have altered gene expressions (e.g., growth hormone receptor, insulin-like growth factor binding protein 7, endothelin receptor A, insulin-like growth factor 2) while also identifying novel differentially expressed genes. 31 In another study, several genes involved in signaling pathways were found to be differentially expressed and could be linked to aberrant phenotypes exhibited by meningiomas. 5
Glial tumors are the most common brain tumors in humans and the second most frequently reported brain tumor in dogs. 28 A recent study revealed that human and canine astrocytomas not only shared morphologic similarities but they both also exhibited overexpression of the genes encoding p53 and the epidermal growth factor receptor (EGFR). 26 Glioblastoma multiforme (GBM) is one of the most frequent types of astrocytomas seen in humans, and accounts for about 40% of all astrocytomas in dogs. 28 Canine GBMs share many microscopic and immunoreactivity features found in human GBMs. 19 A recent study of human glial tumors identified a number of differentially expressed genes belonging either to growth factor-related genes or structural/extracellular matrix-related genes. In addition, EGFR and the α4 chain of laminin genes were found to be consistently overexpressed in low- and high-grade gliomas. 21
In dogs, choroid plexus tumors (CPT) are diagnosed almost as frequently as gliomas, while ependymomas are more rare. 28 Choroid plexus papilloma (CPP) and choroid plexus carcinoma (CPC), the two variants of the tumor, are rare in humans and mostly occur in children. 17 Pathologic and immunohistochemical studies revealed a complex antigenic profile in canine CPTs comparable with that of human CPTs. 2
The majority of domestic dogs are pets that are exposed to the same environmental influences as humans. Naturally occurring cancers in dogs thus provide excellent animal models to further our understanding of tumorigenesis and epidemiology and expand the possibilities of developing new therapeutic treatments. While many studies have demonstrated morphological similarities between canine brain tumors and their human counterparts, very little is known about their comparability at the molecular level. The aim of this study was to apply cDNA microarrays to analyze gene-expression patterns in several different types of canine brain tumors. This analysis represents a first step toward gaining a greater insight into the genetic alterations present in canine brain tumors and identifying novel genes specifically involved in tumorigenesis.
Materials and Methods
Tissue samples
Brain tumor samples were obtained from the veterinary schools at North Carolina State University (NCSU; dogs 1, 2, 3, 4, 5, 8, 15, 16) and University of California at Davis (dogs 6, 7, 9, 10, 11, 12, 13, 14). Tissue samples were flash frozen immediately upon surgical removal or at necropsy. Diagnosis was confirmed for each case by histological examination. A total of 16 tumor samples were analyzed and included seven meningiomas, two choroid plexus, two ependymomas, one oligodendroglioma, one glioblastoma, one astrocytoma, and two oligoastrocytoma (Table 1). The reference RNA sample used in this study was generated from pooling RNA derived from whole-brain sections of two mixed breed dogs with no signs of any neurologic disorder. Because the reference sample did not contain meninges, we also included normal meninges samples taken from two individual dogs that did not show any clinical neurologic defects.
Summary of the 16 brain tumor samples used to generate cDNA array and Q-PCR data in this study.
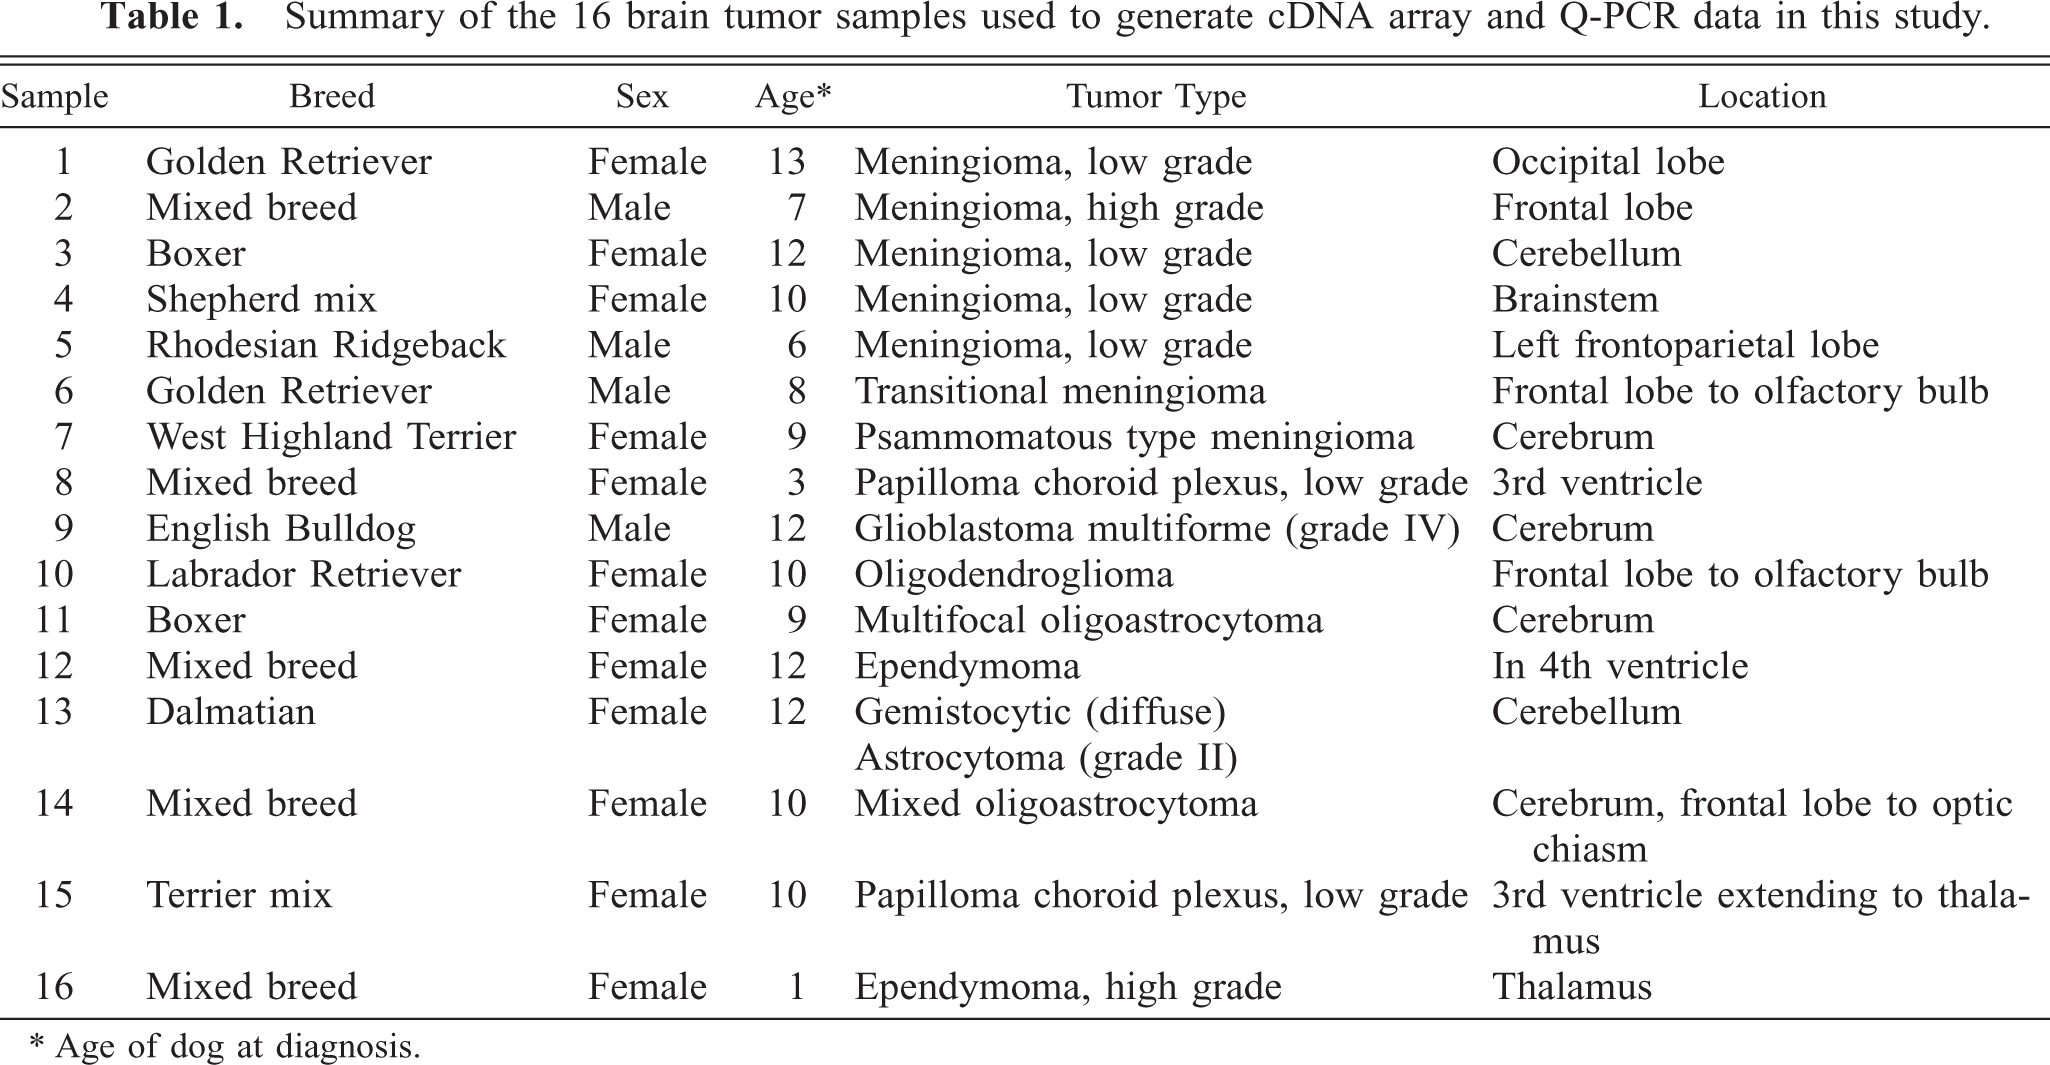
∗ Age of dog at diagnosis.
Microarray preparation
Custom cDNA microarrays were constructed from a canine brain cDNA library that contained approximately 4,000 clones. Of those 4,000 clones, sequence analysis indicated that 2,161 matched to known genes or ESTs and included matches to the mitochondrial genome, unannotated human genomic DNA clones, and novel ESTs. 25 In addition, 25 cancer-related genes previously identified from canine bacterial artificial chromosome genomic clones were polymerase chain reaction (PCR) amplified from canine cDNA and added to the arrays. 29 Library clones were grown overnight and PCR amplification of plasmid inserts was performed with M13 forward and reverse primers. PCR products were precipitated and resuspended in water prior to the addition of an equal volume of di-methyl sulfoxide (DMSO). DNA solutions in 50% DMSO were spotted onto GAPII (Corning) slides by an Affymetrix 417 arrayer. Microarray slides were ultraviolet cross-linked and stored in a desiccator at room temperature until further use.
Total RNA preparations
Total RNA was extracted using Trizol as outlined by the manufacturer (Invitrogen) and analyzed for integrity by gel electrophoresis. Total RNA was DNase treated and repurified using the RNeasy Mini kit (Qiagen). Five hundred nanograms of total DNase-treated RNA was used for RNA amplification (aRNA) with a Low RNA Input Fluorescent Linear Amplification kit (Agilent Technologies).
Fluorescence labeling of probe
Three micrograms of amplified RNA was used for Cy5/Cy3 labeling with the SuperScript Indirect cDNA labeling system (Invitrogen). For each sample, dye swapping was performed such that each sample was labeled with both Cy5 and Cy3 and used to generate duplicate data sets. Each labeled tumor sample was combined with the normal, differentially labeled brain reference sample and lyophilized.
Hybridization
Each array slide was prehybridized in 5× sodium chloride sodium citrate (SSC), 0.1% sodium dodecyl sulfate (SDS), and 1% bovine serum albumin (BSA) for 45 minutes at 42°C. After prehybridization, the slides were rinsed briefly twice in water and then once in isopropanol, prior to being dried by centrifugation at 500 × g for 5 minutes. The lyophilized labeled probe was resuspended in hybridization buffer containing 5× SSC, 5× Denhardt's solution, 50% formamide, 0.5% SDS, 200 ng poly A, and 200 ng of calf thymus DNA. After denaturation at 95°C for 3 minutes, the probe was applied directly to the prehybridized array slide, covered with a HybriSlip (Schleicher & Schuell) cover slip, and placed in a hybridization cassette (Corning). Arrays were incubated for 16 hours at 42°C and then processed through three consecutive washes of decreasing ionic strength and dried by centrifugation for 5 minutes at 500 × g.
Data analysis
The arrays were scanned at a 10-μm resolution by an Axon GenePix scanner and image analysis was performed using the GenePix Pro software (Axon Instruments, Inc). Raw intensity values minus the background for each array were scaled, log2 transformed, and the average for each gene across all the arrays was calculated. Genes containing expression values at or below background were removed from the data set (this process eliminated 725 genes).
The data set was analyzed using a two-step mixed model analysis of variance in SAS version 7.1. To adjust for overall array and dye effects, a first ANOVA model was used to express the relative fluorescence intensity of each gene as the fold difference in expression level relative to the sample mean. Expression differences were then evaluated for each gene separately according to the model
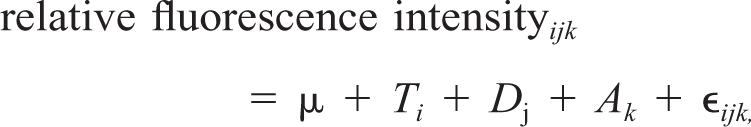
where the fixed effects are represented by Ti for tissue class (reference, meningioma, other tumor, or normal meninges) and Dj for the jth dye (Cy3 or Cy5). μ is the grand mean and Ak and ∊ ijk are random effects of array and residual error assumed to be normally distributed with a mean of zero. The array effect controls for correlation between the two measurements on each array. The magnitude and significance of expression differences between particular tissue classes were computed with the DIFFS option in PROC MIXED. Supplementary data comprising the raw intensity values, results of the SAS analysis, tables of all significant differentially expressed genes for the tumor samples at the Bonferroni level P < 0.00001, and a MIAME-compliant description of the experiment are provided at http://www.cvm.ncsu.edu/mbs/breen_matthew.htm.
The false discovery rate was controlled using Storey's q-value procedure implemented in Bioconductor. For the meningioma versus normal meninges contrast, q < 0.05 corresponds to P < 0.008. For the tumor versus reference contrast, q < 0.05 corresponds to P < 0.016. Qualitatively similar results were obtained by comparing ratios of each sample to the reference but with a much lower significance rate due to the reduced number of degrees of freedom and less efficient control of residual error. Hierarchical clustering was based on the average of the relative fluorescence intensity values for each Cy5 and Cy3 sample and calculated using Ward's average linkage method.
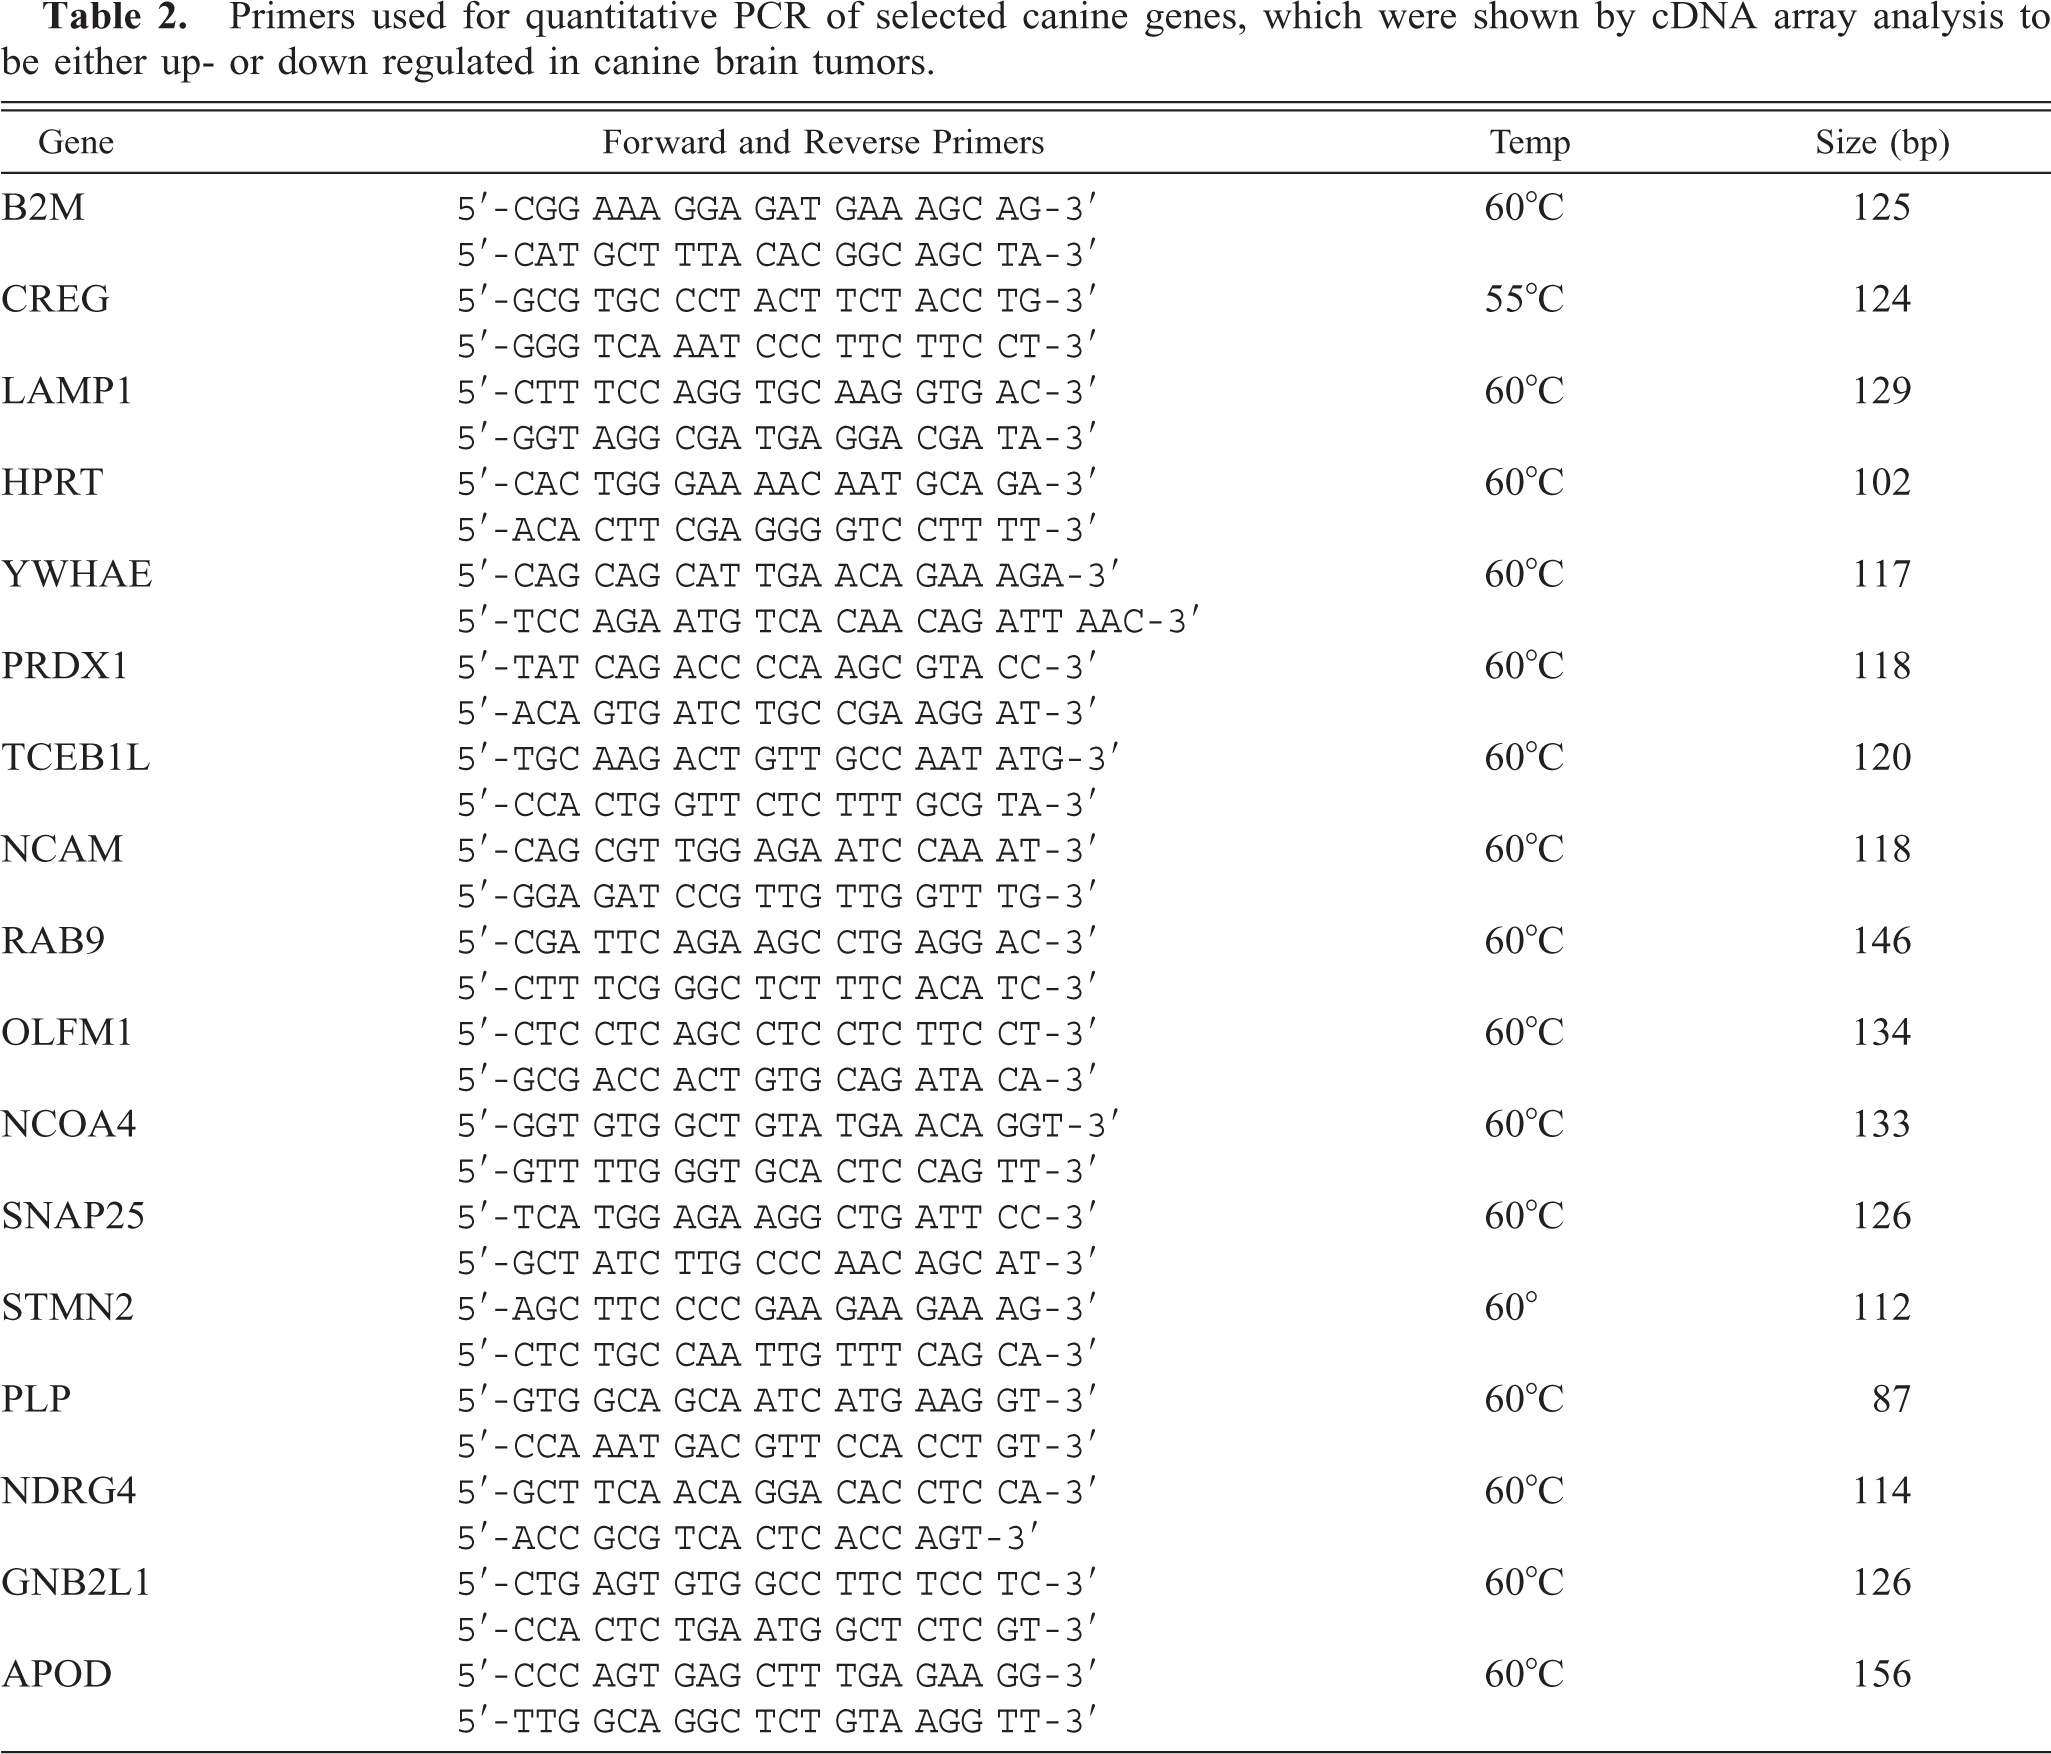
Quantitative real-time PCR
Half a microgram of aRNA was reverse transcribed with random primers and SuperScript III reverse transcriptase (Invitrogen) according to manufacturer's instructions and synthesized cDNA was diluted 1 : 5. Quantitative real-time PCR was performed on an i-Cycler iQ system (BioRad). Samples were run in duplicates with 2 μl of template in a 25-μl reaction using the Platinum Quantitative PCR SuperMix-UDG (Invitrogen) under the following PCR parameters: 95°C for 2 minutes followed by 50 cycles of 95°C for 15 seconds, primer-specific annealing temperature for 30 seconds, 72°C for 30 seconds. Melt curve analysis was performed by increasing the temperature in 0.5°C increments starting at 55°C for 80 cycles of 10 seconds each. Sequences of primers, annealing temperature, and size of amplified product are shown in Table 2. From the amplification curve, a cycle threshold (C t) number was calculated using the iCycler iQ software (BioRad) and the mean C t value from the duplicate reactions was used for fold-change analysis. The two housekeeping genes beta2-microglobulin gene (B2M) and hypoxanthine-phosphoribosyl-transferase (HPRT) were used for normalization of samples by subtracting the C t value of the housekeeping gene from the C t value of the candidate gene. The 2−ΔΔCt method was used to determine relative gene expression for each gene. 20
Primers used for quantitative PCR of selected canine genes, which were shown by cDNA array analysis to be either up- or down regulated in canine brain tumors.
Results
The experimental design consisted of 18 duplicated experimental samples (seven meningiomas, nine other brain tumors, and two normal meninges, each from a different dog) against a whole-brain reference sample. Rather than simply comparing ratios, we used the statistically more powerful procedure of mixed model analysis of variance of relative fluorescence intensities to search for genes that are differentially expressed between each tissue class (see supplementary data for details). 10, 32 The results are presented graphically in Fig. 1 in the form of volcano plots of significance against fold change. Significance on the y-axis is on a negative log P scale such that increasing significance is toward the top, while fold change on the x-axis is shown on a log base 2 scale such that ±1 represents 2-fold increase and decrease, respectively. Experiment-wide significance was established by converting P-values into q-values and adopting a 5% false-discovery-rate cutoff. 27
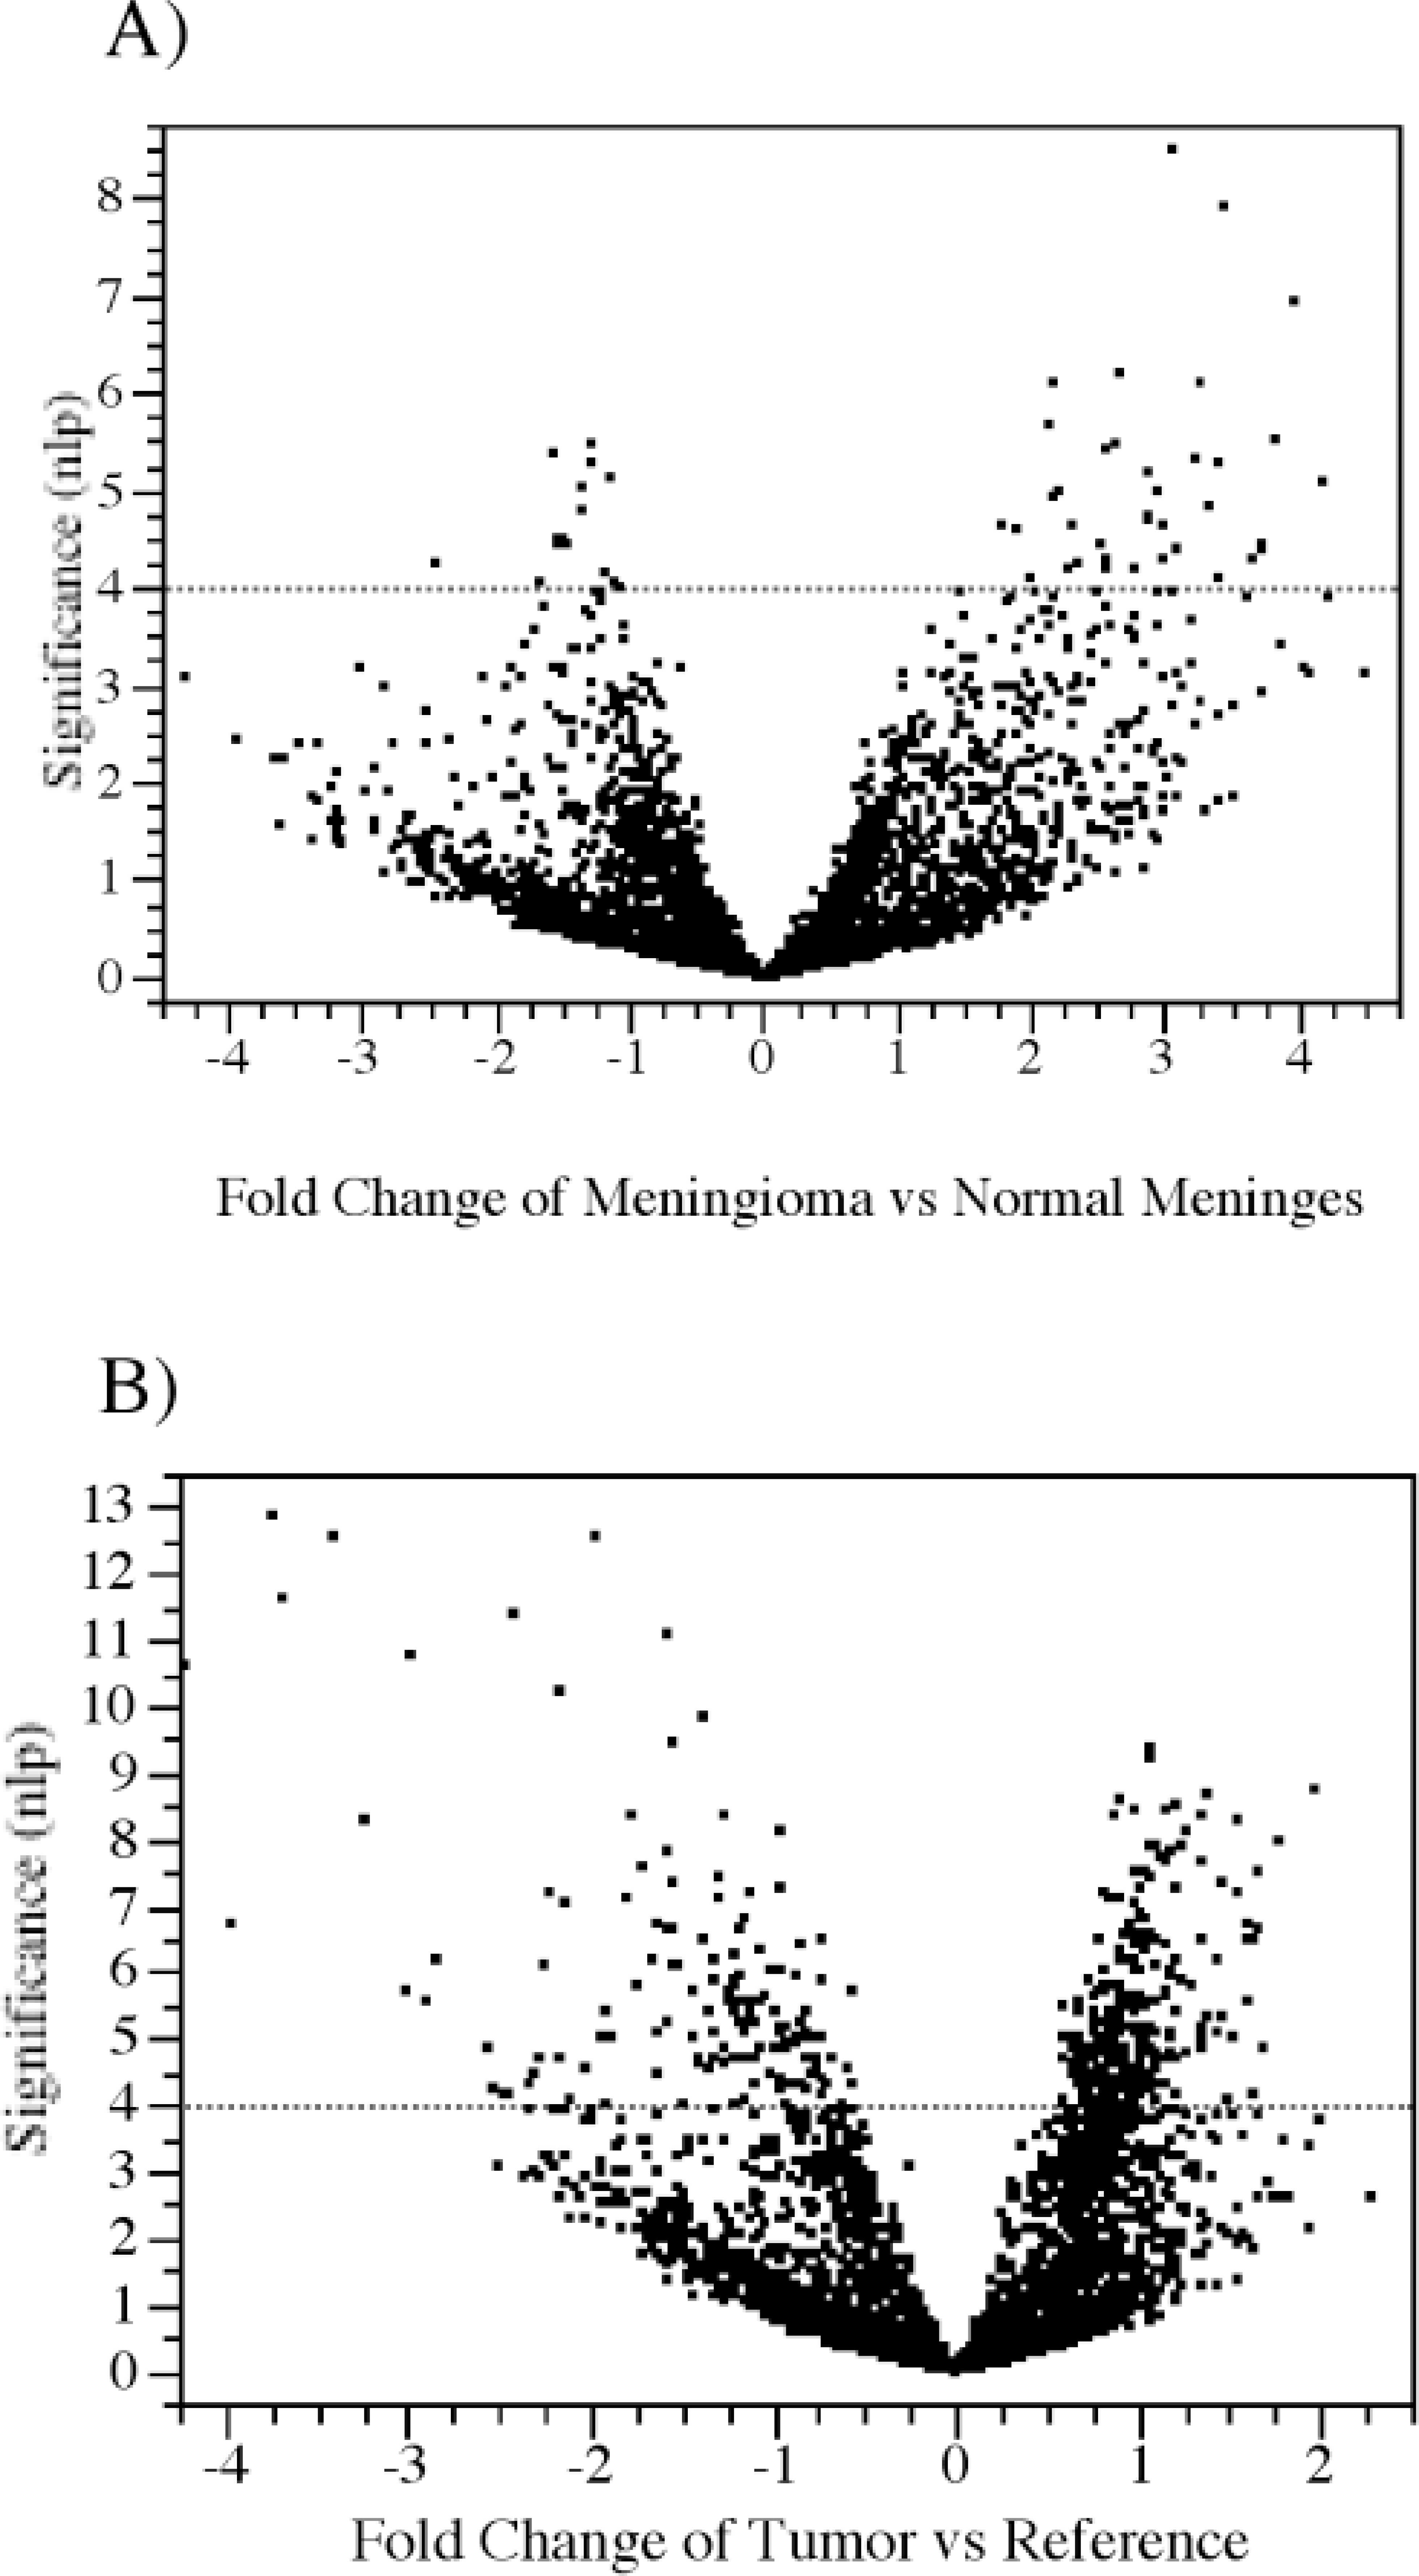
Volcano plots of differentially expressed genes in canine brain tumors. Calculated differences of gene expression are presented by plotting the estimate values on the x-axis over the significance, negative log 10 of P-value (nlp). Dotted line indicates cutoff value of significance (Bonferroni P < 0.00001).
To validate our cDNA array, we conducted a self-self hybridization (reference versus reference sample and normal meninges versus normal meninges) experiment and, as expected, we did not detect any significant differentially expressed genes (data not shown). Overall, 327 genes were found to be differentially expressed between meningiomas and normal meninges, while 564 genes differentiate all other tumors as a class from the reference sample. Among the 50 genes significant at the Bonferroni level (P < 0.00001) for the comparison of meningiomas against normal meninges, approximately 30% represent the mitochondrial genome, 10% ribosomal proteins, 20% unknown sequences, and 40% correspond to predicted genes (see Table 3 and Fig. 1A—see supplementary data for comprehensive details). Among the 404 most highly significant genes for the other tumor samples, 30% correspond to unknown genes and only 20% to known genes (see Table 4 and Fig. 1B—see supplementary data for comprehensive details). No attempt was made to distinguish between different neuroepithelial tumors (astrocytoma, oligodendroglioma, oligoastrocytoma, ependymoma, and choroids plexus tumor), as there were too few samples of each class. Some of the more notable gene expression differences are discussed below.
List of differentially expressed genes with a fold change of three or greater in canine meningioma samples (see SOM Table 4 for a more complete list of the data).
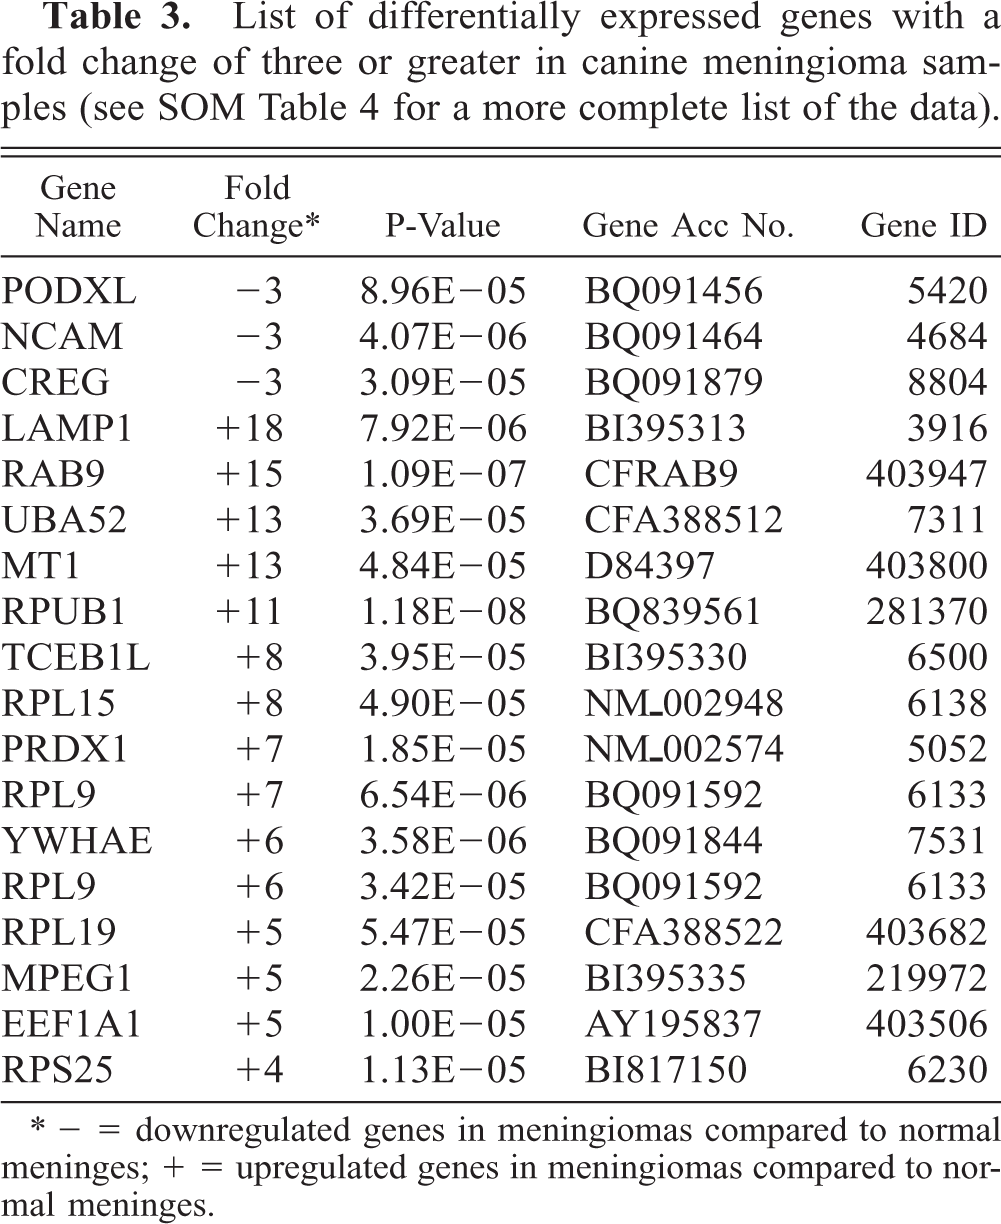
∗ − = downregulated genes in meningiomas compared to normal meninges; + = upregulated genes in meningiomas compared to normal meninges.
List of differentially expressed genes with a fold change of three or greater in nonmeningioma canine brain tumor samples.
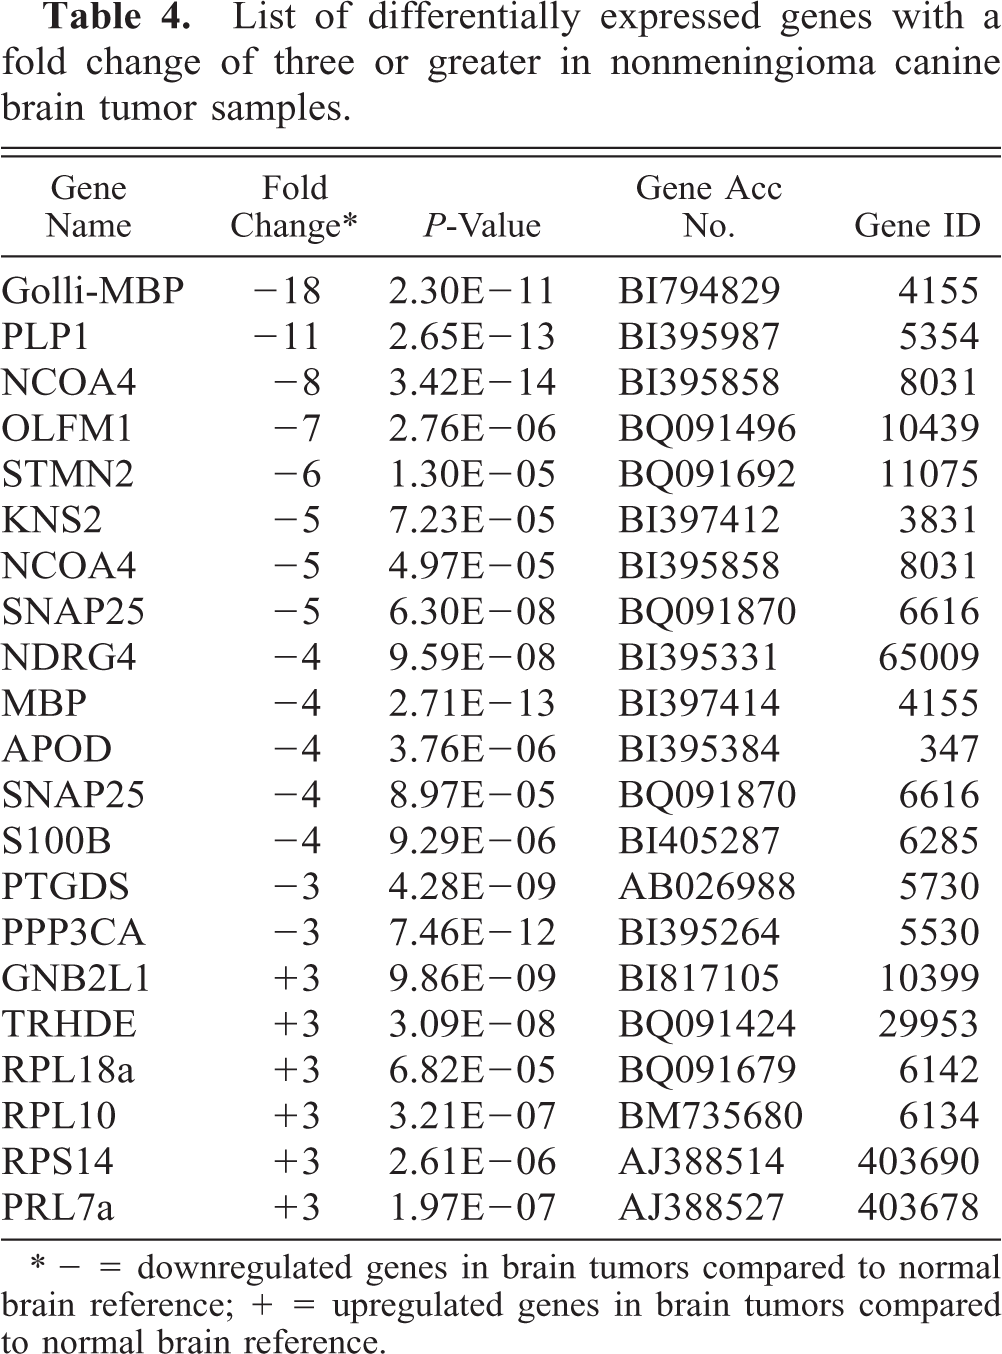
∗ − = downregulated genes in brain tumors compared to normal brain reference; + = upregulated genes in brain tumors compared to normal brain reference.
Hierarchical cluster analysis was used to look for possible differentiation between the meningioma samples. Among the significantly differentially expressed genes, a number appear to define two distinct types of meningiomas, as shown in Fig. 2. Group one contains samples 1, 5, 6, and 7 while group two includes samples 2, 3, and 4. In addition, this analysis highlighted a tumor sample that was first believed to be a meningioma but clustered more closely with the normal meninges. Upon histological examination, it was found to be a granular cell tumor (data not shown).
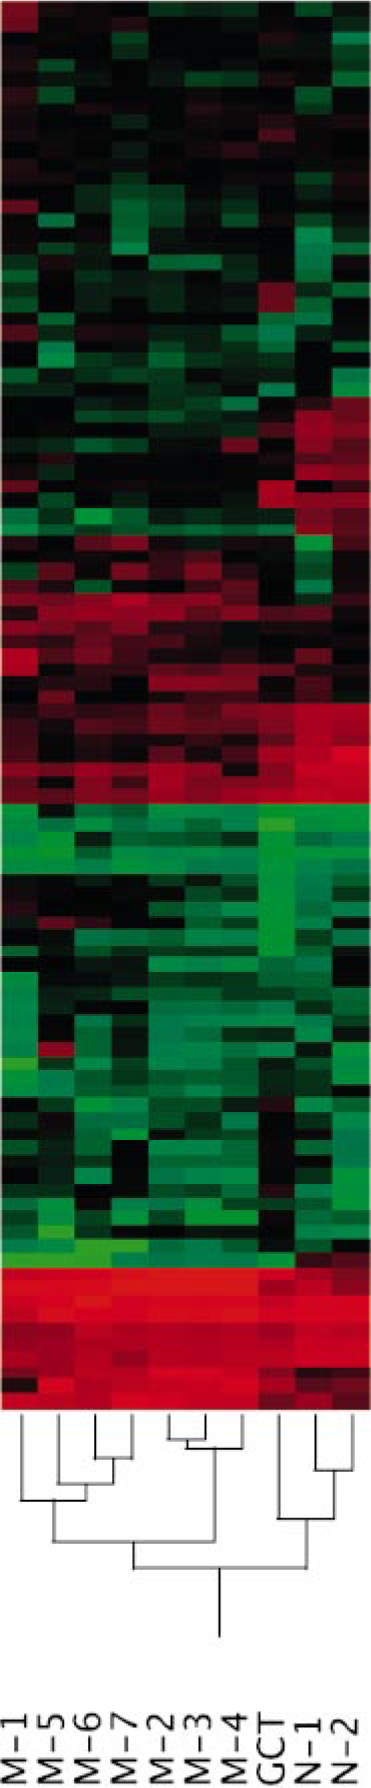
Hierarchical cluster analysis of meningioma samples (M1–7), granular cell tumor (GCT), and normal meninges (N1–2). The red and green bars indicate genes demonstrating increased and decreased expression, respectively, based on the average relative fluorescence intensity values for each Cy5 and Cy3 sample. Only the top 100 genes based on nlp values are shown in the cluster.
To verify the results of our array analysis, we used quantitative real-time PCR on several differentially expressed genes. To compensate for the initial aRNA and cDNA concentrations, we normalized each sample to two housekeeping genes, B2M and HPRT. B2M is a medium-expressed gene and HPRT is considered a low-expressed gene and, because the expression levels of many of our genes in normal meninges are not known, we used both housekeeping genes for our analysis. While the number of fold change differed depending on which housekeeping gene was used, the overall expression patterns of each gene were similar in both. Expression levels of the neural cell adhesion molecule (NCAM), cellular repressor of E1A (CREG), lysosomal-associated membrane protein 1 (LAMP1), rab9 ras-related GTP-binding protein (RAB9), transcription elongation factor B (TCEB1L), peroxiredoxin 1 (PRDX1), and tyrosine 3-monooxygenase (YWHAE) were analyzed in all seven meningioma samples. The cDNAs of both normal meninges samples were pooled together into one sample for the gene expression comparison with the meningioma samples. For the downregulated genes, NCAM expression was underexpressed in five of the meningioma samples while CREG was down in all of the samples. LAMP1, PRDX1, TCEB1L, and YWHAE were upregulated in all meningioma samples and RAB9 in six of the samples.
For the neuroepithelial brain tumor samples, we analyzed the expression levels of proteolipid protein (PLP1), neuroblastoma protein (OLFM1), stathmin-like 2 (STMN2), nuclear receptor coactivator 4 (NCOA4), synaptosomal-associated protein (SNAP25), NDRG family member 4 (NDRG4), apo-lipoprotein D (APOD), and guanine nucleotide binding protein beta polypeptide 2-like 1 (GNB2L1). All samples were compared with the normal brain reference and each sample showed downregulation for PLP1, OLFM1, STMN2, SNAP25, and APOD and upregulation for GNB2L1. Five samples were underexpressed for NDRG4 (oligodendroglioma, oligoastrocytoma, CPT, ependymoma, and GBM) and NCOA4 (oligoastrocytoma, two CPT, ependymoma, and GBM).
Discussion
Gene expression analyses of human brain tumors are beginning to identify genes and pathways that may be involved in tumorigenesis. However, human tumor samples are often heterogeneous and identifying genes that are responsible for tumor initiation versus tumor growth and progression can be troublesome. The domestic dog offers an excellent model system for human cancer because the same types of spontaneous cancers affect this species, and through extensive inbreeding, selected dog breeds represent a more genetically homogeneous population. The restricted level of genetic heterogeneity in a variety of dog breeds should allow us to more easily identify genes directly involved in tumorigenesis as well as to identify genes previously not associated with cancer.
In addition to being pathophysiologically similar, brain tumors in both human and dog have been shown to share similar immunohistologic phenotypes. 1, 19, 26 However, these studies only included a few protein markers and very little is known about the molecular changes that occur in the canine tumors. To address this issue, we constructed a canine cDNA microarray that contained genes specific to the brain. Our samples included a variety of different types of brain tumor across a number of dog breeds. In a recent study, we compared a number of different brain tissues across several dog breeds and showed that differences in gene expression levels were not affected by the breed but rather by the type of brain tissue. 11
In our gene expression analysis of canine meningiomas, we found several genes that had similar expression patterns to genes identified previously in human meningiomas. For example, we detected upregulation of ribosomal proteins in meningiomas versus normal meninges. This is consistent with data previously reported for human meningiomas. 5 We also identified several downregulated genes that have not previously been reported in human meningiomas. The cellular repressor of E1A gene, CREG, is a secreted protein and plays a role in cell proliferation, differentiation, and development. 30 A recent study showed that CREG is able to bind to the tumor suppressor mannose-6-phosphate/insulin-like growth factor II receptor and inhibit cell growth. 4 In our canine meningioma samples, CREG was downregulated by threefold in the tumors compared with normal meninges.
These results were confirmed by quantitative real-time PCR and showed that CREG was downregulated in all samples. The level of differences in expression was quit variable among the samples and overall greater than in our array analysis. However, this was expected because quantitative real-time PCR is a more sensitive method for detecting differences in gene expression and our array data were based on a mean value of expression across all samples. In addition, we confirmed the expression patterns of a number of other differentially expressed genes identified by our array analysis.
Granular cell tumors (GCT) in the central nervous system are common in rats but are rare in dogs. In the rat, histological evidence suggests a meningeal origin for these tumors, while in the dog, the histogenesis remains unknown. 16, 33 The most common site for human GCTs is the neurohypophysis, which are postulated to arise from pituicytes, while in dogs, they are usually intradural. A recent study of two cases of GCTs found that the origin of the granular cells might have been from the meninges. 8 Our cluster analysis shows that the GCT contains many similarities with normal meninges but also revealed distinct differences when compared with meningioma samples. In addition, we also found two subgroups within our meningioma samples indicating that cDNA expression analysis could be useful for classification of meningioma variants.
In the neuroepithelial tumor samples, the total number of up- or downregulated genes was comparable. However, downregulated genes showed higher fold changes for differentially expressed genes. Upregulated genes included ribosomal proteins, cell signaling proteins, and extracellular proteins. Apolipoprotein D (ApoD) has been found highly expressed in human pilocytic astrocytomas, but not in infiltrating astrocytomas, and has been associated with a decrease in cell proliferation in some cell types. 9 This previous study suggests that upregulation of ApoD might be responsible for the slow proliferation characteristics found in pilocytic astrocytomas. Interestingly, ApoD showed a fourfold downregulation in our tumor samples and these results were confirmed by quantitative real-time PCR. This might suggest that canine neuroepithelial tumors can be more proliferative than human tumors.
NDRG2 and NDRG4 belong to the N-myc down-regulated gene family and are highly expressed in the brain. 24 NDRG2 has been found to inhibit cell proliferation and has been shown to be downregulated in high-grade glioblastomas but not in low-grade gliomas. 3 In our study, NDRG2 showed a twofold decrease in expression, but the differences in expression were not found to be statistically significant. On the other hand, NDRG4 expression was statistically significant and was found downregulated in the tumor samples. Quantitative real-time PCR confirmed these results in five of the brain tumors, which might indicate that NDRG4 could play a role in a number of different types of brain tumors while NDRG2 is specific to high-grade gliomas.
Of the known genes identified in this study, many are involved in signaling pathways, transcription activity, cytoskeleton rearrangements, and cell transformation. We did not find any of the 25 cancer-related genes to be differentially expressed in our analysis. However, many tumor-suppressor genes are expressed at low levels in normal tissue and small changes in expression might not be discovered when applying a high stringency on the data analysis. Oncogenes may contain mutations that lead to abnormalities in the cell, but their expression pattern might not be altered. Therefore, to detect alterations in these cancer-related genes in canine brain tumors, a more direct screening method is needed.
In summary, we found differentially expressed genes in canine brain tumors that have similar expression patterns to those described in human brain tumors. We also identified genes that have not been found in human brain tumor studies. Some of the cDNAs that indicated differential expression on our custom array contained ESTs and hypothetical proteins. Identification of those genes could lead to the discovery of yet unknown cancer-related genes. With this analysis, we have shown that canine brain tumors undergo similar genetic changes to those of human brain tumors on a molecular level. A larger, more in-depth comparative study on gene expression patterns between human and canine brain tumors is needed to filter out genes that play a role in tumorigenesis. By extending our study, we hope to be able to identify genes directly involved in tumor formation and progression, ultimately leading to new drug targets and therapies.
Footnotes
Acknowledgements
This work was supported by the American Kennel Club Canine Health Foundation (Award 249 to MB, NO, GG), a NCSU CVM First Award (MB, NO, GG), and by the Paul C. and Borghild T. Petersen Foundation (PJD).