
Abstract
Argyrophilic nucleolar organizer region (AgNOR) counts in cytologic and histologic lymph node samples from healthy dogs and dogs with lymphoma were compared. Control samples were taken from 10 Beagle dogs (six female and four male dogs, 1.5–2 years), and lymphoma samples were taken from 16 dogs. Cytologic samples were obtained by fine-needle aspiration and impression and histologic samples by excision or incisional biopsy. Altogether, 26 cytologic, 19 excisional, and 7 incisional biopsy samples were examined. Lymph nodes of controls showed a moderate inflammatory pattern; of the lymphoma cases, nine were low-grade forms and seven were high-grade forms. Mean AgNOR counts per nucleus were determined. AgNOR counts were statistically different (P < 0.001) between controls and lymphoma cases in cytologic (1.35 and 3.59, respectively) and histologic (1.4 and 2.89, respectively) samples. In lymphoma cases, AgNOR counts in cytologic samples were higher than those in histologic samples by 0.81 (P < 0.001) and showed a linear relationship (r = 0.6; P < 0.05) with the histologic counterparts in excisional biopsy samples. AgNOR counts in low- and high-grade lymphomas were significantly different (P < 0.05) in cytologic (3.21 and 4.08, respectively) and histologic (2.68 and 3.18, respectively) samples. In conclusion, AgNOR counts were higher in lymph nodes with lymphoma than in reactive nodes. In the case of dogs with lymphoma, AgNOR counts in cytologic samples were linearly related to excisional but not to incisional biopsy samples. Although AgNOR counts were different between cytologic and histologic samples, either sample type provided enough sensitivity to differentiate between high- and low-grade forms of lymphoma.
Introduction
The ability to assess the prognosis of neoplastic diseases by the use of cytology as well as histology is important. 4,16,22,29 Numerous authors have suggested that the silver staining procedure to observe the nucleolar organizer region (NOR) of the nucleus is suitable for prognostic assessments. This procedure is known by the acronym of argyrophilic nucleolar organizer region (AgNOR). 3,5,7 Nucleolin, an RNA-binding acidic protein present in the nucleolus, functions in ribosomal transcription reactions and binds silver molecules with high affinity. 1 Acidic proteins such as nucleolin are the NOR-associated proteins (NORAPs). 14,15,19,23 The specific affinity of NORs for silver has been demonstrated by ultrastructural studies. 14,15
The diagnostic possibilities inherent in AgNORs first attracted attention 15 years ago. Numerous experiments have shown that the number of AgNORs is significantly higher in malignant tumors than in physiologic, reactive, or benign processes. It has been demonstrated that the number of AgNORs per nucleus can be regarded as one of the hallmarks of proliferation and that mean AgNOR counts are good indicators of the degree of malignancy of human non-Hodgkin's lymphoma. 2,10,11,20,24,28,33,34 Moreover, AgNOR counts were also found to be indicators of postsurgical prognosis in canine mast cell tumors. 4,22 The results obtained by various research groups consistently show that a rising AgNOR count is indicative of an increasing tendency toward proliferation; however, there are differences between the values obtained. 2,5,10,16,27,33,34 Using histologic or cytologic samples, the AgNOR technique is suitable for distinguishing lymphoma cases according to prognosis (poor or better) as reported by several authors. 16,17,26,29 According to some authors, however, it is the increase of the total area of AgNORs within the nucleus, rather than the number of AgNORs, that shows a close correlation with the rate of proliferation and the prognosis. 6,18,21
Our aim was to validate the AgNOR method in dogs with lymphoma. Lymphoma is the most common hematopoietic neoplasm in dogs. Canine malignant lymphoma resembles human non-Hodgkin's lymphoma of high-grade malignancy. 9,25 Some authors have mentioned the possible role of pesticides and magnetic fields as etiologic factors, 31 and in certain cases, familial predisposition has also been suggested. 25,31 Several forms or types of lymphoma are distinguished. The most common form involves the peripheral lymph nodes. It typically manifests initially in the submandibular and retropharingeal lymph nodes but may later affect any lymph node, lymphoid organ, lymphoid tissue, or organ. In multicentric lymphoma, neoplastic cells are present in multiple organs. There are also localized forms of lymphoma restricted to the gastrointestinal tract or skin. 8,31
Histologically, canine lymphoma can be graded according to internationally accepted standards using human classification systems such as the Kiel classification and the revisited European-American classification of lymphoid neoplasms (REAL) Scheme. 9,32 Valli et al. 32 recently gave a detailed description of the REAL system applied to the lymphoid neoplasms of domestic animals. The high-grade forms of lymphoid malignancy, including diffuse large B-cell (centroblastic), B-cell lymphoblastic, T-cell lymphoblastic, and large-cell immunoblastic (immunoblastic) types, are the commonest (74–70.5%). The low-grade type of malignancy, including the follicular center-cell (centroblastic-centrocytic, centrocytic) and lymphoplasmacytic types, are less common, accounting for 26–29.5% of all cases. 9,26 The macronucleated medium-sized cell form, corresponding to the marginal zone B-cell lymphoma (MALT or small-cell lymphoma) in humans, also occurs commonly. 9 Immunohistochemical determination of the immunophenotype using the CD3, CD8, CD20, CD21, and CD79a cell surface markers is already a routine procedure. Such studies reveal that lymphomas of T-cell origin are less common than B-cell tumors in dogs (10–38%). 9,26,31
According to the recommendations of the World Health Organization (WHO; TNM Classification of Tumors in Domestic Animals, Geneva, 1980), the following stages of the disease are distinguished: stage I, lesion involving a single lymph node; stage II, lesion involving multiple lymph nodes located in the same region; stage III, generalized lymph node enlargement; stage IV, involvement of the spleen or liver (presence or absence of stage III); and stage V, involvement of the bone marrow or appearance of tumor cells in the blood or involvement of any nonlymphoid organ. Substages have also been identified, with “a” denoting the substage in which clinical signs closely associated with the disease, i.e., deterioration of condition, emaciation, lack of appetite, depression, dyspnea, and anemia, are absent, whereas “b” designates the substage in which these signs are present. 26,31
This study examined the use of the AgNOR technique to evaluate samples taken from the lymph nodes of both healthy dogs and dogs with lymphoma and the use of samples obtained by different techniques (fine-needle aspiration [FNA], impression, true cut, and excision) and processed differently (cytologic and histologic) to provide accurate numerical evaluation of AgNORs.
Materials and Methods
Animals and sampling
Lymphoma samples taken from dogs treated at the Department and Clinic of Internal Medicine, Faculty of Veterinary Medicine, Szent István University, were used in this study. Lymphoma samples were obtained from 16 dogs (5 female and 11 male dogs), including four mixed breed dogs, four German Shepherd Dogs, three Rottweilers, and one of each of the following breeds: Bullmastiff, medium Schnauzer, Saint Bernard, German Shorthaired Pointer, and Staffordshire Bull Terrier. The ages ranged from 2 to 11 years (mean, 4.81 years). Three of the lymphomas were in advanced stages (two in stage IV substage b and one in stage V substage b), and the other 13 were in stage IV substage a. Stage was established according to the guidelines of the WHO Clinical Staging System for Lymphosarcoma in Domestic Animals, as described previously. 31 The clinical diagnosis for each lymphoma case was based on routine clinical, ultrasonographic, X-ray, bone marrow cytologic, and histopathologic examinations. 8,9,12,13,25,31 The final histopathologic diagnosis of the lymph nodes of patients with lymphoma was based on the guidelines described by Valli et al. 32 Control samples were taken from 10 healthy Beagle dogs (six female and four male dogs), aged 1.5–2 years, under the supervision of the Local Ethical Committee of the Faculty of Veterinary Science, Szent István University, in accordance with the guidelines of the Guide to the Care and Use of Laboratory Animals (US Department of Health and Human Services, 1996).
Cytologic samples were obtained from all control dogs and dogs with lymphoma. Histologic samples of lymphomas were taken by either full lymph node excision (n = 9) or incisional biopsy (n = 7). Histologic samples from control animals were taken by excisional lymph node biopsy.
Cytologic samples were taken from the left prescapular lymph node by FNA from dogs with lymphoma and by preparation of impression smears from the excised lymph nodes of healthy dogs. Use of the latter method was necessary because no representative samples could be obtained by FNA because of the small size of healthy lymph nodes.
Incisional biopsy samples were obtained under sterile conditions with a true-cut biopsy needle (BIP Co. High Speed Multi biopsy needle) from the left prescapular lymph nodes. The sample cylinders were placed in 5% neutralized formalin solution and then processed by histologic methods.
For full excision, the affected left prescapular lymph nodes were removed surgically; 1-cm3 blocks were excised from the removed lymph nodes. The tissues were fixed in 5% formalin solution, processed routinely, and examined histologically.
Histopathology and tumor grading
Serial sections (3 µm) were stained with hematoxylin and eosin for histologic evaluation. After the diagnosis of lymphoma, the tumors were graded according to the REAL Scheme, 13 as applied to canine lymphoma, as described previously. 32
Immunophenotype
For immunophenotyping, CD3 was used for T-cell labeling and CD79a for B-cell labeling, as described by Kiupel et al. 17 Sections of lymph nodes from all dogs examined were incubated in 10 mM HCl/citrate buffer (pH 6.0) and heated in a microwave oven (600 W) for 10 minutes after a 20-minute acclimation at room temperature. The slides were then transferred to 100% alcohol and immersed in methanol containing 1.0% hydrogen peroxide for 30 minutes to block endogenous peroxidase activity. After washing with distilled water and phosphate-buffered saline (pH 7.6), nonspecific antibody binding was blocked by means of normal goat serum for CD3 or normal equine serum for CD79a for 15 minutes. Immunostaining was performed by incubation in rabbit anti-CD3 (DAKO, High Wycombe, UK) or mouse anti-CD79a (DAKO) antibody at a dilution of 1 : 600 in 10% normal goat or equine serum for 60 minutes. Antibody binding was localized with the Vector ABC Elite kit (Vectastain PH6102, Vector Laboratories, Peterborough, UK) and observed with 3,3′-diaminobenzidine substrate (Vector SK4100). After final washing in distilled, deionized water, the sections were counterstained with Mayer's hematoxylin and then dehydrated, cleared, and mounted in DPX Mountant (BDH Industries Ltd., UK). Canine lymphoid tissue was used as a positive control. The immunophenotype was assigned based on the concentration and distribution of cells positive for CD3 or CD79a.
Cytologic specimen staining
Each cytologic sample was stained with diluted Giemsa solution (Sigma-Aldrich) for 15 minutes as a routine procedure. These samples were subjected to routine cytologic examination.
AgNOR staining and counting
AgNOR staining was performed according to the description of Crocker and Nar 7 with some modification: cytologic samples were fixed with 70% ethanol for 10 minutes. The staining solution was always prepared fresh from two components: 2% gelatin solution (Sigma-Aldrich) and 50% silver nitrate solution (Sigma-Aldrich). The silver nitrate solution was mixed with the gelatin-containing mixture in a 2 : 1 ratio immediately before staining and under conditions of reduced room light. Efforts were made to ensure maximum dissolution of the silver nitrate crystals. One to two drops of the resulting mixture were placed on the smears for 30 minutes in the dark. After the incubation period, slides were washed in distilled water and then allowed to air-dry. In some cases, cytologic samples were then counterstained with diluted Giemsa solution (Sigma-Aldrich).
Smears were examined light microscopically. One hundred fifty to 200 intact cells were examined in all smears. 7 The number, size, and distribution of AgNORs (blackish-brown staining dots) were determined for each nucleus. Silver precipitates, if any, were not counted as AgNORs. The mean nuclear AgNOR count per nucleus was determined. 6
The possible configurations of AgNORs included the following groups. 6
Group 1. AgNORs are fully aggregated and form a homogeneous silver staining structure corresponding to the nucleolus. When using a short incubation period (see under the staining procedure), multiple AgNORs are not visible in the nucleolus. Such a picture is often seen in “resting” lymphocytes and other cells (e.g., hepatocytes). This category includes also the arrangement in which the nucleus contains multiple nucleoli, provided that each nucleolus contains a maximum of one AgNOR.
Group 2. The nucleolus shows a mottled pattern. This condition is often seen in dividing cells. In such cases, several AgNORs can be seen in the nucleolus. If the AgNOR technique is used properly, the individual NORs can be distinguished within the nucleolus.
Group 3. Numerous small AgNORs can be seen outside the nucleolus in the nucleoplasm. This is typical of highly malignant tumor cells.
In some cases the arrangement of precipitates is poorly evident, which renders it difficult to make an unambiguous evaluation of AgNORs.
Statistical analysis
The appropriate AgNOR numbers and configurations found in the given cell types were correlated with the clinical and pathologic diagnoses. Unpaired and paired t-tests and linear regression analysis were done to compare the relationship of AgNOR counts in different groups (cytologic and histologic specimens, incisional and excisional biopsy samples obtained from control dogs or dogs with low- and high-grade lymphomas). The statistical test used is indicated in Tables 1–5. Normality of the different groups had been checked by Kolmogorov-Smirnov goodness-of-fit test. Statistical analysis was done by the S-PLUS 2000 Professional (MathSoft, Inc., Cambridge, MA) computer program.
Results
Histopathology of the lymph nodes in control dogs revealed two normal nodes, four nodes with chronic lymphadentitis often associated with eosinophilic infiltration, and four nodes with reactive or hyperplastic follicles. In the dogs with lymphoma, nine had low-grade follicular center-cell lymphoma (one type I, three type II, and five type III), three had large-cell immunoblastic lymphoma, three had diffuse large B-cell lymphoma, and one had B-cell lymphoblastic leukemia/lymphoma. All were interpreted to be of high grade and found to be of B-cell origin.
Comparison of the mean nuclear AgNOR counts between control dogs and dogs with lymphoma revealed that there were significant increases (P < 0.001) in the AgNOR counts between control and lymphoma samples prepared by either cytologic (range for controls, 1.13–1.60; for lymphoma cases, 2.65–5.89) or histologic methods (range for controls, 1.23–1.53; for lymphoma cases, 2.20–3.75) (Table 1). In control animals, the AgNOR counts in cytologic and histologic specimens were similar. AgNOR counts were significantly (P < 0.05) higher in cytologic samples of lymphomas compared with histologic samples of lymphomas (Table 2). This difference between cytologic and histologic samples was evident with either an excisional or incisional biopsy sample (Table 3). No difference in AgNOR counts in dogs with lymphoma was evident between incisional and excisional biopsy techniques (Table 3). AgNOR counts were significantly different (P < 0.05) between low- and high-grade lymphomas by either cytologic (range, 2.65–3.77 and 3.30–5.89, respectively) or histologic methods (range, 2.20–3.03 and 2.62–3.75, respectively) (Table 4). AgNOR counts were significantly higher (P < 0.05) by cytologic examination than by histologic examination for both low- and high-grade lymphomas (Table 5, Fig. 1).
Comparison of mean nuclear AgNOR counts between control dogs and dogs with lymphoma. Results were obtained using specimens processed by both cytologic and histologic techniques.∗.
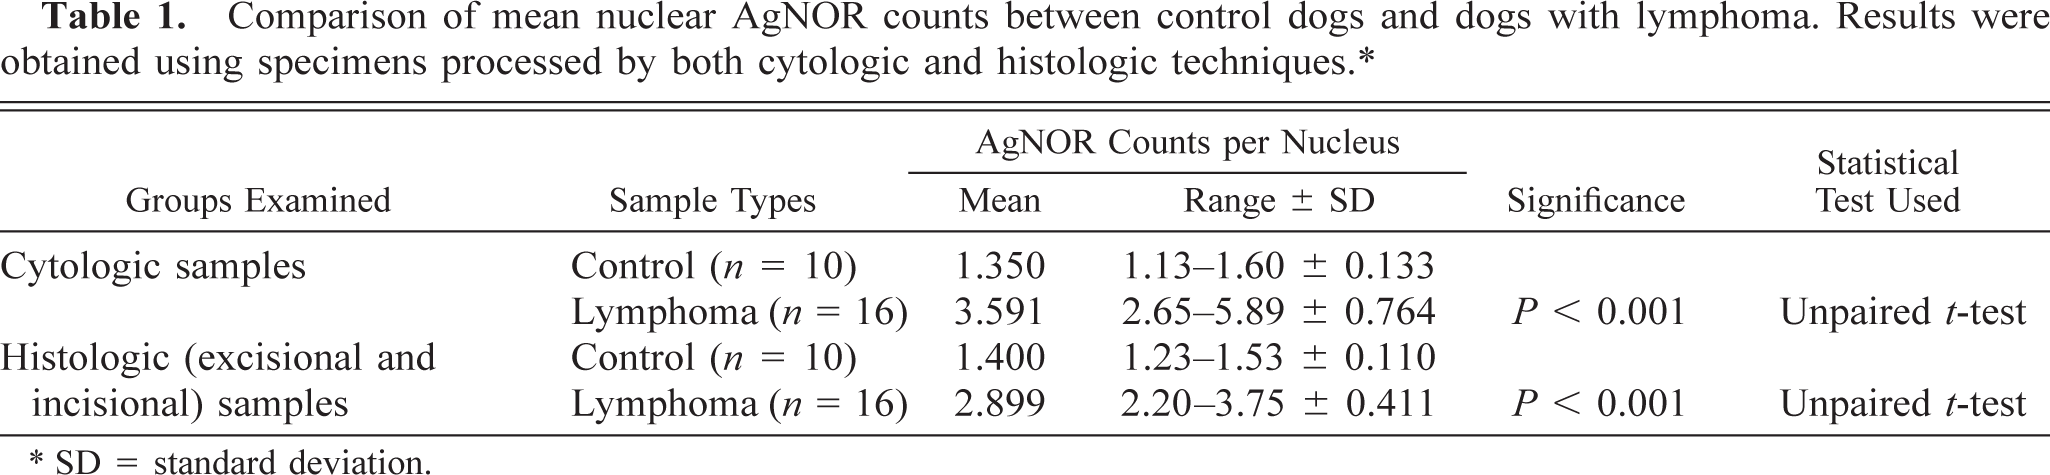
∗ SD = standard deviation.
Comparison of mean nuclear AgNOR counts between samples processed by cytologic and histologic techniques using samples from control dogs and dogs with lymphoma.∗.
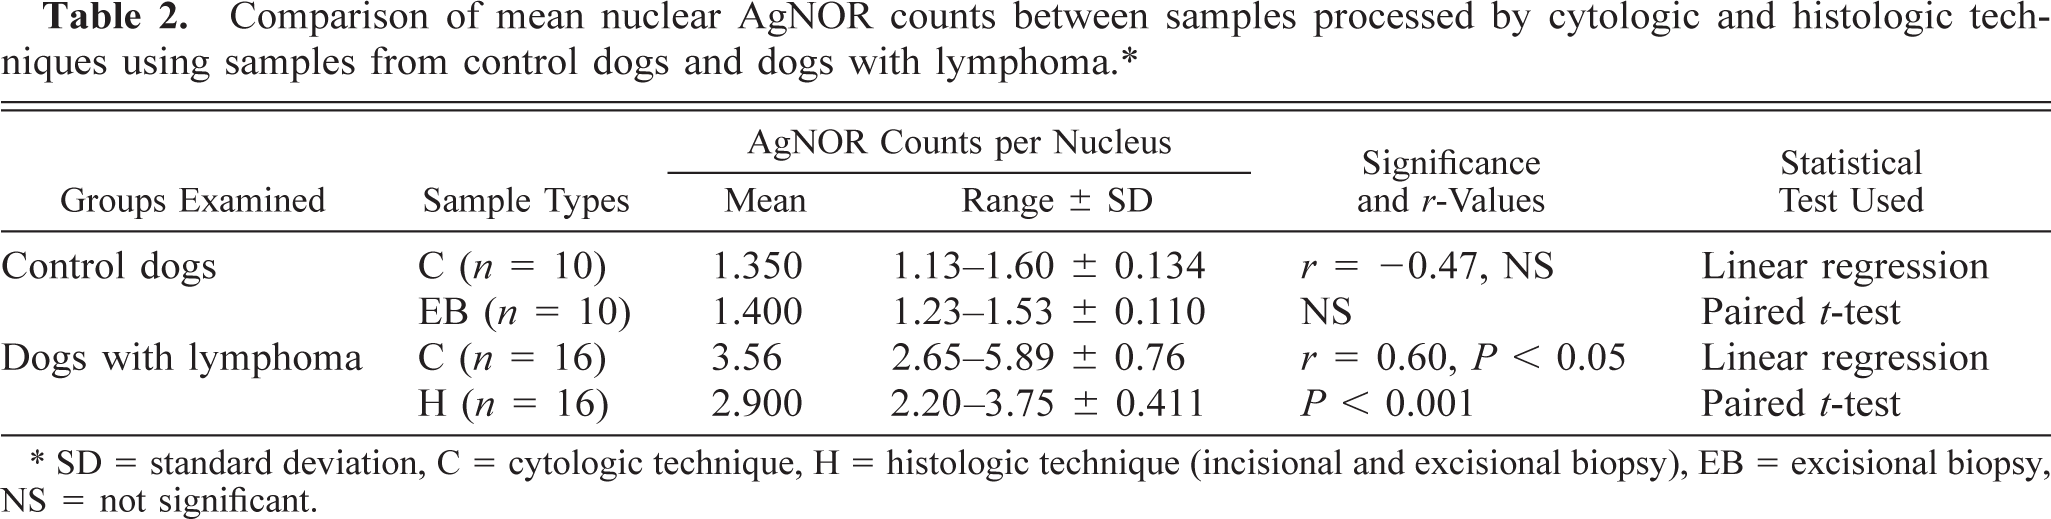
∗ SD = standard deviation, C = cytologic technique, H = histologic technique (incisional and excisional biopsy), EB = excisional biopsy, NS = not significant.
Comparison of mean nuclear AgNOR counts of dogs with lymphoma between samples processed by cytologic and two histologic sampling techniques (incisional and excisional biopsy).∗.
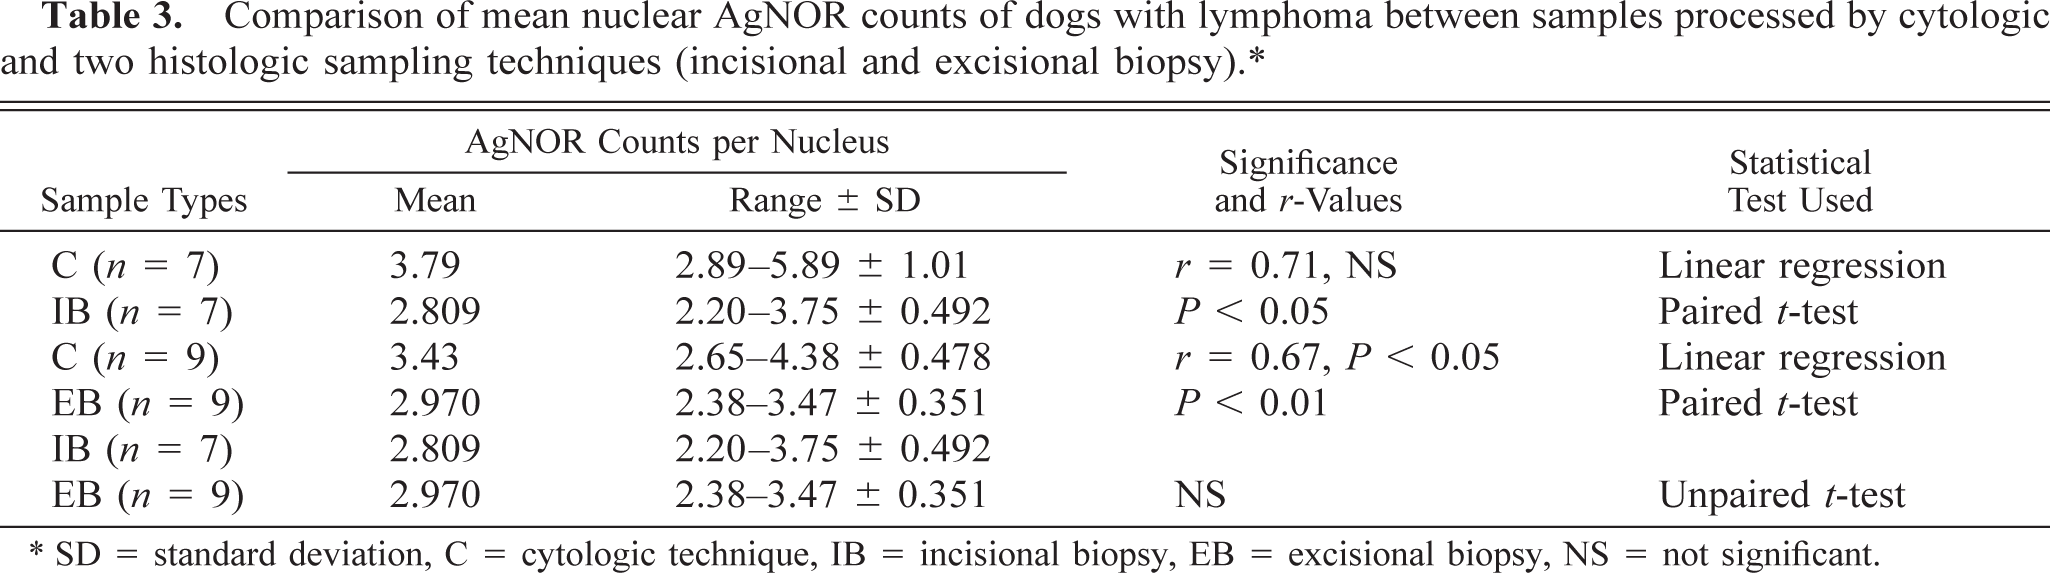
∗ SD = standard deviation, C = cytologic technique, IB = incisional biopsy, EB = excisional biopsy, NS = not significant.
Comparison of mean nuclear AgNOR counts between samples of dogs with low- and high-grade lymphomas using samples processed by different techniques (cytology and histology).∗.
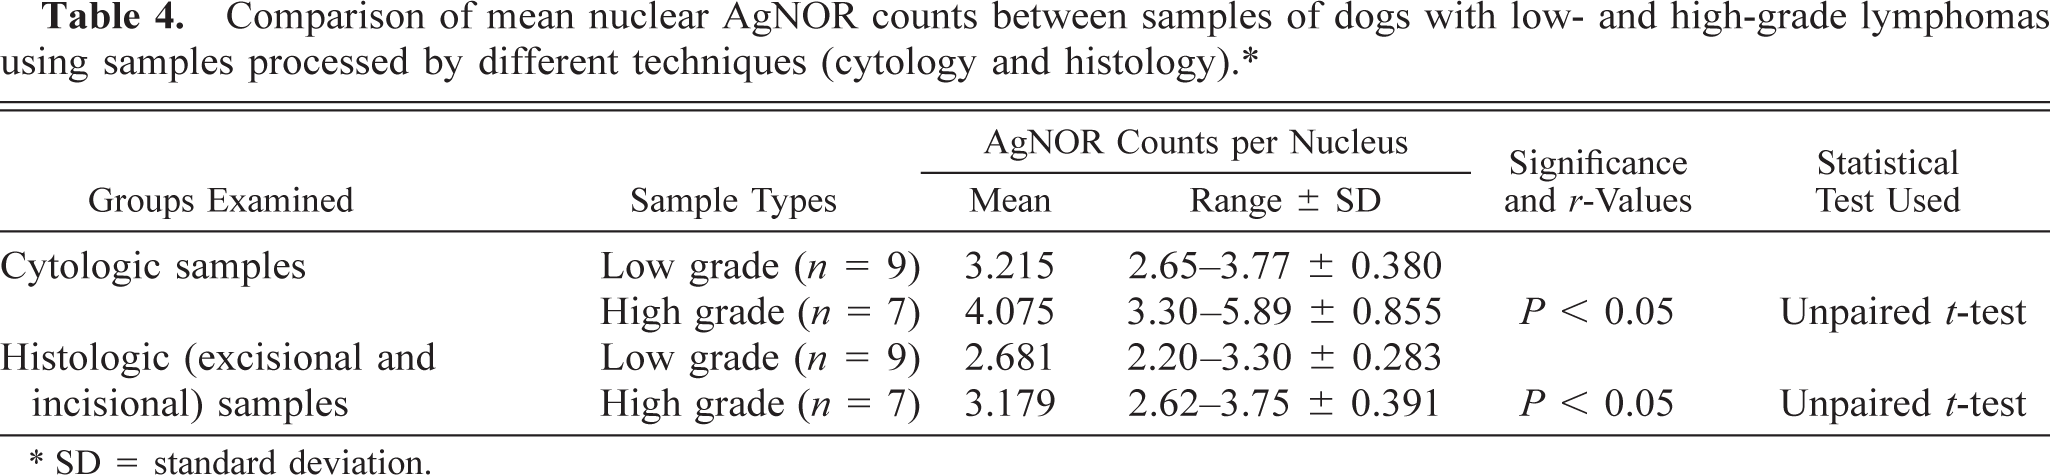
∗ SD = standard deviation.
Comparison of mean nuclear AgNOR counts between samples of dogs with low- and high-grade lymphomas processed by different techniques (cytology and histology).∗.
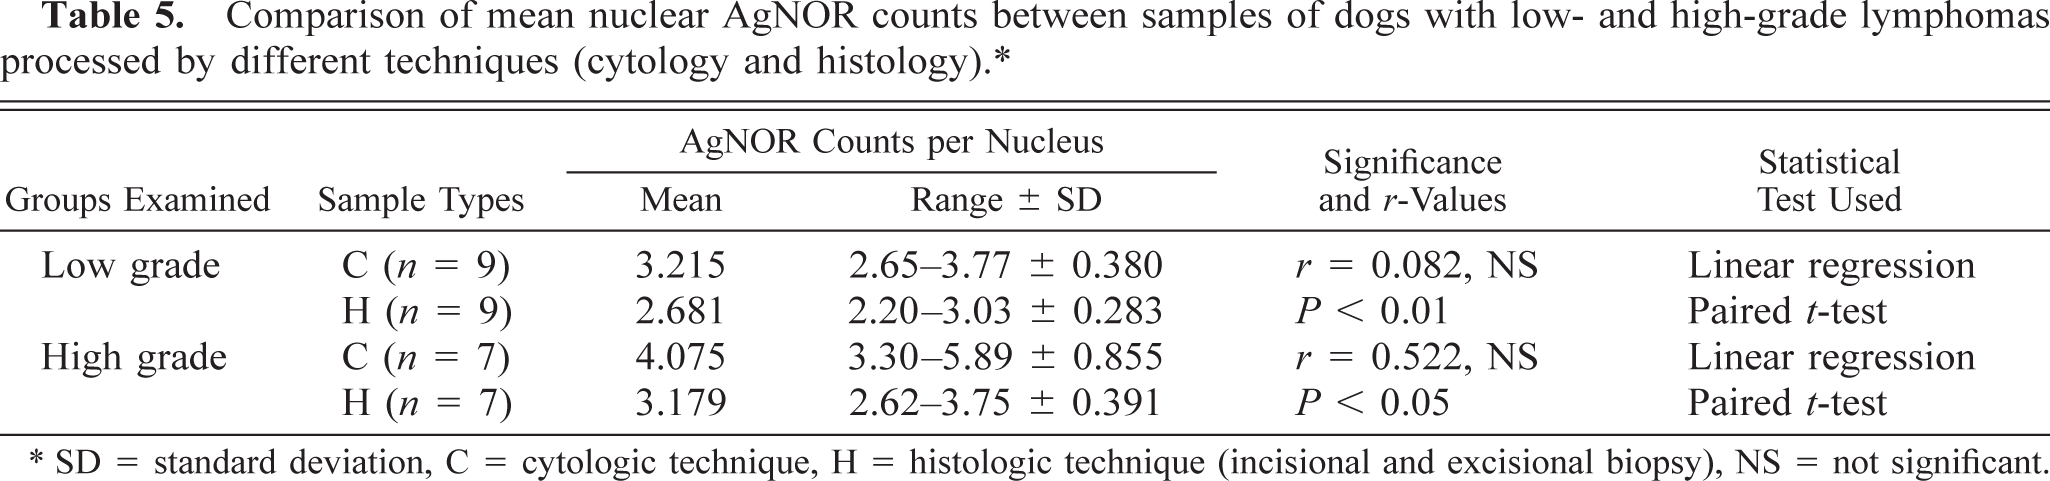
∗ SD = standard deviation, C = cytologic technique, H = histologic technique (incisional and excisional biopsy), NS = not significant.
Mean nuclear AgNOR counts in low- and high-grade lymphomas in cytologic and histologic specimens. AgNOR counts were significantly higher (P < 0.05) by cytologic examination than by histologic examination for both low- and high-grade lymphomas.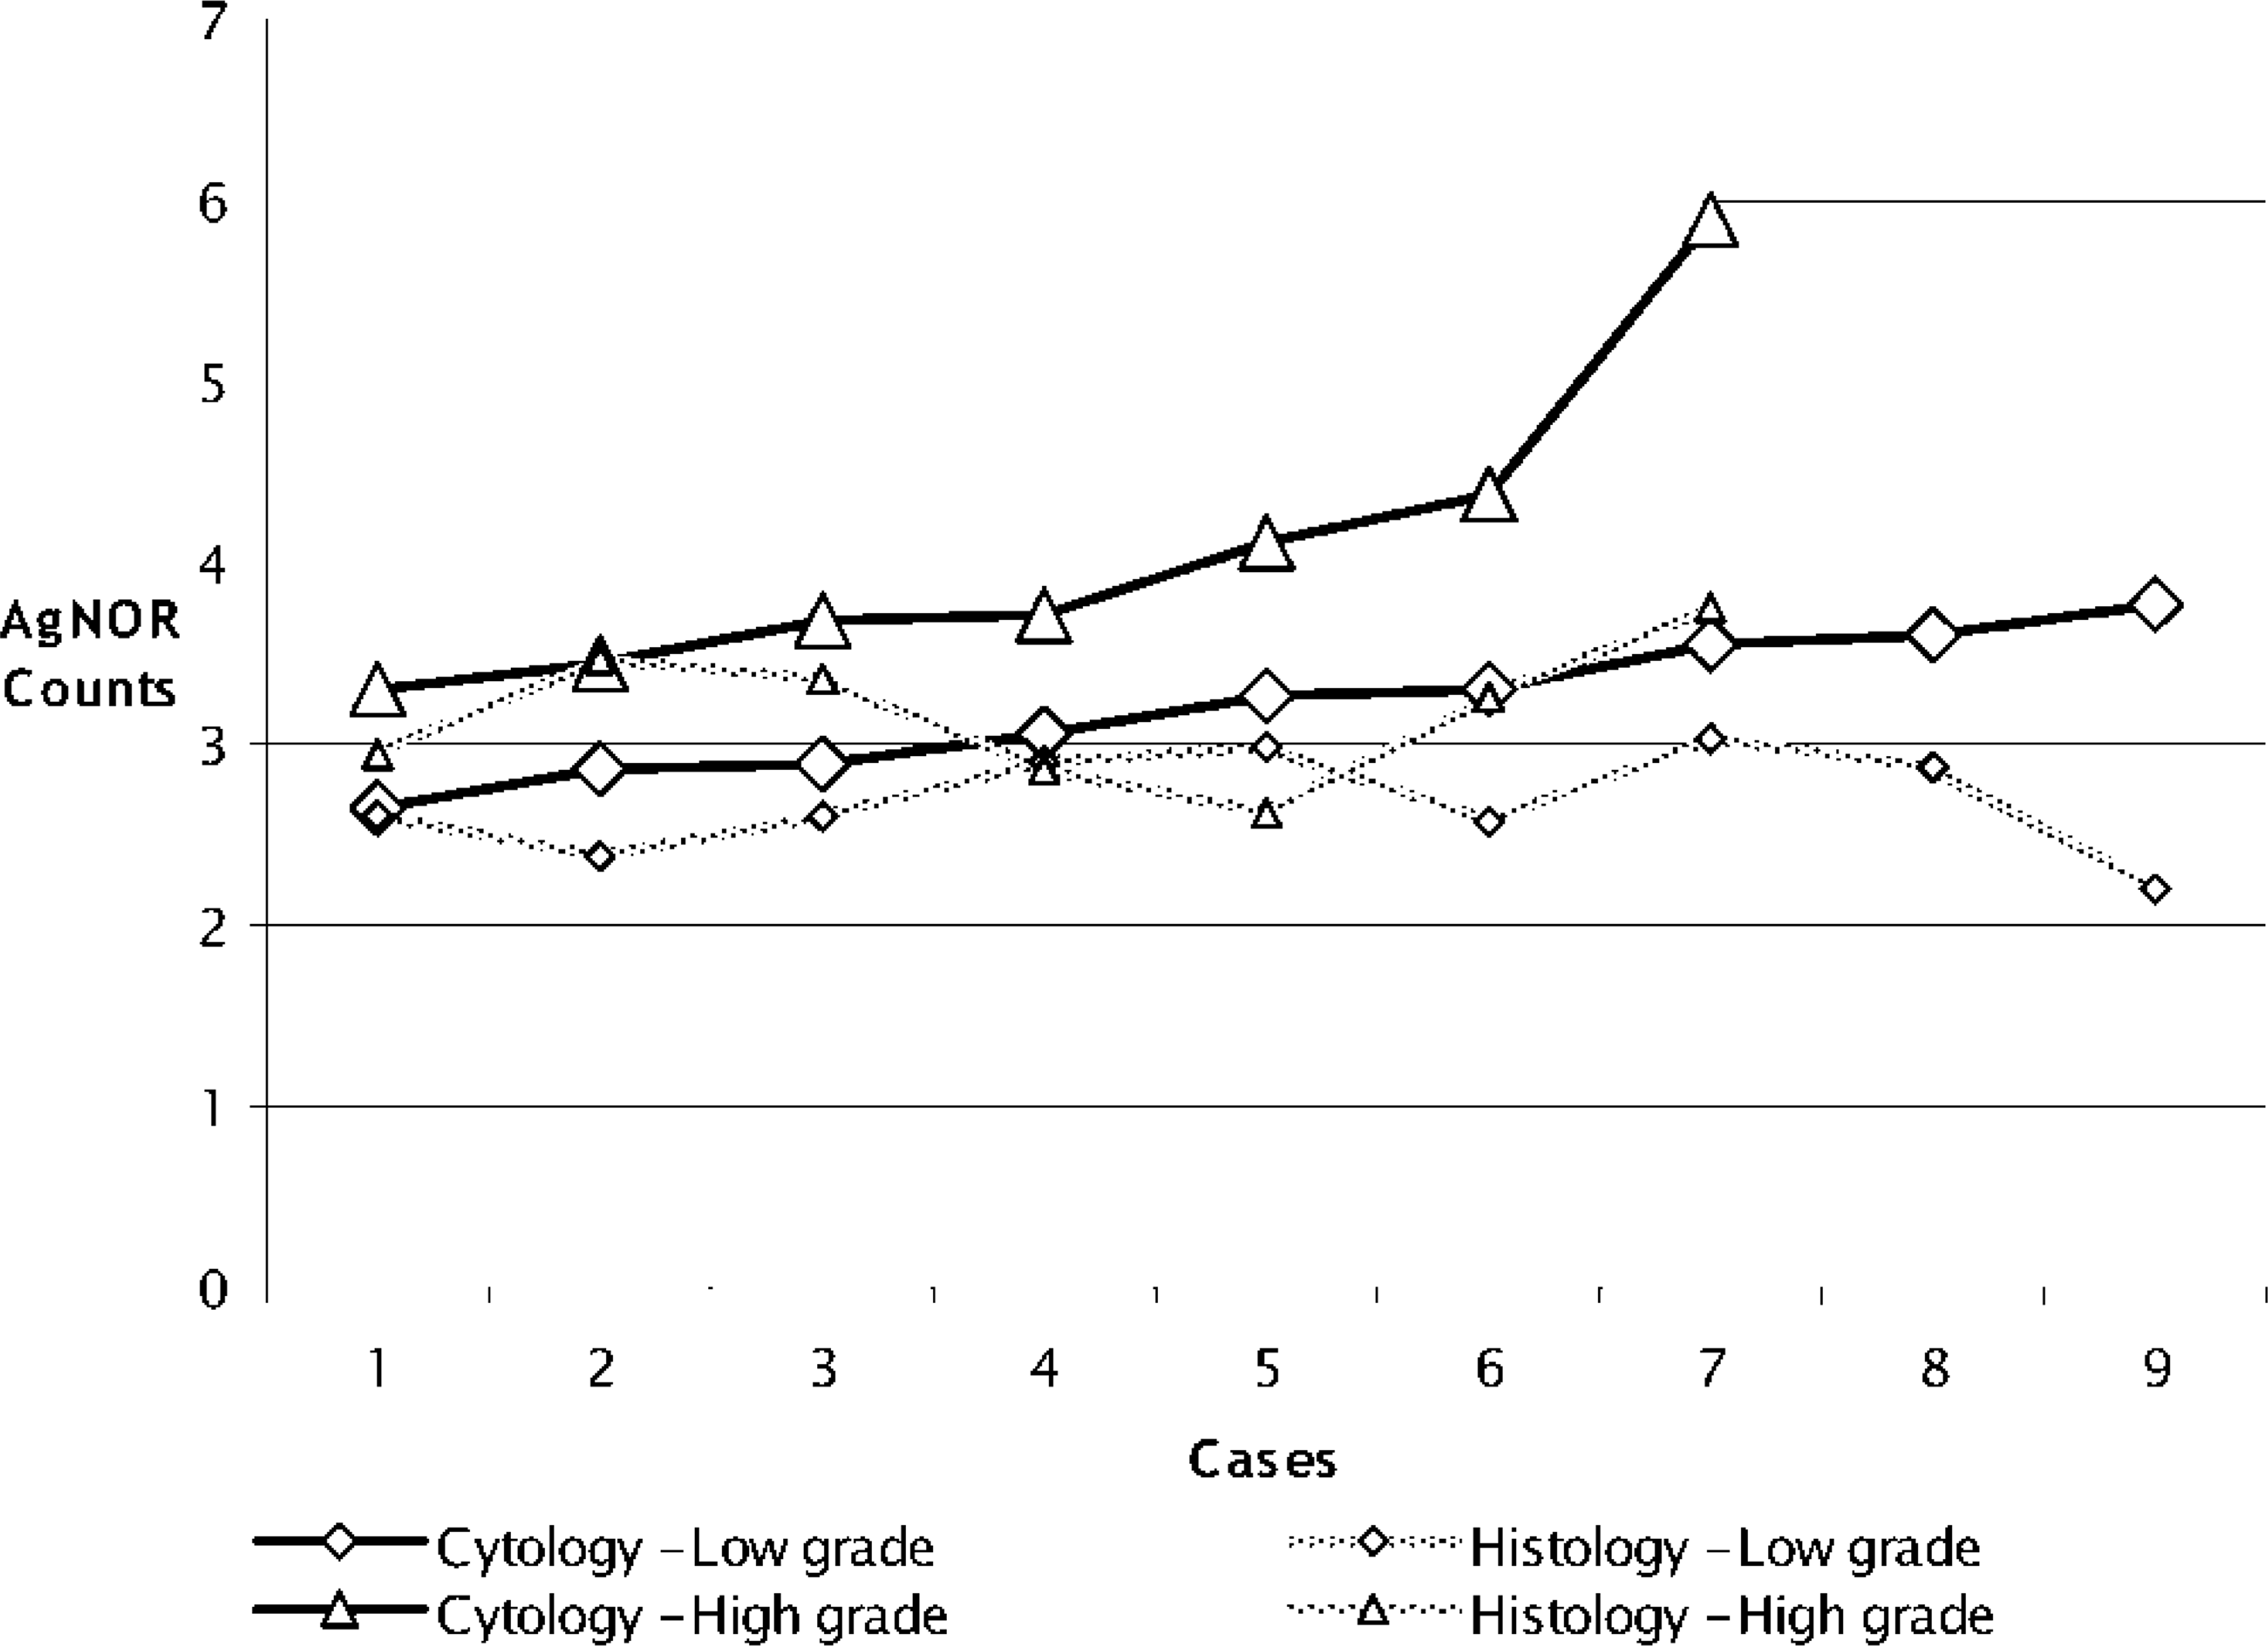
Linear regression analysis was performed to validate the relationship of the different sampling methods. If significant correlation was found between the AgNOR counts of cytologic and histologic sampling methods, it was interpreted to mean that the individual methods were satisfactory, that each could detect the same direction of change, and that their results were comparable. This was considered to be true even when there was significant difference between the average values.
In healthy control dogs, AgNOR frequency in cytologic samples and excisional lymph node biopsy samples showed no relationship. Thus, the AgNOR count results of the control dogs were not comparable for the two techniques (Table 2). However, comparing the values for dogs with lymphoma, a linear relationship was found between the samples processed by cytologic and histologic techniques. Although there was a significant difference between the actual values, the AgNOR counts were comparable whether they are obtained by cytologic or histologic technique. A conversion factor (average of method1/average of method2) allowed us to estimate the AgNOR counts of histologic samples from the AgNOR counts gained using the cytologic method (a factor of 1.22). Conversely, AgNOR counts using the cytologic method could be calculated by multiplying the histologic data by 0.81 (Table 2). In the case of dogs with lymphoma, there was no relationship between the AgNOR counts in specimens obtained by cytology or incisional biopsy (Table 3). Despite this, a linear relationship was found between samples obtained by excisional biopsy and cytologic techniques (Table 3). This means that these two sampling methods (cytology and excisional biopsy) are comparable, regardless of the difference between the average values. Moreover, results from one method can be converted to the other using a conversion factor. With respect to AgNOR frequency in low- or high-grade lymphomas, there was no relationship between samples processed by cytologic and histologic techniques; therefore, the results are not comparable (Table 5, Fig. 1).
Classification of the 26 cases according to Crocker's scheme showed that all samples from healthy dogs belonged to group 1, two samples from dogs with lymphoma belonged to group 2, and the majority of samples (n = 14) from dogs with lymphoma belonged to group 3.
Based on the Kolmogorov-Smirnov goodness-of-fit test, each group compared in the different analyses showed a normal distribution of values.
Discussion
This study compares the results obtained by AgNOR staining of cytologic versus histologic samples taken from the lymph nodes of clinically healthy dogs and dogs with high- and low-grade lymphomas. Such a comparison was justified by the fact that the AgNOR technique has been used for some years in the veterinary diagnostic practice for the evaluation of cytologic and histologic samples. 4,16,22,29 The AgNOR frequency is of prognostic interest for the estimation of both remission and survival time in the case of dogs with lymphoma treated with chemotherapy. 17,29 Our aim was to obtain an accurate statistical comparison of the AgNOR technique using different samples. We did not perform prognostic analysis because we lacked accurate remission and survival time data for the dogs with lymphoma.
In conformity with the results of earlier studies, the AgNOR counts obtained in cytologic and histologic (formalin fixed and paraffin embedded) samples of canine patients with lymphoma were higher than those in the control samples. 16,17,25,26,29 The increase of AgNOR frequency in lymphoma cases compared with the controls may be due to enhanced proliferation and the associated increased requirement for RNA synthesis. 6,7,16,19 In samples from healthy dogs examined in this study, the mean nuclear AgNOR counts using histologic processing fell within the range of 1.23–1.53 AgNORs per nucleus, which is similar to the value of 1.2 and 1.5 reported for humans by Yekeler et al. 32 and Crocker and Nar, 7 respectively. In lymphoma cases, the range of AgNORs per nucleus obtained for histologic samples was 2.20–3.75. This range was somewhat lower than the ranges of 4.4–6.8 and 3.3–5.7 reported by Crocker and Nar 7 in humans and Kiupel et al. 16 in dogs, respectively but closer to values (1.5–4.9) reported by Vail et al. 30 in dogs. In cytologic samples of dogs with lymphoma, our range (2.64–5.89) was slightly higher than that (1.7–5.3) reported by Vail et al. 30 The differences in mean AgNOR counts in these reports may result from differences in processing time, concentration or pH of formalin, deparaffinizing and rehydrating procedure, fixative, silver colloid solution preparation time, incubation period for argyrophilic staining, and efficacy of washing the silver stain from the samples. These methodological problems can result in decreased or increased staining, clumping of the separate AgNOR dots to form big aggregates, thus reducing the number of visible individual AgNORs, and formation of excess silver precipitate that can complicate analysis.
AgNOR counts per nucleus in samples derived from cytologic and histologic samples showed a strong correlation and linear relationship (r = 0.60) in samples of lymphoma cases but no correlation in controls. This lack of correlation in the lymph nodes of control dogs may be due to the very small average number of AgNORs per nucleus in healthy dogs. This relationship of AgNOR frequency between cytologic and histologic specimens in dogs with lymphoma was similar to that reported by Vail et al., 30 although they reported a closer correlation (r = 0.98).
In lymphoma patients, samples obtained by a cytologic method tend to have higher AgNOR counts than those obtained by histologic techniques. However, although Vail et al. 30 reported that there was a difference between the AgNOR frequency of cytologic samples and surgical biopsy samples (3.26 and 2.97, respectively; with a proportion of at least 0.5), they did not report a statistical analysis of this finding. The aforementioned values in this study were similar, 3.56 and 2.90, respectively, but the proportion was found to be different (0.81). Like Vail et al., 30 we also think that this is due to the fact that histologic sections are only 3 µm thick. Thus, only restricted regions of nuclei and the AgNORs they contain are seen in each section. In contrast, cytologic smears contain intact cells, with the entire cell nucleus and all AgNORs. A further possible explanation is that formalin fixation and the histologic embedding technique may cause structural changes in the NOR or in the NORAPs, as a result of which smaller AgNOR granules appear in the form of larger conglomerates. Cytologic sample preparation involves much milder cell treatment, consisting only of smearing, fixation, and staining. This would be expected to cause much milder ultrastructural changes; therefore, even smaller AgNORs are more easily distinguished.
With respect to the results gained by analyzing the two methods for obtaining surgical samples (incisional and excisional biopsy) and the cytologic technique, we found that there was no difference between the AgNOR counts obtained using the incisional or excisional technique. If we accept that the excisional biopsy sample is of higher quality than incisional biopsy samples and can be taken as “gold standard” with respect to AgNOR counts, it follows that the cytologic samples can also be used safely to detect AgNOR counts because there was significant linear relationship between the results of the two sampling methods. Nevertheless, the preparation of excisional biopsy samples requires surgical intervention and anesthesia, as well as a somewhat lengthy and expensive histologic preparation of samples. Especially in patients in advanced stages of lymphoma, excisional procedures may not be desirable. A solution might be provided by the incisional biopsy procedure that requires less time, equipment, and material. Obtaining incisional biopsy samples is relatively safe, but during sampling and processing by histologic techniques, samples are prone to damage, which can result in difficulty in routine examination and in AgNOR staining. On the other hand, the quality of cytologic smears usually does not deteriorate during processing, although sometimes cytologic specimens may suffer damage during sampling and smear preparation. However, because of the numerous drawbacks associated with incisional biopsy sample processing and because we found no relationship between the AgNOR counts of incisional biopsy and cytologic samples, we conclude that incisional biopsy samples are less suitable than cytologic specimens for the examination of lymph nodes, especially if the AgNOR method is used.
On separating the samples from dogs with lymphoma into low- and high-grade groups, we obtained results similar to those of Kiupel et al., 16 who found a significant difference in AgNOR frequency between low- and high-grade forms (3.3 and 5.7, respectively) by analyzing histologic sections, although our results revealed lower values (2.68 and 3.17, respectively). The significant difference in AgNOR frequency between the two grades has thus been proven using either a cytologic or histologic technique. With respect to both low- and high-grade samples, a significant difference was found between samples processed by histologic versus cytologic procedure. This means that AgNOR staining results using cytologic or histologic (formalin fixed and paraffin embedded samples) techniques are not identical, but both techniques are sensitive enough to differentiate between the lymphoma grades.
The nonneoplastic lymph nodes belonged to group 1 of Crocker's classification, whereas lymph nodes with lymphoma were categorized primarily as group 3. This finding is in accord with the findings reported by Crocker and Egan, 6 i.e., the higher the proliferative capacity of a cell, the more diffusely AgNORs appear within the nucleus.