
Abstract
The nonobese diabetic mouse is a model of spontaneous insulin-dependent diabetes mellitus. The present study made longitudinal observations of renal lesions in the acute-progressive phase of diabetic mice 0, 10, 20, 30, and 40 days after onset of diabetes without insulin therapy. Plasma creatinine and blood urea nitrogen concentrations gradually increased after onset of diabetes. Kidney weight increased and plateaued at day 20. Under electron microscopy the glomeruli demonstrated only mild changes on day 40. In the proximal tubules proliferating cell nuclear antigen-positive nuclei and nuclear divisions were increased on days 10 and 20. On day 40 of diabetes, increased periodic acid-Schiff-positive granules, confirmed as lysosomal dense bodies, increased neuronal nitric oxide synthase (nNOS) positive reaction, and decreased periodic acid-Schiff staining in the brush border were observed in the proximal straight tubules. In the juxtaglomerular apparatus stratified macula densa were decreased with time in diabetes compared with the findings on day 0, and this macula densa positively reacted with nNOS. No changes in renin levels were observed. In addition, apoptotic cells were not detected. In conclusion, this research represents the first thorough characterization of acute changes in nonobese diabetic mouse kidneys. The results demonstrated renal hypertrophy and slight glomerular injury in early stages and structural alteration of the proximal straight tubules at later stages during the acute phase of diabetes. Furthermore, increased nNOS may represent one of the pathogenic factors of diabetic nephropathy.
Keywords
The nonobese diabetic (NOD) mouse is an established model of spontaneous insulin-dependent diabetes mellitus (IDDM). 8 , 20 This strain was derived from the Jcl:ICR cataract mouse at Shionogi Aburai Laboratories, Japan. The incidence of IDDM among NOD mice is dependent on autoimmune pathogenesis and is higher in females than in males. 23 , 46 The mode of transmission includes a recessive gene in the major histocompatibility complex. 7 , 12 , 21 After onset of diabetes, pathologic changes in the NOD mouse resemble those in human IDDM. 34
Diabetic nephropathy (DN) is a major complication of diabetes mellitus and is one of the main causes of death among humans, dogs, and cats. 2 , 10 , 24 , 26 , 44 In IDDM numerous pathologic investigations of DN have been performed using streptozotocin-treated animals or spontaneous animal models such as the NOD mouse. 9 , 14 , 36 , 37 Complications of various pathogenic factors of DN have been demonstrated using these animal models. Glomerular sclerosis is classically known as a major pathologic change of DN, involving proliferation of mesangial cells, expansion of the mesangium, or thickening of the glomerular basement membrane. 9 , 14 , 22 , 29 , 33 These glomerular changes frequently develop in the chronic phase of diabetes. The other major change of DN is renal hypertrophy. 15 , 38 This change often develops in the early phase of diabetes. Furthermore, a recent study demonstrated the relationship between decreased levels of neuronal nitric oxide synthase (nNOS) and renal hypertrophic mechanisms in the early phase of IDDM. 16 In the kidney nNOS localizes in the macula densa (MD), 3 , 25 , 32 with a primary role of suppressing renin secretion from juxtaglomerular cells. 6 In STZ-treated rats structural alteration of the MD and enhancement of renin messenger ribonucleic acid expression have been demonstrated in the early phase of IDDM. 30 , 47
These previous reports using animal models have made a large contribution to clarification of the pathogenesis of DN in the early and chronic phases of IDDM. However, in the acute-progressive phase of IDDM, renal pathologic changes and their pathogenesis have remained unclear. If animals are maintained without insulin therapy because their first clinical signs of IDDM were overlooked, such as polyposia or polyuria, constitutional complications such as cataracts, loss of body weight, ketosis, and neuropathy progress rapidly. The NOD mouse is an appropriate model for such clinical situations. Without insulin therapy, constitutional symptoms become acutely aggravated, and death occurs within 6 weeks. 34 The present study, therefore, maintained NOD mice without insulin therapy to develop the acute phase of diabetes and assessed the resulting kidney damage according to blood chemical, histologic, cytologic, and morphometric parameters. Moreover, immunohistochemical analysis of proliferating nuclear antigen (PCNA), renin, and nNOS, and in situ detection of apoptosis were performed to investigate the relationship between pathogenic factors and the incidence of DN in the acute phase of IDDM.
Materials and Methods
The study was performed in accordance with the Guidelines for Animal Experimentation of the Faculty of Medicine and Agriculture, Kagoshima University, Japan.
Animals
Female NOD/Shi Jic and female Jcl:ICR (wild type) mice were used for the experiment. Animals were bred and maintained at the Institute of Laboratory Animal Science of the Faculty of Medicine, Kagoshima University, Japan, where they were housed in a temperature-controlled environment (temperature 22 ± 1%; humidity 55 ± 10%; light period 7:00 a.m. to 7:00 p.m.; ventilation 12 cycles/hour). Mice were fed an autoclaved commercial diet (CE-2; Japan CLEA, Inc., Japan) and were provided access to tap water ad libitum. Onset of diabetes was determined by the appearance of glycosuria, the presence of which was tested in each animal every day using diagnostic papers (HI-TESPER-G; Eiken Chemical, Inc., Japan). When urine samples from a mouse tested positive for 2 consecutive days, diabetes was diagnosed. In our colony the cumulative incidence of overt diabetes was over 80% at the age of 30 weeks.
Mice were separated into the following groups: 1) diabetic NOD groups, days 0, 10, 20, 30, and 40 of diabetes (mean age of onset of diabetes, 154 ± 40 days), 2) control group (nondiabetic NOD), 6-month-old NOD mice with no glycosuria, and 3) wild-type group, 6-month-old ICR mice. Each group comprised 4 mice. Day 0 of diabetes was defined as the day on which the 2nd consecutive daily test for glycosuria was positive.
Mice were sacrificed by exsanguination from carotid arteries under anesthesia, using a mixture of ketamine and medetomidine. Kidneys were then quickly removed.
Tissue preparation
Central slices from the right and left kidneys, including the hilum, were cut perpendicular to the long axis of the kidney. Slices from the left kidney were fixed in 10% neutral-buffered formalin at room temperature. Slices from the right kidney were fixed in Zamboni's solution for 2 days at 4 C. After routine embedding in paraffin, 3-μm-thick sections (including the elongate renal papillae) were selected every 30 μm or serially. After deparaffinization formalin-fixed sections of the left kidney were stained using hematoxylin and eosin, periodic acid–methenamine-silver and periodic acid–Schiff (PAS). Sections of the right kidney fixed in Zamboni's solution were used for PAS staining, immunohistochemistry, and in situ detection of apoptosis.
Immunohistochemical procedures were as follows: 1) deparaffinization and rehydration, 2) treatment with 0.3% H2O2 in methanol for 30 minutes, 3) washing in 0.01 M phosphate-buffered saline ([PBS], pH 7.4), 4) incubation with normal goat serum for 60 minutes, 5) incubation with each antibody overnight at 4 C, 6) washing in PBS, 7) incubation with biotinylated secondary antibody for 40 minutes, 8) washing in PBS, 9) incubation with peroxidase-conjugated avidin–biotin complex (Elite ABC kit; Vector Laboratories, Inc., USA) for 30 minutes, 10) washing in PBS, 11) observation of the reaction with 3,3′-diaminobenzidine (0.25 mg/ml)–H2O2 (0.003%) in PBS, and 12) stopping the reaction in distilled water. The sections were counterstained with hematoxylin. Primary antibodies used were 1) PCNA, mouse monoclonal antibody antirecombinant PCNA (PC10; Oncogene Research Products, Inc., USA) diluted 1:400, 2) nNOS, rabbit antiserum anti-human nNOS (Cayman Chemical, Co., USA) diluted 1:1,500, and 3) renin, rabbit antiserum antirecombinant renin (supplied by Dr. Kazuo Murakami, University of Tsukuba), diluted 1:10,000. Secondary antibodies used were 1) biotinylated goat anti-mouse immunoglobulin G (IgG) (H + L) (Vector Laboratories, Inc., USA), diluted 1:200 for PCNA, and 2) biotinylated goat anti-rabbit IgG (H + L) (Vector Laboratories), diluted 1:200 for nNOS and renin. Sections for PCNA and nNOS were applied using microwaves in distilled water, to retrial each antigen, after deparaffinization.
Apoptosis was detected using an Apop Tag in situ apoptosis detection kit (Oncor, Inc., USA). Following the procedure described by the manufacturer, sections were subjected to direct immunoperoxidase detection of digoxigenin-labeled DNA. Jejunum sections from fusarenon-X–administrated ICR mouse (supplied by Dr. Tsutomu Shimizu, University of Kagoshima) were used as positive controls for apoptotic cells.
Cytologic observations were performed on day 40 of diabetes. From all the right kidneys used in the study, small sections of approximately 1-mm thickness were cut from the cortex and outer medulla and fixed in a mixture of 2.5% glutaraldehyde and 2% paraformaldehyde in 0.1 M phosphate buffer ([PB], pH 7.4) for 2 hours at 4 C. After washing in cold PB, the specimens were postfixed in 1% osmium tetroxide in PB for 2 hours at 4 C and then dehydrated through a graded ethanol series and embedded in epoxy resin. Ultra-thin sections cut from an epoxy resin block were stained using uranyl acetate and lead citrate or applied to the performic acid–phosphotungstic acid (PFP) reaction. 11 These sections were observed under a transmission electron microscope (H-7000KU, Hitachi, Inc., Japan).
Morphometry
Five formalin-fixed sections from each animal stained with PAS were used for the following 2 parameters. Quantification was performed at random according to previous reports.
40
,
42
Diameter of the renal corpuscles. Five cortical renal corpuscles with the vascular pole or the urinary pole (or both) were selected at random in each section. The line connecting the vascular pole to the urinary pole was taken as the vertical axis of the renal corpuscle, and the widest distance along the cross axis of the glomerular capsule at a right angle to the vertical axis was regarded as the diameter of the renal corpuscle.
Number of PAS-positive granules of the proximal straight tubules (PSTs). Light micrographs of five sections of each animal were taken at a primary magnification of 200× and printed at a final magnification of 1,000×. The area of PST in the photograph, which excludes the area of the brush border, was measured on a graphics tablet (UD-1212 II; Wacom, Inc., Japan) using the NIH image software program. Granules were then counted within the area of measurement of PST, and the ratio of granule number to measurement area (number/10,000 μm2) was calculated for each animal.
Immunostained sections (3 sections per animal) were used for the following parameters:
Number of PCNA-positive nuclei of the proximal tubule (PT) cells. Total number of PCNA-positive nuclei of the PT cells was counted for each section, and the mean value was determined for each animal.
Percentage of stratified MD. Number of stratified MD and total number of MD were determined for each section. The ratio of stratified MD to total number of MD was calculated for each animal. MD cells were identified by a positive reaction for nNOS.
Number of renin-positive areas. Quantification of renin-positive areas was performed according to the procedures described by Oliverio
28
and Yabuki.
39
In brief, total number of renin-positive areas with immunostained sections and total number of renal corpuscles with PAS-stained sections (serial with immunostained sections) were determined, and number of renin-positive areas was expressed per 100 renal corpuscles.
Measurement of blood chemicals
Blood samples were collected in sampling tubes containing 1 mg of ethylenediaminetetraacetic acid (EDTA) and 1,000 units of kallikrein inhibitor aprotinin (Bayer Leverkusen, Inc., Germany). Plasma was obtained by centrifugation (4,000 rotations per minute [rpm] for 10 minutes at 4 C) and stored at −20 C until use. Plasma concentrations of creatinine and blood urea nitrogen (BUN) were measured with a spectrophotometer (U-1500; Hitachi) according to Jaffe's method using a creatinine test kit (Wako Pure Chemical, Inc., Japan) and the urease-indophenol method using a nitrogen-B test kit (Wako Pure Chemical), respectively.
Statistics
Results were regrouped and expressed as the mean ± standard error (SE) for each group and tested using a 1-way analysis of variance ([ANOVA], Dunnett test). Statistical significance was accepted at P < 0.05.
Results
Plasma levels and kidney weights
Plasma creatinine and BUN concentrations increased gradually after onset of diabetes (Figs. 1, 2). Wet kidney weights increased after onset and reached a plateau by day 20 of diabetes (Fig. 3).
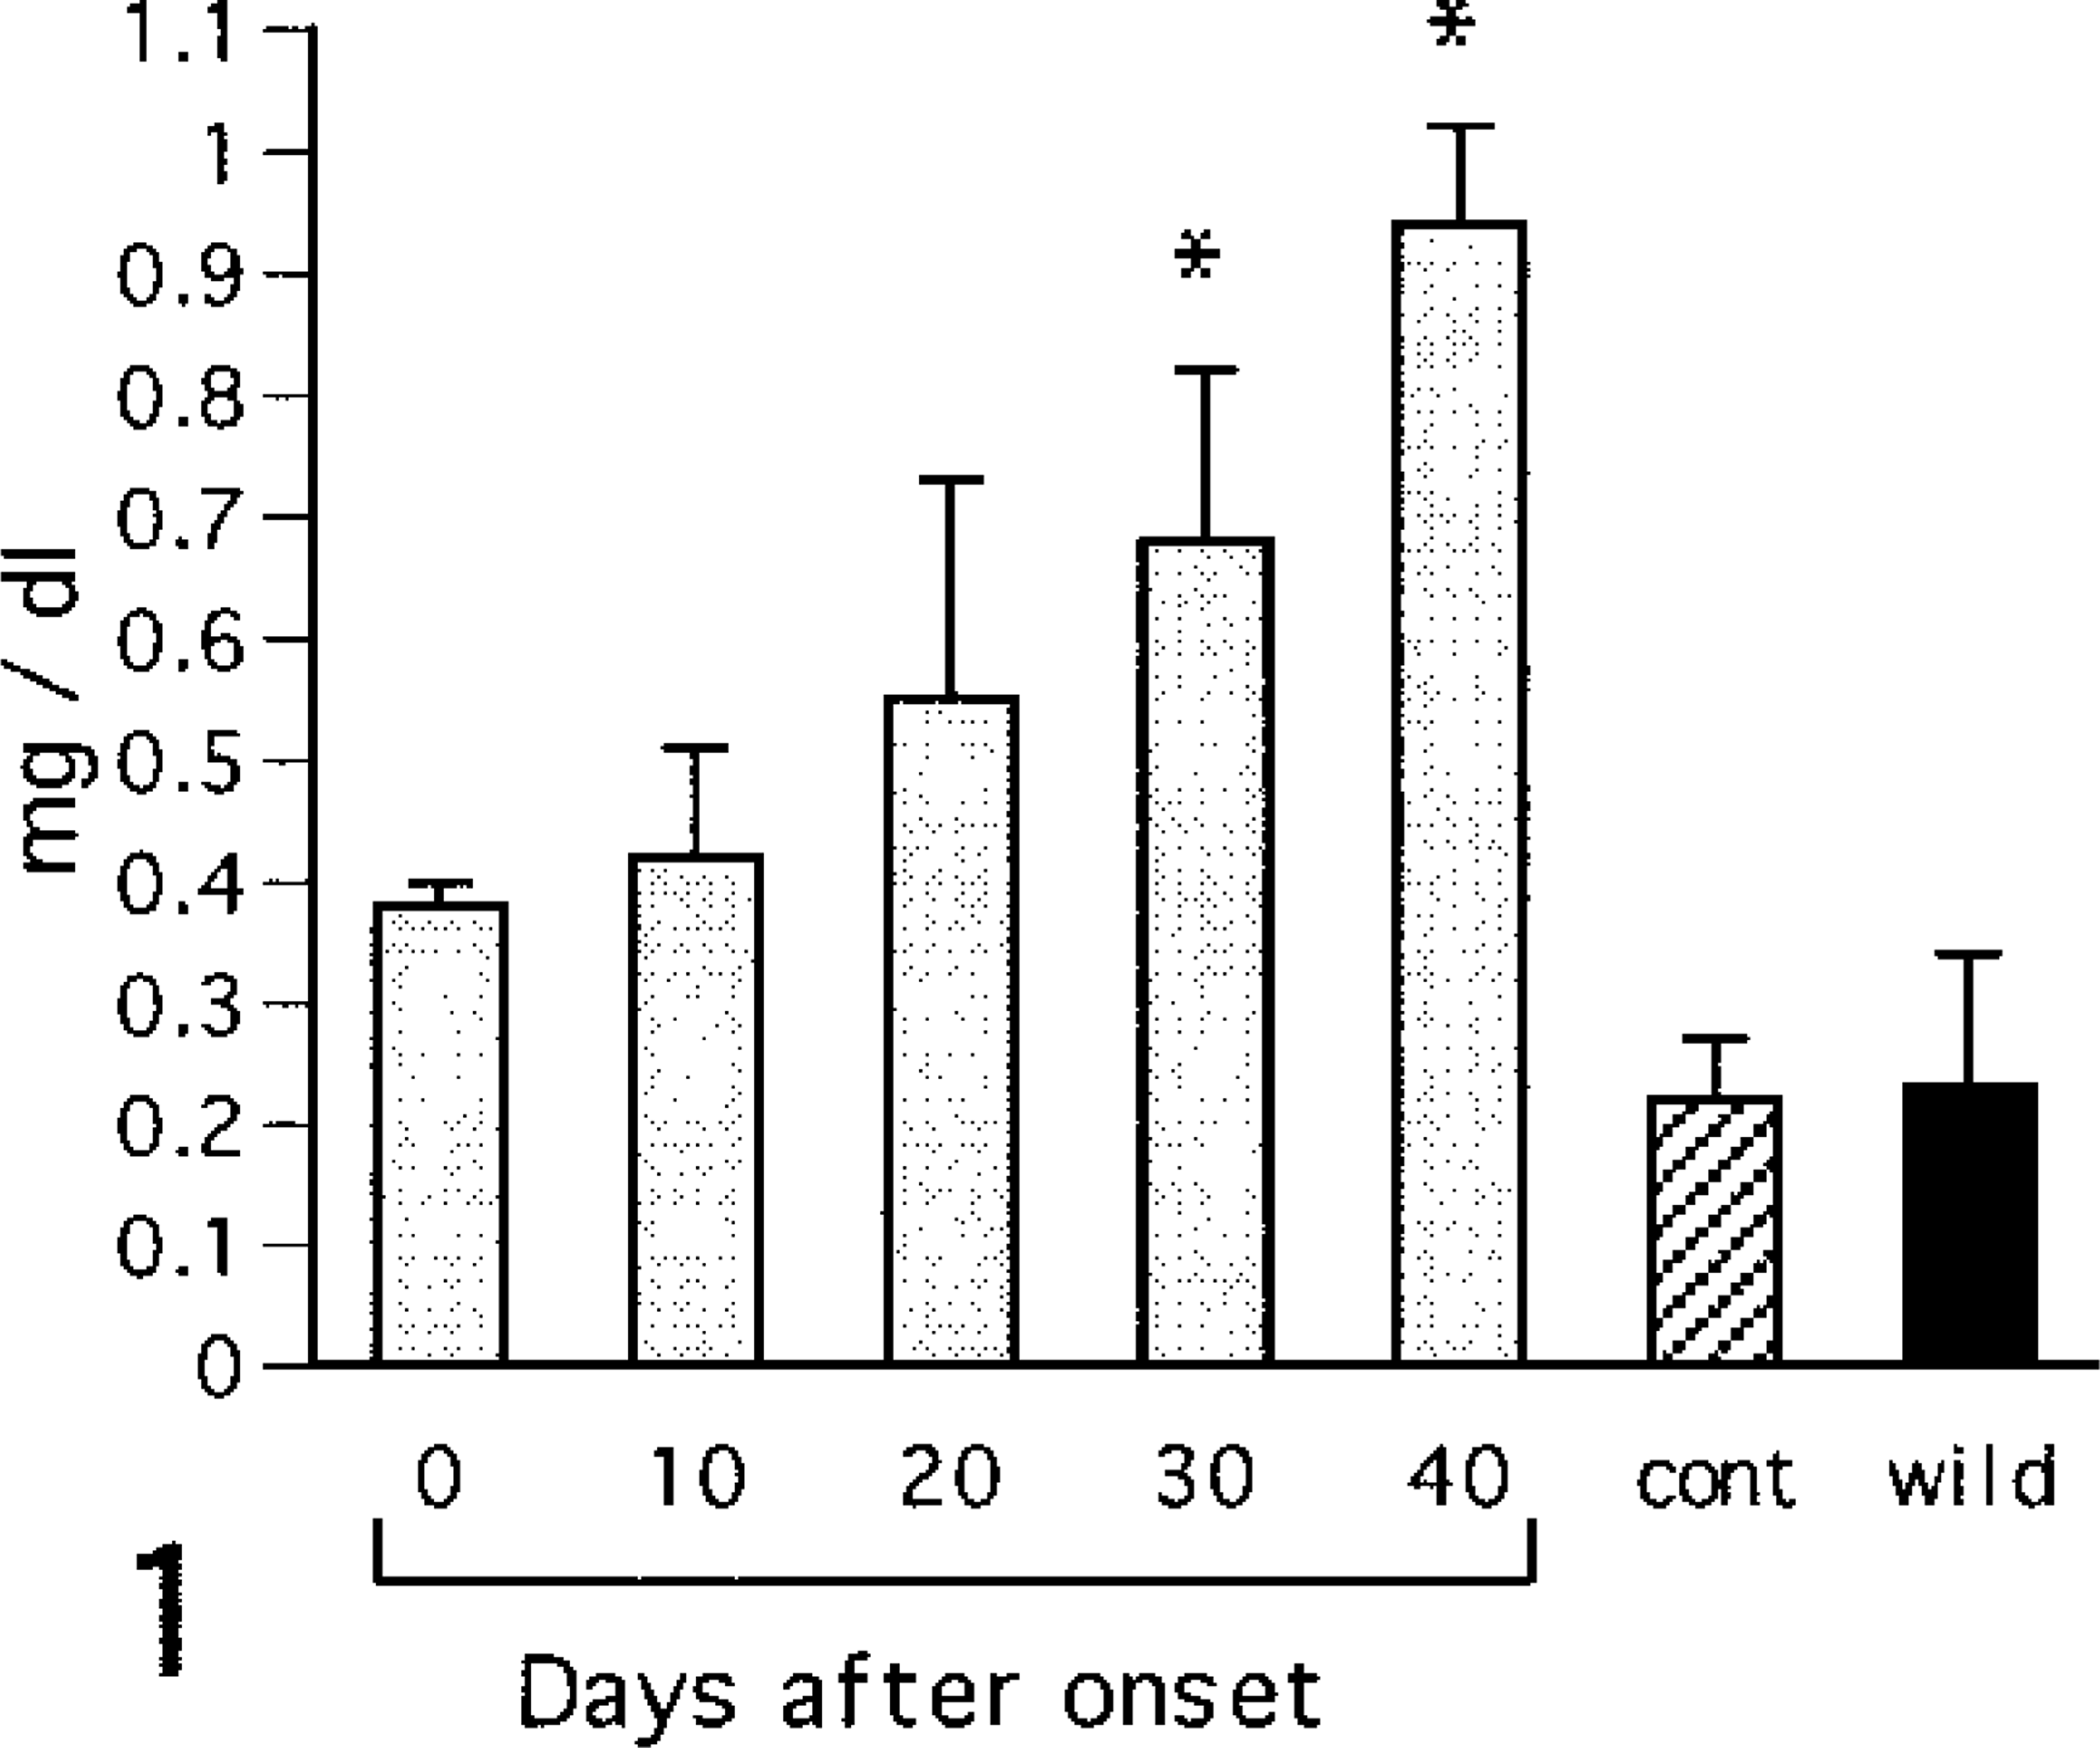
Changes in serum levels. Creatinine.
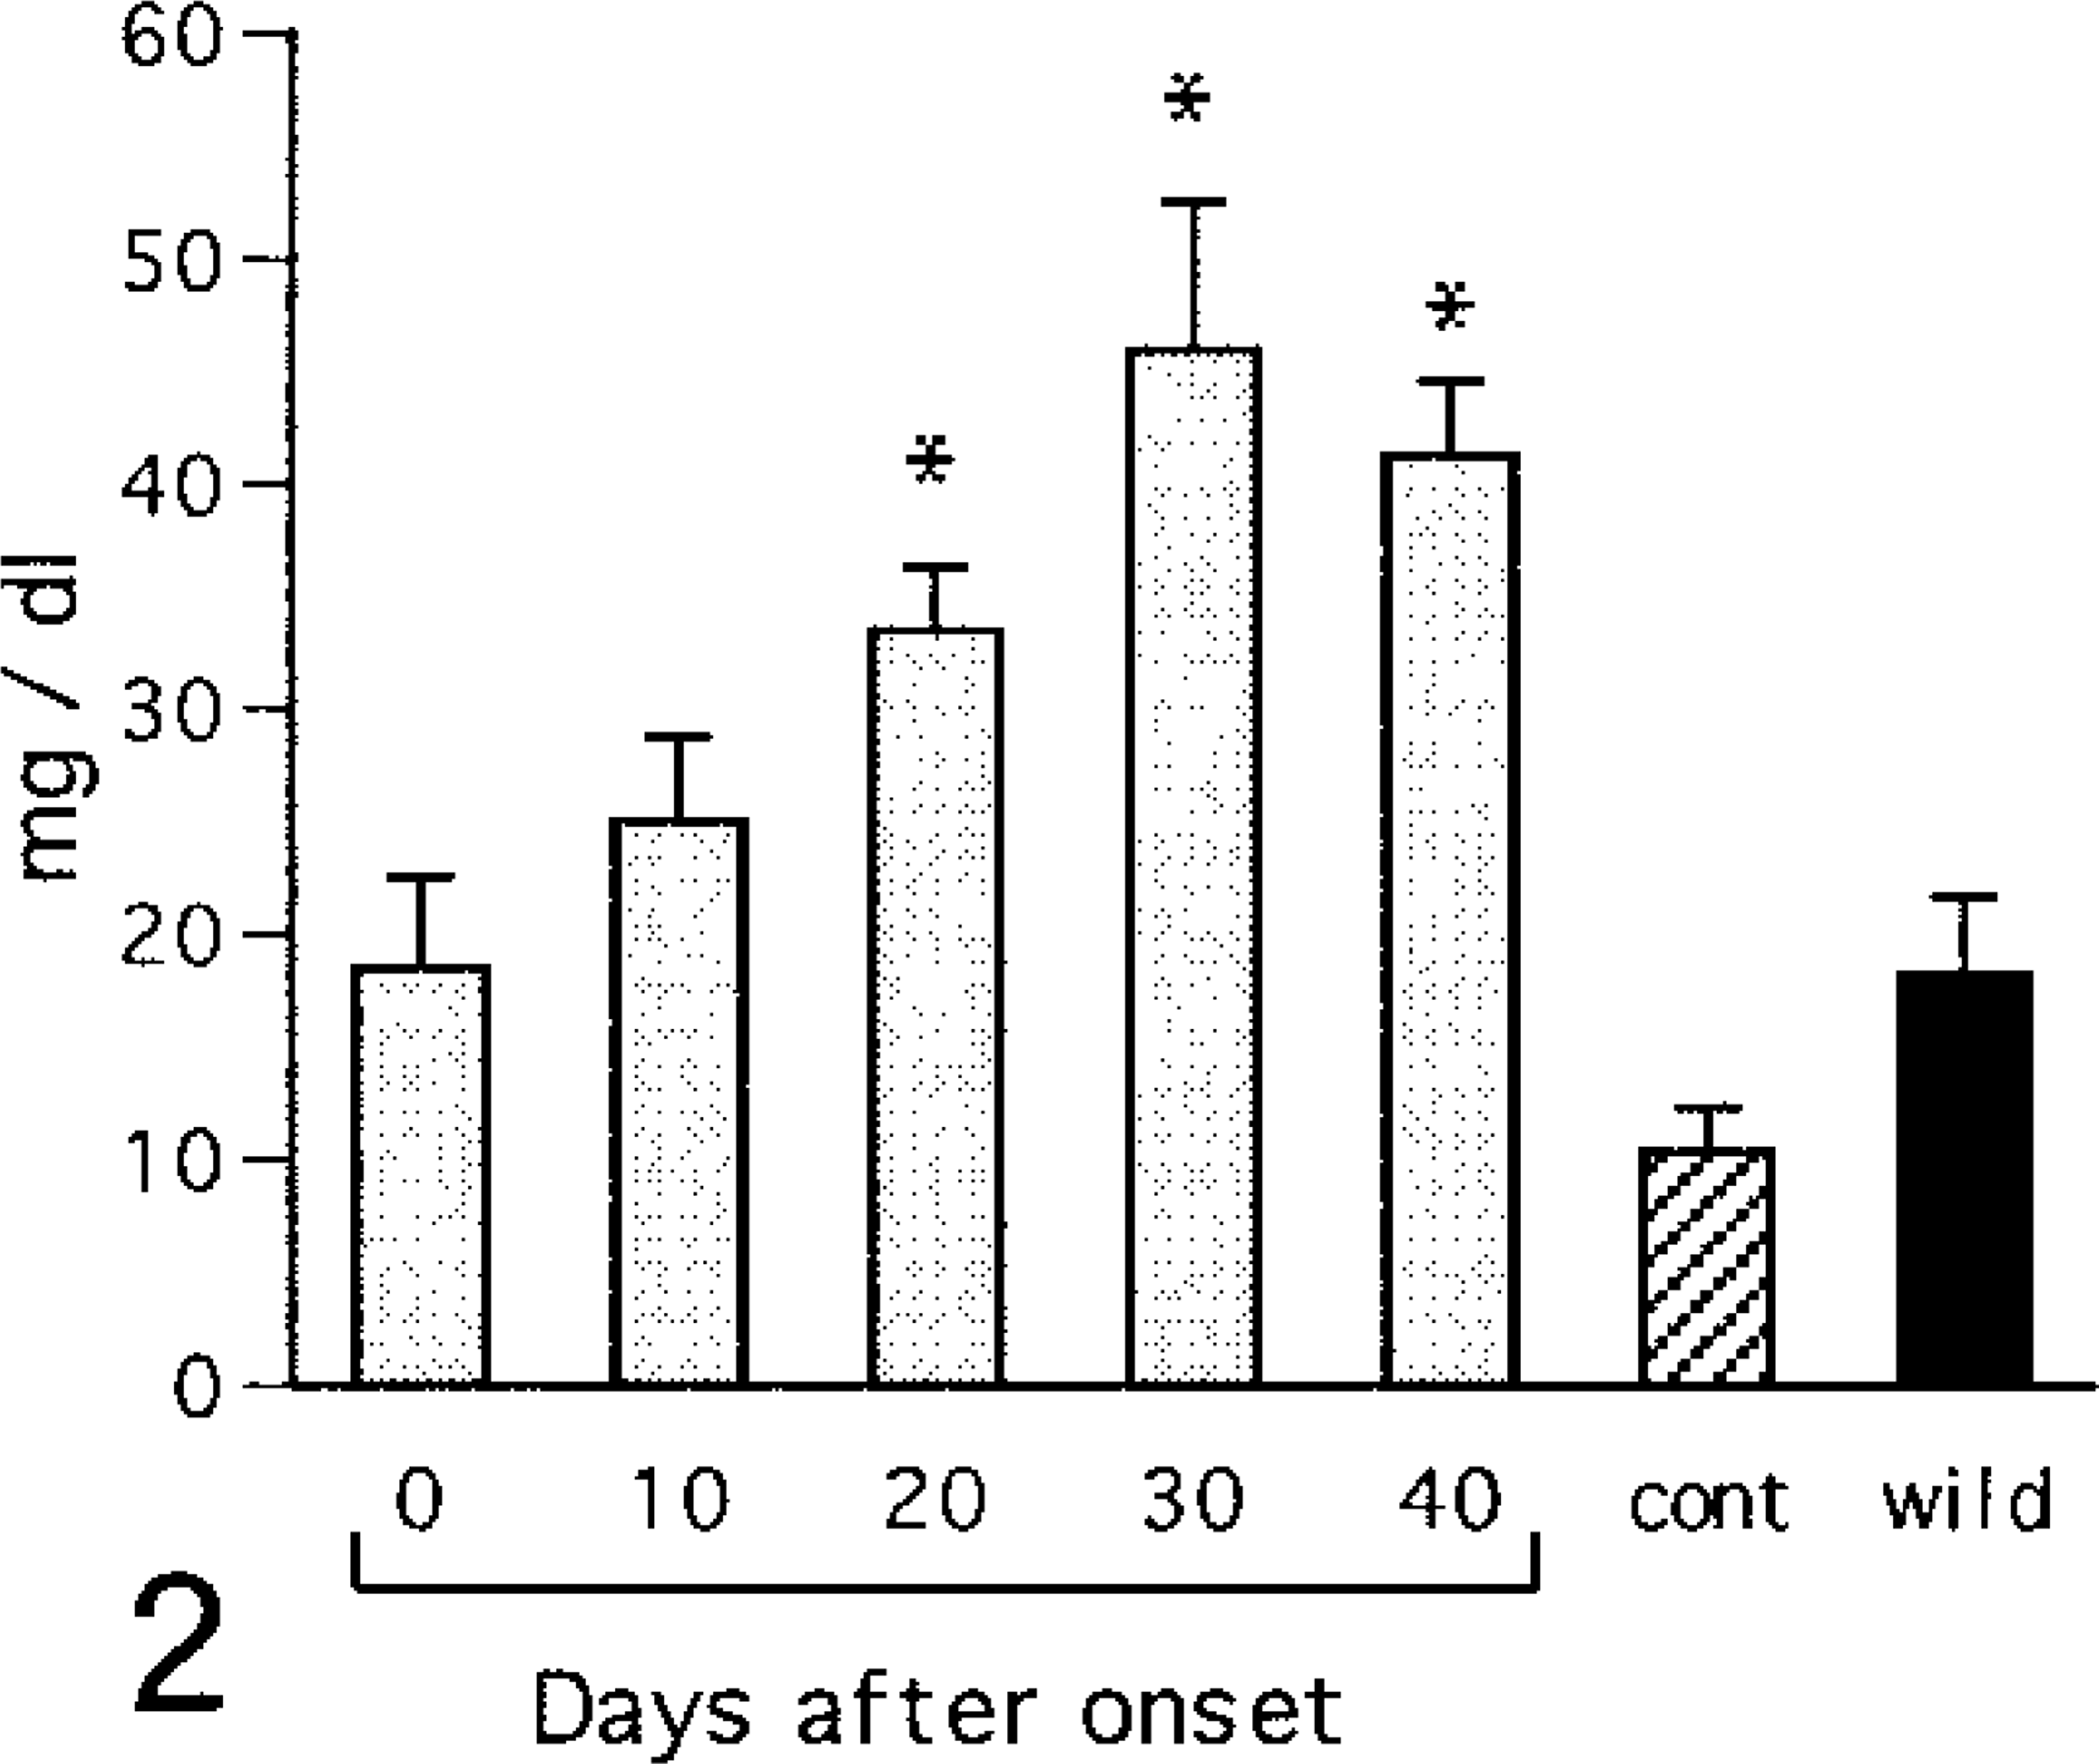
Changes in serum levels. BUN. cont = control (6-month-old NOD mice with no glycosuria); wild = wild type (6-month-old ICR mice). Values are mean ± SE. ∗ = vs. control (ANOVA, P < 0.05).
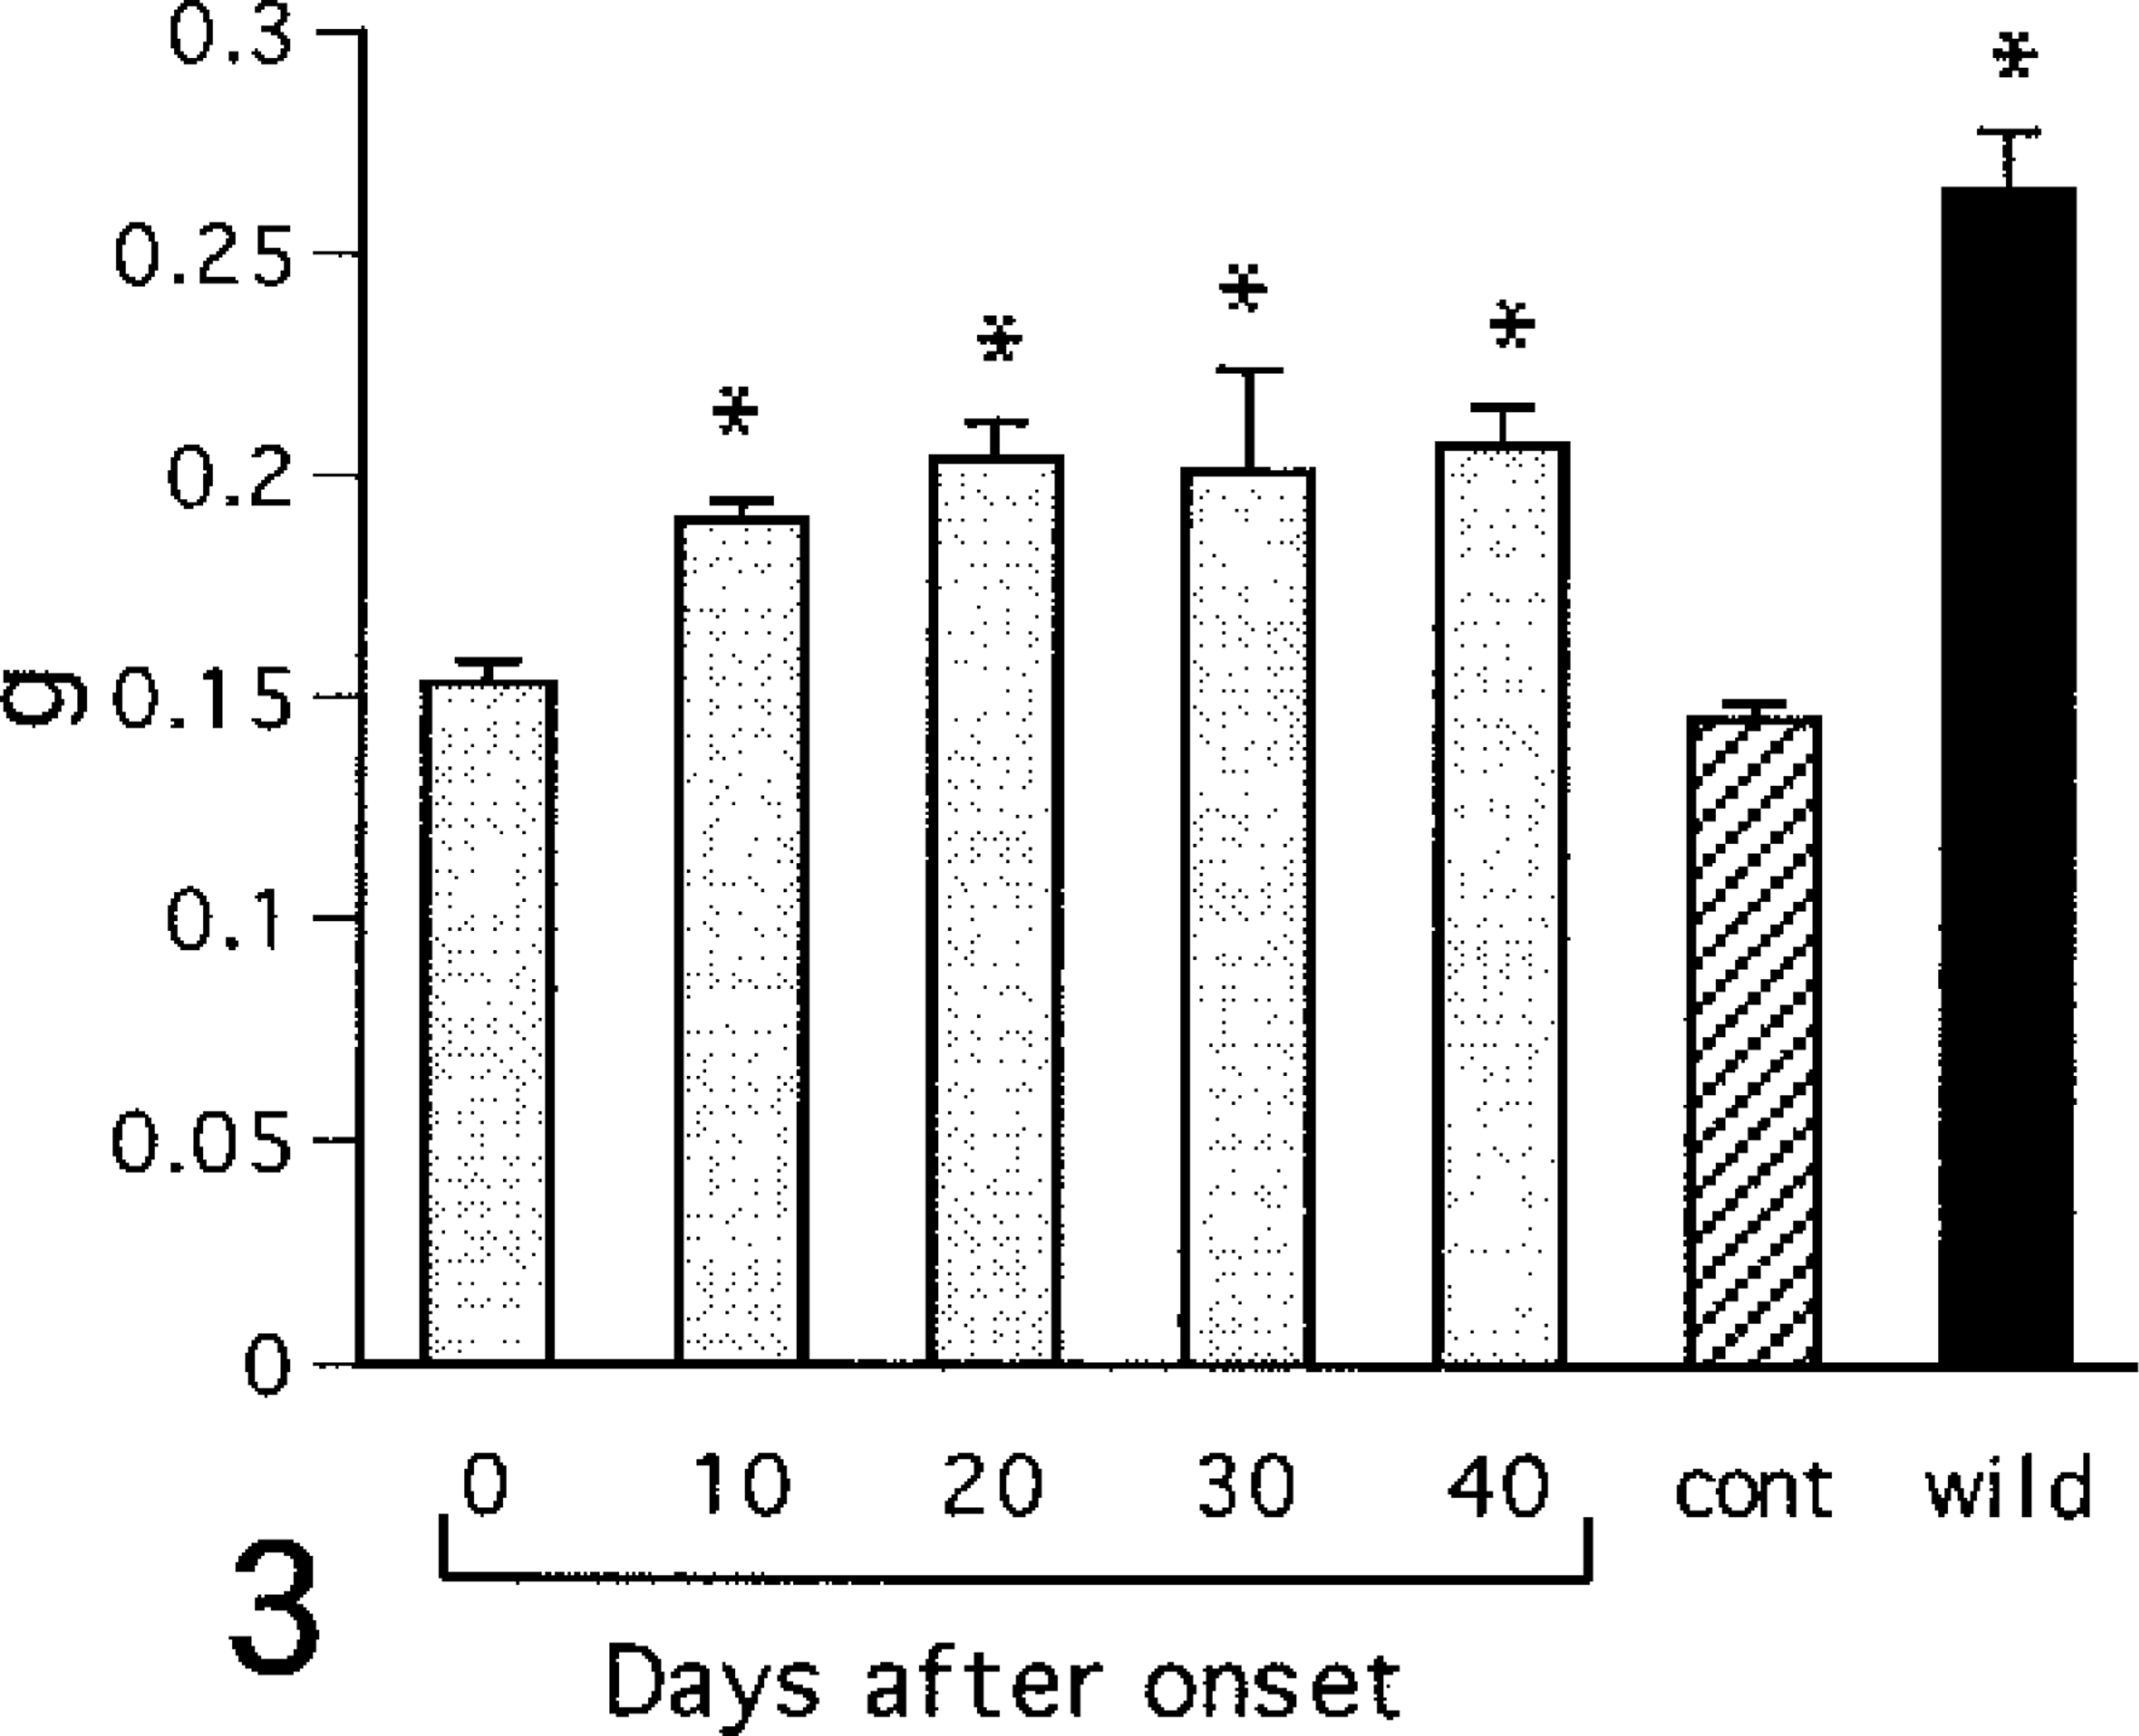
Changes in wet kidney weights. cont = control (6-month-old NOD mice with no glycosuria); wild = wild type (6-month-old ICR mice). Values are mean ± SE. ∗ = vs. control (ANOVA, P < 0.05).
Light microscopic observations
In the renal corpuscles obvious pathologic changes were not observed until day 40 of diabetes. The diameters of renal corpuscles slightly increased in the early stages of diabetes, whereas they did not differ significantly from controls throughout the experimental period (Fig. 4).
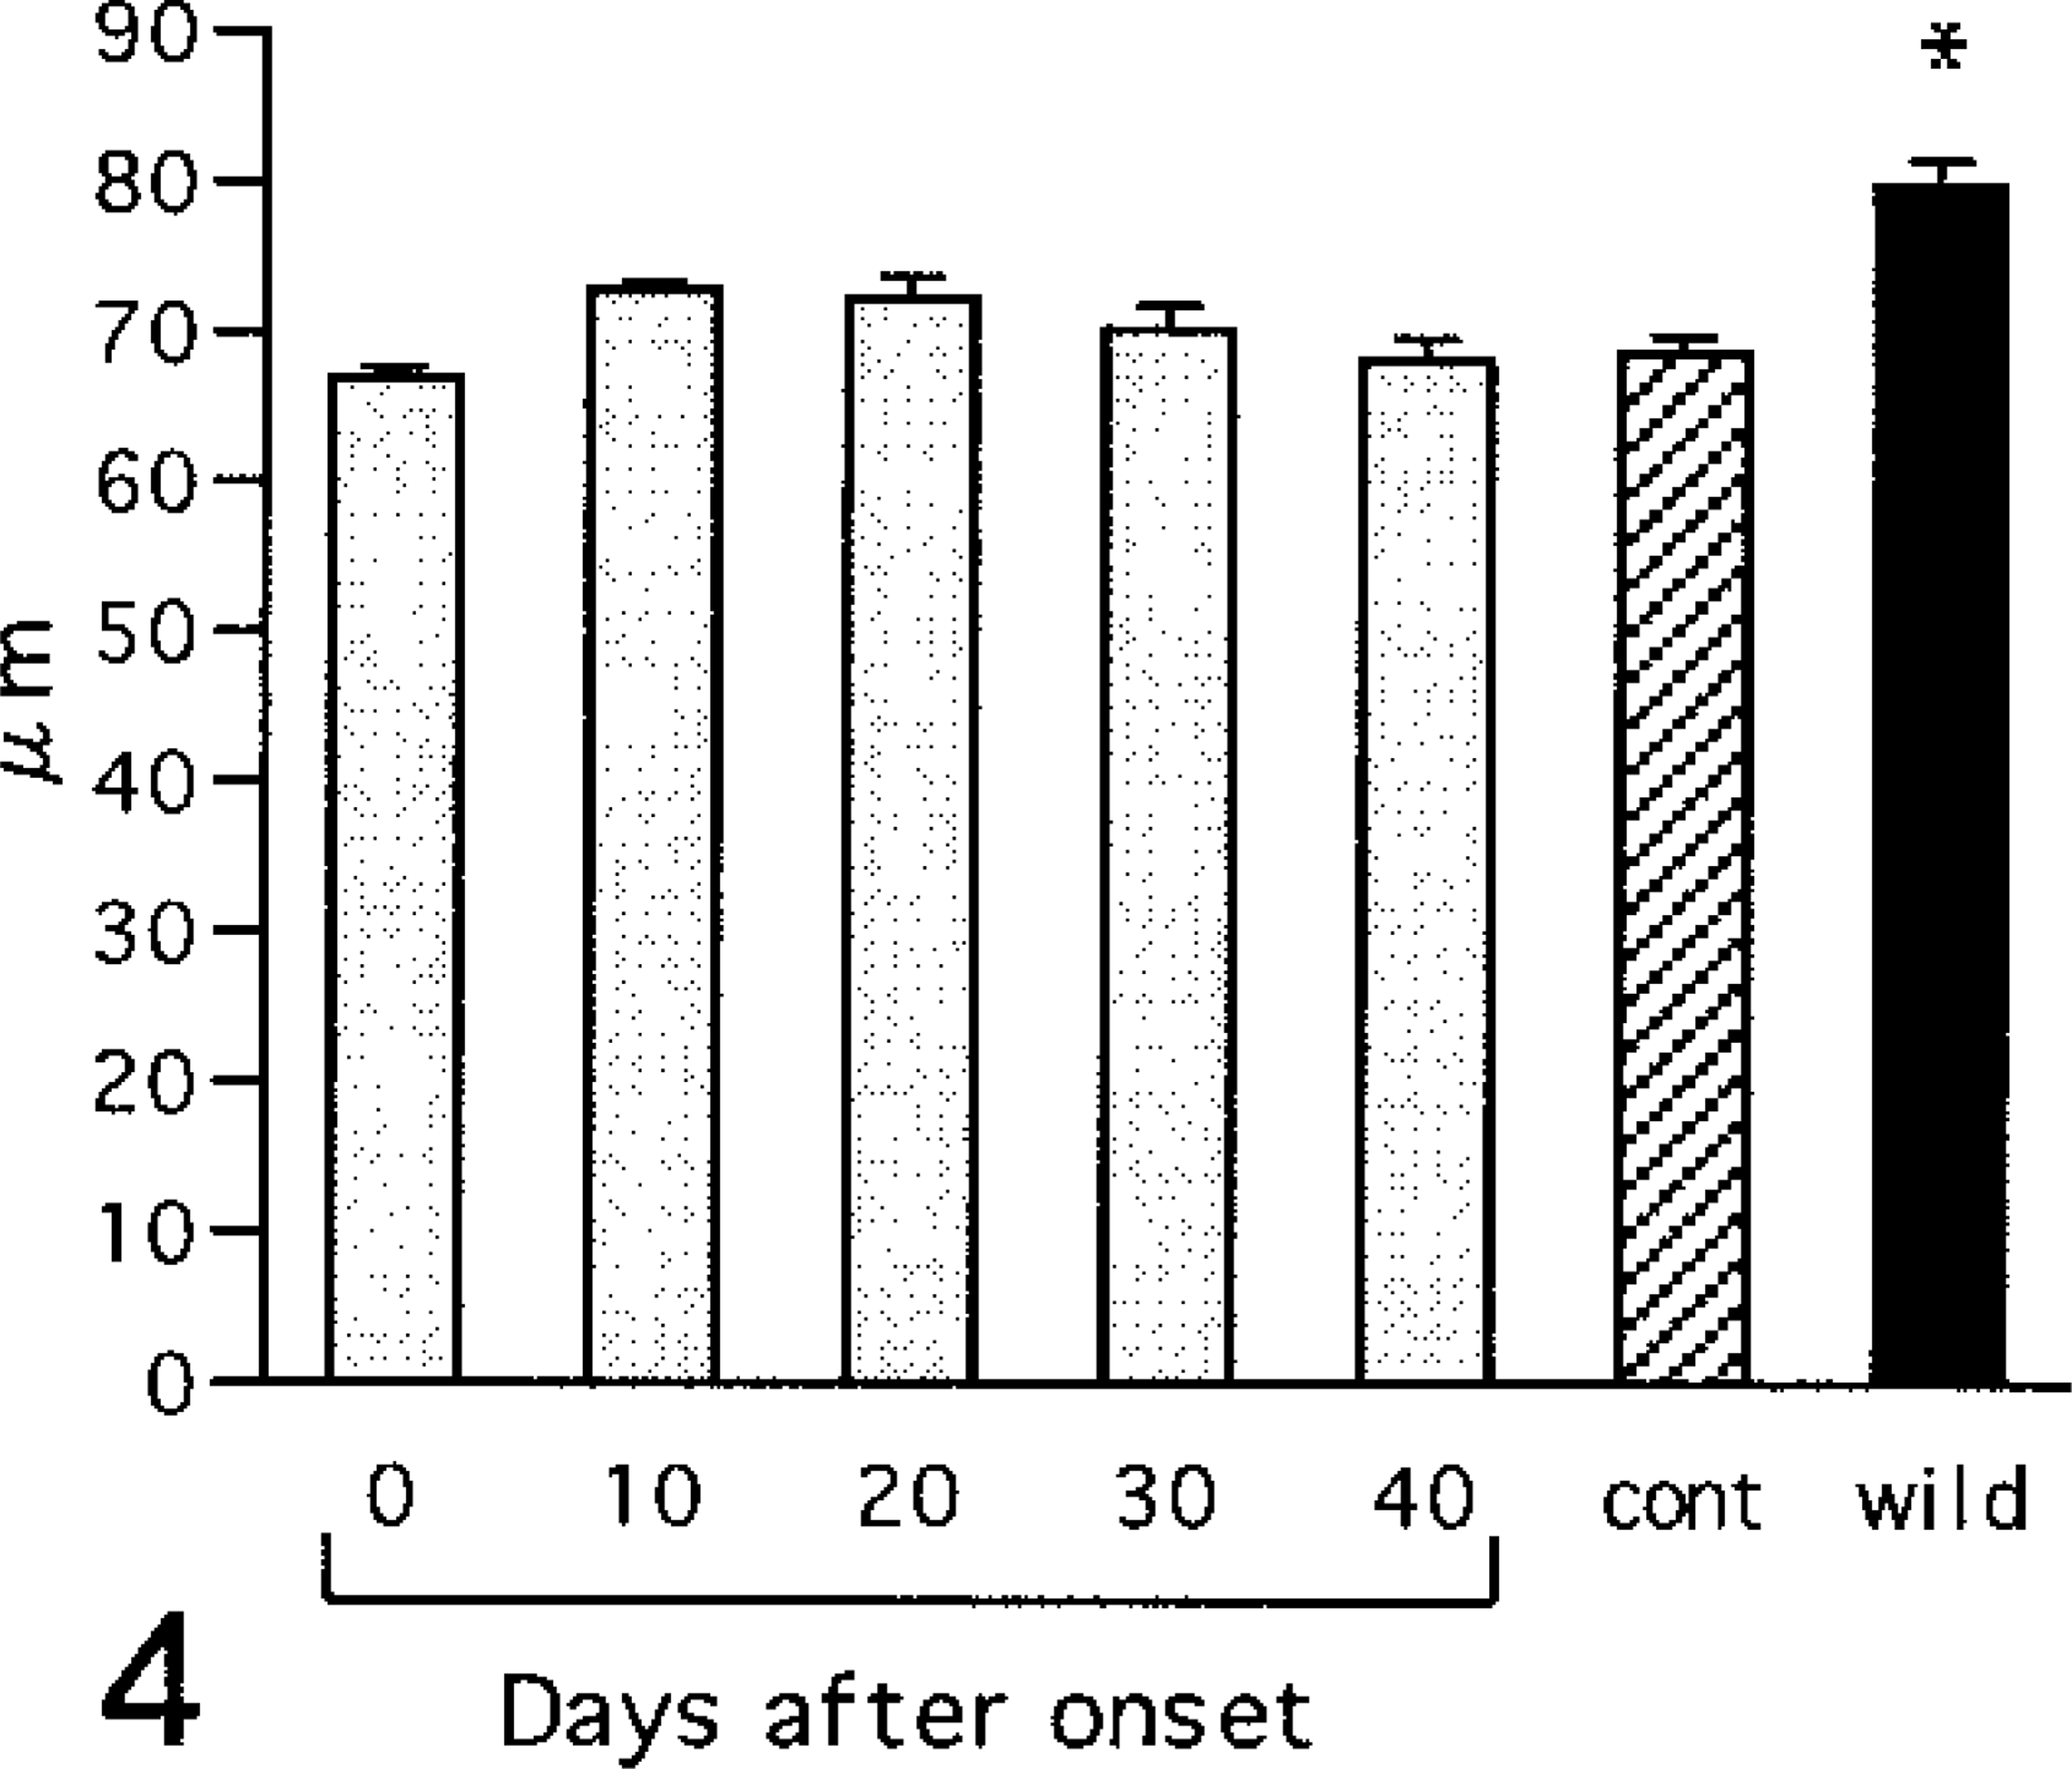
Diameter of renal corpuscles. cont = control (6-month-old NOD mice with no glycosuria); wild = wild type (6-month-old ICR mice). Values are mean ± SE. ∗ = vs. control (ANOVA, P < 0.05).
Although PCNA-positive nuclei were scarcely observed in the glomeluri until day 40, numerous positive nuclei were observed in the PT cells on day 10 of diabetes (Figs. 5, 6). The number of PCNA-positive nuclei in the PT cells was significantly increased on day 10 of diabetes and began to decrease immediately thereafter (Fig. 7). In PT cells nuclear divisions were frequently observed in diabetic NOD mice, particularly on days 10 and 20 of diabetes. On day 0, 30, or 40, such nuclear divisions were very rare. In PST epithelium PAS-positive granules were observed in all mice. These granules increased in number (Fig. 8) and became larger on day 40 of diabetes (Figs. 9, 10). In addition, decreased PAS staining in the brush border was observed in PSTs on day 40 of diabetes (Fig. 10). Furthermore, in the immunohistochemical observations nNOS-positive granules were observed in the outer medullary tubules. The nNOS positive tubules were identified as PSTs by examining PAS-stained serial sections, and the degree of staining was seen to be enhanced on day 40 of diabetes (Figs. 11, 12).
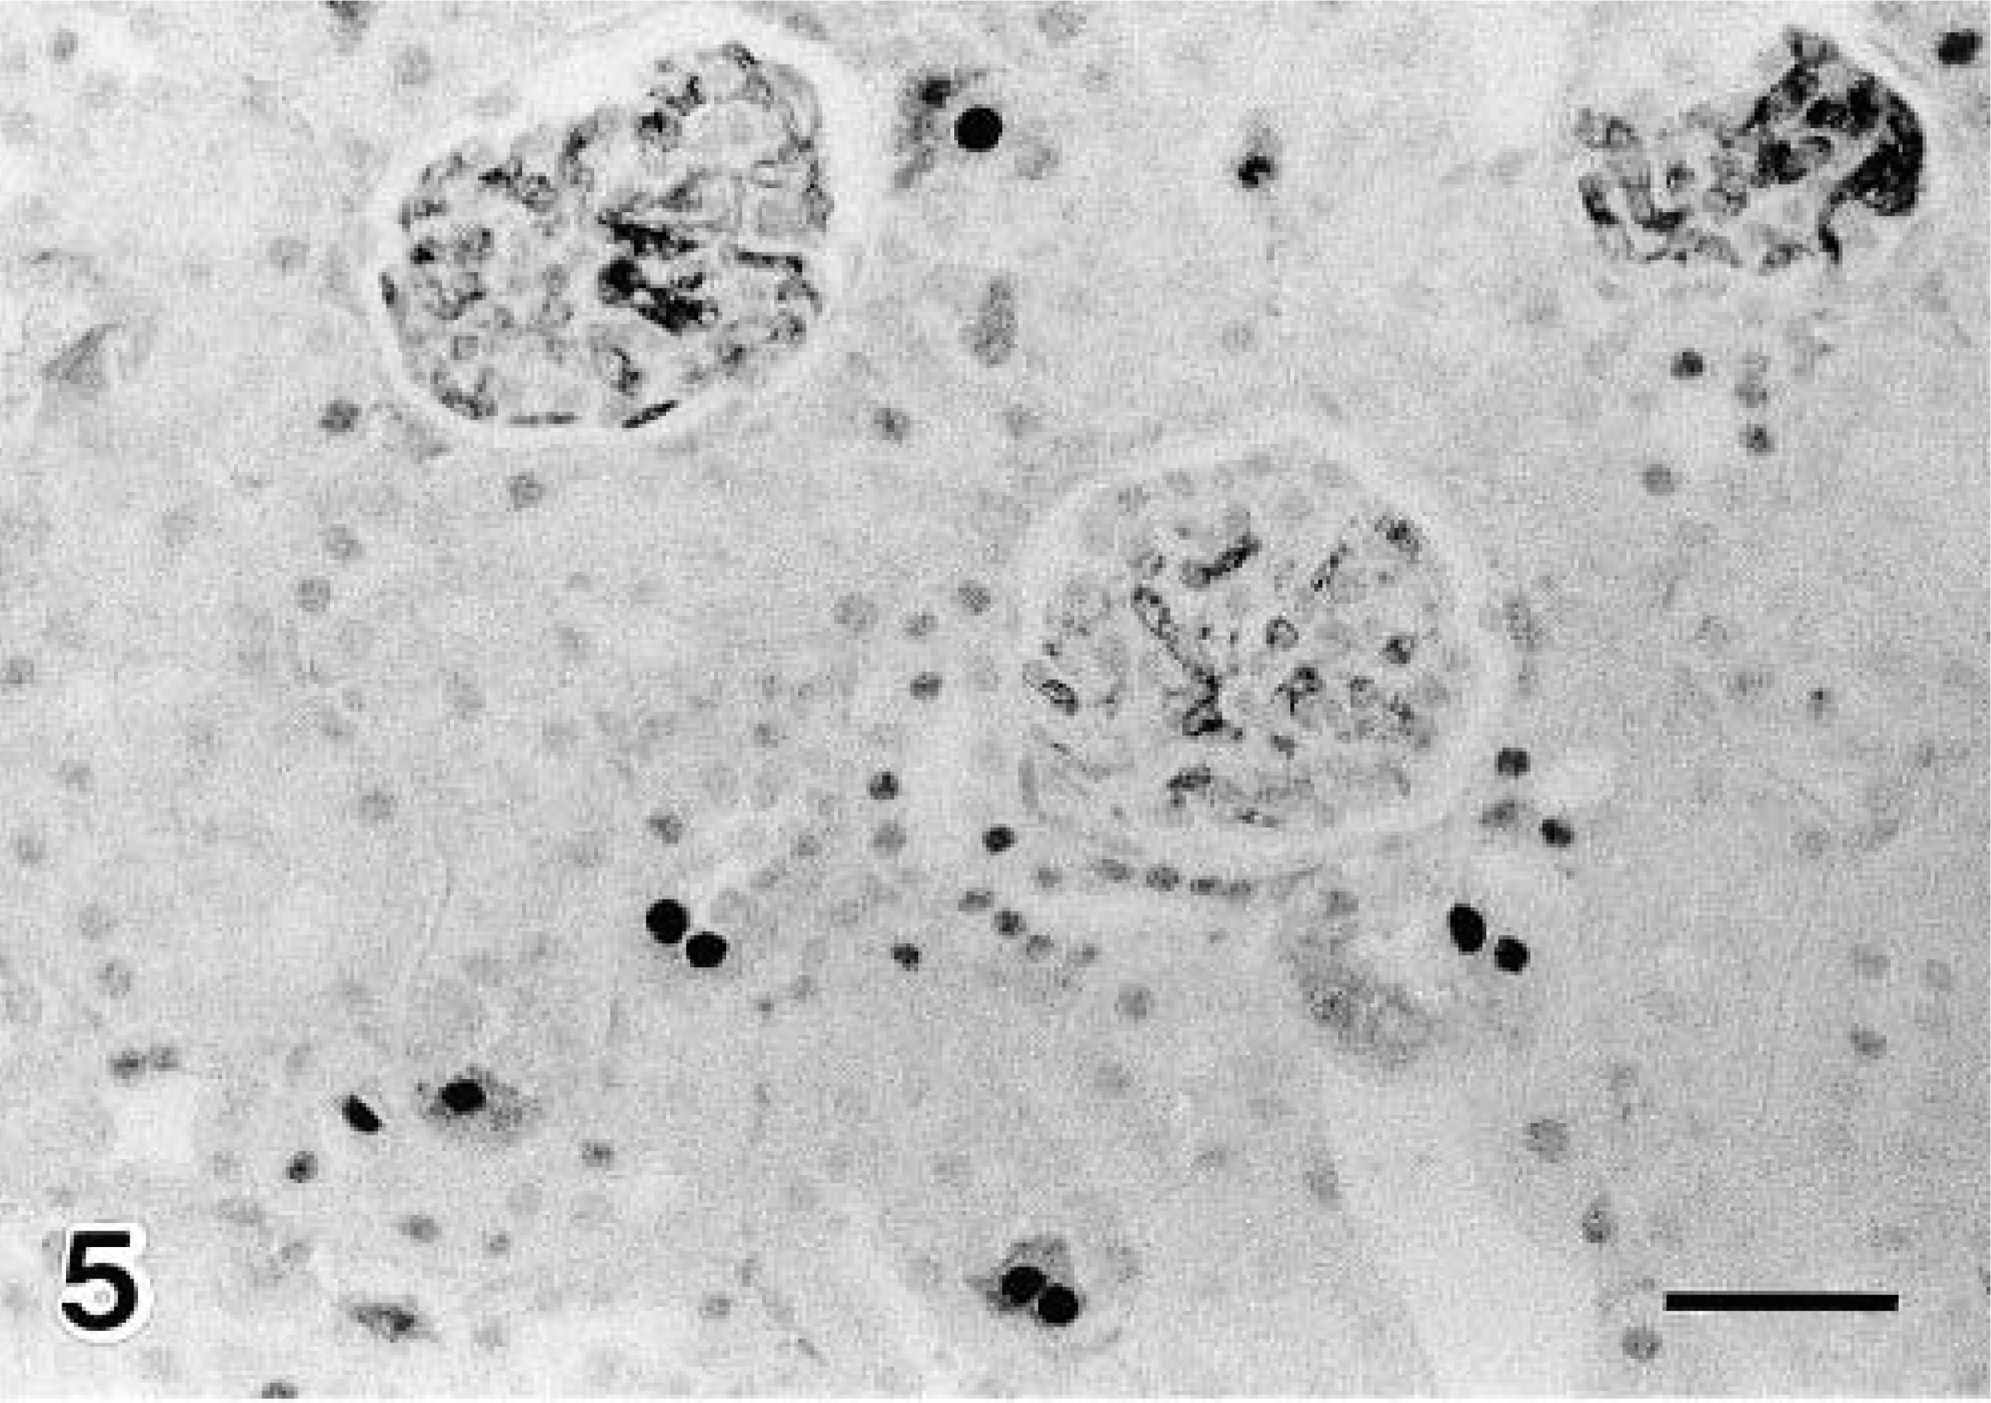
Detection of PCNA-positive nuclei in the proximal tubular cells. Day 10 diabetic NOD mouse.
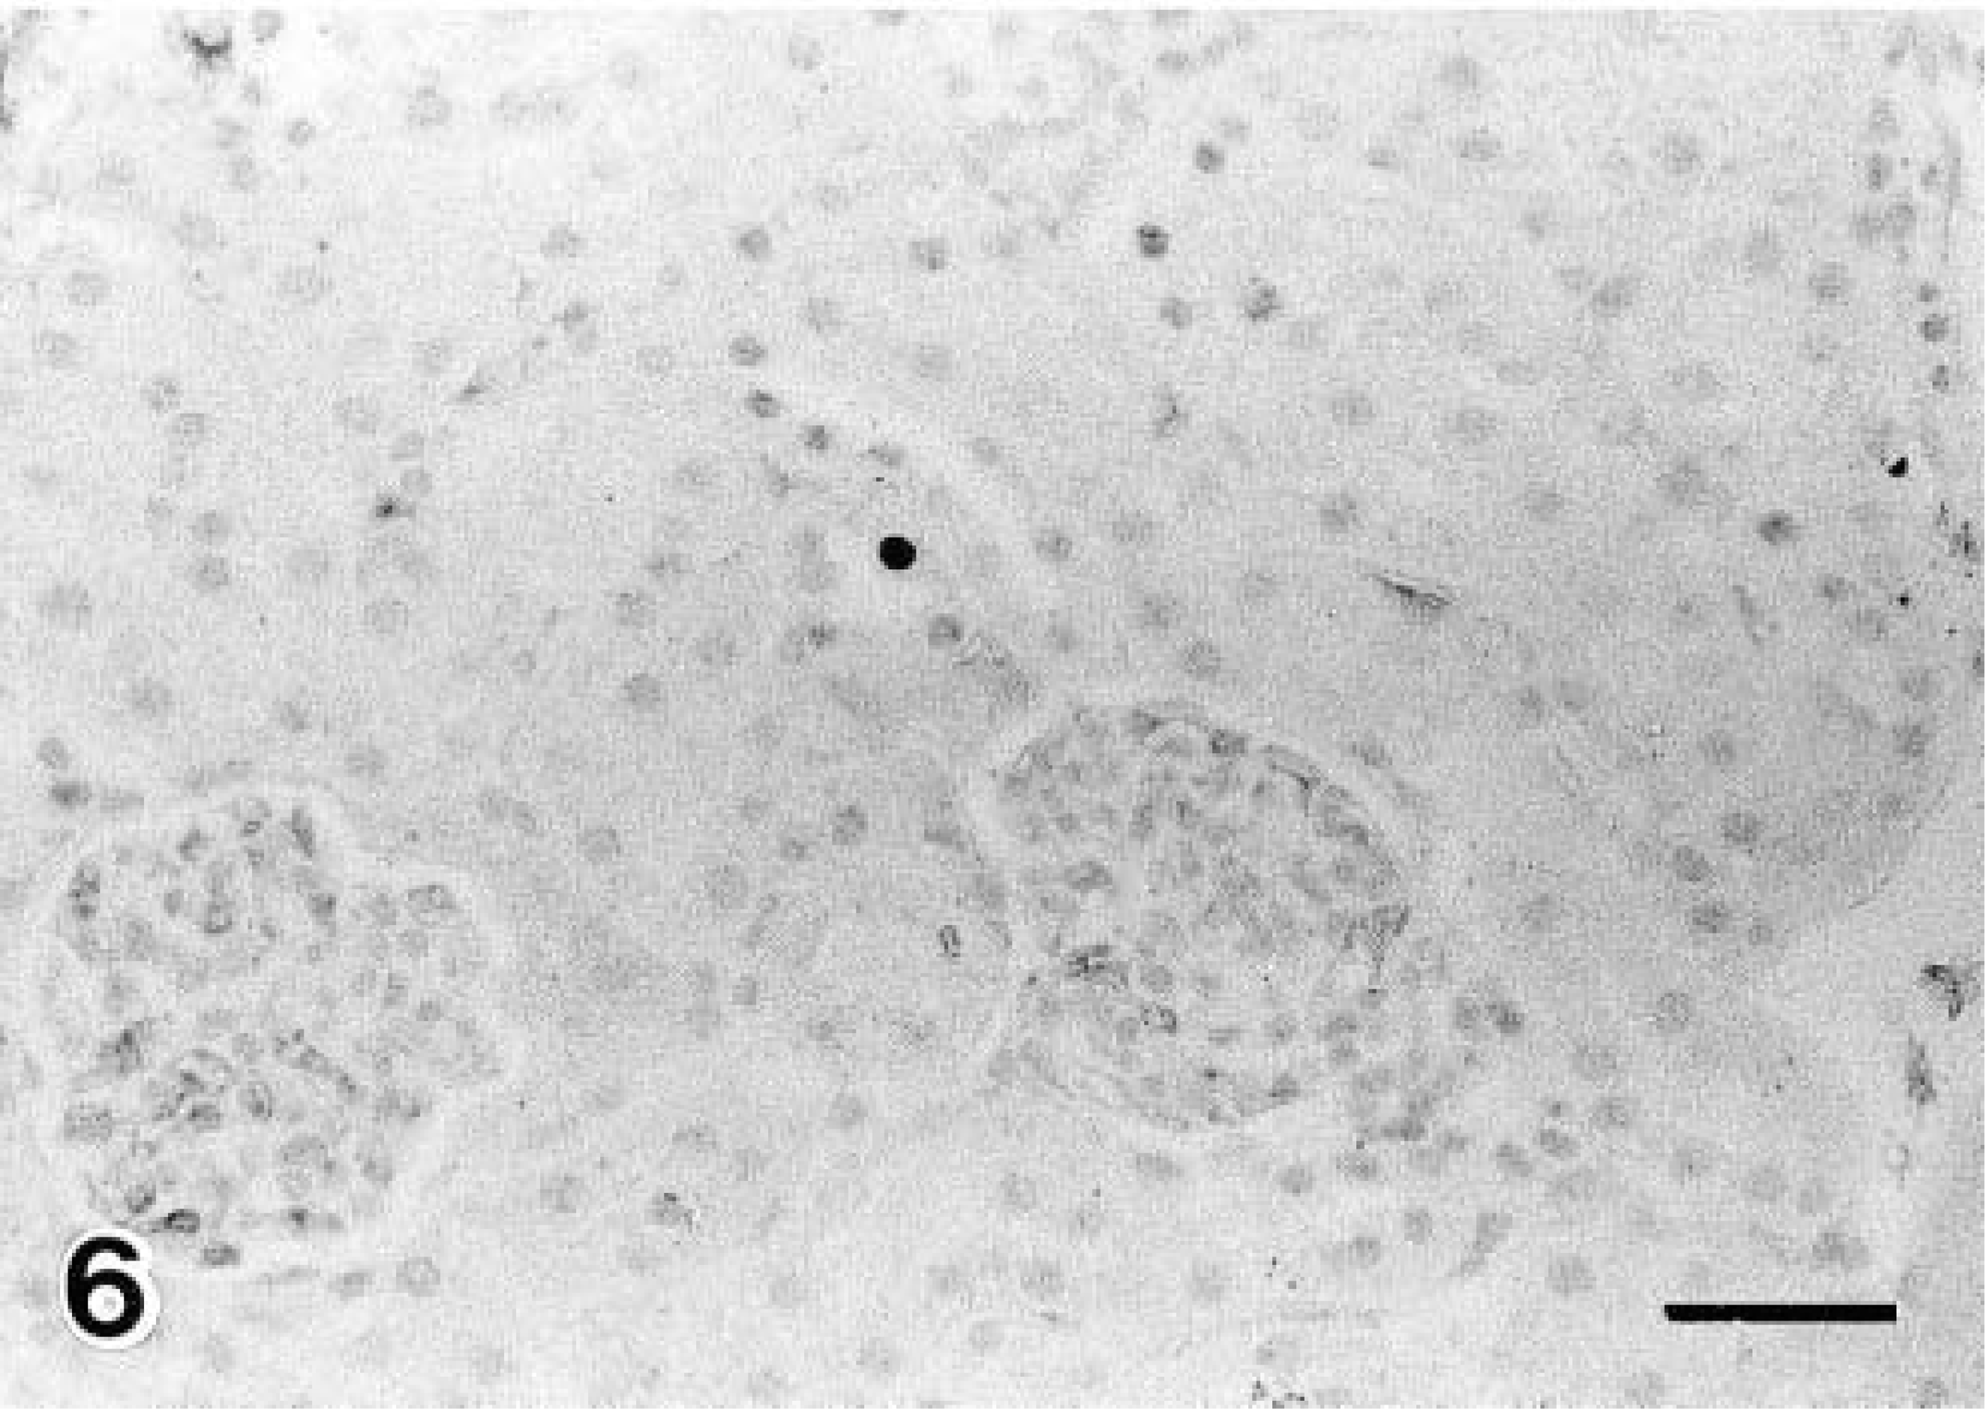
Detection of PCNA-positive nuclei in the proximal tubular cells. Control (6-month-old NOD mice with no glycosuria). Numerous PCNA-positive nuclei were observed on day 10 of diabetes (Fig. 5). Avidin–biotin–peroxidase complex method. Mayer's hematoxylin counterstain. Bars = 20 μm.
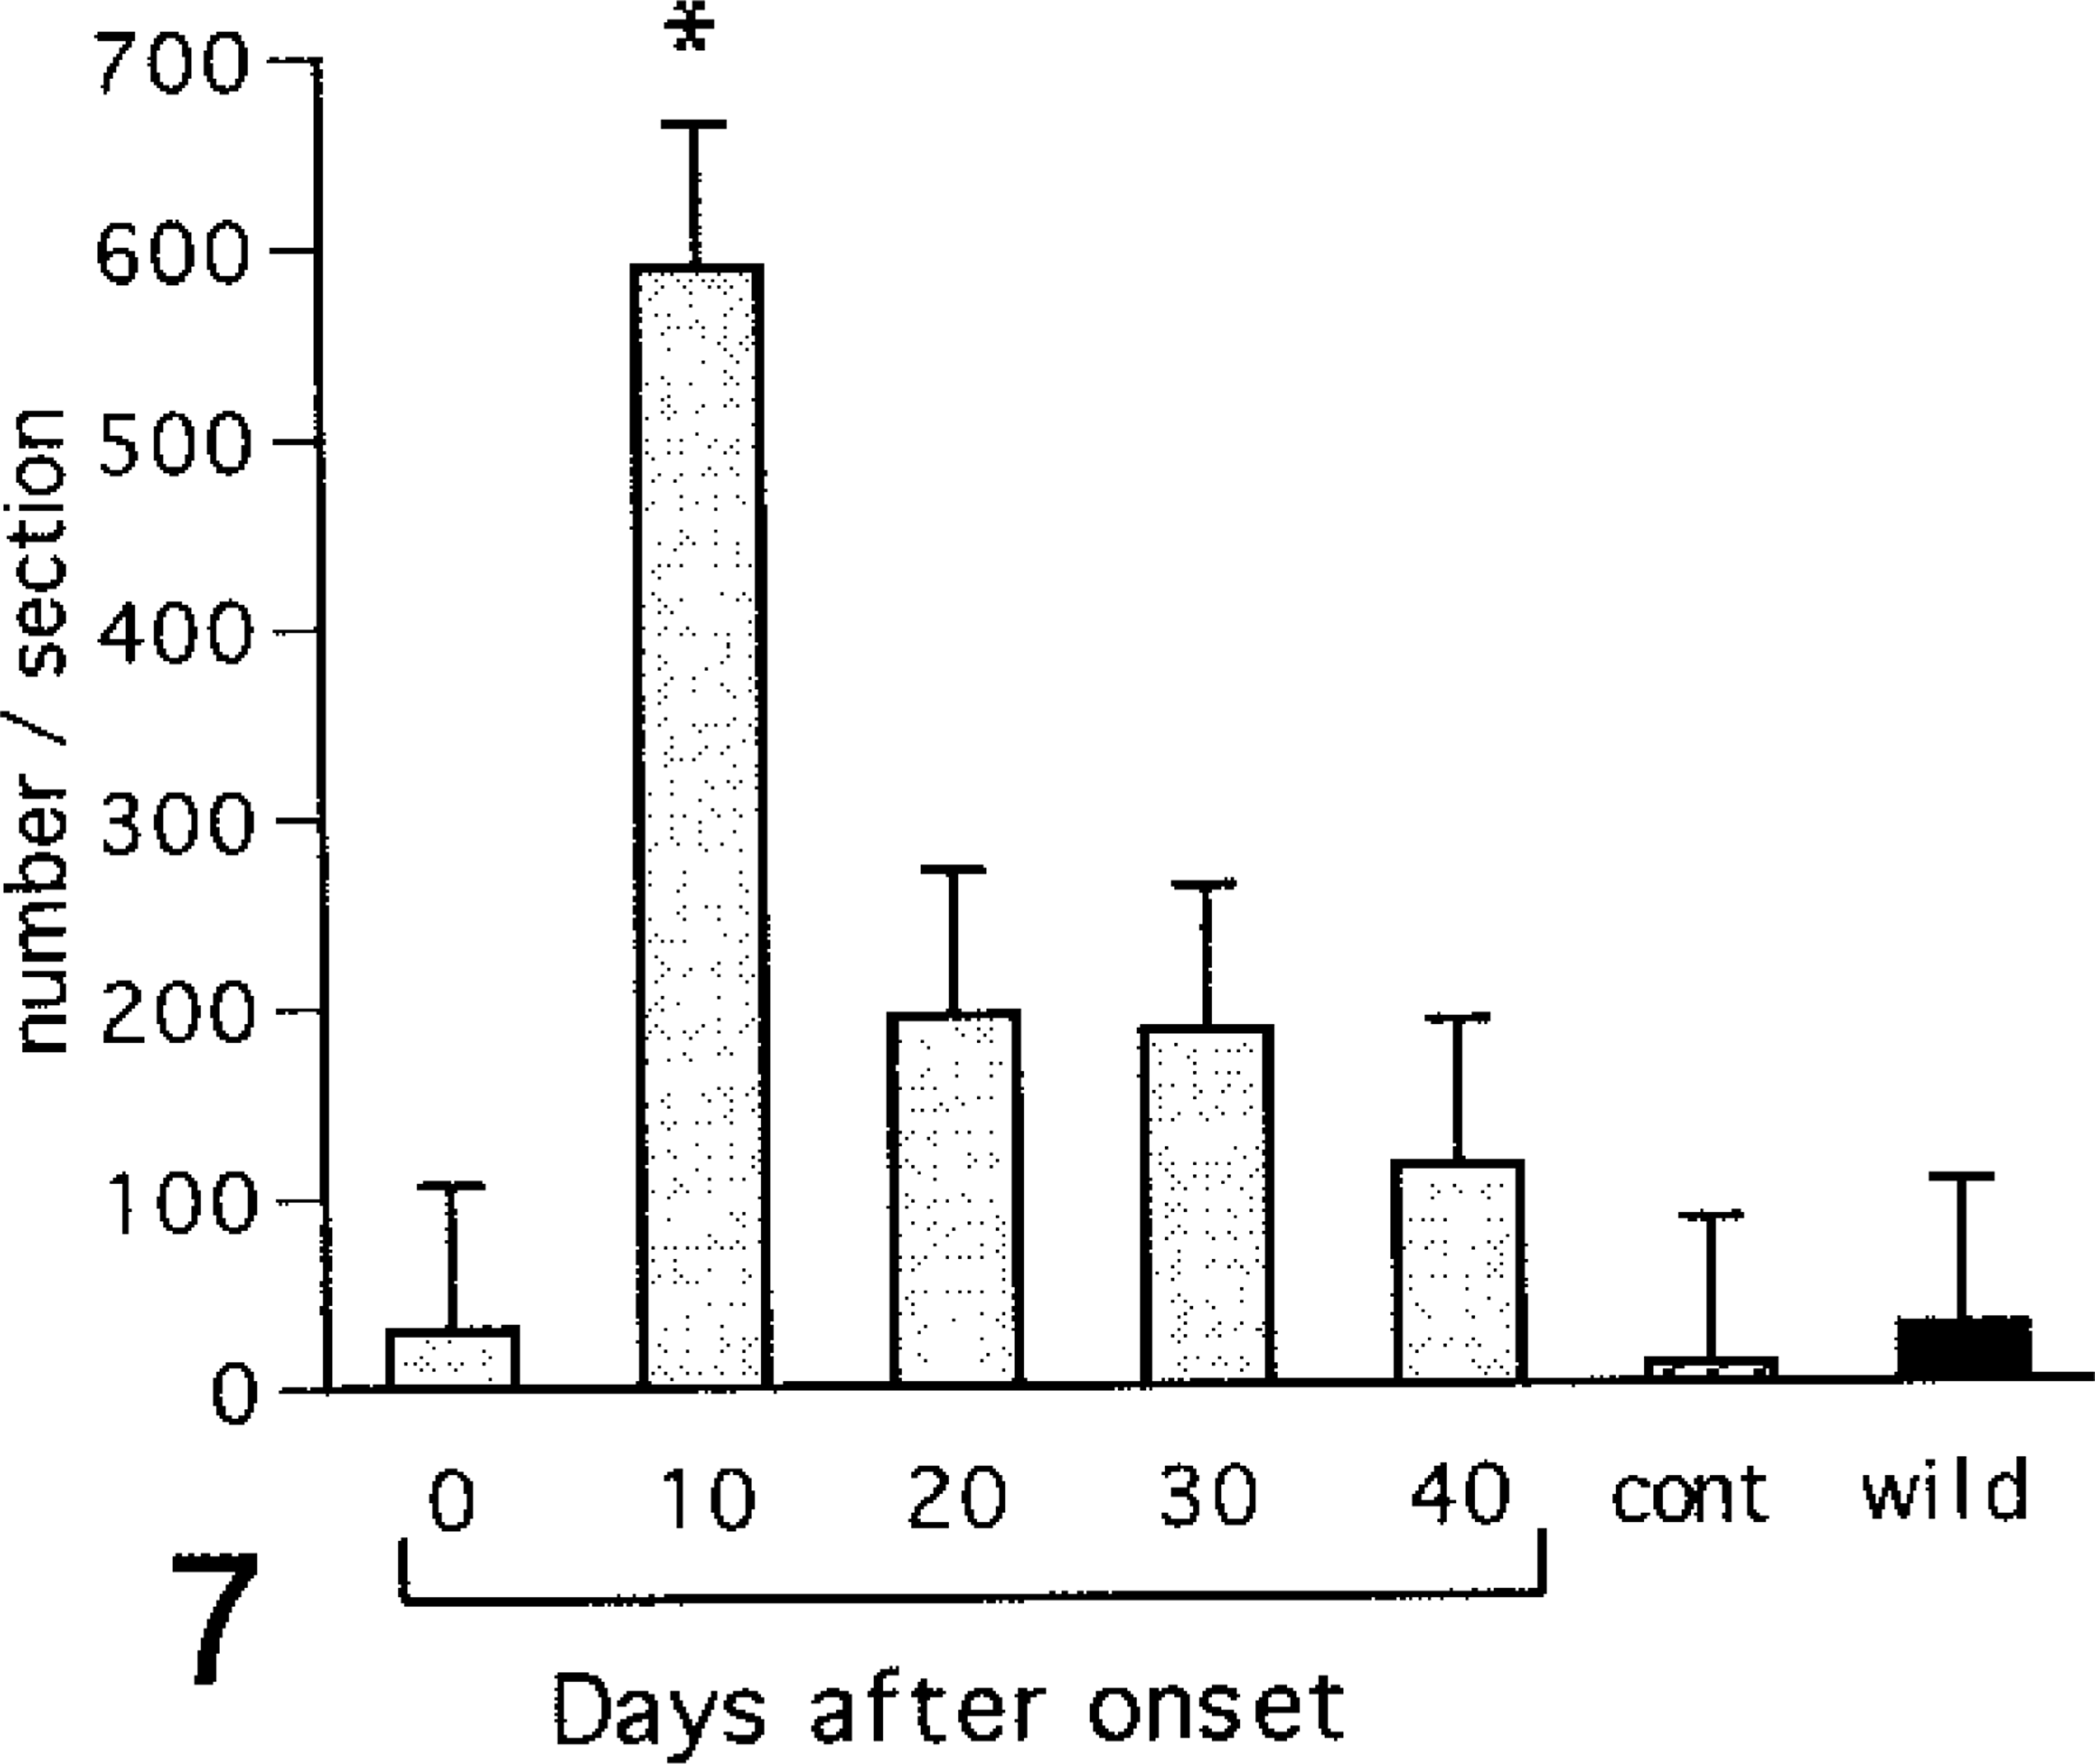
Number of PCNA-positive nuclei in the proximal tubular cells. cont = control (6-month-old NOD mice with no glycosuria); wild = wild type (6-month-old ICR mice). Values are mean ± SE. ∗ = vs. control (ANOVA, P < 0.05).
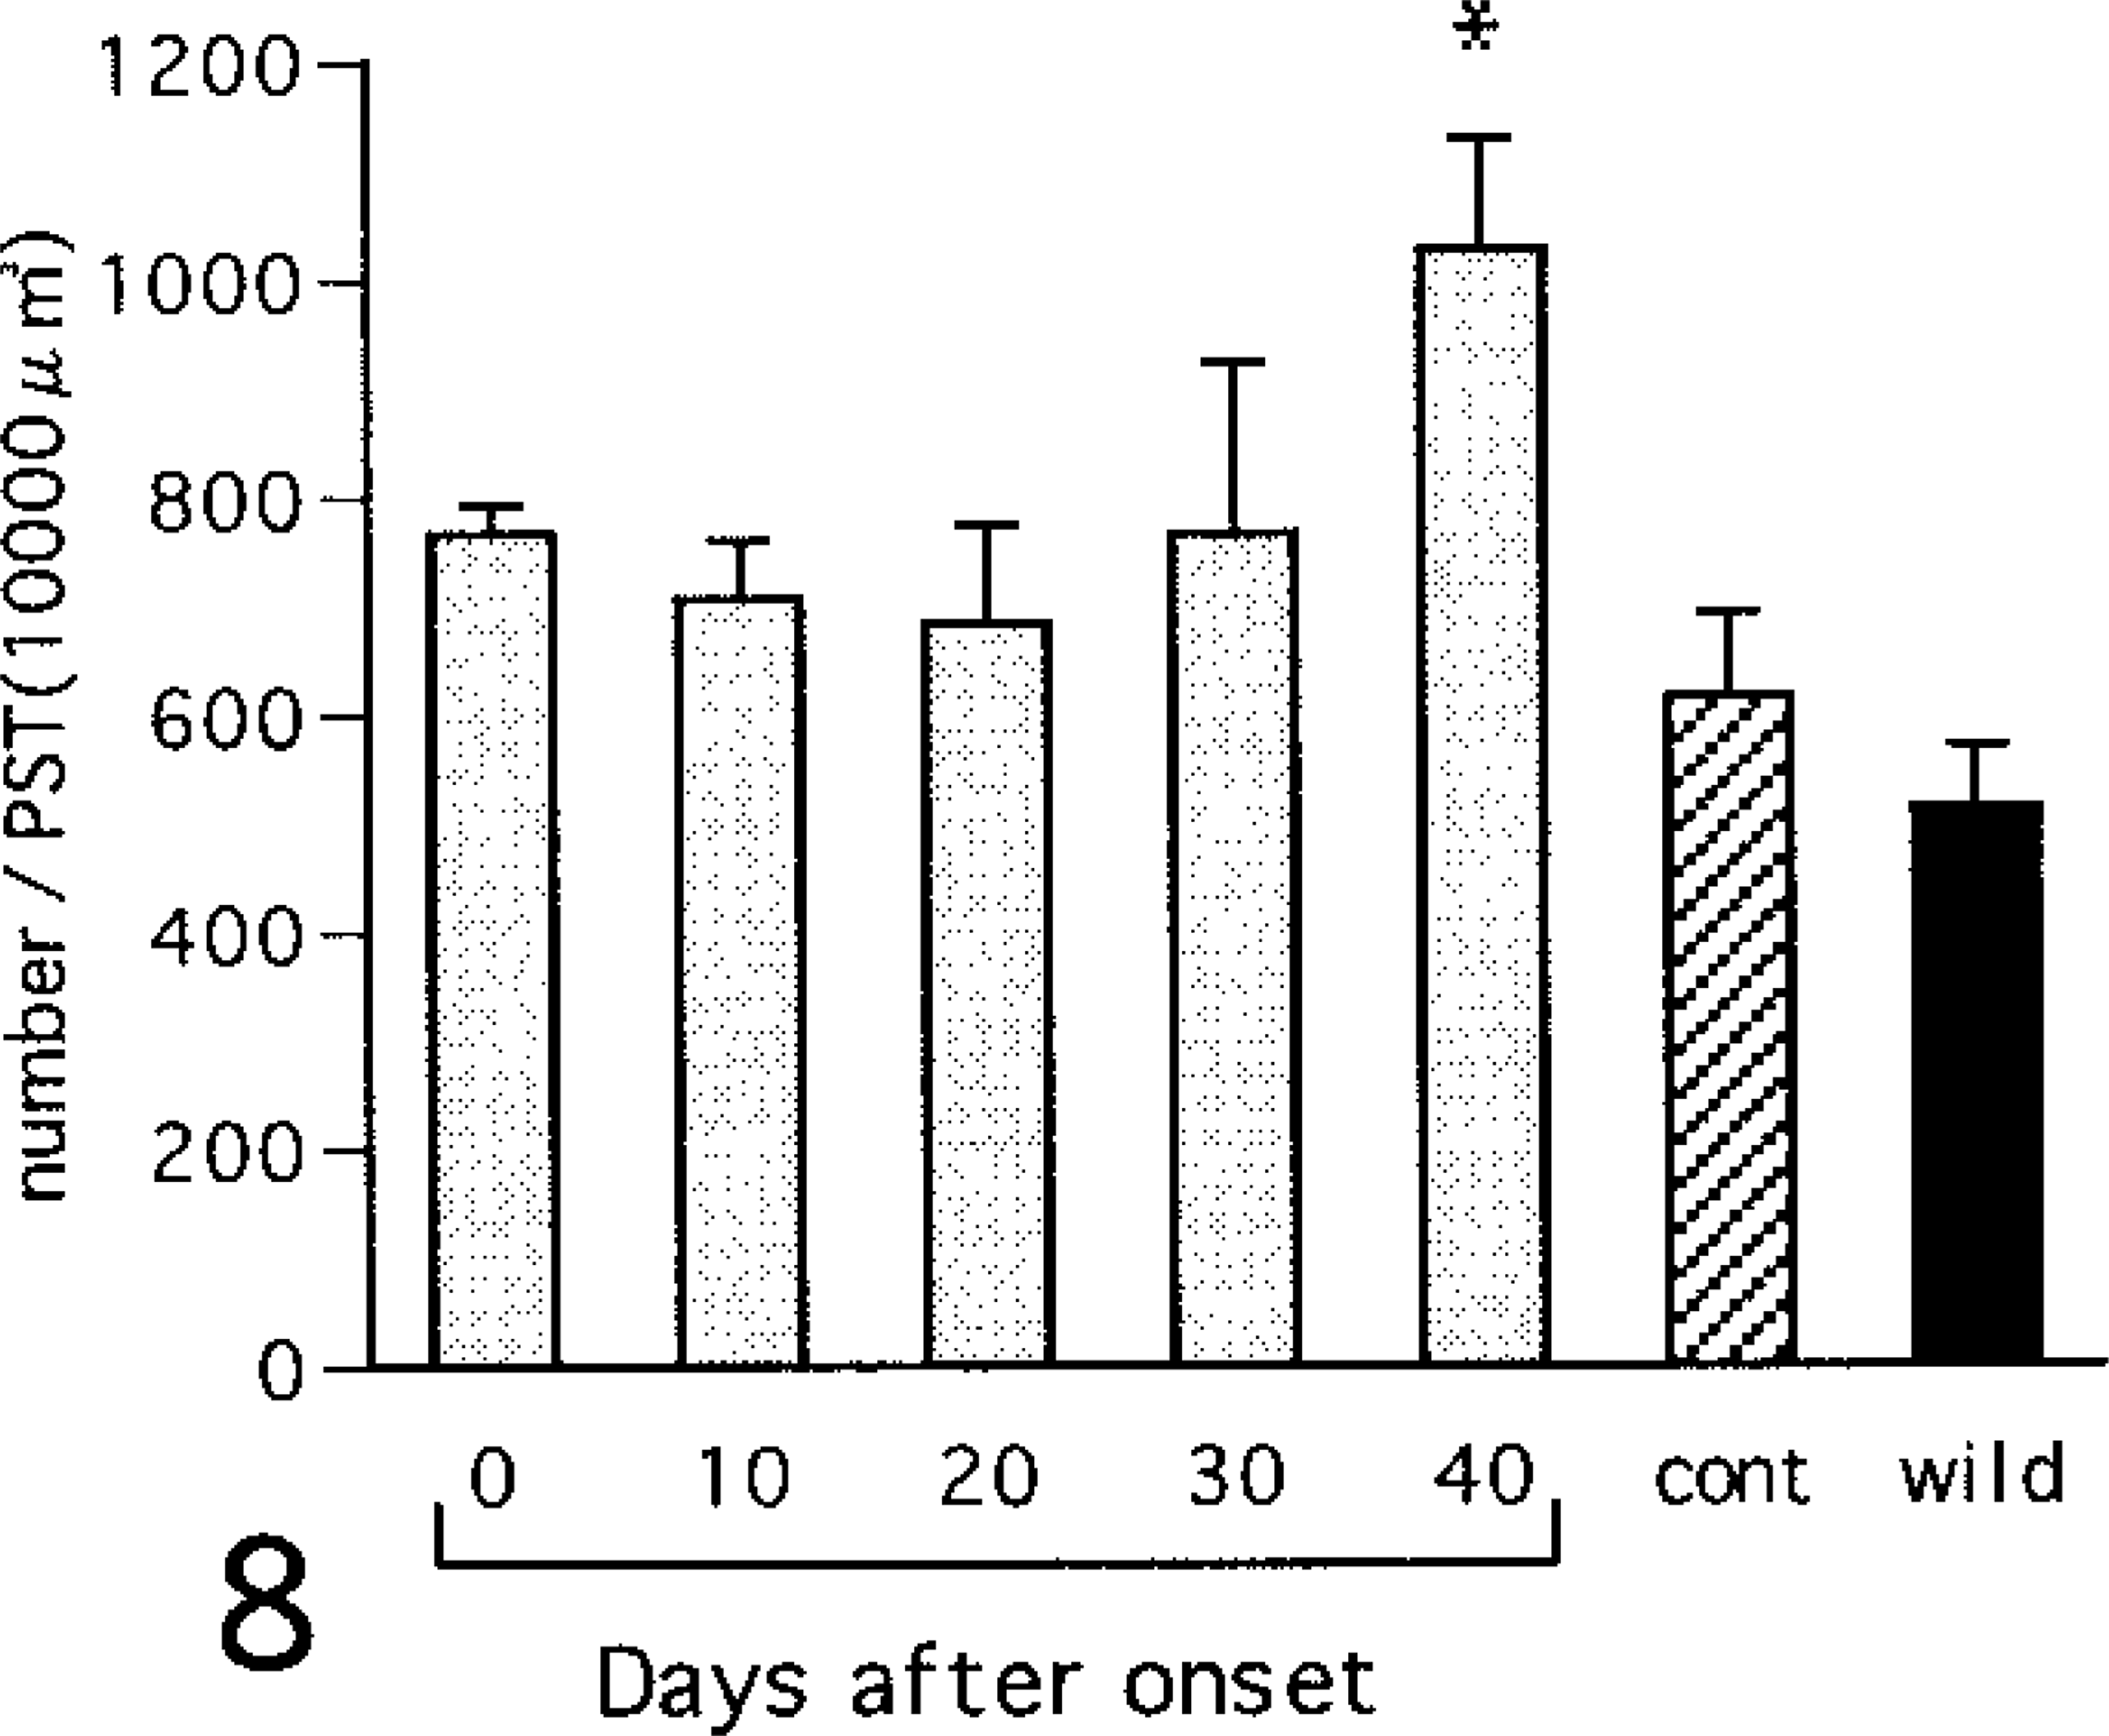
Number of PAS-positive granules in proximal straight tubular epithelium. cont = control (6-month-old NOD mice with no glycosuria); wild = wild type (6-month-old ICR mice). Values are mean ± SE. ∗ = vs. control (ANOVA, P < 0.05).
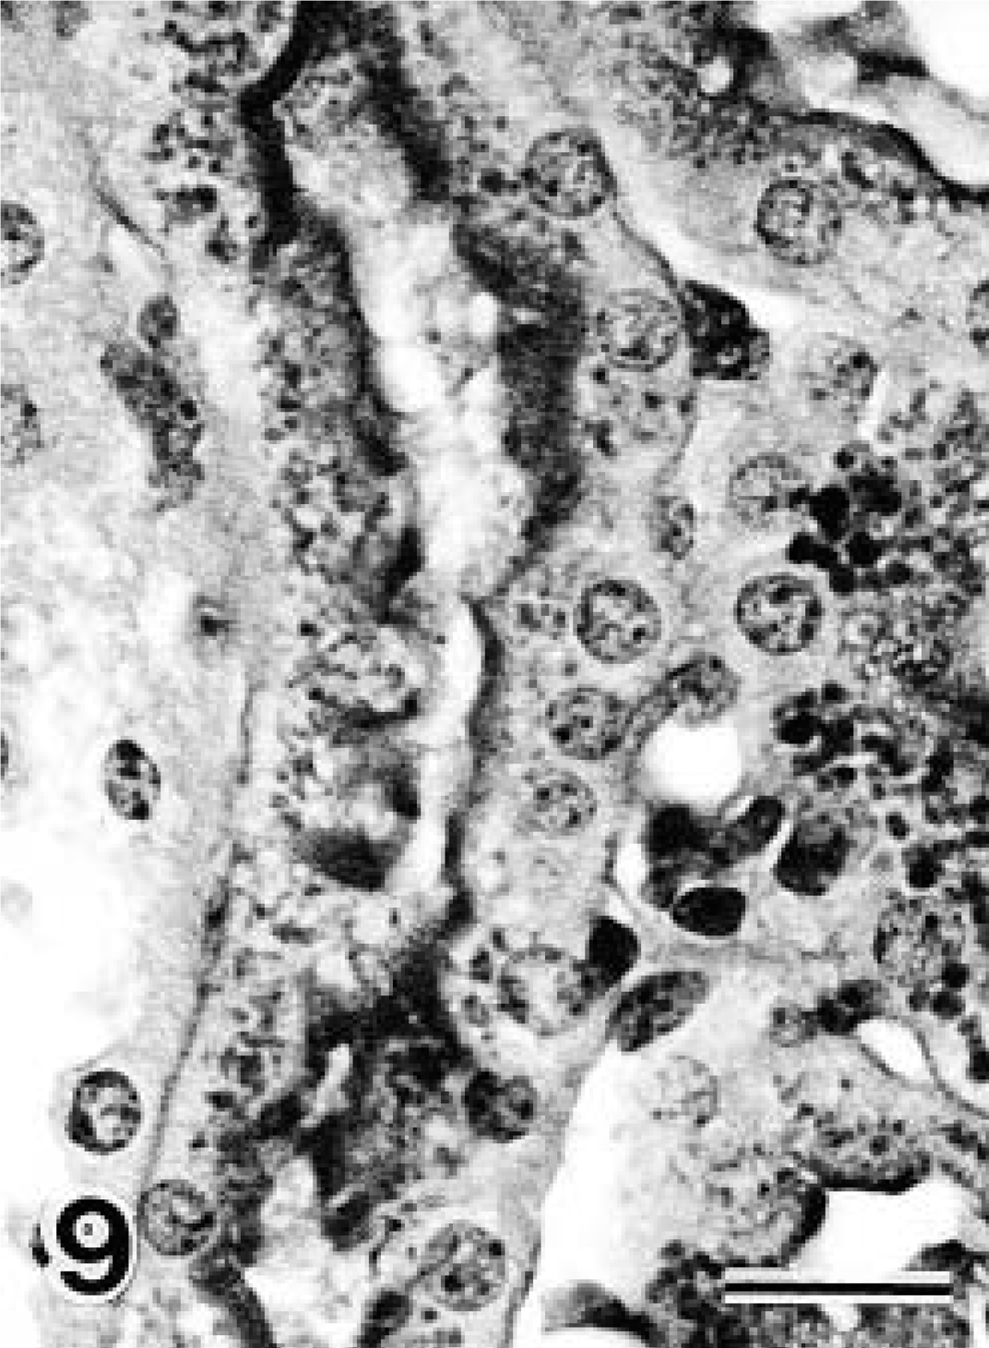
Light micrographs of the outer medulla. Day 40 diabetic NOD mouse.
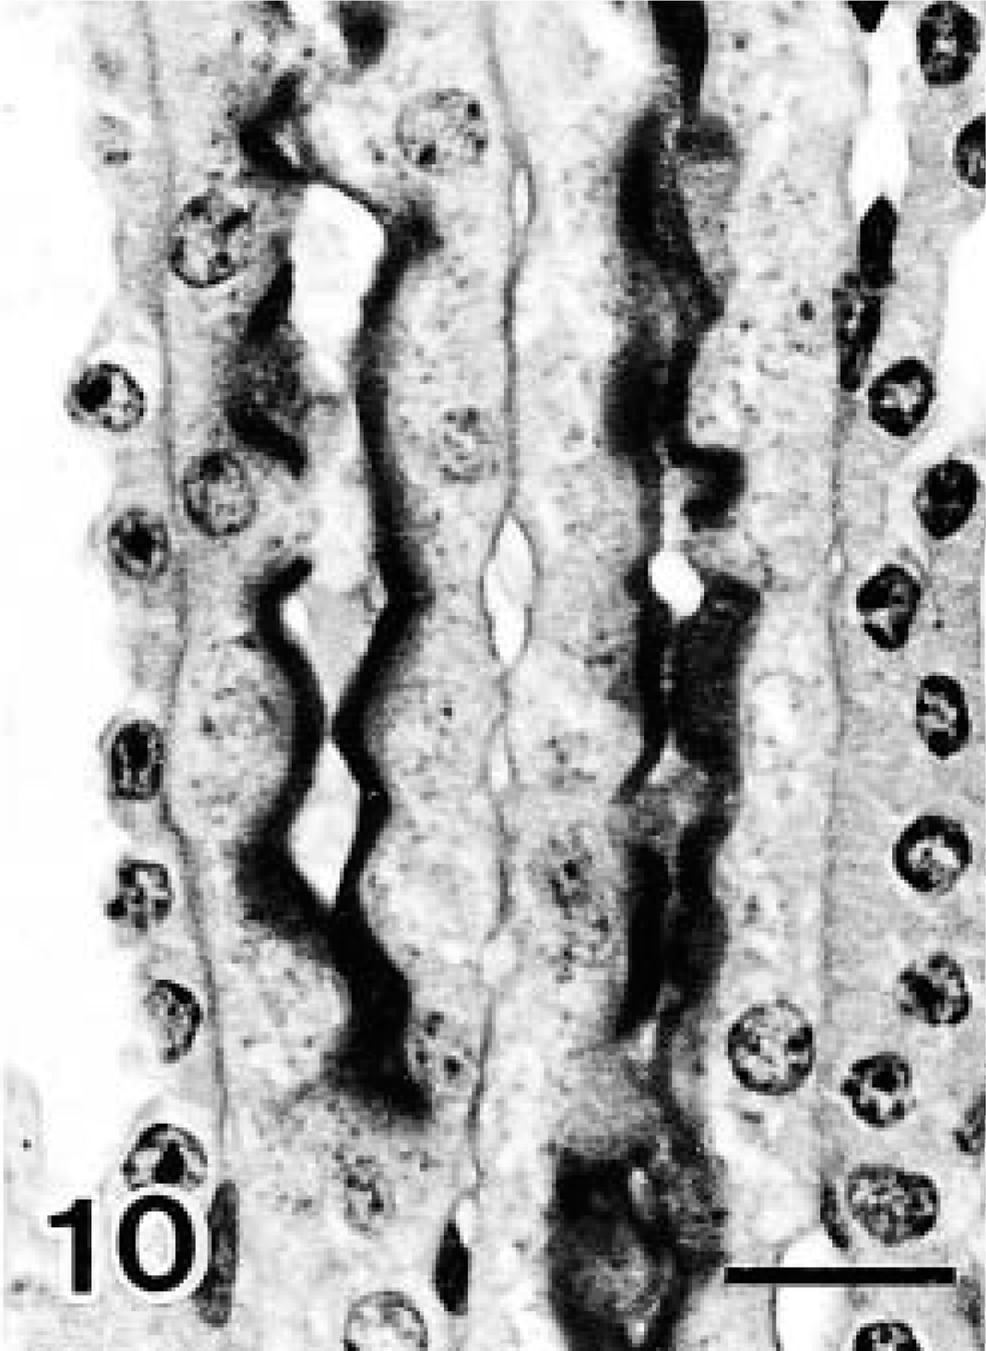
Light micrographs of the outer medulla. Control (6-month-old NOD mice with no glycosuria). On day 40 of diabetes, increased numbers of PAS-positive granules and decreased PAS staining of the brush border were observed in proximal straight tubular epithelium (Fig. 10). PAS and Mayer's hematoxylin counterstain. Bars = 10 μm.
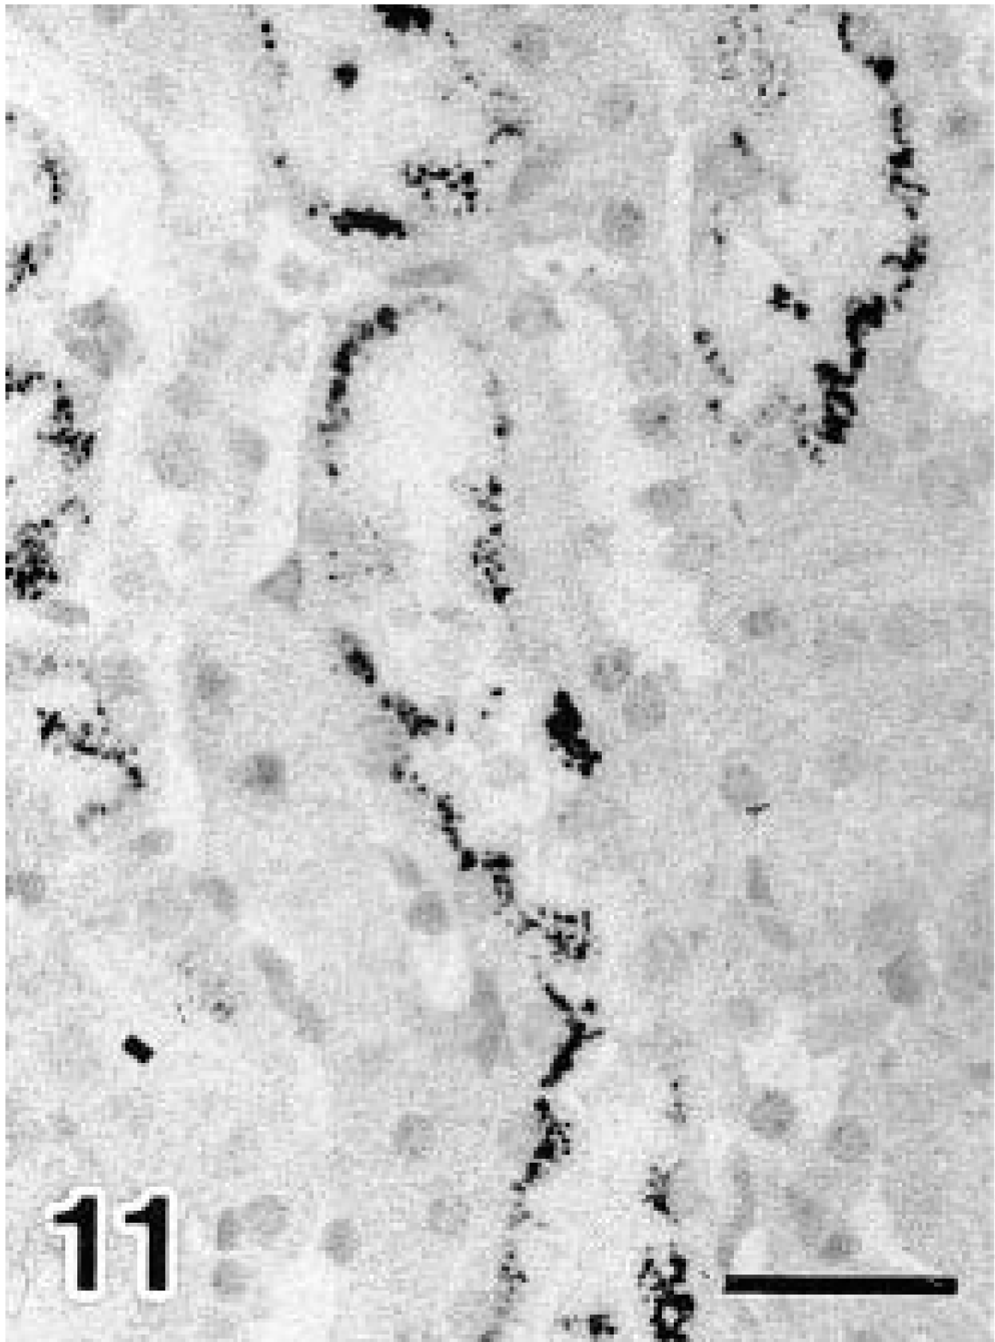
Light micrographs of the outer medulla in day 40 diabetic NOD mice. Immunostained for nNOS. Avidin–biotin–peroxidase complex method. Mayer's hematoxylin counterstain.
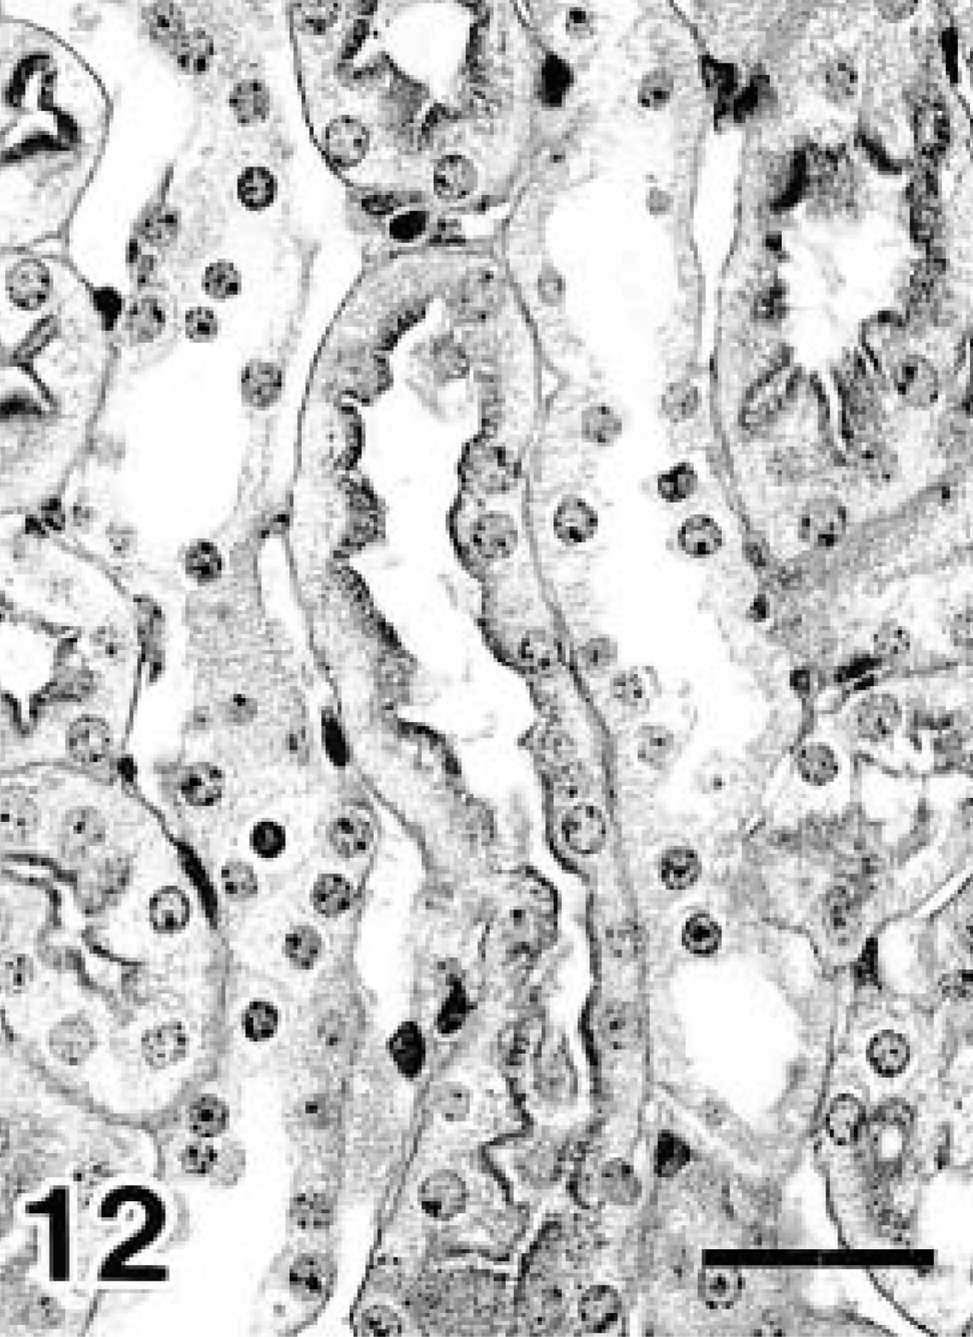
Light micrographs of the outer medulla in day 40 diabetic NOD mice. PAS-stained section serial to Fig. 11, Mayer's hematoxylin counterstain. Many nNOS-positive granules were observed in the outer medullary tubules (Fig. 11), and these tubules matched the proximal straight tubules (Fig. 12). Bars = 10 μm.
Stratification of MD was observed in the juxtaglomerular apparatus (Figs. 13, 14). The percentage of stratified MD is shown in Fig. 15. On day 0 of diabetes this value was significantly higher in diabetic NOD mice than in controls. In addition, the control value was significantly higher than that of the wild type. Renin-positive reactions were detected in the juxtaglomerular cells of the afferent arterioles (Figs. 16, 17), and the localization remained unchanged after onset of diabetes. The number of renin-positive areas is shown in Fig. 18, and no significant increase or decrease was observed until day 40 of diabetes. Apoptotic cells were not detected in the kidneys of any mouse.
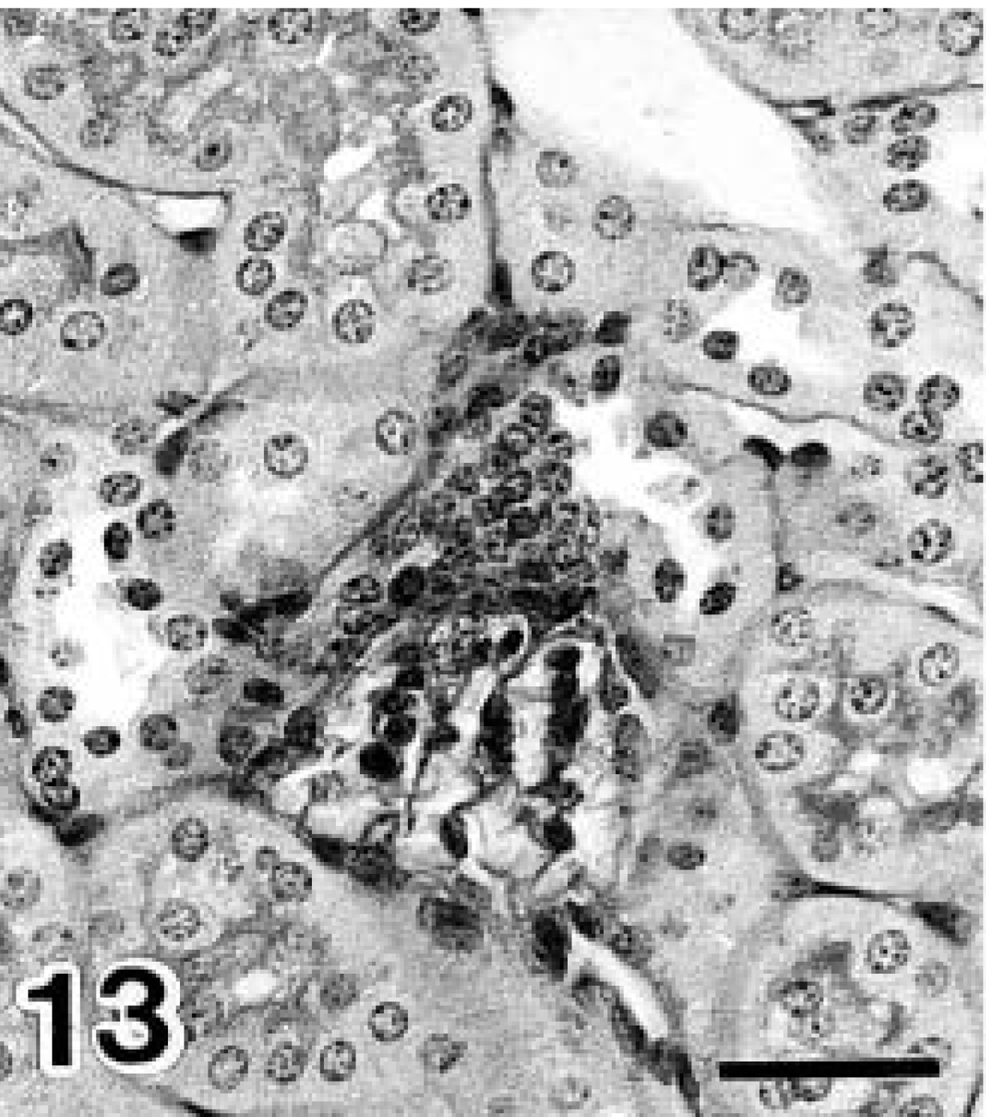
Stratified MD of day 0 diabetic NOD mice. PAS and Mayer's hematoxylin counterstain.
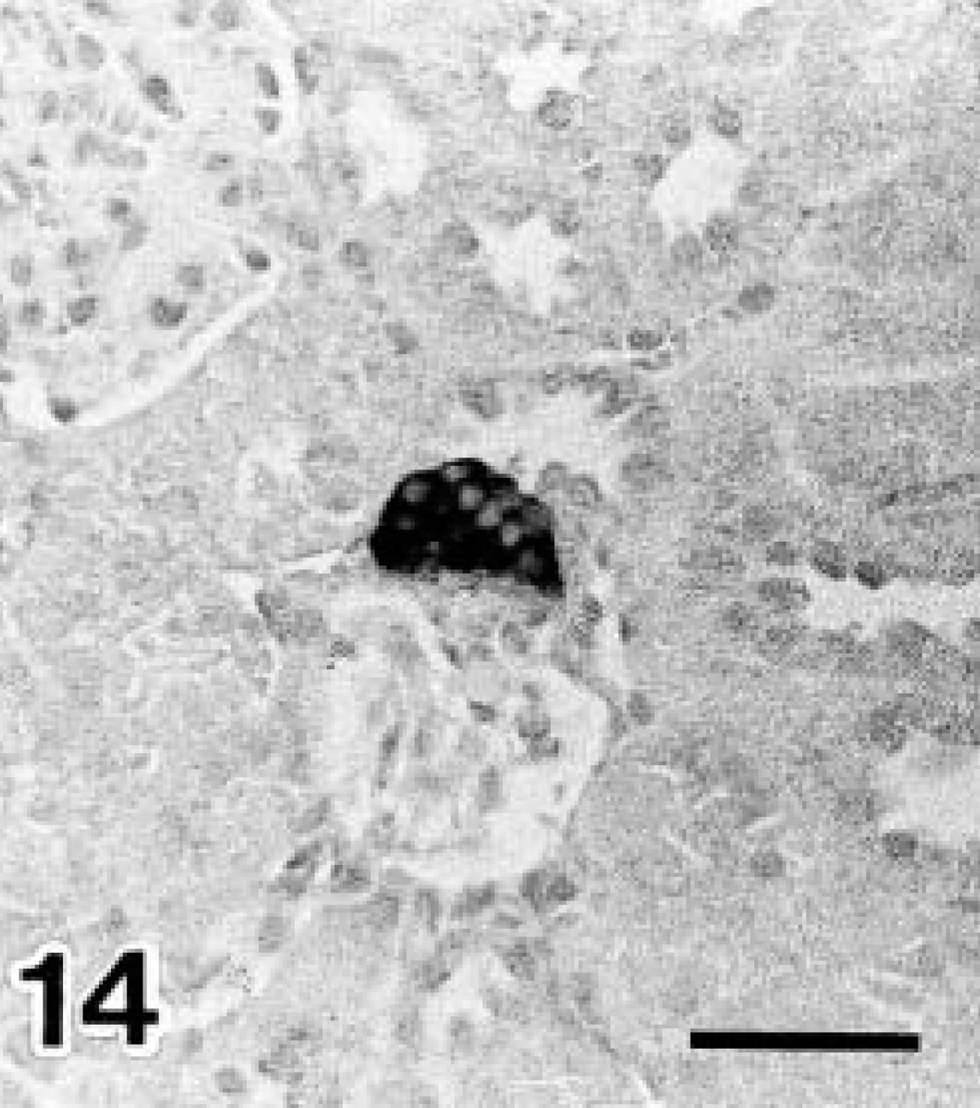
Stratified MD of day 0 diabetic NOD mice. Immunostained for nNOS. Avidin–biotin–peroxidase complex method. Mayer's hematoxylin counterstain. Stratified MD displayed a positive reaction for nNOS. Bars = 20 μm.
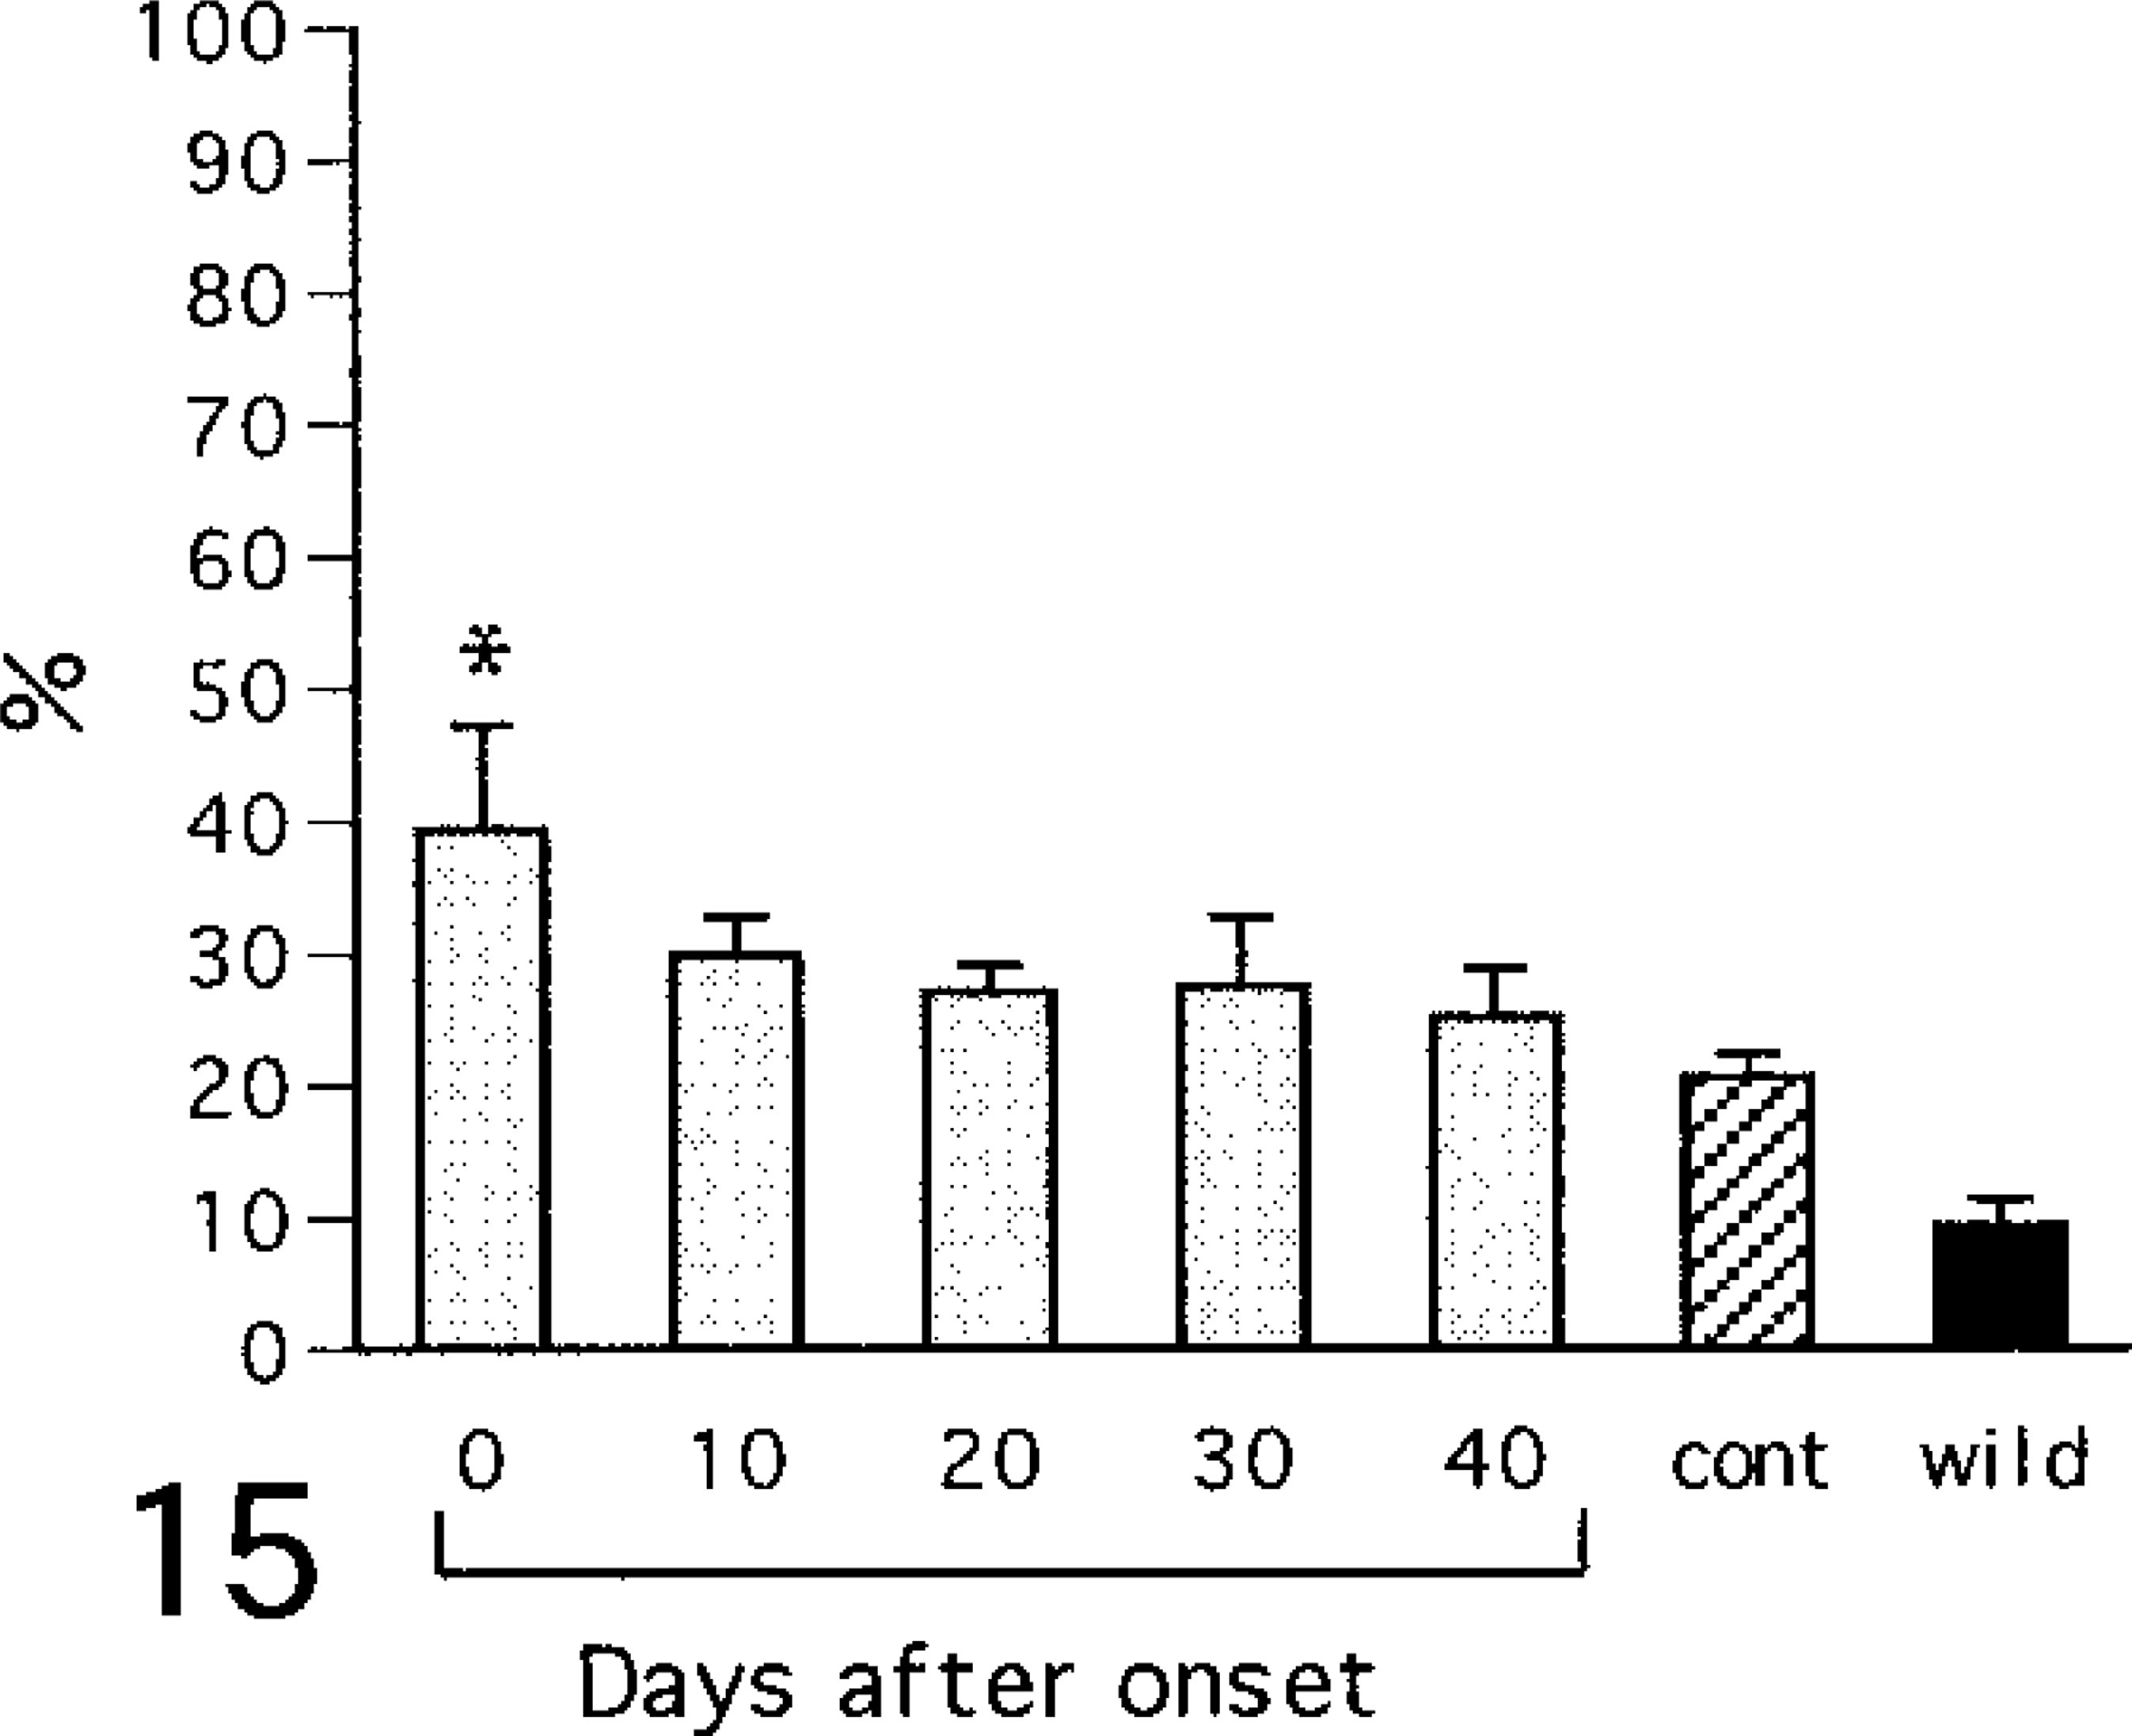
Percentage of stratified MD. cont = control (6 month-old NOD mice with no glycosuria); wild = wild type (6-month-old ICR mice). Values are mean ± SE. ∗ = vs. control (ANOVA, P < 0.05).
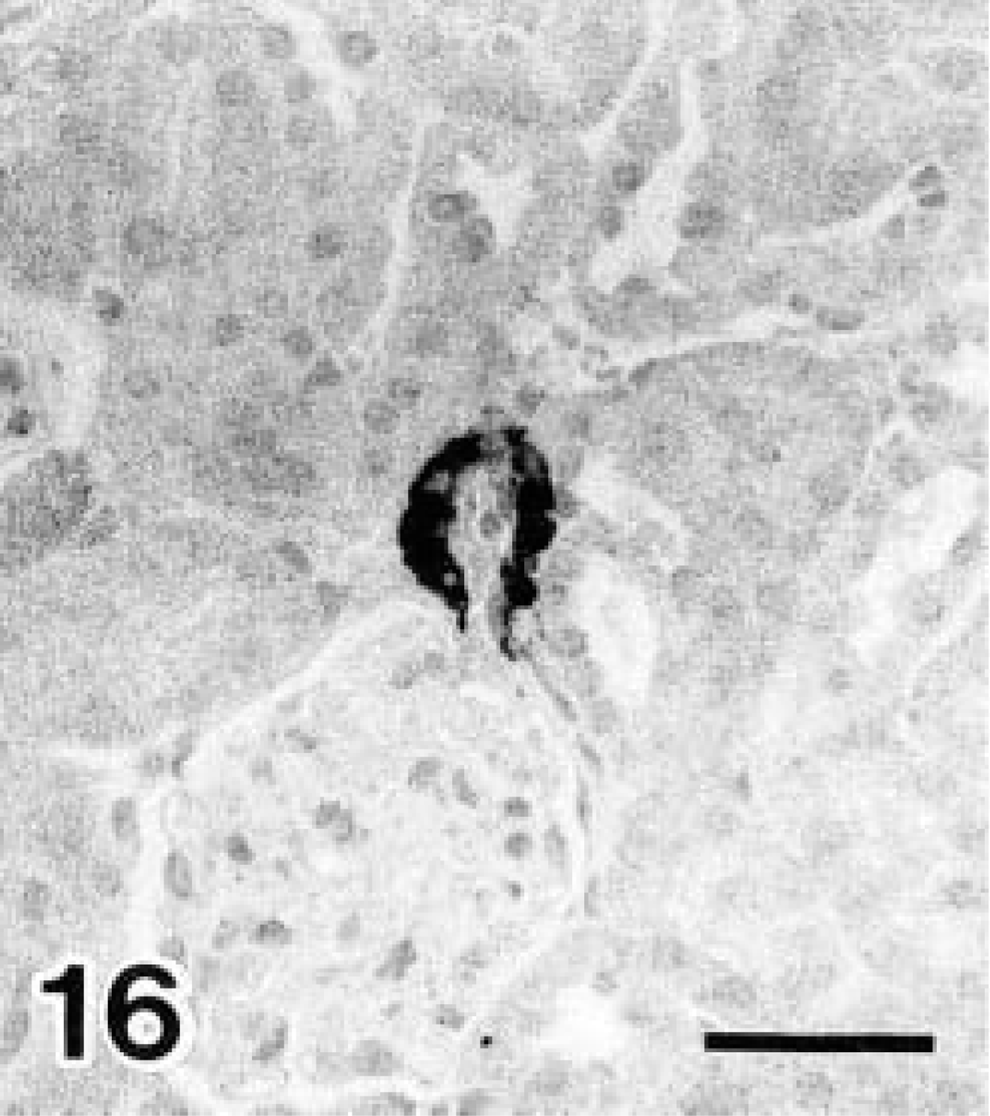
Renin detection with immunohistochemistry. Day 40 diabetic NOD mouse.
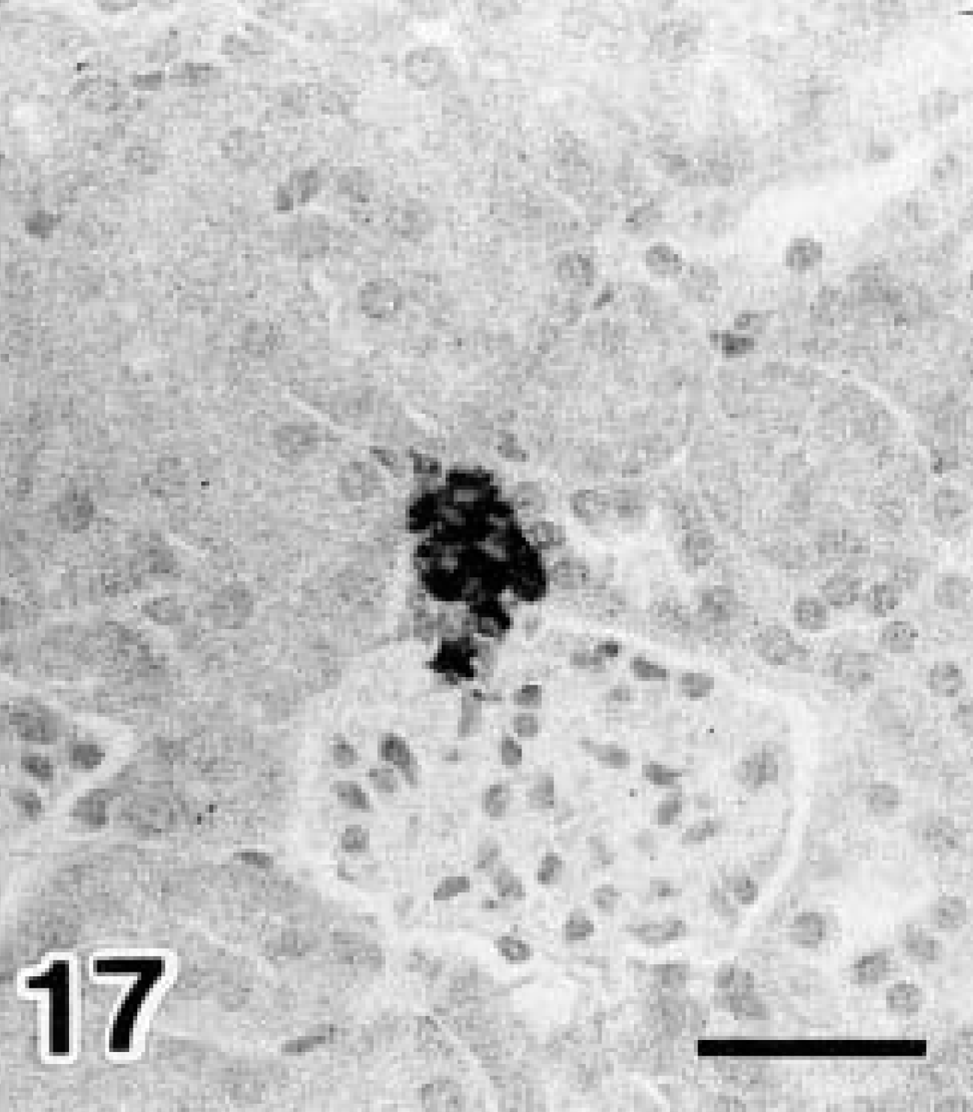
Renin detection with immunohistochemistry. Control (6-month-old NOD mice with no glycosuria). Localization or staining intensity of renin-positive reactions was not significantly different between diabetic NOD and control mice. Avidin–biotin–peroxidase complex method. Mayer's hematoxylin counterstain. Bars = 20 μm.
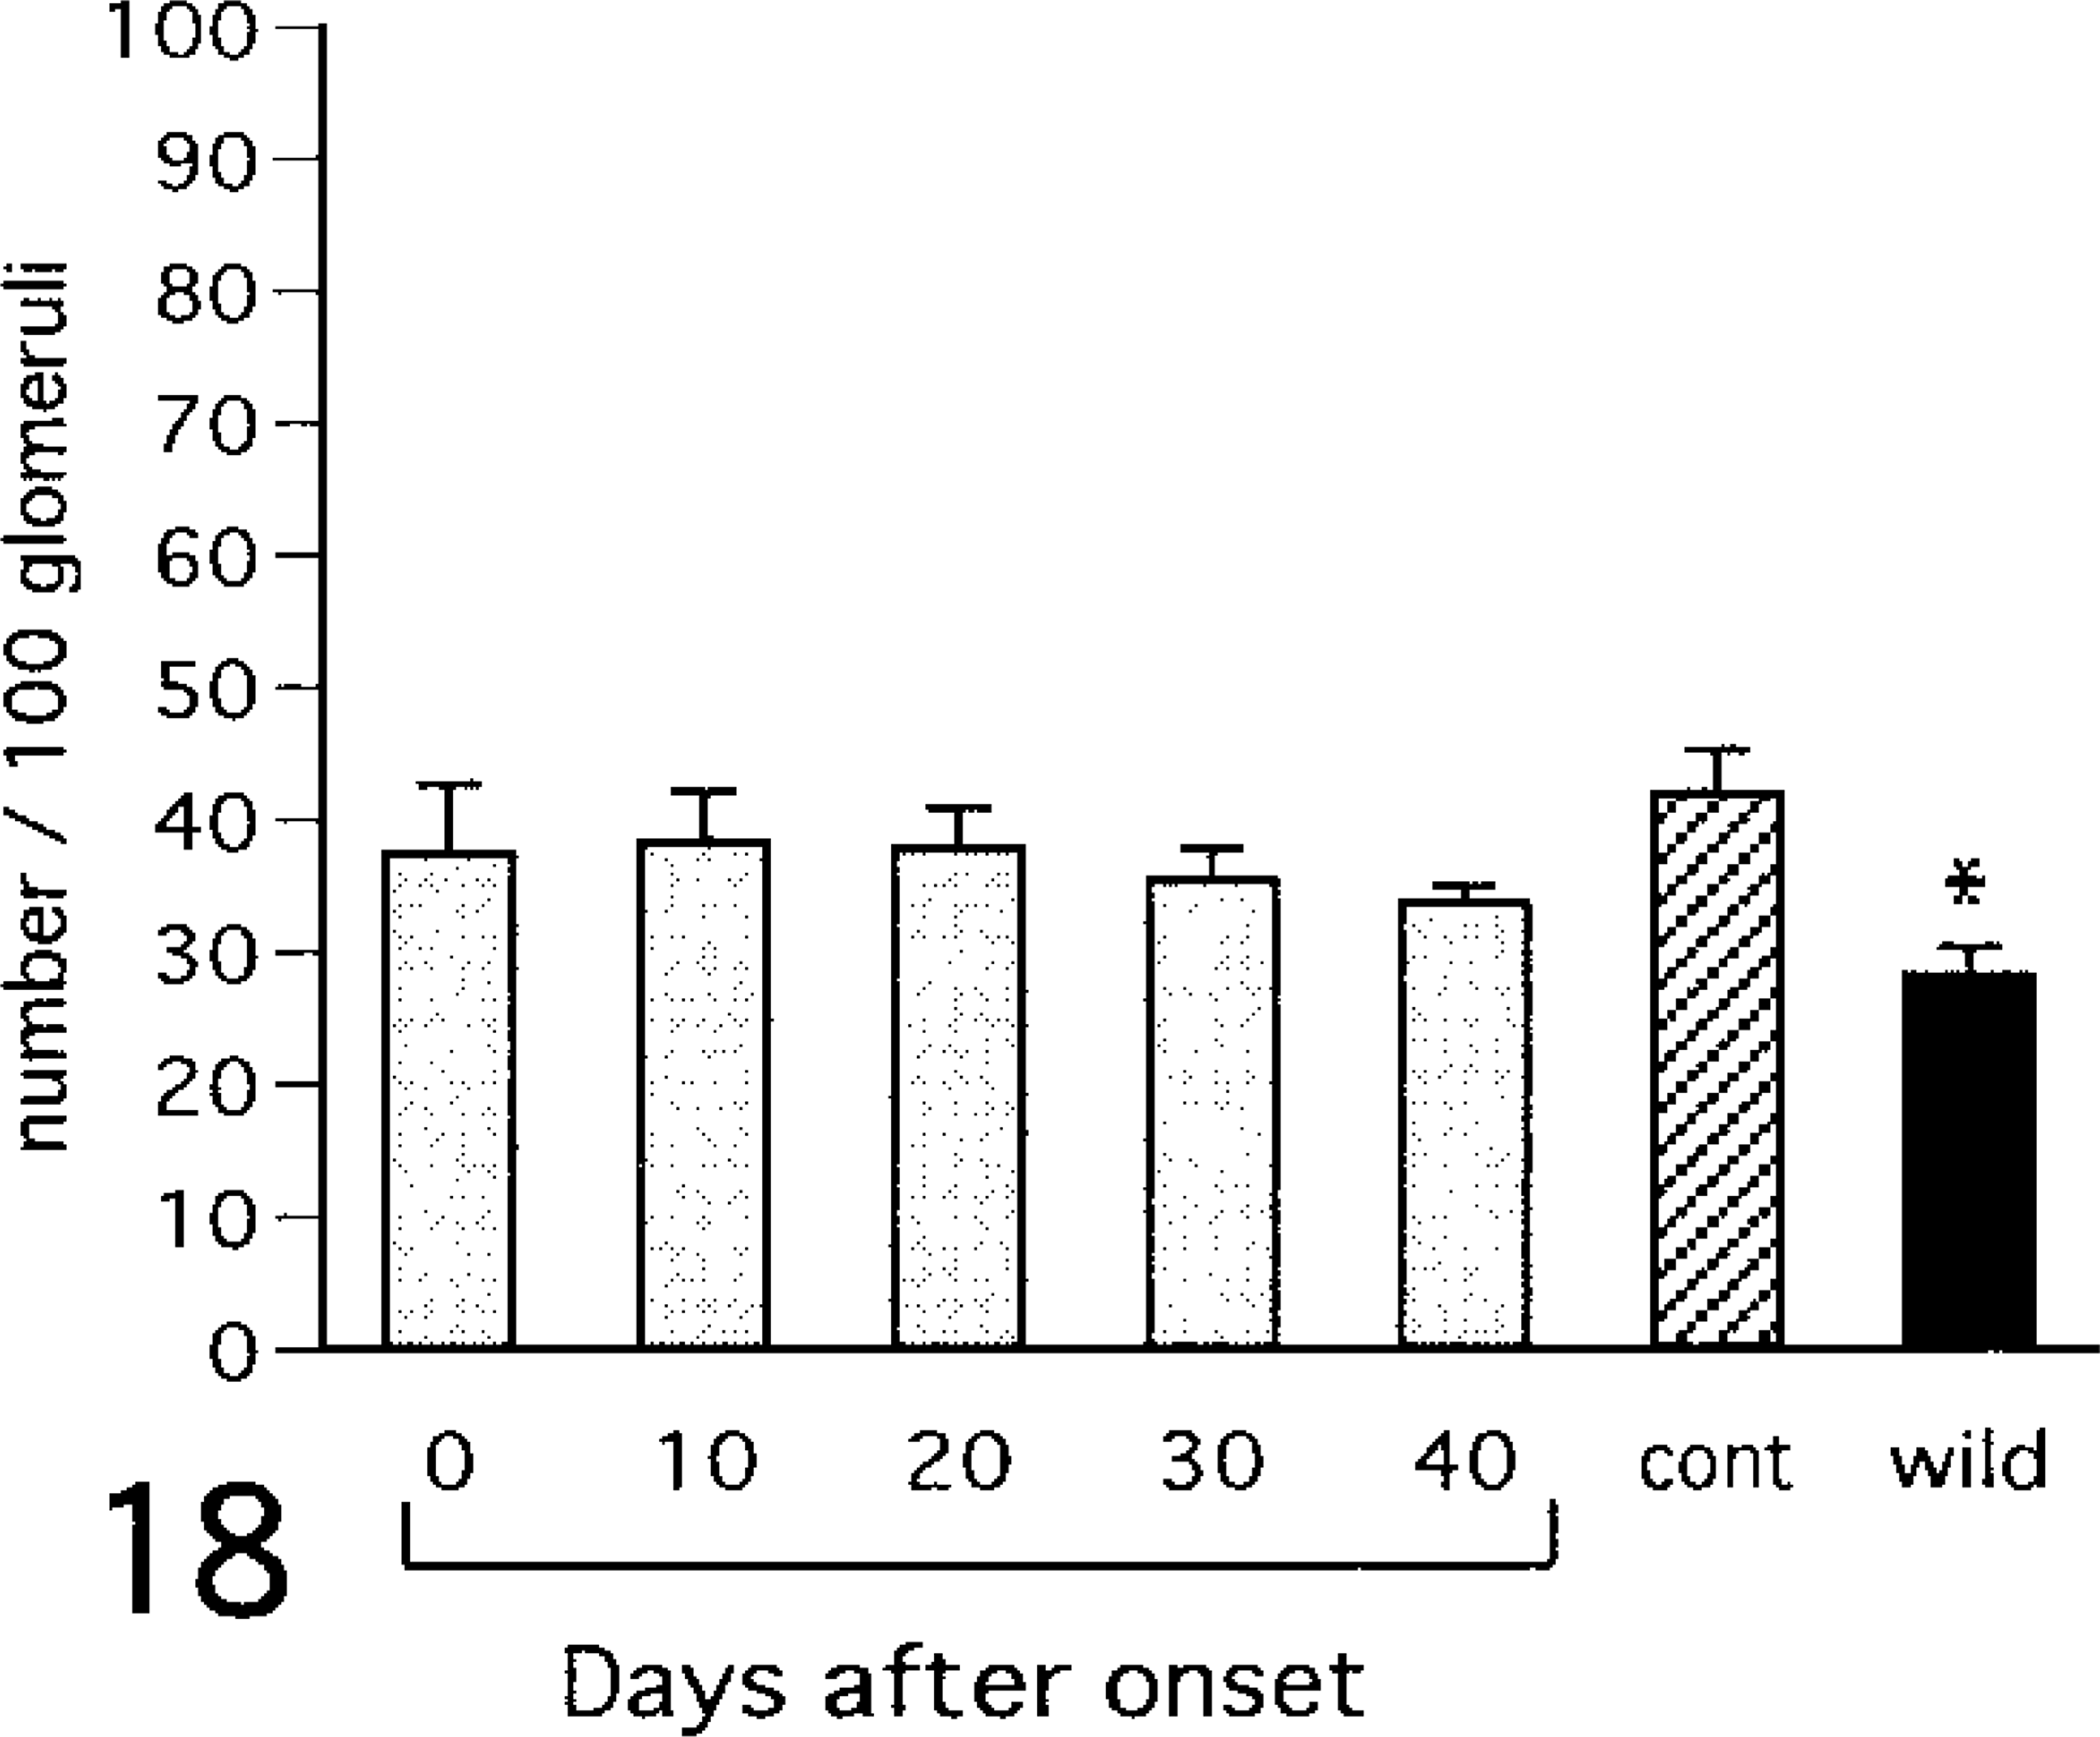
Number of renin-positive areas. cont = control (6 month-old NOD mice with no glycosuria); wild = wild type (6 month-old ICR mice). Values are mean ± SE. ∗ = vs. control (ANOVA, P < 0.05).
Electron microscopic observations
Cytologic observations were performed on day 40 of diabetes. In the glomeruli mild expansion of the mesangium and thickening of the glomerular basement membrane were observed (Fig. 19). In PST cells accumulation of electron-dense bodies was observed (Fig. 20). These bodies contained multilamellar and multivesicular matrices (Fig. 21), and were positively stained in the PFP reaction (Fig. 22). Collapse of the brush border structure was not observed in this portion. No apparent lesions were observed in other segments of the nephron.
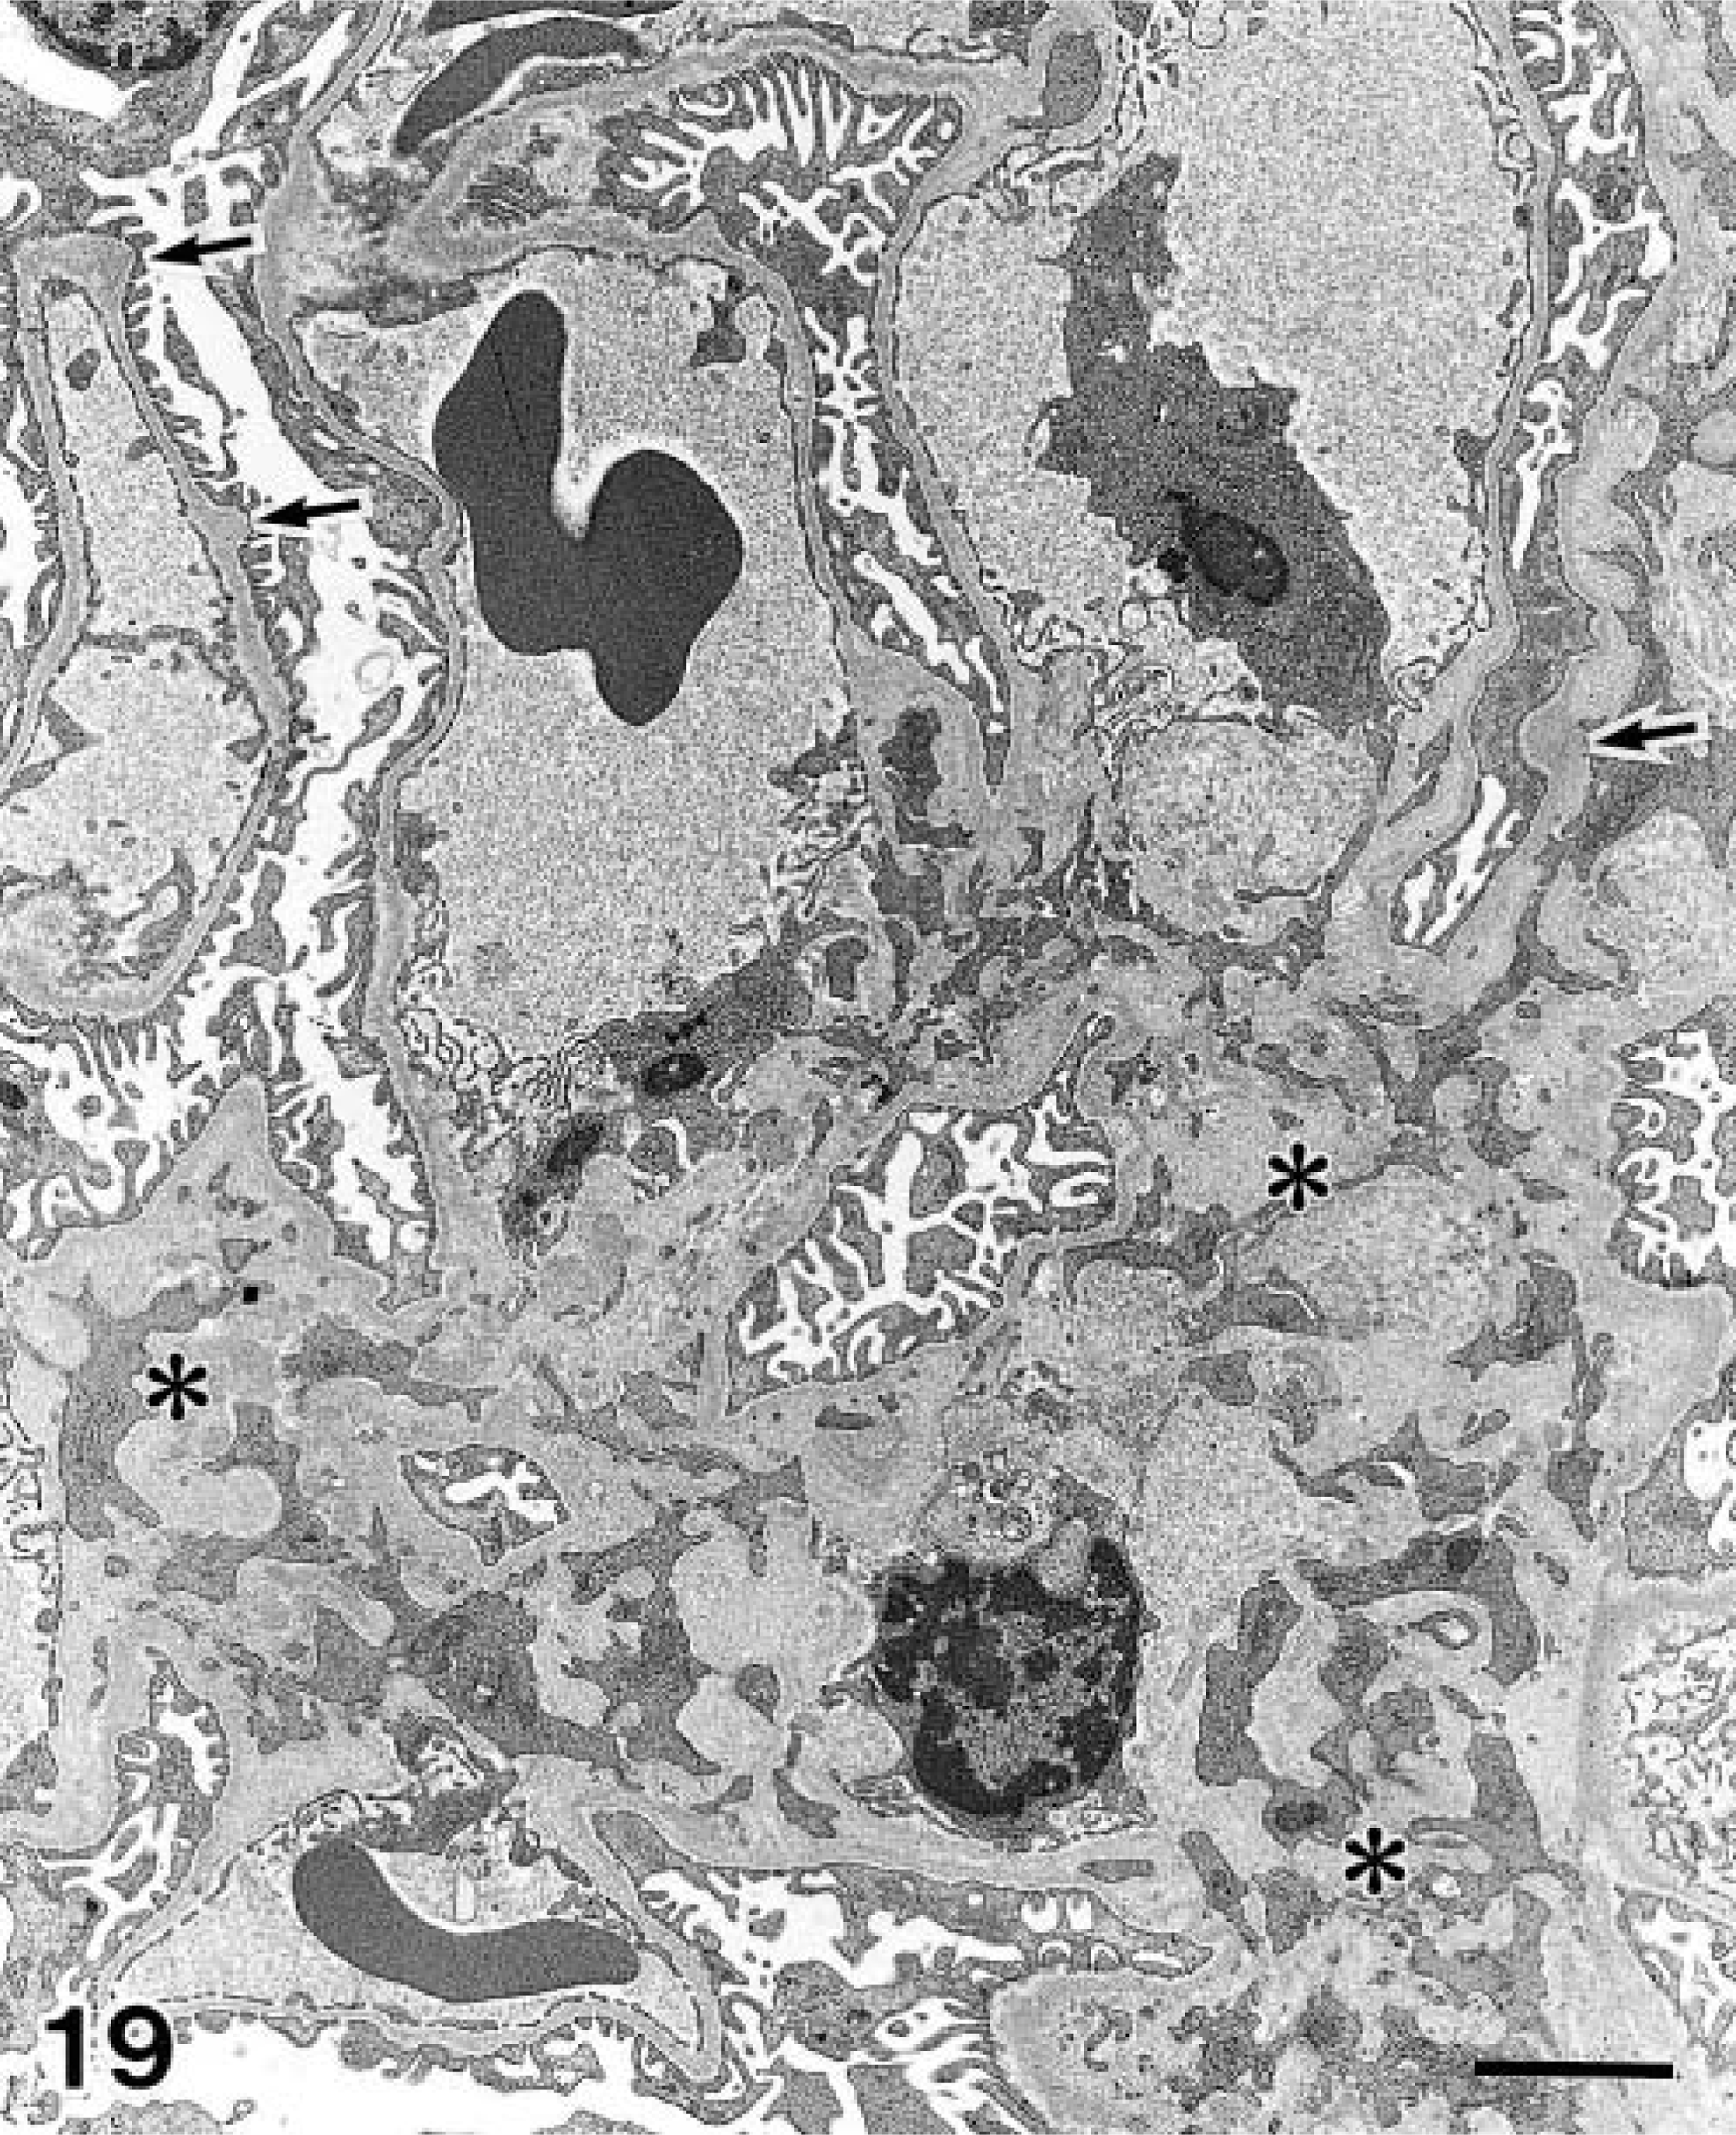
Electron micrographs of glomeruli in a day 40 diabetic NOD mouse. Mild expansion of the mesangium (∗) and irregular thickening of the glomerular basement membrane (arrows) were observed in the glomeruli. Bar = 2.5 μm.
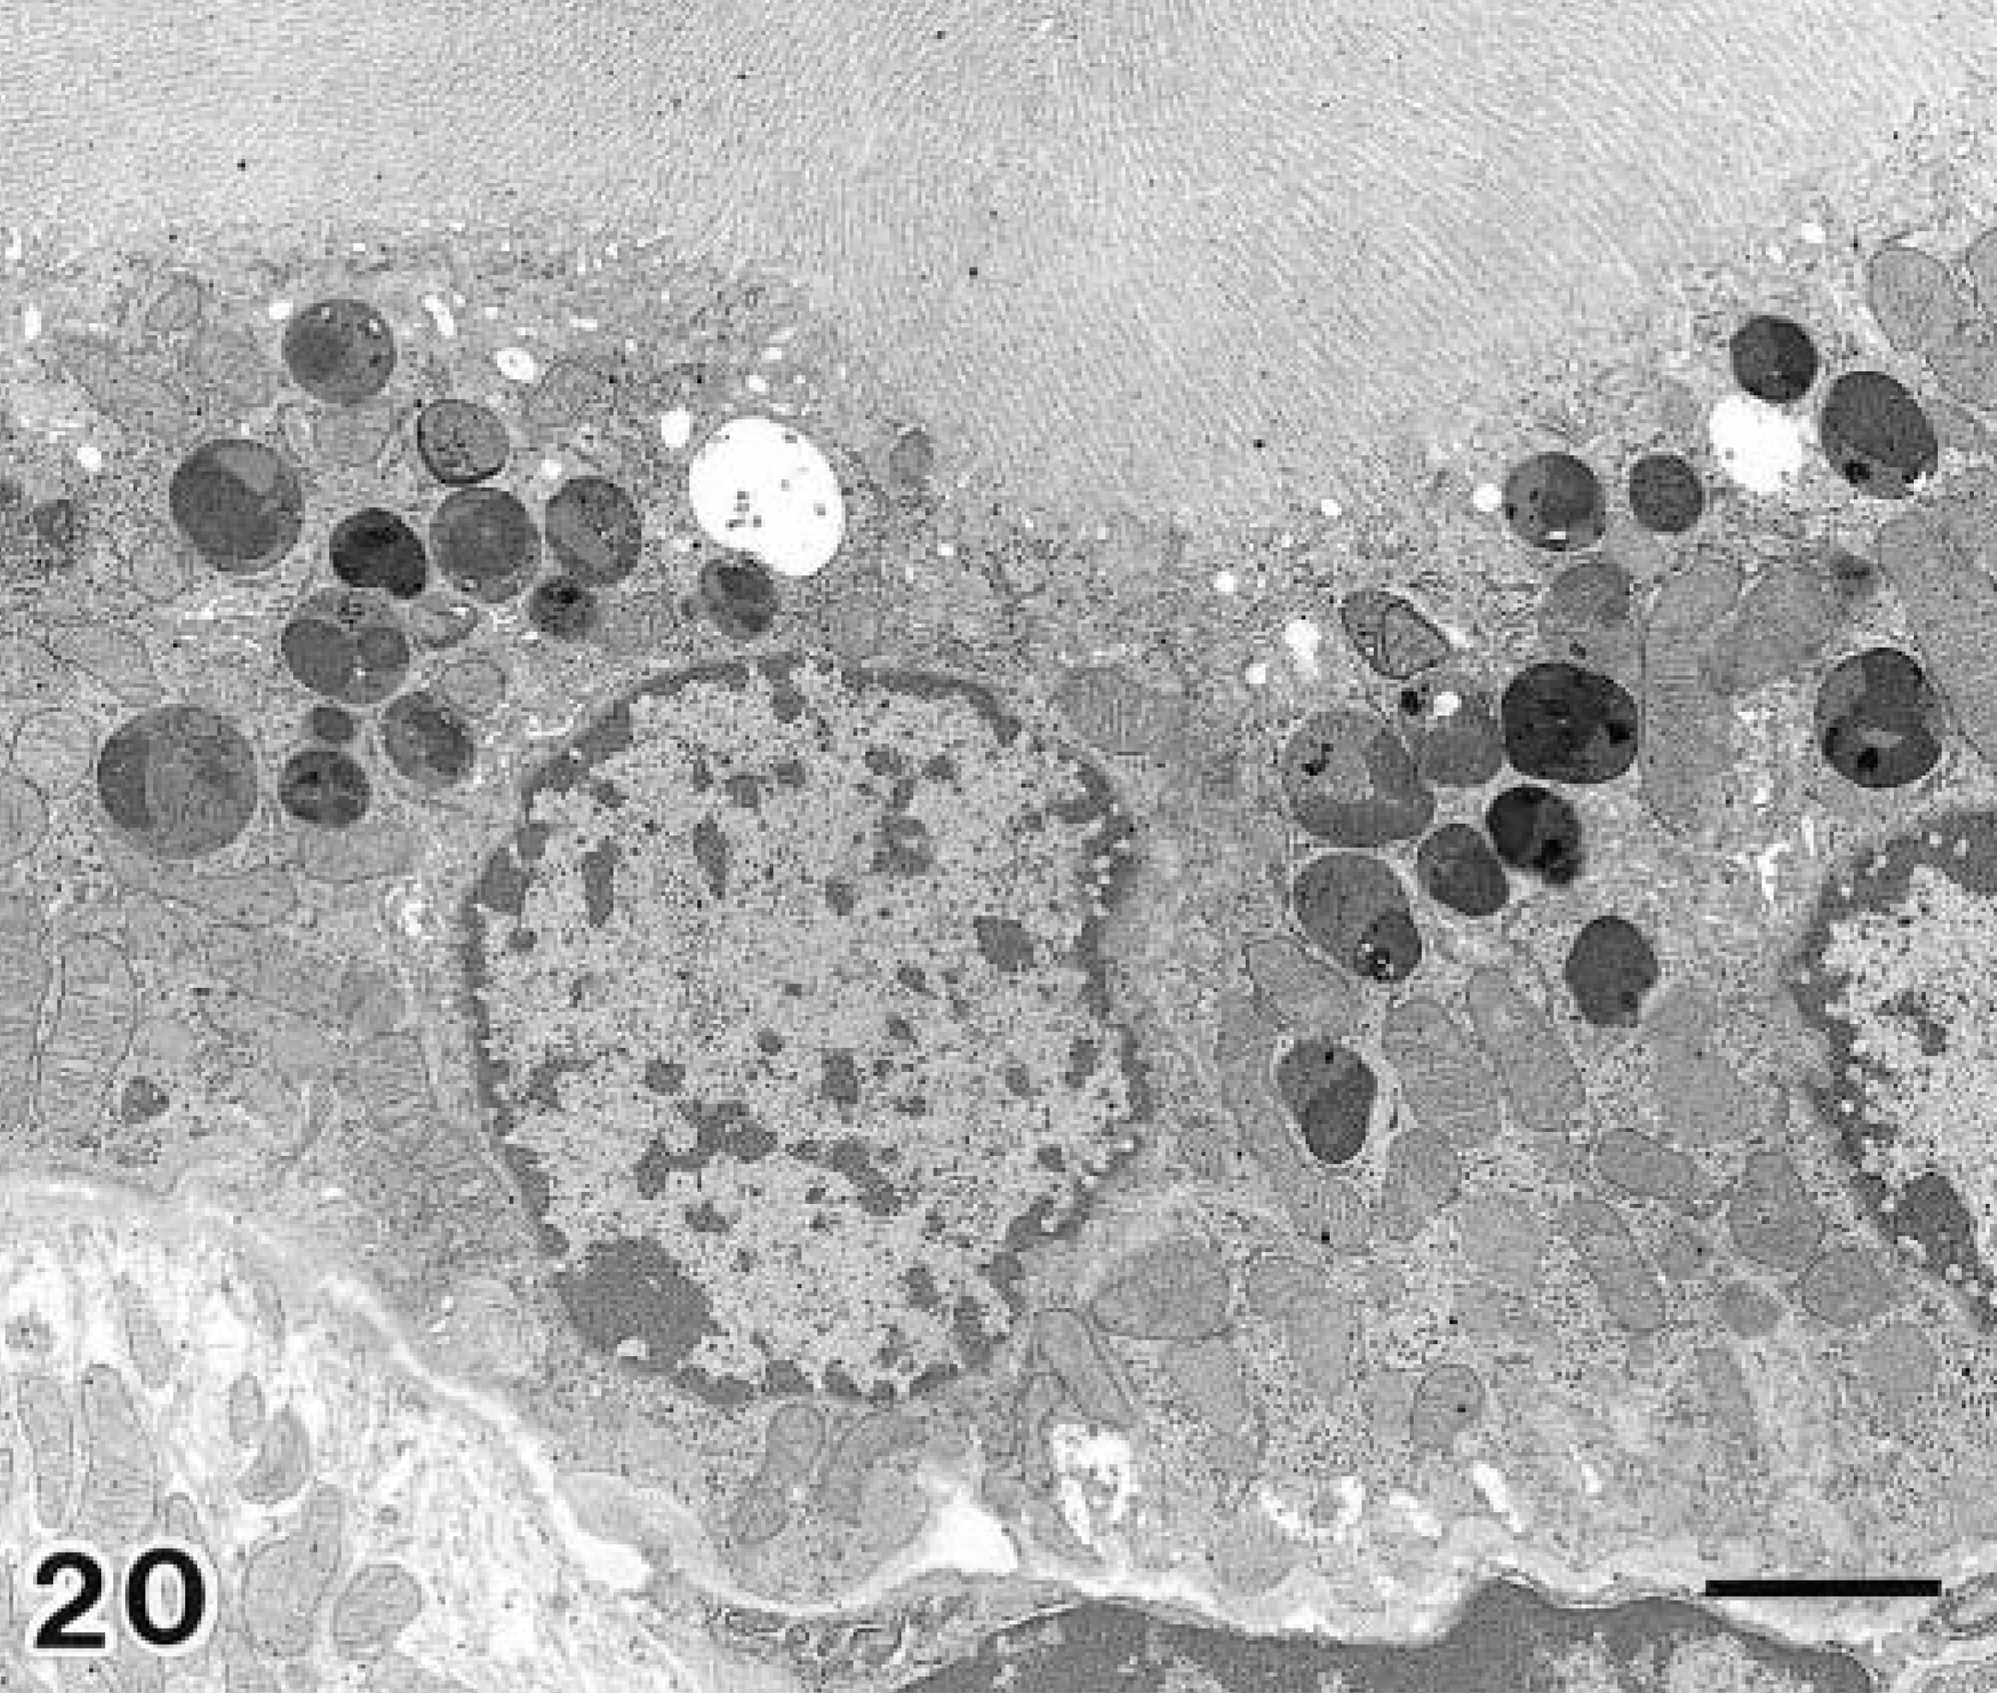
Electron micrographs of proximal straight tubular epithelium in a day 40 diabetic NOD mouse. Lower magnification view of proximal straight tubular cells. Bar = 2 μm.
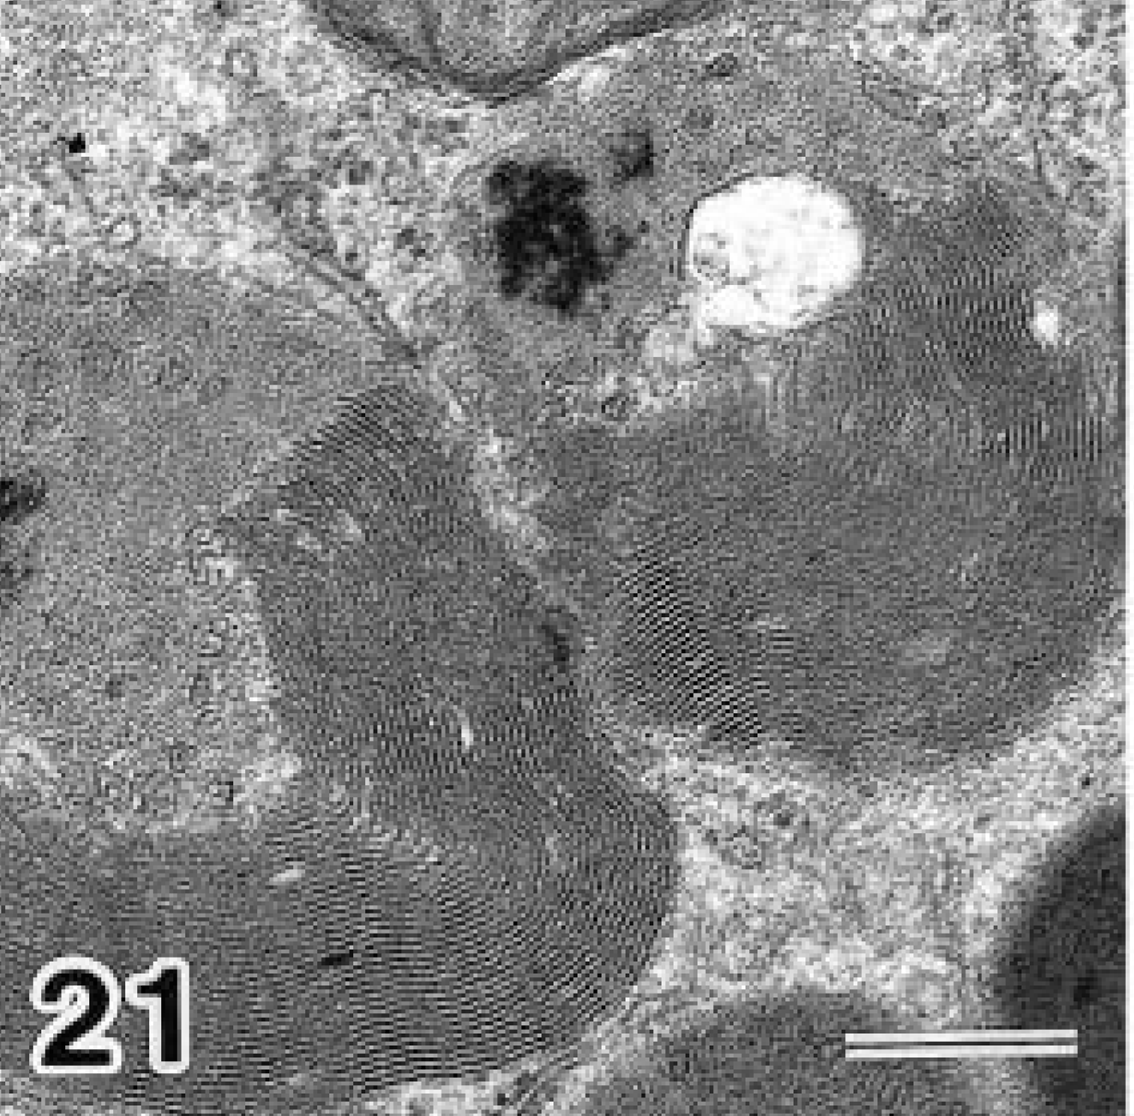
Electron micrographs of proximal straight tubular epithelium in a day 40 diabetic NOD mouse. Higher magnification view of proximal straight tubular cells. Bar = 0.3 μm.
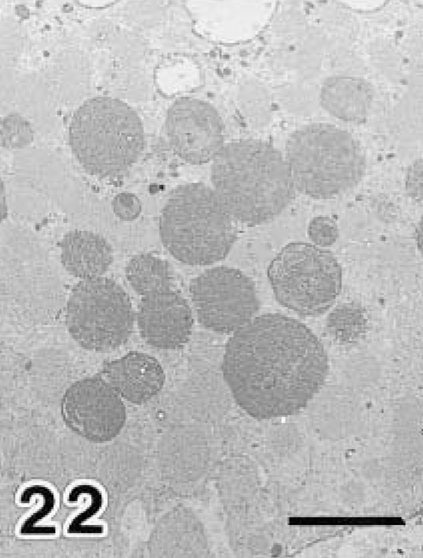
Electron micrographs of proximal straight tubular epithelium in a day 40 diabetic NOD mouse. PFP reaction. Bar = 2 μm. Accumulation of electron-dense bodies was observed in proximal straight tubular cells (Fig. 20). These bodies contained multilamellar and multivesicle matrices (Fig. 21) and reacted positively in the PFP reaction (Fig. 22).
Discussion
In the present study NOD mice were maintained without insulin therapy to develop the acute phase of IDDM. Under this condition all blood diagnostic parameters (BUN and creatinine) gradually increased after onset of diabetes. The increases were relatively slight compared with the changes observed in common clinical cases in humans, dogs, or cats with renal failure. However, the present value of creatinine or BUN on day 30 or 40 of diabetes was clearly increased compared with the values for a nephrotic syndrome model mouse in a previous report. 35 Renal failure was apparent only on day 30 and is a subchronic or chronic event in the diabetic NOD mouse model.
Kidney weight increased after onset of diabetes and plateaued on day 20 of diabetes, i.e., in early-stage IDDM under the present conditions for NOD mice. Renal hypertrophy in the early stage of diabetes is well known, 15 , 38 and an increase in the cellular replicative rate has been defined as a component of the renal hypertrophic response. 27 , 31 In the present study PCNA-positive nuclei were observed in the PT cells, and a significant increase in number was observed on day 10 of diabetes. In addition, nuclear divisions in PT cells were observed on days 10 and 20 of diabetes. These findings indicate that early DN in NOD mice is associated with renal hypertrophy.
In glomeruli, although no target alterations were evident with light microscopy, diameters increased slightly in the early stages of diabetes. In addition, electron microscopy on day 40 of diabetes revealed mild expansion of the mesangium and thickening of the glomerular basement membrane. This suggests that glomeruli of the NOD mouse are relatively resistant during acute-progressive IDDM, although injury begins from the early stages.
In uriniferous tubules apparent structural alterations were observed in PST epithelium. Recently, we reported sex-dependent histologic features in PST epithelium. 41–43 In these studies PST epithelium of the ICR, BALB/cA, C57BL/6Cr, C3H/HeN, and DBA/2Cr mice was examined, and PAS-positive granules were identified as a female-specific feature. These PAS-positive granules were identified as large multilamellar dense bodies using electron microscopy, and cytochemical analysis demonstrated that these dense bodies possess acid phosphatase activity (lysosomal marker). 41 , 42 These PAS-positive granules were observed in all NOD mice. On day 40 of diabetes an increase in the number of PAS-positive granules was seen, and excessive accumulation of multilamellar dense bodies was observed using electron microscopy. These accumulated bodies displayed PFP-positive reactions (classical lysosomal stain 11 ). These lysosomal bodies containing multilamellar bodies are classically considered as accumulated phospholipid membranes and probably engulf the membranes of damaged cell organelles. In addition, decreased PAS staining was observed in the brush border of PST epithelium on day 40 of diabetes. No structural collapse was observed in this portion of the PST using electron microscopy. We thus suggest that decreased PAS staining in the brush border results from changes in the carbohydrate composition of the glycocalyx. In experimental nephritis, changes in carbohydrate composition in the brush border have been reported in damaged PT epithelium. 1 , 17 We, therefore, determined that PSTs of the NOD mouse are susceptible to damage during acute-progressive IDDM.
In the juxtaglomerular apparatus stratification of the MD was observed, and the number of stratified MD was found to be high on day 0 of diabetes. We suggest that this decrease in stratification of the MD did not result from maturation because the ages of mice on day 0 were similar to those on days 10 and 20. Localization of nNOS in the MD has been well known, 3 , 25 , 32 and these stratified MD also showed positive reactions for nNOS. However, these findings clearly differ from those reported previously for STZ-treated rats. 16 In this report, decreased nNOS in the MD was observed in the early phase of IDDM, and an association between this change and the mechanisms of early diabetic renal hypertrophy is suggested. Although early diabetic renal hypertrophy also occurred in NOD mice in the present study, we hypothesized that the decreased nNOS reported in the STZ-treated rat is probably attributable to STZ toxicity in MD cells. The main function of nNOS in normal MD is the down-regulation of renin secretion in the juxtaglomerular cell. 6 Conversely, a previous report has suggested that overexpression of nNOS in MD induces activation of the intrarenal renin-angiotensin system (RAS). 18 From this report we hypothesized that stratification of MD implies overexpression of nNOS and activates renin secretion in the juxtaglomerular cell. In fact, activation of intrarenal RAS is recognized as an important pathogenic factor in DN. 38
The present immunohistochemical observation for nNOS revealed notable findings. In brief, an nNOS-positive reaction was observed in PST epithelium and was enhanced on day 40 of diabetes. Increases in NO molecules after enhancement of the NOS frequently induce cellular injury by formation of peroxynitrite, 5 , 13 and cells damaged in this way are eliminated by apoptosis. 4 , 19 We hypothesized that increased nNOS in the PSTs of NOD mice on day 40 of diabetes induced cellular injury, although apoptotic cells were not detected in the present study. On the other hand, a restitutive role of NO molecules in injured cells has been demonstrated previously in guinea pig gastric mucosa. 45 Thus, as another possible explanation, increased nNOS in the PST may represent the cellular restitution occurring in damaged cells. Obviously, further investigations are required to clarify the validity of these opposing hypotheses.
In conclusion, the present research represents the first thorough characterization of renal changes occurring in acute-progressive IDDM of the NOD mouse. The results reveal that kidneys in NOD mice undergo renal hypertrophy and structural alterations of the PST, and these events occur in the early stage and at the endpoint, respectively. In addition, increased nNOS reactivity was observed in the MD and PST epithelium. Such increases in nNOS have not been previously described, and further investigations are necessary.
Footnotes
Acknowledgements
We thank Mr. N. Fukuyama (Institute of Laboratory Animal Science, Faculty of Medicine, Kagoshima University) for animal maintenance.