
Abstract
Marek's disease virus (MDV) infection in the brain was studied chronologically after inoculating 3-week-old chickens of two genetic lines with two strains of serotype 1 MDV representing two pathotypes (v and vv++). Viral replication in the brain was strongly associated with the development of lesions. Three viral antigens (pp38, gB, and meq) were detected in the brain of infected chickens. Marked differences between v and vv++ pathotypes of MDV were identified for level of virus replication, time course of brain lesions, and expression of major histocompatibility complex (MHC) antigens. Two pathologic phenomena (inflammatory and proliferative) were detected in the brain of chickens inoculated with vv+MDV, but only inflammatory lesions were observed in those inoculated with vMDV. Inflammatory lesions, mainly composed of macrophages, CD4+ T cells, and CD8+ T cells, started at 6-10 days postinoculation (dpi) and were transient. Proliferative lesions, characterized by severe infiltrates of CD4+CD8- T cells (blasts), started at 19–26 dpi and persisted. Expression of MHC antigens in endothelial cells and infiltrating cells within the brain was influenced by MDV infection. Upregulation of MHC class II antigen occurred in all treatment groups, although it was more severe in those inoculated with vv+MDV. MHC class I antigen was downregulated only in those groups inoculated with vv+MDV. These results enhance our understanding of the nature and pattern of MDV infection in the brain and help to explain the neurovirulence associated with highly virulent MDV.
Keywords
A variety of neurologic syndromes linked to the central nervous system (CNS) can be induced by Marek's disease virus (MDV). Besides classical transient paralysis (TP), a syndrome characterized by a sudden onset of flaccid paralysis at about 8–10 days following MDV inoculation, we recently reported that two other neurologic syndromes are associated with highly virulent MDV (very virulent [vv] and very virulent plus [vv+] pathotypes). 13,19,38,40 Acute TP is a more severe form of TP, resulting in death within 24–72 hours after the onset of paralysis. 38 Persistent neurologic disease (PND) is characterized by the onset of persistent nonparalytic but neurologic clinical signs (ataxia, torticollis, and nervous tics) after recovery from paralysis. 13
The role of MDV in the pathogenesis of the various neurologic syndromes is still poorly understood. Earlier studies failed to document in the CNS either viral particles by electron microscopy or expression of viral antigens by immunohistochemistry. 1,20,22,28 Recently, however, MDV DNA has been detected in the brain of paralytic chickens by means of a polymerase chain reaction (PCR) assay. 8 Reverse transcription of PCR of specific regions in the genome of a vvMDV has been used to detect virus in the brain at 10 weeks postinoculation and to detect expression of viral antigen pp38. 4 The higher sensitivity of the molecular techniques might explain these results. Alternatively, recently isolated highly virulent strains of MDV may be more neurotropic. 37
The onset of paralysis results from the development of vasogenic brain edema secondary to vasculitis, although it is unknown why chickens recover or die during the acute stage of paralysis. 33,34 An immune system–mediated mechanism seems to be involved in the pathogenesis of vasculitis because immunosuppression by neonatal cyclophosphamide treatment or surgical bursectomy prevented the onset of TP. 26 Immunocomplexes were not associated with vascular lesions in previous studies. 35 However, little is known about the role of the immune response in the onset of vasculitis.
The relationship between brain lesions and the onset of PND remains unclear, but this relationship may be important because the onset of PND is a unique feature of highly virulent MDV. 13 There is evidence that highly virulent MDV can induce severe brain lesions at 10 weeks postinoculation, but the pathogenesis of these lesions is still very poorly understood. 5
Tropism for the CNS is a distinct feature of highly virulent MDV. In an attempt to elucidate the pathogenesis of MDV infection in the brain, two genetic lines of chickens were inoculated with two strains of viruses representing pathotypes v and vv+. 13,38 At that time, viral DNA was detected in the brain of all infected chickens by a standard PCR assay, but the existence of viral DNA in the brain could not be linked with the onset of neurologic syndromes associated with vv+MDV infection. Differences in the pattern of brain lesions were detected by histopathology, but brain lesions were detected in chickens of all treatment groups. Although the cell types involved in the brain lesions were not further characterized, the morphologic features indicated that several cell populations were involved. As an extension of this preliminary work, in the present study we conducted further tests on samples from the earlier experiment. For a better evaluation of viral DNA concentration, a quantitative competitive PCR assay was conducted. 29 Cell types involved in brain lesions were characterized by immunohistochemistry techniques, and expression of major histocompatibility complex (MHC) antigens (classes I and II) was studied.
The main objective of this work was to further characterize the nature and pattern of viral infection in the brain using MDV strains of different pathotypes and to establish the relationship of infection to development of cellular infiltration and clinical neurologic signs.
Material and Methods
Chickens
Chickens were F1 progeny (15×7) of Avian Disease and Oncology Laboratory line 15I5 males and line 71 females that were susceptible to Marek's disease (MD). We also used a commercial line of white leghorn chickens (TK) (Hy-Line International) considered somewhat resistant to MD. All chickens were wing-banded at hatch, sorted into the various experimental groups on a random basis, and held in modified Horsfall-Bauer isolators for the duration of the experiment. To be easily identified, all chickens were leg-banded with colored bands at the time of inoculation. TK chickens were from MD-vaccinated parents, but maternal antibodies were assumed to have decreased to negligible levels by 3 weeks of age. The 15×7 chickens were from unvaccinated breeder hens, free of antibodies to MDV, HVT, avian leukosis virus, reticuloendotheliosis virus, and other common poultry pathogens.
Viruses
Two low-passage serotype 1 MDV strains were used: the GA strain, a virulent (v) MDV pathotype, and strain 648A, which belongs to a new group of isolates of increased virulence (vv+). 10,37 The origin of these viruses and methods for virus assay and storage and titration of stocks have been described. 37
Clinical signs
Each bird, properly identified, was observed for clinical signs each day beginning at day 5 and continuing through day 26 postinoculation. Based on previous studies, two kinds of neurologic syndromes were evaluated: TP, either classical or acute, and PND. 13
Histopathology
Brains were collected fresh from killed chickens, immersed in 10% neutral buffered formalized saline solution for 8 hours, and then transferred to 70% ethanol. The tissue samples were dehydrated in graded ethanol solutions, embedded in a low-melting-point (53–55 C) paraffin, sectioned at 5 µm, mounted on glass slides, and routinely stained with hematoxylin and eosin. Perivascular mononuclear cell cuffs, vacuolization, cellular infiltration in brain parenchyma, endotheliosis, and vasculitis (measured as the presence of intramural necrotic debris and infiltration of heterophils in the vessel wall) were subjectively scored from 0 to 3 as described. 13
Viremia assay
Virus isolation was performed on blood obtained at various days postinoculation by inoculation of 106 buffy coat cells onto duck embryo fibroblast cultures and subsequent enumeration of plaques at 7–9 days postinoculation (dpi).
PCR assay
DNA was extracted from brain homogenates using a Puregene DNA Isolation Kit (Gentra System) and amplified with primers specific for the glycoprotein (gB) gene of serotype 1 MDV. Primers, PCR conditions, and internal controls used for quantitation have been previously reported. 29 The respective forward and reverse primers were 5′-CAAGGAAACATACAGGGAC-3′ and 5′-TCCAATACACCAACATCAC-3′. Mixtures for the PCR reaction consisted of the following in a total volume of 25 µl: 10 mM Tris-HCl (pH 8.3), 25 mM MgCl2, 25 mM each dNTP, Taq DNA polymerase (H. Cheng, Avian Disease and Oncology Laboratory), primers (20 µM each), and 50 ng of genomic DNA. In each reaction, 1 µl of a competitor target DNA at a different concentration was added to quantify the amount of viral DNA existing in the sample. A competitive DNA target for our samples was generated by cloning an 80-bp stuffer fragment into the gB gene of MDV serotype 1. 29 Molecular mass of the competitor target DNA was 355 bp, and the sequence of the gB gene amplified by the primers was 278 bp. Cycling conditions were denaturing at 94 C for 1 minute, 30 cycles of 94 C for 1 minute, 55 C for 1 minute, and 72 C for 1.5 minutes and a final extension at 72 C for 7 minutes. Samples (10 µl) from the reaction mixture were added to 4 µl of gel loading buffer, and products were resolved in 2% agarose after electrophoresis in 1× Tris–borate–ethylenediaminetraacetic acid buffer (pH 8.3) for 1 hour at 70 volts. Products were stained with ethidium bromide (0.5 µg/ml gel).
Several PCR were conducted for each sample with a fixed amount of sample DNA (50 ng) but with different concentrations of the internal control. The viral DNA concentration in the sample corresponded to the concentration of the internal control necessary to obtain equal levels of amplification for both sample and competitor, as determined by visual inspection. Results were expressed as femtograms of viral DNA in 50 ng of sample DNA.
Immunohistochemistry
An avidin–biotin–peroxidase complex (ABC) method (Vectastain® ABC kit, Vector Laboratories, Burlingame, CA) was used for immunohistochemistry. Cryostat sections were mounted on poly-
Each sample was stained with eight monoclonal antibodies (Mabs) divided into three groups.
Antibodies against viral antigens (pp38, gB, and meq)
The MAb H19.47 specific to antigen pp38 was used at a working dilution of 1:3,200, 7 the MAb 1AN86.17 specific to gB was used at a working dilution of 1:2,000, 7 and the MAb 23B46 specific to meq was used at a working dilution of 1:1,000. 24 Evaluation of viral antigens was conducted by counting all positive cells in a standard section of brain for each of the three antigens of this group. A standard section is defined as a midlongitudinal section of the cerebellum, plus a midsagittal section of one of the optic lobes, plus a midsagittal section of one of the cerebral hemispheres. When sections did not totally correspond with a standard section, we normalized the number of positive cells obtained to the size of the standard section.
Antibodies against cell populations
The MAb CB1, which reacts with the chB1 located in bursal B cells and with a low percentage of peripheral B cells, was used at a working dilution of 1:20. 3 The MAb CT4, which is specific to CD4 and reacts with T-cell subsets expressing CD4 (immature T cells and subpopulations of helper T lymphocytes), was used at a working dilution of 1:20. 2 The MAb CTLA3, which reacts with the T-cell subset expressing CD8 immature T cells and subpopulations of cytotoxic T lymphocytes), was used at a working dilution of 1:25. 23 The MAb K1 reacts with macrophages and was used at a working dilution of 1:5. 6 For cell population quantitation, two criteria were considered: 1) the number of positive cells in perivascular infiltrates and 2) the number of positive cells per field in neuropil infiltrates (apparently unrelated to blood vessel), with magnification of 40×. The number of positive cells in perivascular infiltrates was evaluated by counting the number of positive cells in relation to the total number of cells composing infiltrates surrounding 90 randomly selected blood vessels (30 in each of the brain regions studied: cerebellum, cerebrum, and optic lobes). Because of the high cellularity surrounding some of the blood vessels, it was sometimes difficult to distinguish between infiltrating cells and constituent cells of the brain, i.e., endothelial cells and glial cells. To avoid overcounting infiltrating cells, control uninoculated chickens were similarly evaluated, and the number of cells in 90 normal blood vessels was calculated. This number was subtracted from gross counts for inoculated chickens to determine the number of infiltrating cells. The number of positive cells per field was evaluated by counting the number of positive cells, unrelated to blood vessels, that diffusely infiltrated the neuropil in 90 randomly selected fields, 30 in each brain region (at 40× magnification).
Antibodies against MHC antigens
The MAb CGB12 (M. Miller, unpublished) reacted with MHC class I (MHC-I) and was used at 1:2,000. The MAb CI-a reacts with MHC class II (MHC-II; chicken homologous to Ia antigen in other species) present in B cells, activated T cells, and macrophages and was used at 1:20. 11 MHC expression was evaluated using criteria similar to those used for evaluating cell populations. In addition, MHC expression in endothelial cells and intensity of the background of the staining were also considered. Because position identification of endothelial cells was not always possible, they were not enumerated. Instead, a subjective score of 0 to 3 was used to indicate the relative number of positive cells. Intensity of background staining was only determined for MHC-I expression. Once we determined that background developed during the staining process was specific, it was scored from 0 to 3 to indicate relative intensity. To exclude technical artifacts, each sample was stained twice at different times and contrasted with uninoculated age-matched control chickens. A result was considered positive when control chickens did not show any background and the sample developed the same background in the two replicate stains.
Experimental design
Three-week-old chickens of two genetic lines (15×7 and TK) were inoculated with MDV strains (GA/22 and 648A) representing two pathotypes (v and vv+). One experiment was conducted with two replicate trials. Except where indicated, replicate data were pooled. In replicate 1, chickens were randomly distributed in lots, each consisting of 19 chickens. For each chicken strain there were three lots. Chickens of two lots were inoculated by the intraabdominal route with 500 plaque-forming units of one of the two viruses, and the other lot remained as a noninoculated control group. Clinical signs were checked daily for each chicken. Ten chickens selected at random from each group were removed at 6, 8, 10, 12, and 19 dpi (two chickens per interval). Blood samples for viremia tests were collected from each chicken prior to death. CNS samples were collected for PCR, histopathology, and immunohistochemistry. From each brain, a midline and midlateral section were taken to allow visualization of the cerebellum, optic lobe, and cerebrum. A piece of each of the three brain regions was frozen at −70 C for PCR analysis. The remaining tissue, also from the three regions, was split. One part was fixed in 10% neutral buffered formalized saline solution for histopathologic studies, and the other part was snap frozen in liquid nitrogen and stored at −70 C for immunohistochemical studies. Replicate 2 was similar to replicate 1 except that the lot of 15×7 chickens inoculated with MDV 648A was duplicated to increase the number of survivors and the observation period was extended to 26 dpi with samples taken at 6, 8, 10, 12, 19, and 26 dpi. Chickens of the extra lot were checked for clinical signs, and data from the duplicate lots were pooled. Between the two replicates, each treatment group at each time point was represented by four chickens (6–19 dpi) or two chickens (26 dpi). However, some DNA samples were accidentally lost from replicate 1, and these birds were excluded from analysis. Also excluded from analysis were 12 birds from both replicates that were negative for both viremia and histologic brain lesions and were presumed to be not infected, as had been previously noted for cases of “late” paralysis. 13 A few additional birds were excluded to balance the number analyzed per treatment group at no more than three chickens. This animal experiment was described previously in detail. 13,38
Statistical analysis
Data were analyzed with the statistical program SPSS/PC+ (SPSS, Chicago, IL). Variables evaluated included clinical signs (frequency and intensity), histopathologic changes (perivascular cuffing, vacuolization, vasculitis, and cellularity of neuropil), viral parameters in the brain (amount of viral DNA and number of cells expressing pp38, gB, and meq), cell populations involved in brain lesions (number of positive cells in perivascular infiltrates and number of positive cells per field, calculated in both cases for B cells, CD8+ T cells, CD4+ T cells, and macrophages), and expression of MHC antigens in CNS (percentage of MHC-I– and MHC-II–positive cells in perivascular infiltrates, number of MHC-I– and MHC-II–positive cells in neuropil infiltrates per field, MHC-I and MHC-II expression in endothelial cells, and MHC-I background of the neuropil). Because variables studied either were qualitative or did not follow a normal distribution in a Kolmogorov–Smirnov test, the nonparametric Spearman test was conducted for correlation studies.
Results
Clinical signs
Results of clinical signs observed during this experiment have been previously reported in detail. 13 None of the GA-inoculated chickens developed TP or PND. The 15×7 chickens inoculated with 648A developed acute TP (85.3%), and most of the survivors developed PND later (5.9%). TK chickens inoculated with 648A mostly developed classical TP (22.2%) and PND (11.1%).
Viremia
Virus was isolated from buffy coat cells from most inoculated chickens in all treatment groups at all sample times, commencing at 6 dpi. However, of 89 inoculated chickens tested between 6 and 26 dpi, 15 birds (17%) were virus negative. Of these, 12 were also negative for histologic brain lesions. These 12 birds were distributed randomly among replicates, sample times, and treatment groups (data not shown).
Brain lesions
Evolution of brain lesions detected in this experiment and differences in the pathologic pattern among inoculated groups have been carefully described elsewhere. 13 Of particular interest here were the following issues. Endothelial cells were the first element to be altered; they appear hypertrophied at 6 dpi in chickens inoculated with 648A and at 8 dpi in chickens inoculated with GA. Soon after, mononuclear perivascular cuffs were detected in all inoculated chickens. Only those chickens inoculated with 648A developed severe vasculitis and perivascular vacuolization at 8–10 dpi. Vasculitis was transient and disappeared by 12–19 dpi. Nonetheless, perivascular cuffing remained and diffuse cellular infiltration of the neuropil tended to increase. At early stages (8–12 dpi), the infiltrating cells were small to medium in size, rounded in shape, and basophilic but became larger, ovoid, and poorly basophilic at late stages (19–26 dpi). Vacuolization persisted and even increased, but the vacuoles changed in distribution, shape, and size. First, they were mostly perivascular, linear or oblong, and generally small. At the end of the study, the vacuoles usually presented a diffuse pattern in the neuropil and were larger and round.
Viral parameters
Viral DNA was detected in all 15×7 chickens inoculated with 648A at every time point of this study (from 6 through 26 dpi) (Table 1). The amount of viral DNA rose quickly between 6 and 8 dpi and persisted. Viral DNA in the CNS of TK chickens inoculated with 648A followed a similar pattern but was not detected before 8 dpi, and the amount of viral DNA was consistently lower than that detected in 15×7 chickens. In groups inoculated with GA/22, the presence of viral DNA in the brain occurred later and was transient. Viral DNA was not detected in any chicken of these groups at 26 dpi. Brains of all uninoculated control chickens were negative by PCR assay at all time points (data not shown). The time course of the amount of viral DNA in the brain seemed to be correlated with the pattern of clinical signs and with the time course of brain lesions. Virus reached the brain earlier and persisted longer in those groups showing clinical signs and severe, persistent brain lesions.
Viral DNA and viral antigen expression in the brains of chickens of two lines inoculated with two strains of Marek's disease virus and killed at different days postinoculation (dpi) ∗
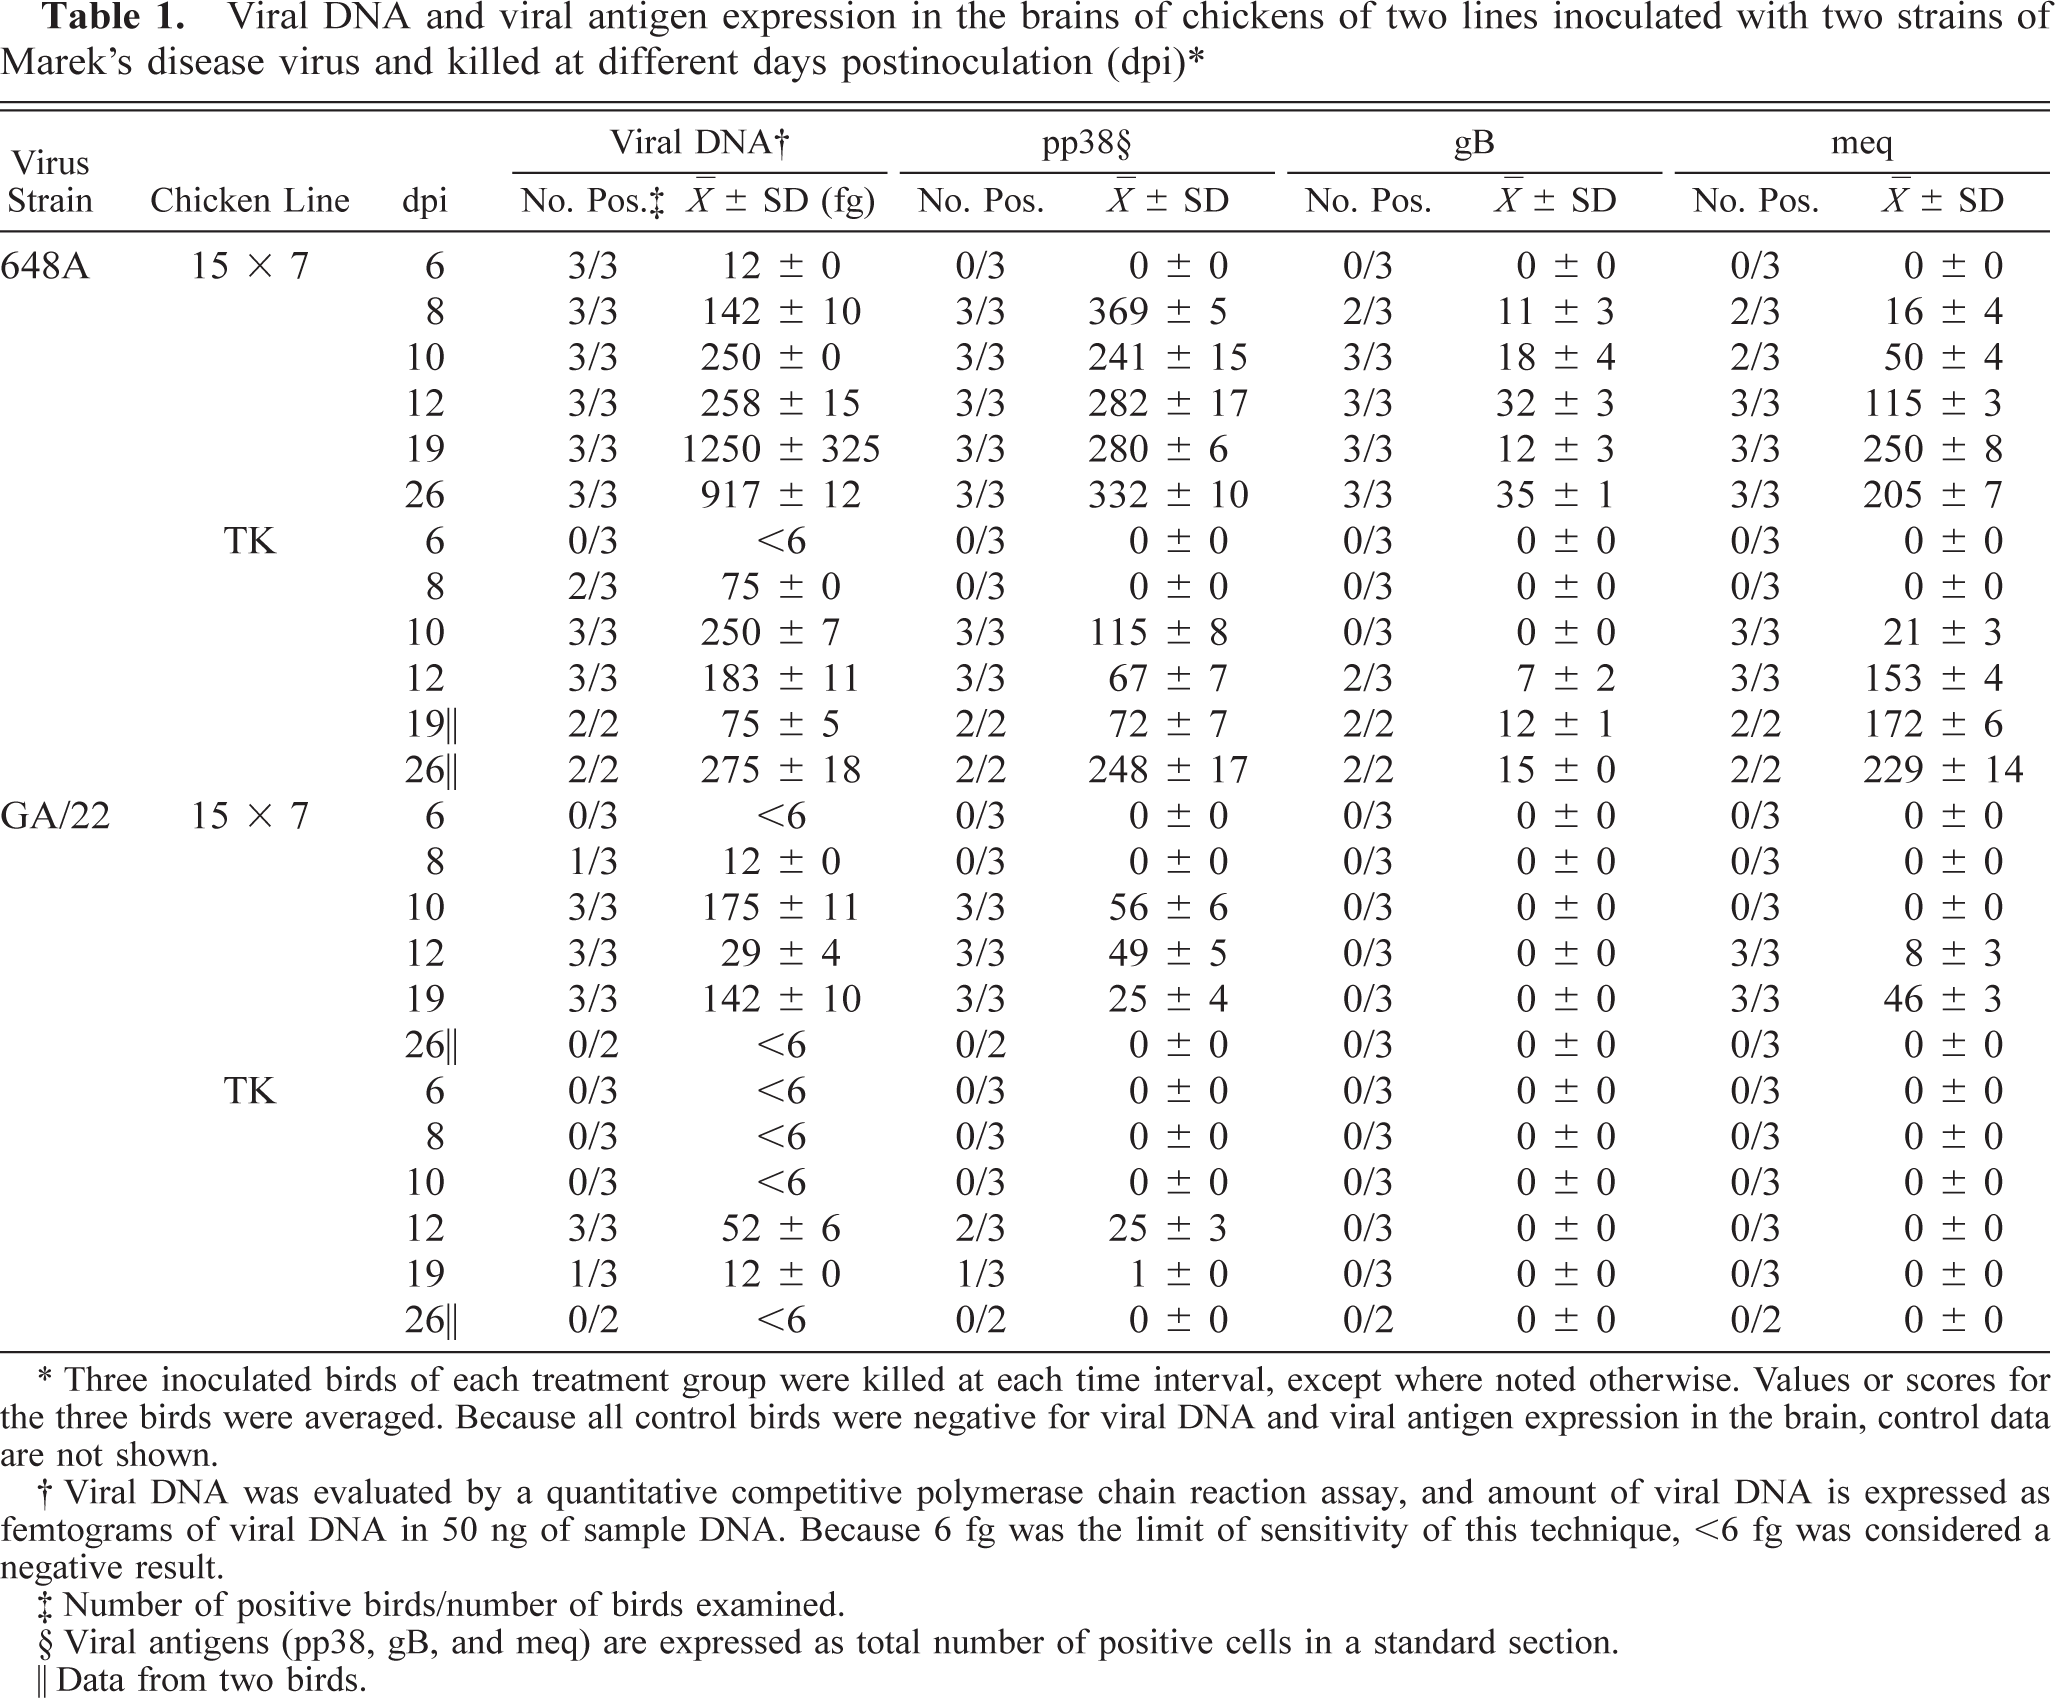
∗ Three inoculated birds of each treatment group were killed at each time interval, except where noted otherwise. Values or scores for the three birds were averaged. Because all control birds were negative for viral DNA and viral antigen expression in the brain, control data are not shown.
† Viral DNA was evaluated by a quantitative competitive polymerase chain reaction assay, and amount of viral DNA is expressed as femtograms of viral DNA in 50 ng of sample DNA. Because 6 fg was the limit of sensitivity of this technique, <6 fg was considered a negative result.
‡ Number of positive birds/number of birds examined.
§ Viral antigens (pp38, gB, and meq) are expressed as total number of positive cells in a standard section.
‖ Data from two birds.
The expression of viral antigens paralleled the presence of viral DNA in the brain in many chickens, especially expression of the early protein pp38 in groups inoculated with 648A (Table 1). A variety of morphologic features were observed in the cells positive for pp38 antigen (Fig. 1). Most of the pp38+ cells were round and were probably lymphoid cells. Nonetheless, a few elongated pp38+ cells resembled endothelial cells. The pp38 was observed in both cytoplasm and nucleus and on the cell surface. Positive cells were usually isolated; clusters of positive cells were very infrequent. Expression of pp38 was observed within 2–4 days following viral DNA detection in all inoculated groups. The number of cells bearing the pp38 antigen and the pattern of expression for this antigen varied greatly among the inoculated groups. The time course of pp38 expression in the brain by groups (Table 1) was similar to that described for the amount of viral DNA. The relationships between level of pp38 expression and intensity of brain lesions and between pp38 expression and clinical signs (frequency of both TP and PND) were confirmed by the finding of significant correlation (P < 0.05) in all inoculated groups.
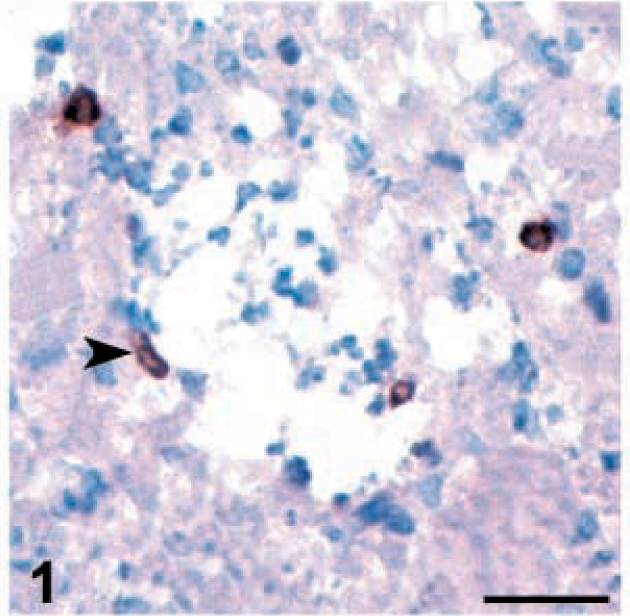
Brain; 15×7 chickens infected with MDV 648A. Expression of viral antigens and cell population infiltrating in the brain. Cerebellum. Several pp38+ cells in both perivascular locations and diffuse in the neuropil at 8 dpi. Note differences in morphology among cells. One of the cells associated with a blood vessel was elongated, resembling an endothelial cell (arrowhead). Bar = 30 µm.
Cells expressing the late protein gB were much less frequent than those expressing pp38 (10–60-fold less) and were detected only in groups inoculated with 648A. Characteristics of gB+ cells were similar to those described for pp38+ cells. All gB+ cells found resembled lymphoid cells, and no elongated gB+ cells were detected.
As has been previously reported, meq expression was restricted to the nucleus and was strongest in the nucleolus (Fig. 2). 24 The meq+ cells tended to appear in clusters, especially in areas of severe lymphoid infiltration. They were located either in proximity to blood vessels or were infiltrating the neuropil. When the number of cells bearing meq antigen was very low, isolated positive cells could be detected. The expression of meq protein was detected in both strains of chickens inoculated with 648A (Table 1) and coincided with the onset of pp38 expression. The pattern of meq expression was different from that of pp38; the number of meq+ cells tended to increase throughout the study. Significant correlation (P < 0.05) was found between meq expression and frequency of PND in the two groups inoculated with 648A. Very few meq+ cells were detected in 15×7 chickens inoculated with GA/22. The expression of meq in this group was very low and transient. No meq+ cells were observed in TK chickens inoculated with GA/22. None of the viral antigens were detected in the brains of uninoculated control chickens at any point of the study (data not shown).
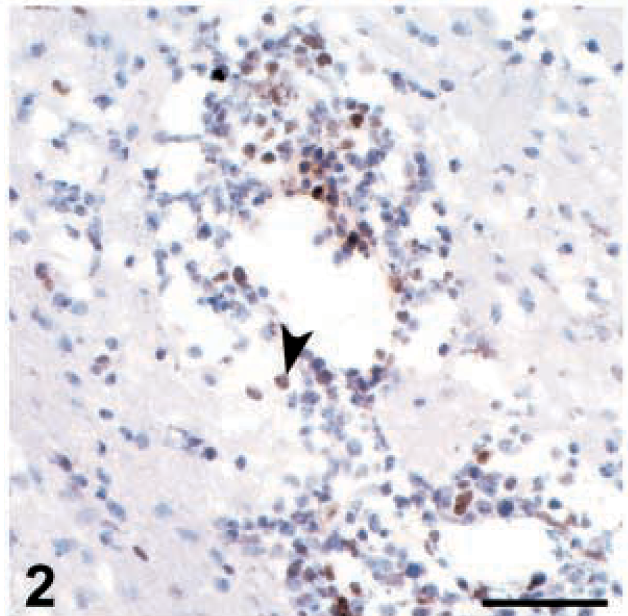
Brain; 15×7 chickens infected with MDV 648A. Expression of viral antigens and cell population infiltrating in the brain. Cerebellum. Perivascular cuffing showing many meq+ cells (arrowhead) at 19 dpi. Bar = 50 µm.
Cell populations involved in brain lesions
Increase of brain cellularity was consistently observed in all chickens after MDV inoculation. Cellular infiltrates appeared at two sites: adjacent to blood vessels and diffuse in the neuropil. Severity of total cell infiltrates in both locations was quantified (Table 2). All inoculated groups showed a mild perivascular infiltration in perivascular location as early as 6 dpi, but this infiltration was more evident in those groups inoculated with 648A (Table 2). Moreover, total perivascular cellularity increased in all four groups but at different time points and different magnitudes. Increased cellularity also was observed in the neuropil for each group at exactly the same relative time point as for perivascular infiltrates.
Immunohistochemical characterization of infiltrating cell populations (blood vessel associated or diffuse in the neuropil) in the brains of chickens of two lines inoculated with two strains of Marek's disease virus and killed at different days postinoculation (dpi). ∗
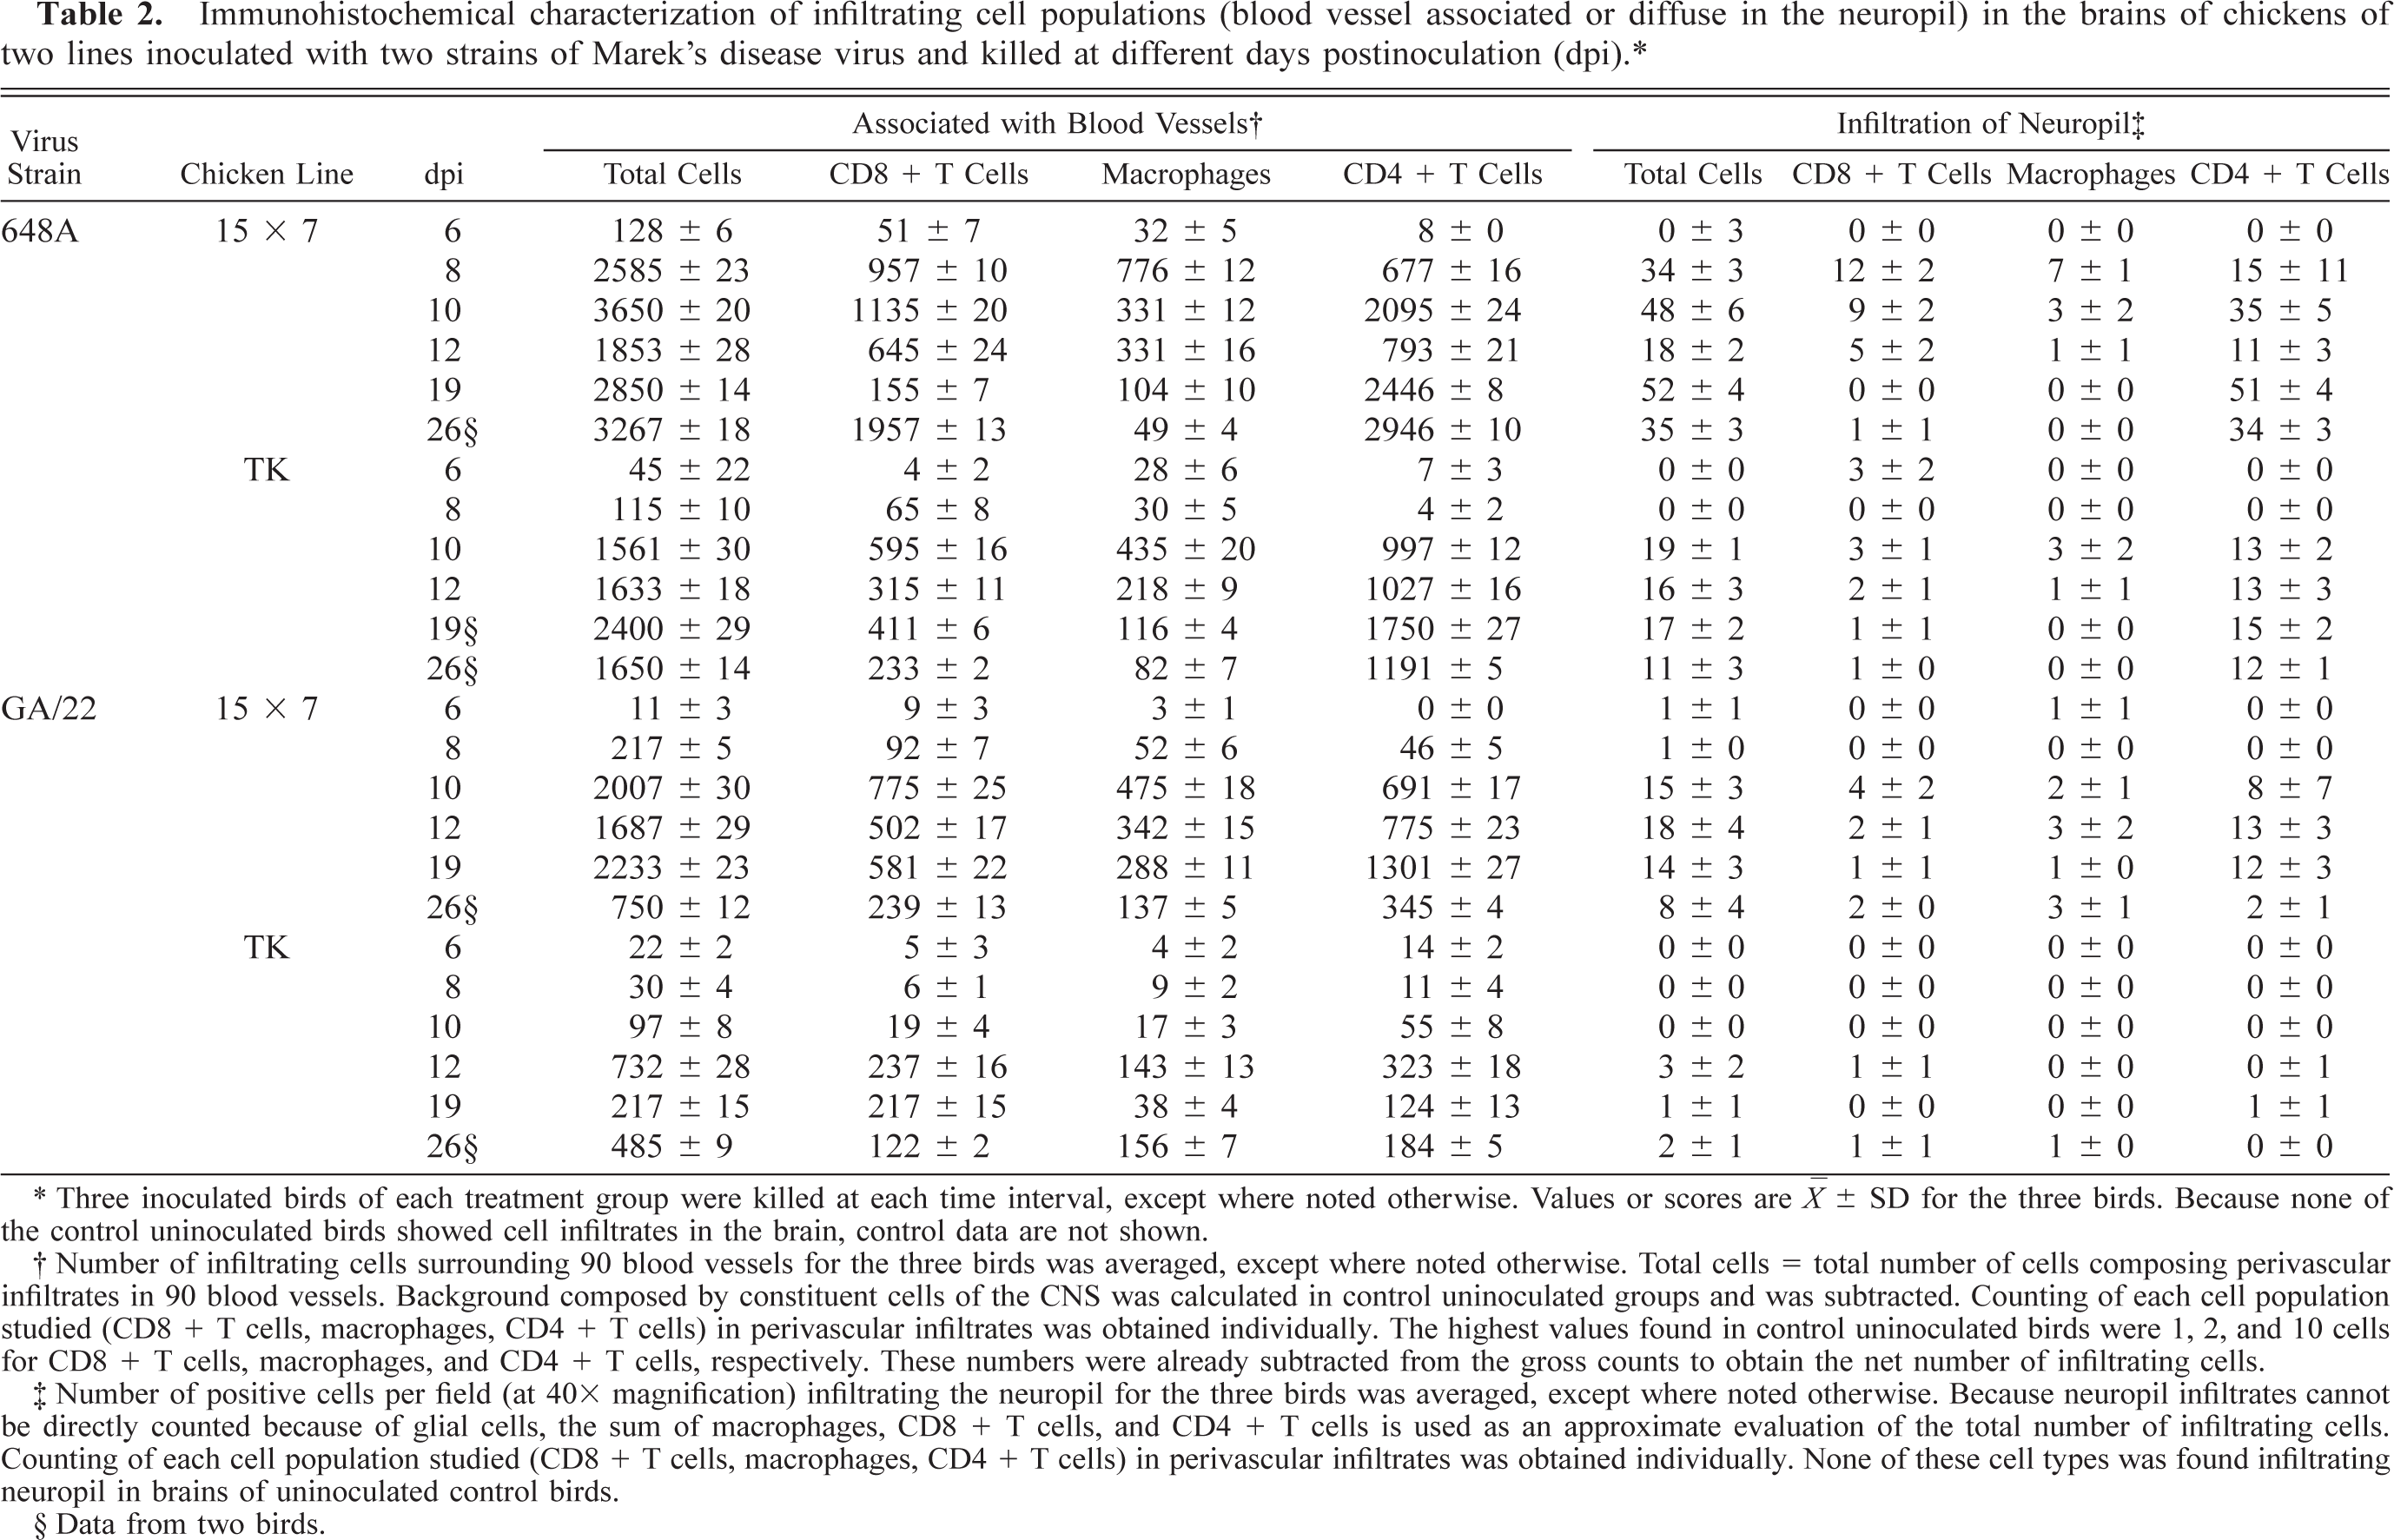
∗ Three inoculated birds of each treatment group were killed at each time interval, except where noted otherwise. Values or scores are ○ ± SD for the three birds. Because none of the control uninoculated birds showed cell infiltrates in the brain, control data are not shown.
† Number of infiltrating cells surrounding 90 blood vessels for the three birds was averaged, except where noted otherwise. Total cells = total number of cells composing perivascular infiltrates in 90 blood vessels. Background composed by constituent cells of the CNS was calculated in control uninoculated groups and was subtracted. Counting of each cell population studied (CD8 + T cells, macrophages, CD4 + T cells) in perivascular infiltrates was obtained individually. The highest values found in control uninoculated birds were 1, 2, and 10 cells for CD8 + T cells, macrophages, and CD4 + T cells, respectively. These numbers were already subtracted from the gross counts to obtain the net number of infiltrating cells.
‡ Number of positive cells per field (at 40× magnification) infiltrating the neuropil for the three birds was averaged, except where noted otherwise. Because neuropil infiltrates cannot be directly counted because of glial cells, the sum of macrophages, CD8 + T cells, and CD4 + T cells is used as an approximate evaluation of the total number of infiltrating cells. Counting of each cell population studied (CD8 + T cells, macrophages, CD4 + T cells) in perivascular infiltrates was obtained individually. None of these cell types was found infiltrating neuropil in brains of uninoculated control birds.
§ Data from two birds.
The immunohistochemical characterization of the infiltrating cell populations revealed that the relative presence of each cell population changed throughout the experiment (Table 2). At early stages (6–10 dpi), CD8+ T cells and macrophages were the dominant cell type, although some CD4+ T cells could also be detected. Later (12–19 dpi), in groups inoculated with 648A the relative proportion of macrophages and CD8+ T cells decreased, and there was a corresponding increase in CD4+ T cells. In the groups inoculated with GA/22, the reduction of the relative frequency of macrophages and CD8+ T cells was less evident than that in the 648A inoculated groups. Moreover, in GA/22-inoculated groups the increase of CD4+ T cells was transient, with a peak at 12 and 19 dpi in TK and 15×7 chickens, respectively. Changes in the morphology of some CD4+ T cells were observed in 15×7 and TK chickens inoculated with 648A. Initially, they showed features of small and medium lymphocytes until about 12 dpi (Fig. 3,) but lymphoblasts with an ovoid shape and large size were prominent by 19–26 dpi (Fig. 4).
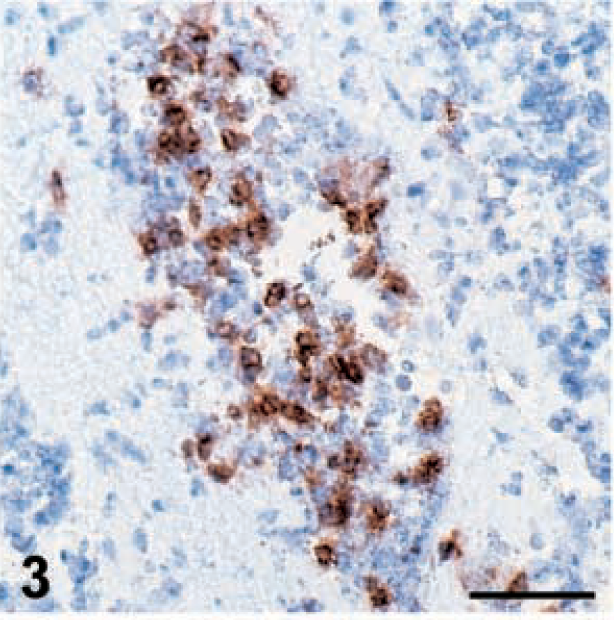
Brain; 15×7 chickens infected with MDV 648A. Expression of viral antigens and cell population infiltrating in the brain. Cerebellum. CD4+ T cells in perivascular infiltrates at 8 dpi. Bar = 50 µm.
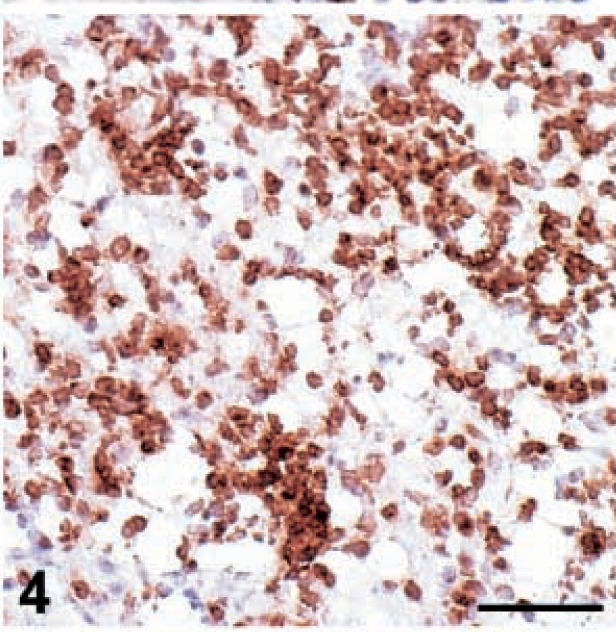
Brain; 15×7 chickens infected with MDV 648A. Expression of viral antigens and cell population infiltrating in the brain. Optic lobes. Severe infiltration of CD4+ T cells in the neuropil at 26 dpi. The CD4+ T cells are larger than they were at 8 dpi (Fig. 3). Bar = 75 µm.
The number of CB1+ cells was very low in both perivascular and diffuse infiltrates at all time points and regardless of the treatment group (data not shown). Their frequency was the same in treatment and control uninoculated chickens.
Two kinds of lesion patterns were established. Initially, inflammatory lesions appeared in all treatment groups and consisted of macrophages, CD8+ T cells, and CD4+ T cells of small to medium size (Fig. 3). These cells were usually associated with blood vessels, but in severe cases they appeared also within the neuropil. Later, lymphoproliferative lesions appeared in those groups inoculated with 648A and were characterized by severe infiltration of CD4+ CD8− T cells of large size (blast) in both perivascular locations and the neuropil (Fig. 4). The transition from inflammatory to lymphoproliferative lesion type was supported by an abrupt decrease in CD8+ T cells and macrophages along with an increase in CD4+ T cells.
MHC antigen expression
In the CNS, the level of MHC antigen expression is normally very low. 36 In uninoculated control chickens in this study, MHC-I antigen was selectively expressed in endothelial cells and in a few glial cells, but no MHC-I background staining was observed (Fig. 5). MHC-II in control chickens, however, was not expressed in any cell population.
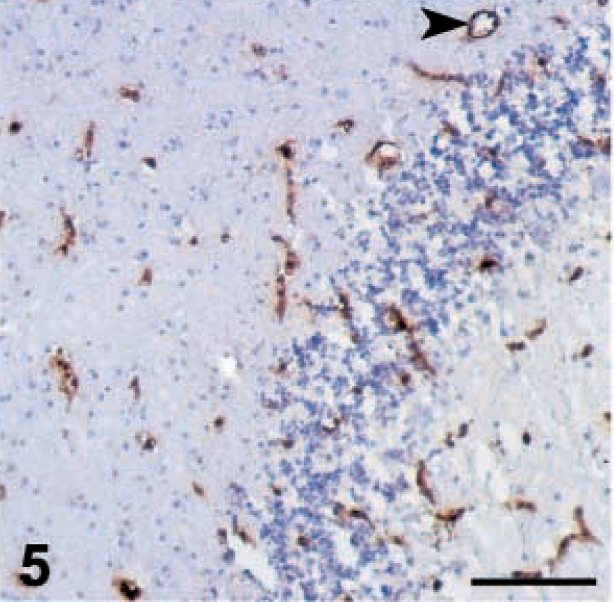
Brain; 15×7 chickens. MHC class I expression. Cerebellum; control uninoculated chicken. Endothelial cells are all positive (arrowhead), and no background can be detected. Bar = 130 µm.
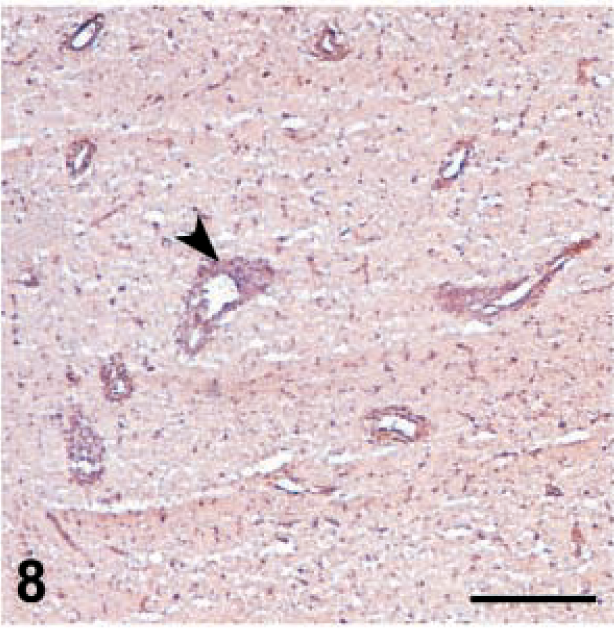
MHC-I expression was downregulated in all cell populations after MDV inoculation but especially in 648A inoculated groups (Table 3). A slight background staining of the neuropil was observed at 6 dpi in the brain of the 648A inoculated groups. Background staining was not detected in control groups or GA/22-inoculated groups. MHC-I was expressed in endothelial cells and inflammatory cells in perivascular cuffs and infiltrating the neuropil at 6 and 8 dpi (Fig. 6). However, at 10 dpi MHC-I expression was sharply reduced, especially in endothelial cells but also in infiltrating cells (Fig. 7), and continued to decrease. Background staining of the neuropil progressively increased through the observation period and was very strong by 19–26 dpi. At this stage, very few endothelial cells and infiltrating cells expressed MHC-I antigen (Fig. 8). Very slight if any downregulation was observed in GA/22-inoculated or control groups at any time.
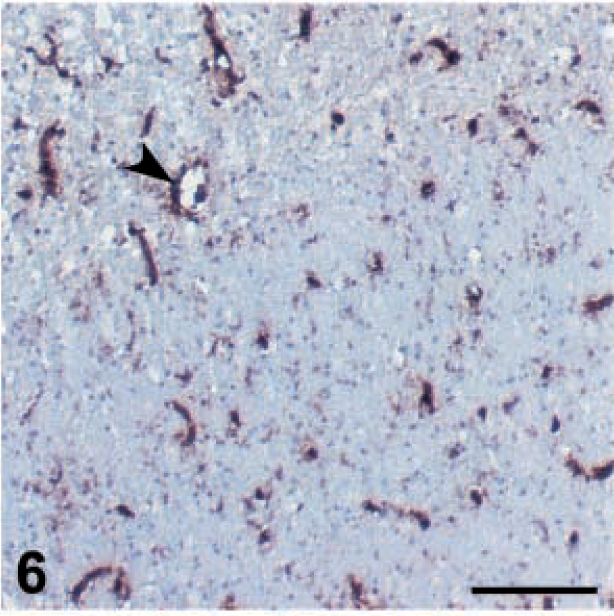
Brain; 15×7 chickens. MHC class I expression. Optic lobe; chicken inoculated with MDV 648A, 6 dpi. Endothelial cells are still positive (arrow), as are the few infiltrating cells. Nonetheless, there is slight background staining. Bar = 100 µm.
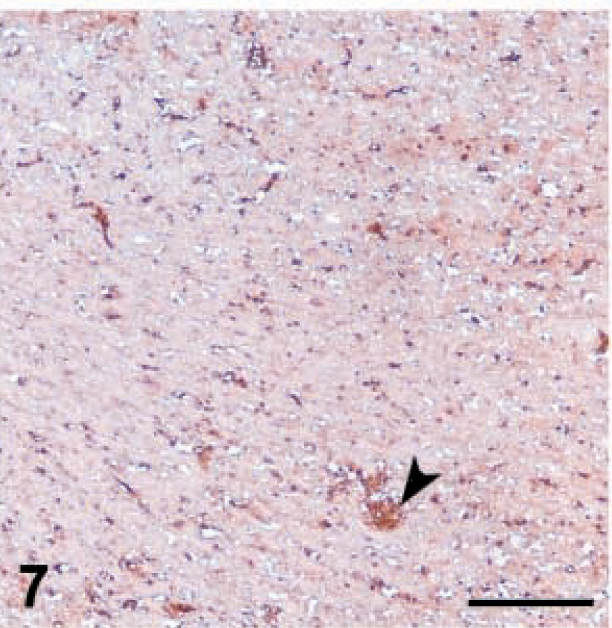
Brain; 15×7 chickens. MHC class I expression. Optic lobe; chicken inoculated with MDV 648A, 12 dpi. Vascular pattern is not as clear because endothelial cells are mostly negative. Some infiltrate cells are still MHC-I+ (arrowhead). Bar = 200 µm.
Expression of the MHC class I and II antigens in the brains of chickens of two lines inoculated with two strains of Marek's disease virus and killed at different days postinoculation (dpi). ∗
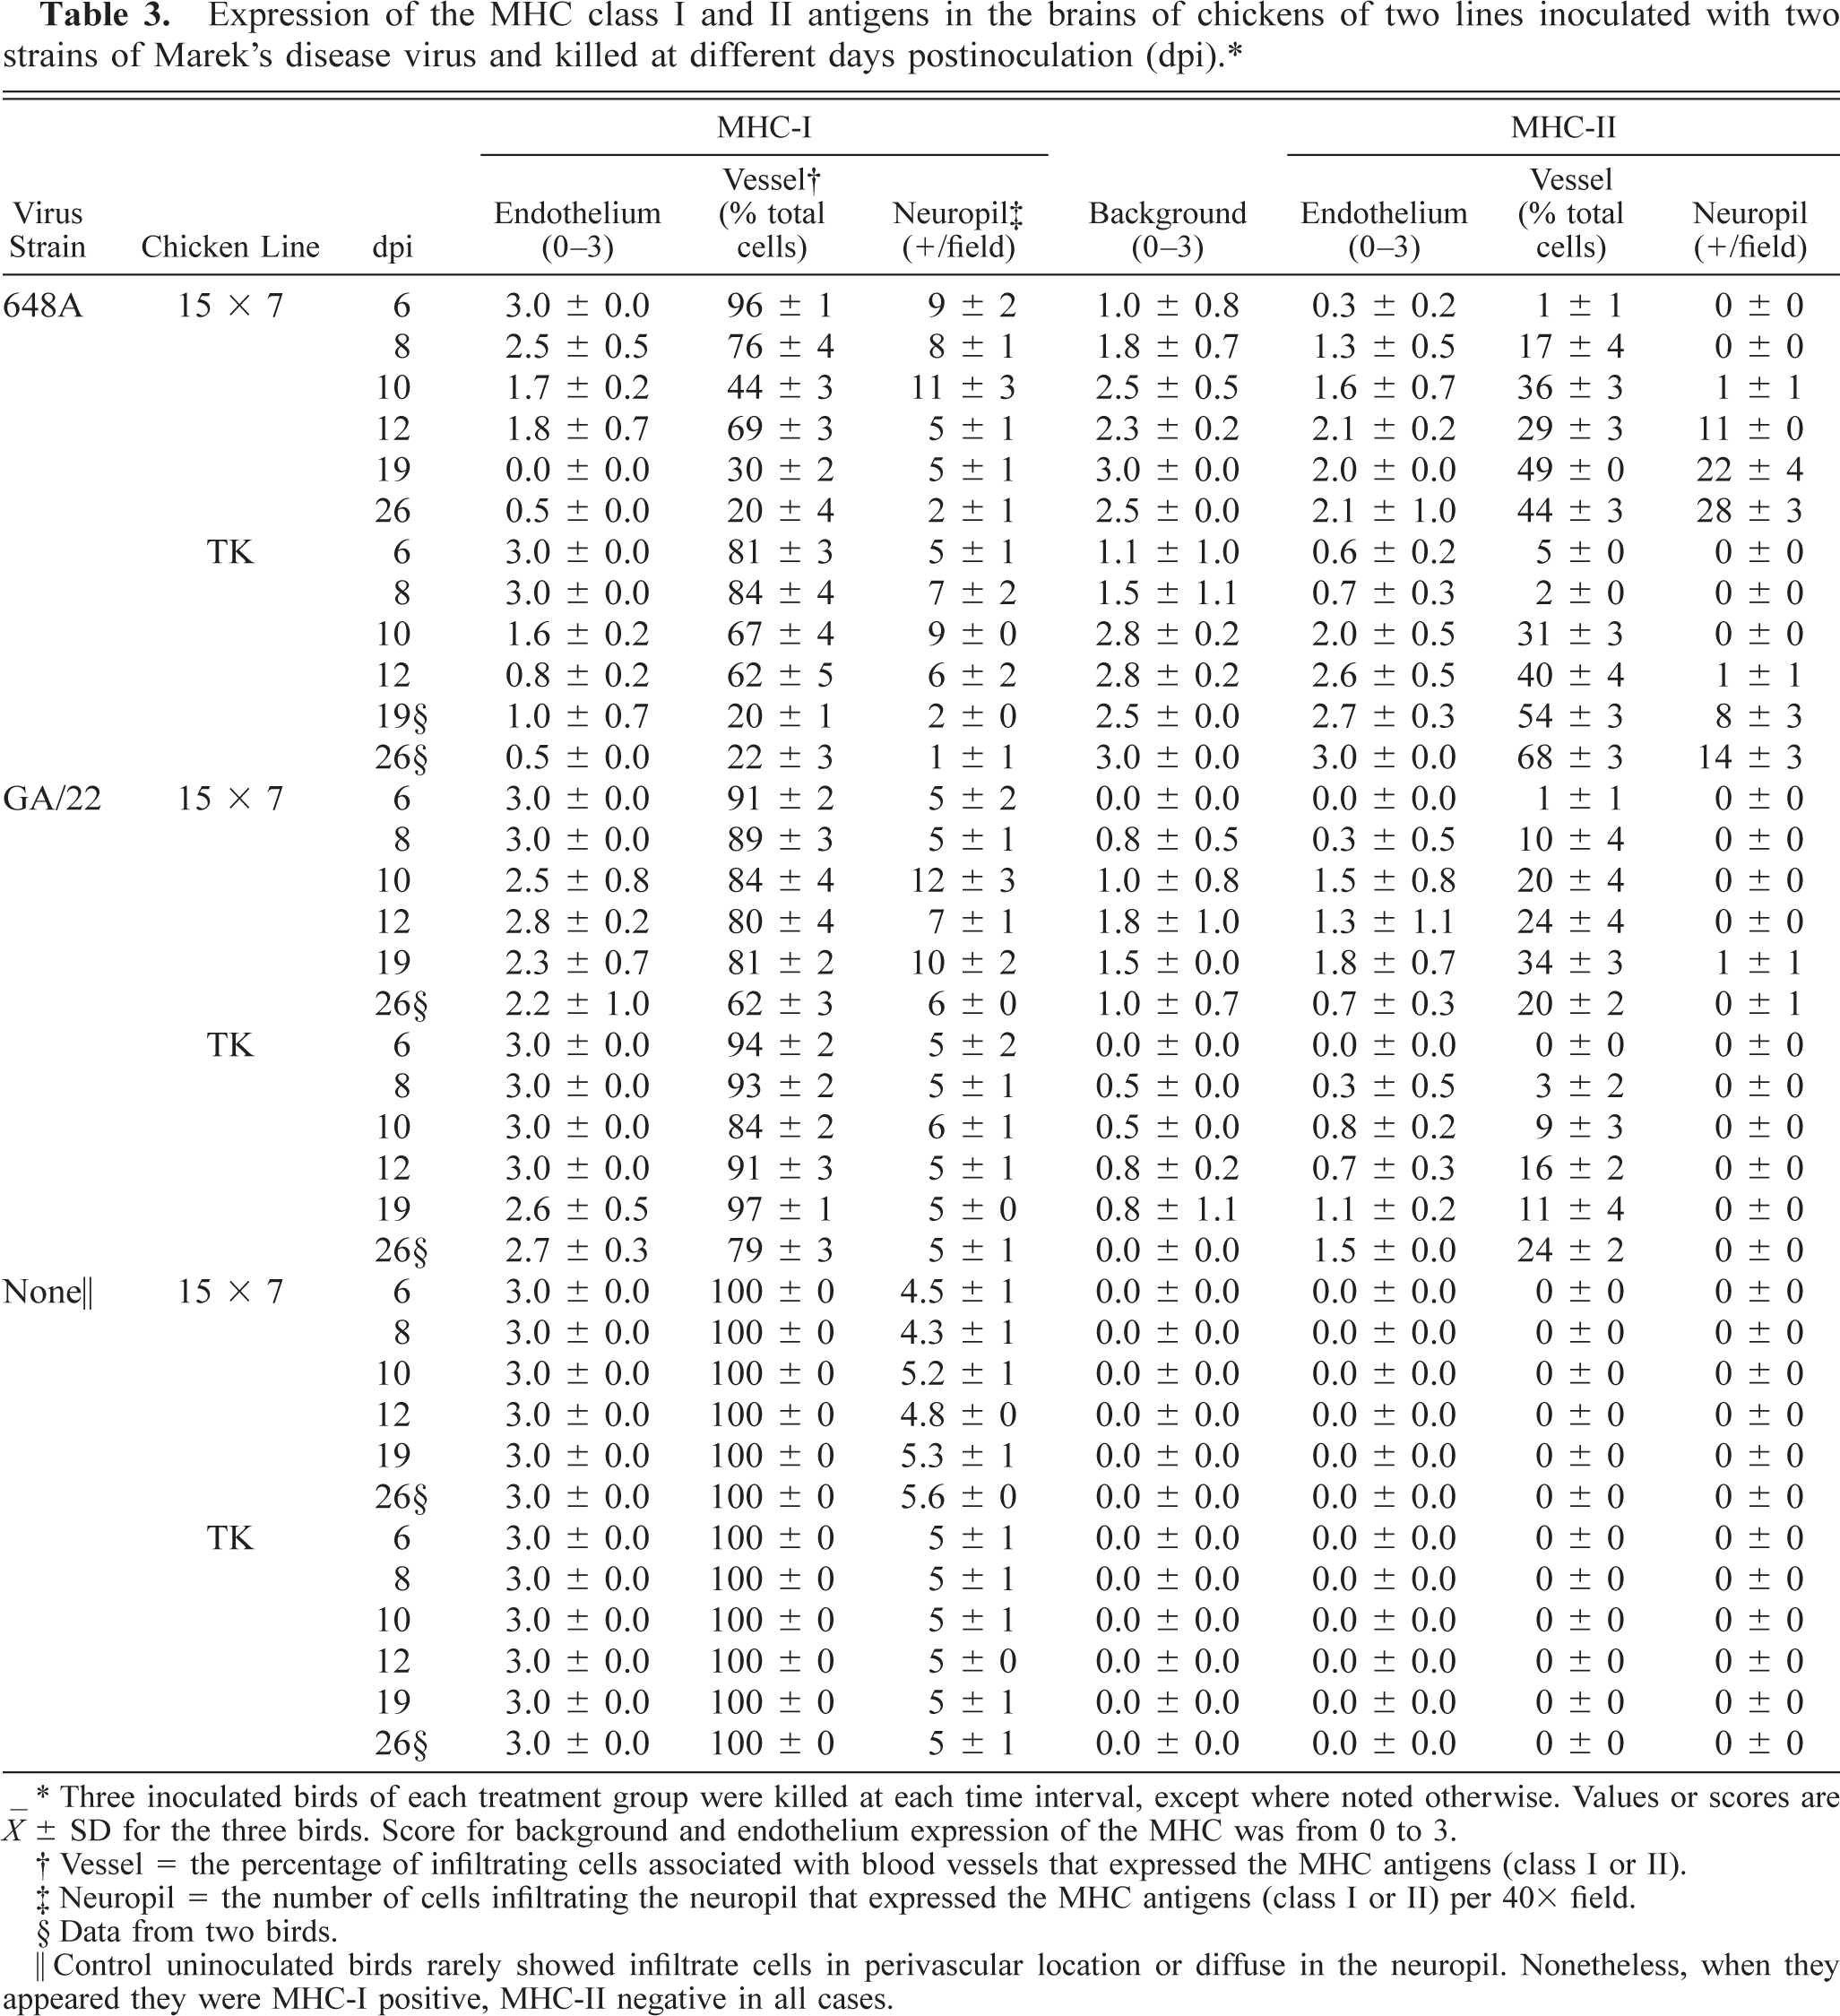
∗ Three inoculated birds of each treatment group were killed at each time interval, except where noted otherwise. Values or scores are ○ ± SD for the three birds. Score for background and endothelium expression of the MHC was from 0 to 3.
† Vessel = the percentage of infiltrating cells associated with blood vessels that expressed the MHC antigens (class I or II).
‡ Neuropil = the number of cells infiltrating the neuropil that expressed the MHC antigens (class I or II) per 40× field.
§ Data from two birds.
‖ Control uninoculated birds rarely showed infiltrate cells in perivascular location or diffuse in the neuropil. Nonetheless, when they appeared they were MHC-I positive, MHC-II negative in all cases.
In contrast, MHC-II was upregulated in endothelial cells, which became MHC-II+ at 6 dpi in 648A-inoculated groups and at 8 dpi in GA/22-inoculated groups. MHC-II expression in endothelial cells increased in both number of cells and intensity of stain through the observation period (Table 3). Expression of MHC-II antigen in the infiltrating cells (T cells and macrophages) was also upregulated. In perivascular infiltrates, MHC-II upregulation was detected in all inoculated groups, although it was more evident in those inoculated with 648A. Differences were especially remarkable at 10–12 dpi, when the percentage of MHC-II+ cells in perivascular infiltrates rose to 36.3% (15×7 chickens) and 40.3% (TK chickens) in groups inoculated with 648A but was much lower in GA/22-inoculated groups (up to 24.2% and 15.8% in 15×7 and TK chickens, respectively).
Discussion
In previous studies, 15×7 chickens inoculated by the intraabdominal route at 3 weeks of age did not always become infected immediately, and some appeared to be infected later by contact exposure, resulting in the “late” paralysis syndrome. 13 The decision to exclude from analysis chickens that appeared to lack infection was based on the premise that responses from known infected chickens would provide more useful information. To avoid accidental exclusion of truly infected chickens, only birds negative for both viremia and histologic brain lesions were excluded. Consequently, mean response values for some groups are higher than they would be if all chickens had been analyzed.
In a recent study, vvMDV induced very severe lesions in the brain at late stages of the infection (10 weeks after inoculation), and several viral genes were transcribed in the brain. 4,5 In the present study, strain 648A (vv+) reached the brain at 6–8 dpi and persisted through at least 26 dpi. Moreover, the MDV DNA concentration in the brain can be as high as that achieved during cytolytic infection of lymphoid organs (Gimeno, unpublished data). In contrast, the existence of viral DNA in the brain following infection with the GA/22 strain (v) was transient, and viral DNA concentration was never as high as that in chickens inoculated with the 648A strain.
The detection of viral antigens indicates that at least a portion of the MDV-infected cells in the CNS support a productive infection. Viral antigen expression appeared to be influenced by virus pathotype. Early proteins such as pp38 and meq were frequently detected in 648A-inoculated groups, but very few cells expressed gB, a late glycoprotein, suggesting that viral replication in at least certain cells in the brain was absorbed at an early stage. Expression of pp38 but not gB has been recently shown in the CNS at late stages (10 weeks after infection with a vvMDV). 4 The present results are consistent with this finding and establish that abortive infection occurs very early in the pathogenesis of MDV infection in the brain. However, in the earlier studies viral antigen expression was only detected in degenerated lymphoblasts, whereas in the present study many cells (probably normal lymphocytes) expressed pp38 during the early inflammatory response. Mechanisms of the block in virus replication and the relevance of this block in the pathogenesis of MDV infection are poorly understood.
Expression of meq antigen in the brain has not been previously reported. In this study, meq expression did not follow the same patterns as viral DNA and pp38 expression. Instead, meq tended to increase with time and was mainly associated with the late proliferative lesions, composed mostly of CD4+ T cells, which mostly lacked CD8 and appeared blastlike. These findings suggest that the predominant meq+ cell in the present study was a CD4+ CD8− blast cell. The meq antigen has been reported to be expressed in a variable proportion of MDV-transformed lymphoblasts in both cell lines and natural tumors. 31 The CD4+ CD8− lymphoblast is a principal target cell population for MDV transformation. 32 The present results suggest that late proliferative lesions in the CNS contain at least some MDV-transformed cells. Such transformed cells apparently rarely progress to gross lymphomas, unlike those in other tissues; brain lymphomas are extremely rare in cases of MD.
Alteration of endothelial cells in MDV infection has not received great attention, although these changes might be a key element in the pathogenesis of vasculitis leading to vasogenic brain edema. In the present studies, endothelial cells were among the first cellular elements in the brain of chickens inoculated with MDV to show alterations. Endothelial cells became hypertrophic and hyperplastic and expressed MHC-II antigen as early as 6–8 dpi in all treatment groups. In preliminary studies (Gimeno, unpublished data), at this early stage endothelial cells lost the expression of Von Willebrand antigen (factor VIII), which normally is expressed in this cell type. 17 Later (12–19 dpi), endothelial cells also ceased to express MHC-I. The pathogenesis of changes in endothelial cells in the brain of MDV-infected chickens is still poorly understood. Endothelial cells have not been reported to support MDV infection, but this possibility has not been excluded. Most of the pp38+ cells appeared to be lymphoid cells, but there were a few longer cells that might be endothelial cells. Alternatively, endothelial cells may be refractory to MDV infection but susceptible to cytokines produced by other MDV-infected cells.
MHC-II upregulation in endothelial cells might have an important role in the establishment of the inflammatory lesions. MHC-II antigen is involved in the process of adhesion of lymphocytes to the endothelium and is relevant in the migration of lymphocytes through the blood–brain barrier. 9 Moreover, MHC-II expression makes endothelial cells able to act as antigen-presenting cells, which can be a key element in the immune response. 12 Upregulation of MHC-II antigen in endothelial cells following MDV infection has been previously reported. At 15 days following inoculation with MDV, endothelial cells of the main arteries became MHC-II+, which was among the first alterations in the pathogenesis of the arteriosclerosis induced by MDV. 25 Upregulation of the MHC-II antigen was reported in brain endothelial cells at 10 weeks after inoculation with a vvMDV. 4 In the present study, upregulation of MHC-II antigen in the endothelial cells of the CNS started very early after MDV inoculation (6–8 dpi) and occurred before the onset of other brain lesions. This finding along with the presence of CD4+ T cells, CD8+ T cells, and macrophages suggest an immune system–mediated mechanism in the pathogenesis of the CNS alterations. The role of endothelial cells in the pathogenesis of MDV infection needs to be fully elucidated, both in the brain and in other organs.
The time course of the brain lesions observed in the CNS closely resembled that previously described in the peripheral nervous system. 21 As in peripheral nerves, two stages were observed in the pathogenesis of the brain lesions: an inflammatory stage and a proliferative stage. However, in nerves inflammatory (type B) lesions usually follow the proliferative (type A) lesions. 21,27 Morphologic changes occurred in the cells infiltrating the brain at early and late stages. 13 Results of this work confirm that there is an evolution in the cell populations involved in brain lesions and add information about the nature of brain lesions related to clinical signs.
The early inflammatory stage was associated with paralytic clinical signs in chickens inoculated with MDV 648A. However, GA/22-inoculated groups (lacking clinical signs) also developed early inflammatory lesions. This stage was characterized by perivascular infiltration of macrophages, CD8+ T cells, and CD4+ T cells of small and medium size. In severe cases, however, there was also diffuse infiltration in the neuropil. Although cell populations involved in brain lesions were the same for all inoculated groups, the level of MHC-II expression in the infiltrating cells varied greatly among groups. In 648A-inoculated groups, the percentage of infiltrating MHC-II+ cells was much higher than that in GA/22-inoculated groups. This finding indicates that the respective lymphoid populations were at different stages of activation, which might be relevant in the pathogenesis of the neurologic response.
The late proliferative stage was observed in only 648A-inoculated chickens and was coincident with the onset of nonparalytic clinical signs. This stage was characterized by severe infiltration of cells, most of which were CD4+ T cells that lacked CD8 and appeared blastlike. Such lesions were very similar to those described in peripheral nerves as type A. 27 Moreover, proliferative lesions in nerves are often associated with secondary demyelination. 21 Extensive vacuolated areas in the neuropil were found in the brain and were associated with proliferative lesions. Such extensive vacuoles might also correspond to secondary demyelination; leakage of serum protein (albumin and IgG) is transient and cannot be detected by immunohistochemistry once recovery from TP is complete. 34 Demyelination of CNS at late stages of MDV infections requires confirmation, however, through further studies. The pathogenesis of MDV infection in CNS and peripheral nerves thus are similar in some respects.
A severe downregulation of the MHC-I was observed in the brain of 648A-infected chickens during the proliferative stage. MHC-I downregulation is an important mechanism by which viruses, including adenoviruses, herpesviruses, and retroviruses, evade detection by the immune system. 14,30 These viruses can inhibit MHC-I expression in infected cells by one or more mechanisms that affect different stages of MHC generation and/or expression. Recently, MDV has been reported to downregulate MHC-I in vitro and in tumor cells, although the relevance of this mechanism in the pathogenesis of the MDV infection is still poorly understood. 16 In the present study, vv+MDV, but not vMDV, induced MHC-I downregulation in the brain. This effect was especially prominent at 19–26 dpi. MHC-I downregulation was very extensive, affecting many cells of different types, only some of which were probably infected. A cytokine-mediated mechanism might be involved, but further studies are needed to elucidate the relevant mechanisms. The strong specific background staining with MAb CGB12 coincided with MHC-I downregulation in endothelial and inflammatory cells. The background staining might be explained by the accumulation of degradation products of MHC-I molecules that never reach the cell surface. If so, a posttranscriptional mechanism for MHC-I downregulation might be involved, as has been described for herpes simplex virus, in which the immediate early protein ICP47 binds to the transporter associated with antigen processing and abolishes antigen binding with class I molecules. 14,39 In MDV, the early protein pp38 has been suggested as a good candidate to act as ICP47. 16 Nonetheless, a pretranscriptional mechanism for MHC-I downregulation cannot be ruled out. The protooncogene c-jun acts as a negative transactivating factor that downregulates MHC-I expression. 15 The gene meq is analogous to the protooncogene c-jun and might play a similar role in MHC-I downregulation. 18 Results of the present study indicate that the meq gene is transcribed and expressed in the brain of 648A-infected chickens, and meq expression was significantly correlated with MHC-I downregulation.
These studies were facilitated by the use of several techniques not commonly used in avian pathology, e.g., quantitative competitive PCR, semiquantitative enumeration of cells by histochemistry, and sequential observations of individual chickens for neurologic clinical signs. The quantitative competitive PCR was developed separately (by S. M. Reddy) and was considered to provide a good estimate of viral DNA quantity even though comparisons between test samples and internal controls were done by visual inspection. 29 The cell counts in sections stained for specific antigens were obtained by visual inspection with the microscope, placing some limitations on accuracy. However, the results were standardized to the extent possible and are considered superior to more semiquantitative estimates. The data on clinical signs are unique, mainly because few workers have systematically examined individual chickens on a daily basis. Thus, each of these procedures contains a subjective element that was duly considered in analysis of the data.
This work contributes to our understanding of the nature and pattern of MDV infection in the brain. Important and relevant differences between pathotypes were detected that help explain the greater neurovirulence associated with highly virulent MDV. MDV replication plays an active and important role in the onset of brain lesions leading to the development of neurologic syndromes, and a variety of viral antigens, including the antigen meq, homologue of the jun/fos family of transcription factors, is expressed in the brain after infection with highly virulent MDV. Moreover, pathogenesis of MDV infection in the brain does not essentially differ from that described for other tissues (e.g., peripheral nerves). Two distinct pathologic phenomena have been identified in the CNS. Inflammatory lesions, which occurred at 6–12 dpi regardless of the pathotype, were transient and could be associated with the onset of paralytic clinical signs (TP). Proliferative lesions, which occurred only after inoculation with vv+MDV, started at 19–26 dpi, persisted, and appeared to be related to the onset of nonparalytic clinical signs observed in chickens with PND. In this study, vv+MDV severely downregulated the expression of MHC-I antigen in the brain. This finding might have relevance in the pathogenesis of MDV infection, both in the CNS and in other tissues.
Footnotes
Acknowledgements
We thank B. Riegle and D. Ferguson for excellent technical assistance, Dr. L. N. Payne for helpful reviews of the manuscript, Dr. Willie M. Reed for his advice on immunohistochemical techniques, and Dr. Moses Rodriguez for his help in understanding MHC-I expression in the CNS.