
Abstract
The Mouse Disease Information System is a free Microsoft Access database (http://research.jax.org/faculty/sundberg/index.html) designed by veterinary pathologists to aid veterinary pathologists in data acquisition, analysis, and coordination of tissue-sample archives. Linking the system to the Mouse Anatomy and Mouse Pathology Ontologies provides controlled vocabulary (and spelling) for organ, tissue, and diagnosis. Severity scores provide a quantitative assessment of all lesions to enable quantitative trait locus analysis for large-scale studies. Individual diagnoses can be verified for their definition by online linkage to Pathbase.net. Histologic images can be accessed from Pathbase by using the Mouse Pathology Ontology directly for comparison with slides being viewed at the time of data entry and providing the user with a reference and a “virtual second opinion.”
Keywords
Introduction
Maintenance of records on mouse-breeding colonies and related research is highly specialized and can easily become overwhelming if a systematic and proven method is not used. A number of very sophisticated systems are available today for this purpose (Jackson Laboratory Colony Management System, http://colonymanagement.jax.org/index.html; MausDB, http://www.helmholtz-muenchen.de/en/ieg/downloads/index.html; and MusDB11). Likewise, sophisticated database systems are available for physiologic phenotyping data (blood chemistry, body weights, body composition, etc.). The same is true for medical records on mouse necropsy and diagnosis, both to organize all data generated and to access various specimens collected and stored. Generation of data and case materials is valueless over the long term unless the data and case materials can be retrieved and analyzed on demand. Computerized databases and spreadsheets provide invaluable tools for maintaining large amounts of data that can be processed easily to generate tables and graphics for summary, interpretation, and presentation.14, 15 More importantly, these data can be downloaded into spreadsheets for quantitative trait locus genetic mapping with the appropriate software.1, 2, 4, 6, 8, 9, 13, 16
Today's researcher must keep extensive records on mouse colony, experimental test results, medical records, specimens, digital images, and other information. Many different methods are often used to obtain and maintain this information, including paper records on forms in notebooks, computerized spreadsheets, computerized databases, automated laboratory equipment printouts, and specially designed computerized laboratory information management systems. Additional information may then be created in the form of reports, statistics, graphs, posters, formal presentations, drafts of papers, and finally as publications. This information is frequently scattered through many locations and in the possession of various people involved in the project. Sometimes this proliferation of information can create great difficulties in retrieving specific data if a key person is no longer present. Hence, it is highly desirable that the researcher establish a record-keeping system at the beginning of the project that provides a consistent framework for use by all participants. Ancillary materials, such as glass microscope slides, digital images, paraffin blocks, etc. can then be filed under a common identifier (case/accession number) to facilitate retrieval.
The project record-keeping system will depend on the resources available to the individual researcher. Ideally, a single record-keeping system should be used by everyone in the same research laboratory so that materials from different individuals' projects can be easily identified, sorted, and retrieved, even after the individuals leave the research group. Assessment of the available facilities and establishment of protocols for information recording at the beginning of the project (or even when establishing a research laboratory) will minimize problems later. Large automated (computerized) laboratory information management systems may already be in place and need to be used. For many researchers, however, these systems are not generally available, may only be available at a prohibitive cost, or cannot be adapted to a particular investigator's needs.
We describe here the use of a freely available data-capture tool built on a commonly used database software program (Microsoft Access, Microsoft Corp., Redmond, WA) that focuses on collection of data by and for a pathologist. Referenced coding for organs and disease processes, as well as for summative diagnosis, makes the system rapid and generates a report that can be printed and signed to yield a regulatory report, or it can be e-mailed directly to the client and/or collaborator. Data can be downloaded in a structured form and sent to other databases for integration with genetic and phenotype data. The overall strategy and potential use of the system that we present here, called the Mouse Disease Information System (MoDIS), were previously described,18 but, in this complementary article, we provide detailed documentation on the structure and use of MoDIS for the target user group, predominantly veterinary pathologists.
Materials and Methods
Software
The database described here evolved over 20 years and was originally built on dBASE III Plus (Ashton-Tate, Torrance, CA)14 then migrated onto FoxPro 2.6 (Microsoft)15 to its current form in Microsoft Access.18 Coding is built on the Anatomical Dictionary for the Adult Mouse (http://www.informatics.jax.org/searches/AMA_form.shtml; The Jackson Laboratory, Bar Harbor, ME) and mouse pathology ontology, MPATH, (http://www.pathbase.net; Pathbase European Consortium, University of Cambridge, Cambridge, UK).
Hardware
The Microsoft Access software is designed for computers that use the Microsoft Windows operating system (Windows 2000 or XP, or VISTA and Microsoft Access XP 2003 or 2007). Other operating systems and hardware may be used with third-party middleware solutions, such as virtualization software.
MoDIS
Standardization
Unique identifiers
Large-scale data-collection operations, such as diagnostic laboratories, clinics in hospitals, or drug safety studies in industry, assign a specific identifier for each individual animal. This is often referred to as a case or accession number and is used to organize all the materials generated by the case. In a relational database, this unique identifying number is used to tie all the database information together for one animal. Within the database, fields can be set up to record other identifiers for the same animal from other sources that use different numbers and bind them together. In this way all data can be collated unambiguously.
MoDIS uses a 2-part unique case identifier. The beginning portion indicates the year of the necropsy. Accessions are then numbered numerically or groups of numbers can be assigned to particular projects, programs, etc. For example, we use 5-digit codes. Final assignment of the number has the form: 99-1, 00-7123, 08-12555, etc.
Assignment of numbers to animals is usually done in one of two manners. Because this laboratory runs multiple types of research and diagnostic programs, most of which focus on necropsies of mice from a variety of sources, we assign numbers to the mice when they come to necropsy. A laboratory that imports mice or uses only mice from within their own colony may find that it is easier to assign the number to the animal when it is born or purchased. In fact, some of the colony management programs assign numbers to a mouse when it is weaned, which are then used throughout the life of the mouse until it is necropsied. This is particularly true when using some of the computerized software for colony breeding management. If a number is assigned when the mouse enters the colony and/or research laboratory, then that number should be maintained for all data collected.
Complications in record keeping arise when specimens are shipped to collaborators or other services within the institution that have their own accession system. For example, specimens collected for ultrastructural studies are assigned a unique identifier and then sent to the Electron Microscopy Service for processing. The Electron Microscopy Service assigns its own accession number. When the investigator arrives to review the material with the electron microscopist, confusion is inevitable unless the numbers and data are cross-referenced. Solutions include adding the service's accession number to a field in the database for maintaining a cross reference or submitting to the service, before examination, the investigator's unique identifier and signalment for the case (animal type [mouse, rat], age, and sex) as well as information about the study. This is the type of data-flow problem that should be noted and solved before the project begins. Computer programs can be used to generate labels for transparencies, folders, images, negative sleeves, etc. Using the case accession number and project identifier on the labels helps with filing and permits rapid identification if more data need to be looked up.
Project identifiers
A project name or acronym is defined and entered for each mouse record within that project. This project name allows searching through the database or output spreadsheet to find all mice or other data collected for that particular project. If the project involves collaborators or another investigator, separate fields can be set up under submitter/collaborator to permit rapid searches for all work that involves this individual or group. Often multiple studies are ongoing with a particular investigator and summaries of all work are needed. This approach enables the program to set up the summaries quickly and, most importantly, reproducibly.
Collection of information from the colony
It may be possible to bring computers into the animal rooms to collect information directly. The use of bar codes and readers, balances tied to institutional networks to automatically record weights, etc. have become commonplace in mouse rooms. Specialized programs are becoming available for maintaining breeding records this way. If these data acquisition systems are not available, then some type of paper form must be used for data collection. These data can then be entered later.
In this laboratory, individual mouse information is normally collected into the database at the point the mouse is necropsied. An example of the data collection format is shown in Fig. 1. The following signalment data are used:
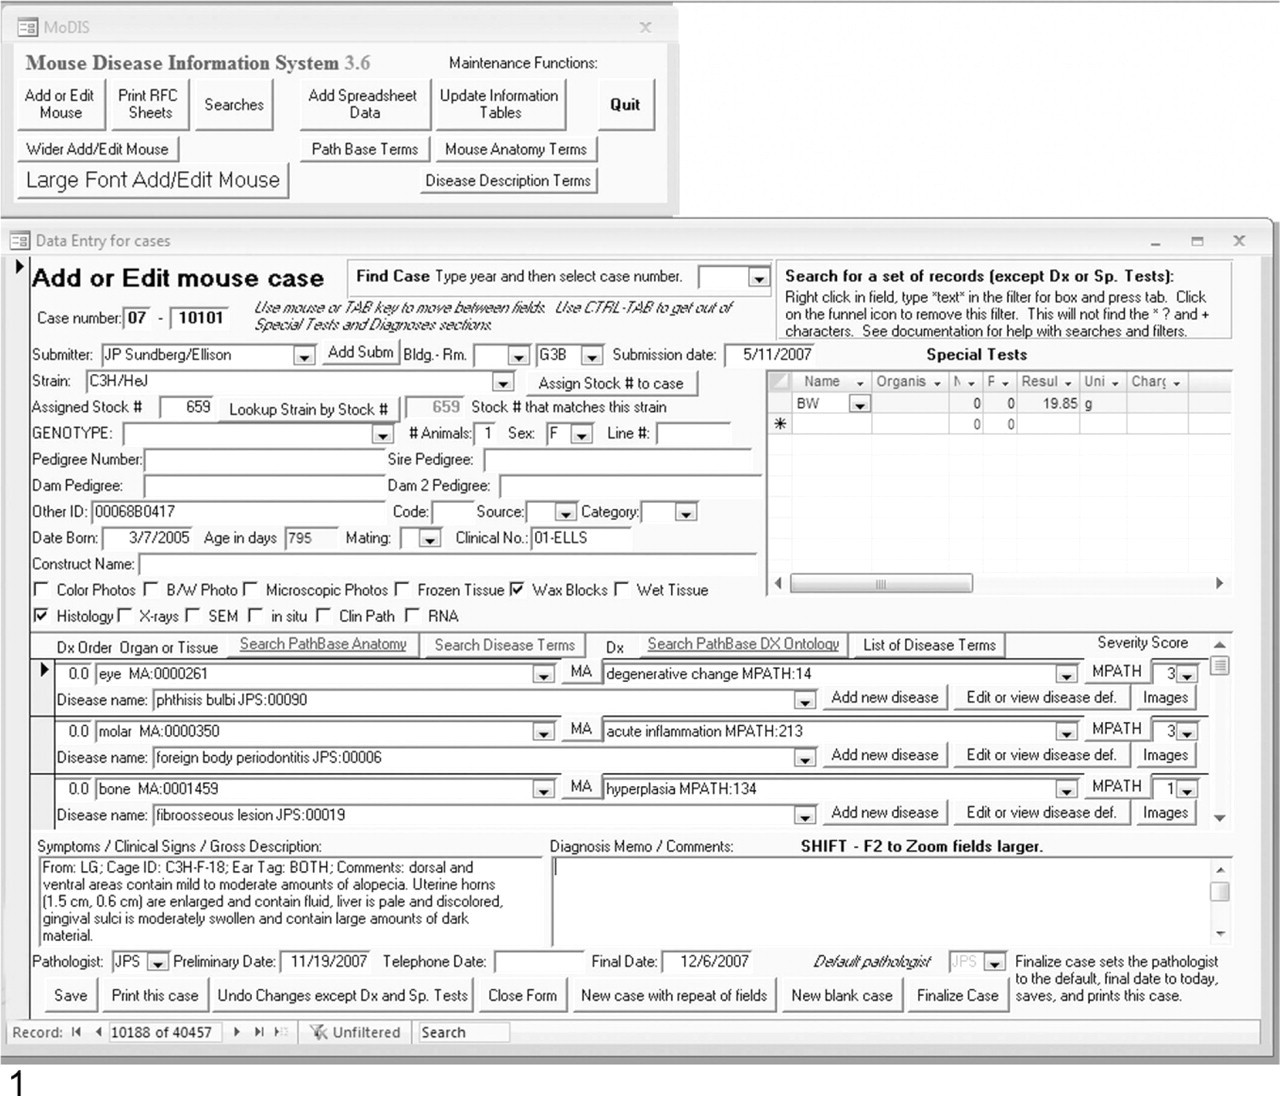
Example showing the user interface and a data-entry screen. The MoDIS entry form requests basic information on the mouse (signalment) to be entered in a systematic manner to enable data retrieval. Strain and stock number can be verified with the drop-down menus.
Case/accession number (necropsy number): A unique identifier is linked to an individual animal.
Project identifier (clinical number): This defines the specific project so all cases related to that project can be downloaded for analysis.
Submitter/collaborator (from): This identifies the primary research contact associated with this mouse (principal investigator, collaborator, other investigator, or student).
Location (building and room): Where the mouse was housed (animal room number) can be critical for finding mice with similar problems or if an untoward response was identified that might have an environmental basis.
Strain: Strain identification abbreviations and/or symbols are very specific and will determine correct controls and what spontaneous diseases are common in that strain. Users should strictly adhere to the International Committee on Standardized Genetic Nomenclature for Mice standards of assigned strain and mutation symbols (http://www.informatics.jax.org/mgihome/nomen/index.shtml).17
Stock number: The Jackson Laboratory assigns a production stock number associated with the strain or mutant stock. This serves as an internal control for the correct strain and mutant gene symbols.
Genotype: This would identify the specific gene and allelic mutation under investigation as well as differentiate mutant from control mice.
Line: This refers to the laboratory code used to record a designator for a breeding line.
Pedigree numbers: This may be assigned by the colony management program and serve as their accession number or it may be a unique number assigned by the person maintaining the animals. Often pedigrees are used to track the previous generation so there are fields for the sire and dam pedigree numbers.
Other identifiers (other ID): This refers to the chip number (These are tracking tools implanted into individual mice5), cage number, special coding, ear tags, etc. used to collate a particular individual with other identifiers that may have been used previously.
Sex: F (female), M (male), FS (neutered [spayed] female), MC (castrated male)
Birth date: This information is used to calculate the age when subtracted from date of necropsy.
Death/necropsy date (submission date): As stated above, this is used to calculate age when the mouse died.
Mating: This is the type of mating scheme used: paired (male and female), trio (male and 2 females).
Code, source, and category: Fields that can be customized to further describe the case. Included are categories such as “breeder” or “pup” and sources such as “importation” or “research.” Codes may be created to indicate mutant versus control, study groups, or any other desired information.
Construct name: This would refer to the specific information on the genetic construct used to make a genetically engineered mouse.
Identification of other material associated with each mouse (cross-reference information)
Fields are set up to record in a yes/no fashion if the following material has been collected for each mouse: (gross) photographs, photomicrographs, electron micrographs, histology slides, frozen tissue, radiographs, in situ hybridization, immunohistochemistry, gene mapping data, etc. These items are physically stored or filed by project and case number so to be easily accessible.
Import signalment from a spreadsheet
A simple import system exists for creating a new case and collecting some signalment data from a fixed format spreadsheet (Fig. 2). This allows importation of mice at necropsy that have data in a different database. A sample of the fields imported is shown in Fig. 2.
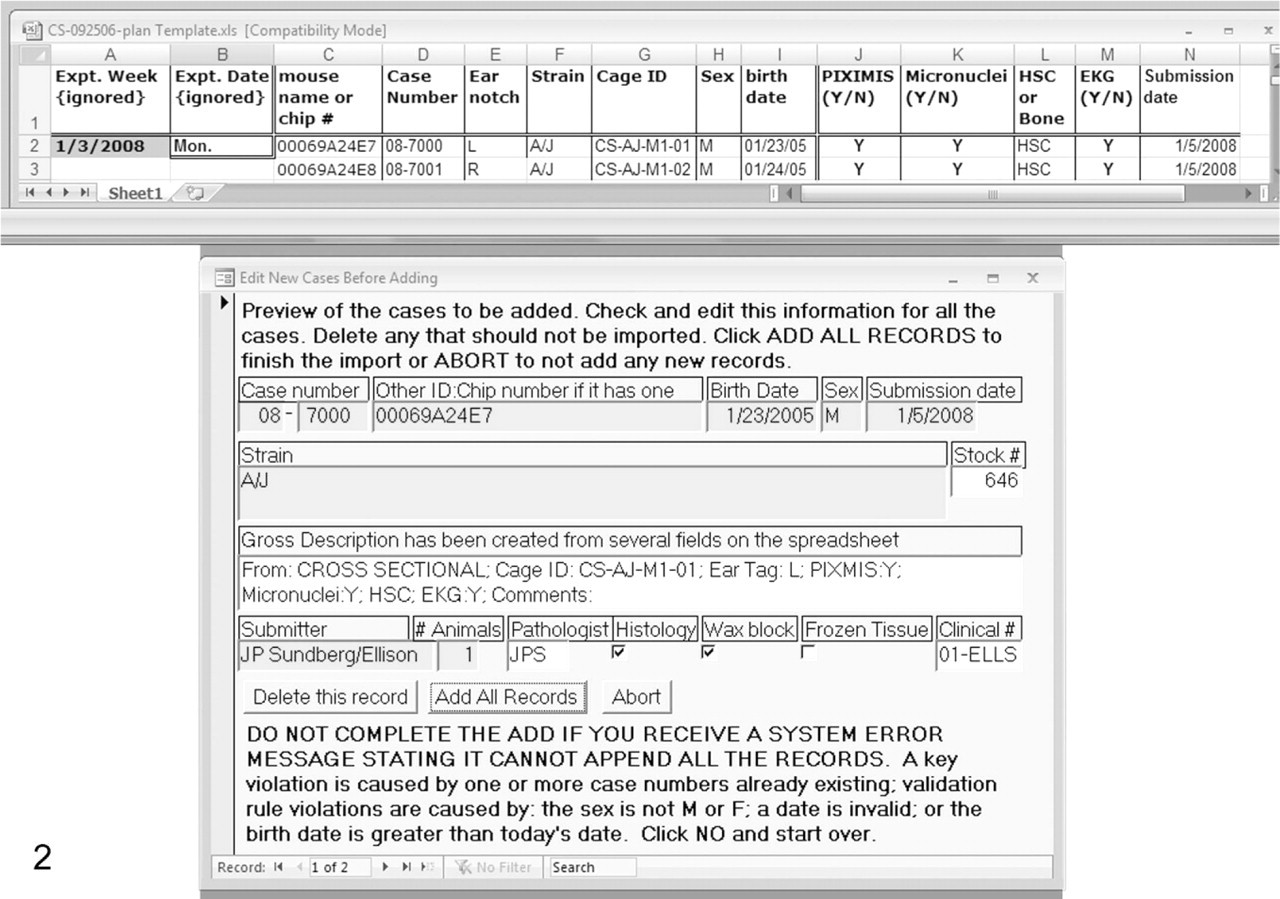
An illustration of the procedure designed to download data from mice in a study in which each animal has a chip embedded subcutaneously for identification. MoDIS includes a sample Microsoft Excel spreadsheet for importing data (top). Information in specific fixed columns can be transferred by loading the spreadsheet into this form (bottom), which allows user editing of the data before finishing the download. This type of transfer eliminates entering these data again with the potential for errors.
Collection of necropsy information
Necropsy information is added in 3 phases, 1) directly after the initial necropsy, 2) as test results are received, and 3) when the final diagnosis is made and the report is finalized. The initial history, clinical signs, and gross description are entered as a searchable text field of variable length. Later on, comments about the final diagnosis are also entered as a searchable text field. The pathologist may enter as many different diagnoses (Dx) as needed to describe his or her findings (Fig. 3). Each diagnosis consists of several fields:
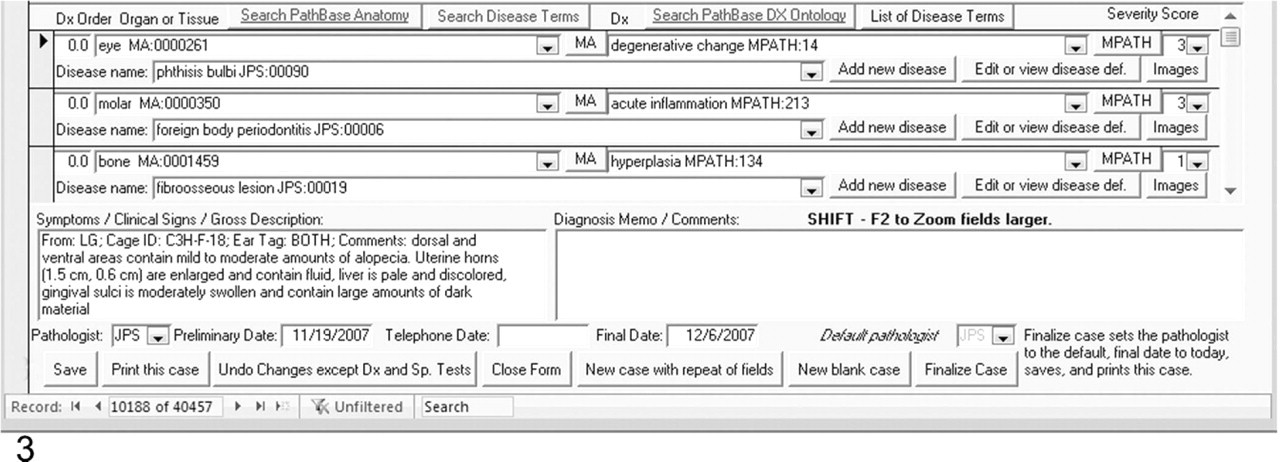
Entering the diagnoses, reviewing findings at necropsy, and notes on the diagnoses. The first field lists the organ (eye) with an anatomy code that is automatically added as the organ or tissue name is written out. The second field on the right enters the disease process (degenerative changes) with an MPATH code that again is automatically coded. The next field is a disease severity code (3). The line below lists the disease name (phthisis bulbi) with a code provided by the pathologist of record. The lower left field provides gross features at the time of necropsy, and the blank field to the right provides space for a description or comments on the specific lesions.
Dx Order: This field is used to control the order the diagnosis are listed on the printed report.
Organ or tissue: This specifies the exact anatomical organ or structure within an organ that is examined.
Dx: One diagnosis associated with the organ or tissue examined.
Disease name: The disease or syndrome associated with the findings is listed here. This may be a well-defined disease or a morphologic diagnosis.
Severity score: Values range from 0 (no lesions) to 4 (extreme severity). This is reported as an adjective in the printed report (mild, moderate, severe, or extreme), but the numerical scores can be downloaded for quantitative trait analyses for haplotype association gene mapping or other specific uses.
The organ, diagnosis, and disease fields may be entered in a free format. However, it is recommended that the ontologies associated with each field are used to create consistency (accurate spelling, fixed vocabulary, and coding) and later for numerical correlation of results.
The Anatomical Dictionary for the Adult Mouse7 is used to provide term choices for the organ field. Each organ and tissue has a unique code associated with it (e.g., Molar MA: 00000350). A link is provided on the data-entry screen to the full hierarchical anatomy listing to help new users locate the correct terms. Once a term has become familiar, it is easily entered by typing the beginning of the term and pressing tab or enter.
The MPATH Mouse Pathology Ontology12 is used to provide term choices for the diagnosis (Dx) field. Each term has a unique code associated with it (for example: MPATH 445: Papilloma). A link is provided on the data-entry screen to the full hierarchical pathology term listing to help new users locate the correct terms. This also provides a consensus definition for the term by a panel of pathologists (Joint European Experimental Pathology Expert Group). Once a term has become familiar, it is easily entered by typing the beginning of the term until a unique letter combination is entered at which point the full term and code appear automatically. For example, “bi” entry autofills to bile deposition MPATH: 35.
The disease name terms are user generated and reflect the area or tradition of pathology terms familiar to the user. These can be summative diagnoses. Each new term is given a unique number (Fig. 4). The continuous expert curation of MPATH by a committee of veterinary and physician pathologists (Joint European Experimental Pathology Expert Group) means that requests for the addition of new terms, synonyms, and definitions can be considered and, if approved, will be integrated into MPATH in an appropriate location in the ontology.
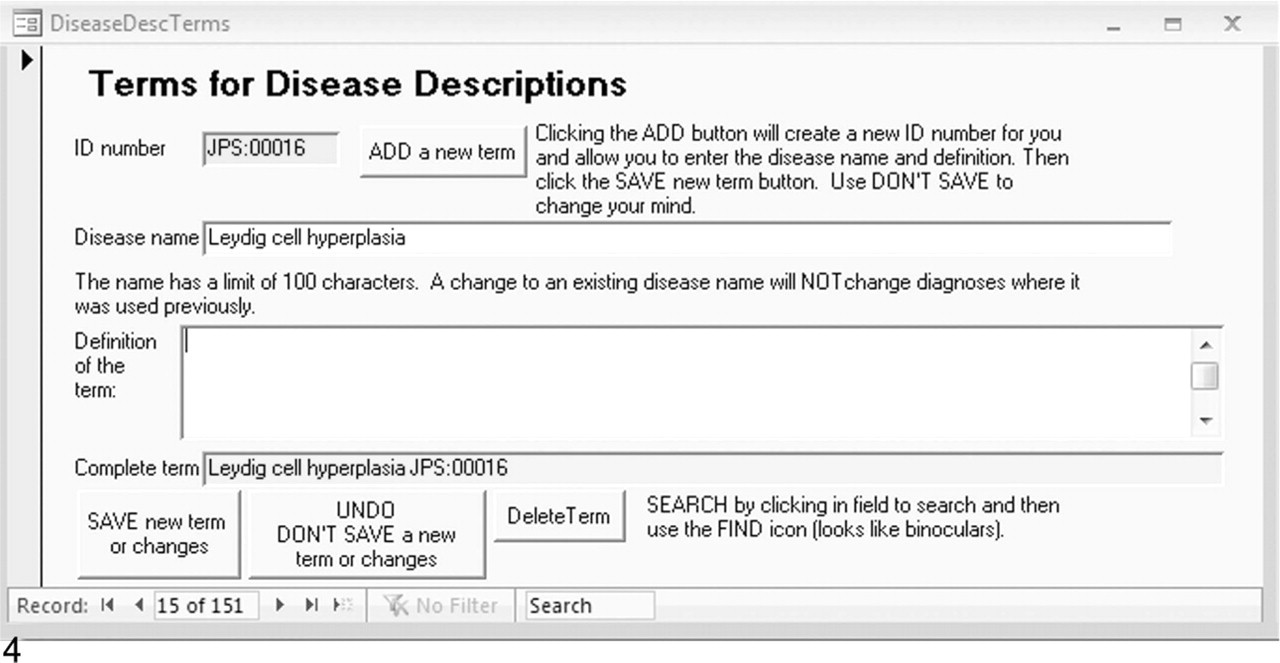
Adding a disease name is followed by clicking on Add a new term to enter a local definition. The term is automatically assigned a code based on the initials of the pathologist. This definition may later be reviewed by the MPATH pathology panel and a consensus arrived at before it is formally accepted into the public ontology.
Images
Pathologists often obtain multiple images (photomicrographs and gross photographs) that may be stored in digital formats. It is inefficient to store these as part of a database such as MoDIS because of the large file sizes. Instead, MoDIS provides a method of recording hyperlinks to the location of digital files that are associated with specific diagnoses and cases.
Using terms for teaching and reference
Links are provided on the edit screen to the online Pathbase Web site (http://www.pathbase.net; Fig. 5). By following the links, examples of the MPATH terms, definitions, and representative annotated photomicrographs may be obtained (Fig. 6). This provides the pathologist or investigator verification of their interpretation and examples of similar if not identical lesions in other mutant mice, effectively providing a “virtual second opinion.”
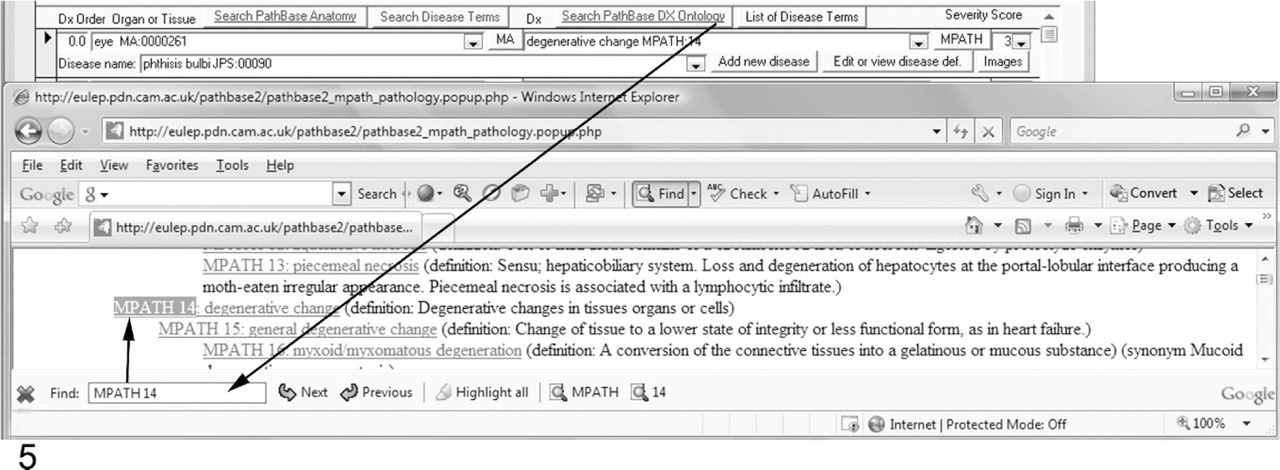
Links to the Pathbase.net Web site (http://www.pathbase.net; buttons with blue underlined text) will open a searchable Web page (as another window), showing the hierarchy of ontology terms by using the system's default browser.
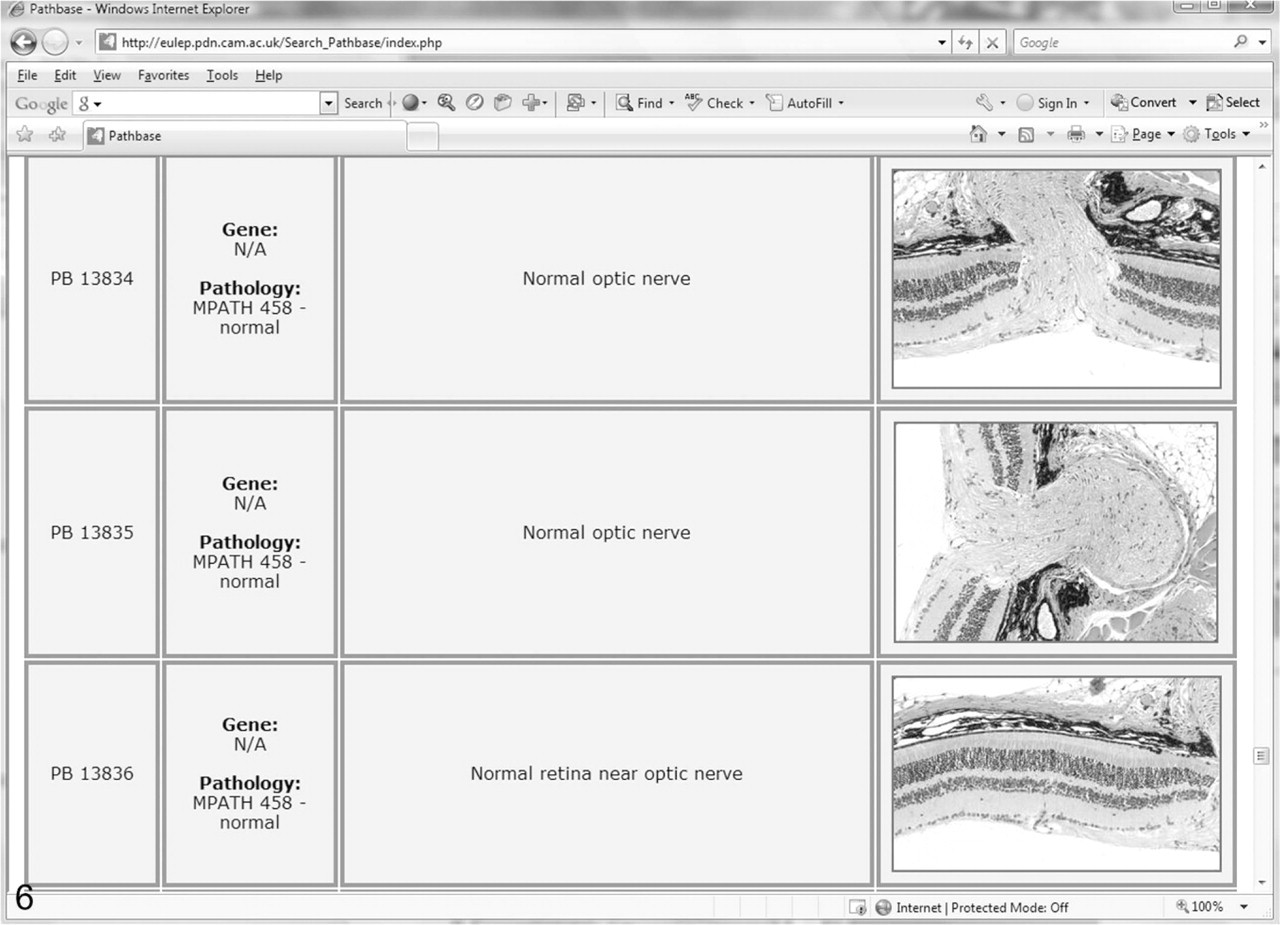
Sample Pathbase page, illustrating the normal optic nerve and retina.
Collection of special test results
Any tests that may have been run, such as microbiologic tests on selected tissues, are also recorded for each mouse along with the results. Results may be recorded as the number of negative or positive cultures identified or by entering a numeric value (Fig. 7). A separate field indicates the units for the value. A detected organism (parasite, bacteria, etc.) may be recorded. Space has been allocated to maintain a short description, serology number, and comment on each test if necessary. Standardized tables are set up with simple codes for the commonly used tests.
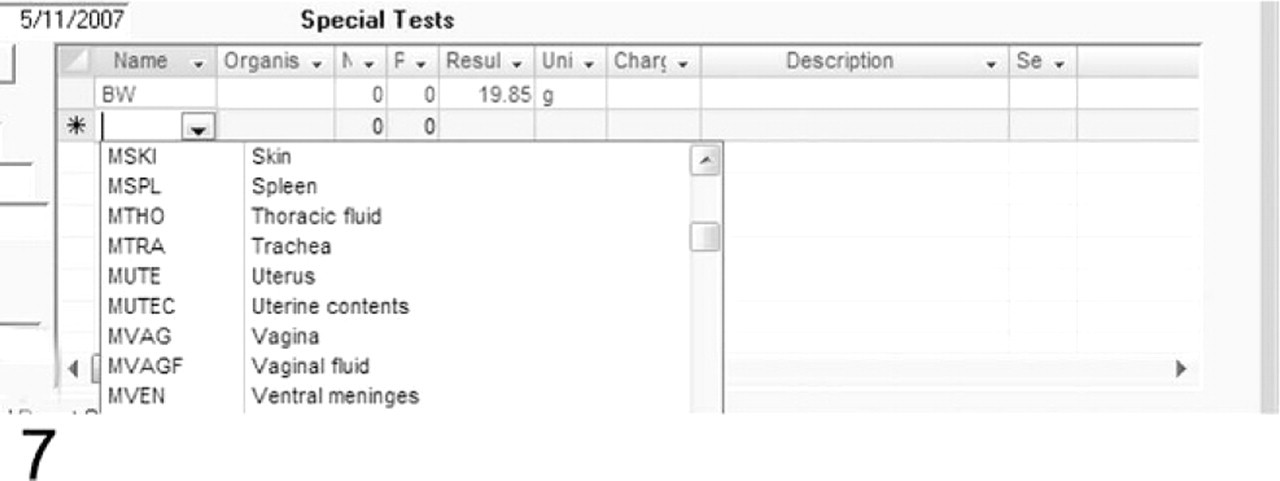
This field illustrates addition of test results to the record. BW is the code for body weight. The animal's weight, 19.85 g is entered. The drop-down menu provides lists of other tests that can be automatically entered by using abbreviations.
Report generation
This database is used to output several standardized reports on the individual mouse and projects as needed. The database is easily accessed by searching on a range of criteria. More importantly, printed final reports (Fig. 8) can easily be generated. If these reports are signed and dated by the pathologist of record, then they become legal documents. It is always a concern that medical records can be subpoenaed or that research material may become important in patent processing. A signed, dated, and filed hard copy attached to the original hand-written worksheet provides an unalterable reference. This can become important in legal situations but also provides a record that can be checked for accuracy if a particular data point stands out as apparently being entered incorrectly. For example, when doing retrospective case series studies of frequency and epidemiology of particular types of cancer that affect inbred strains of mice, exceptionally young mice may show up in the tabulation of case information. Checking the original case sheet may indicate that the wrong year was entered for the birth or necropsy date. For mice with an average life expectancy in a research or breeding colony of about a year, rarely two or more, this alters the data significantly.19 Maintenance of the original record allows for verification of accuracy of data entry, with assuming the original worksheet was carefully prepared or the information can be followed back from there to obtain the correct result.
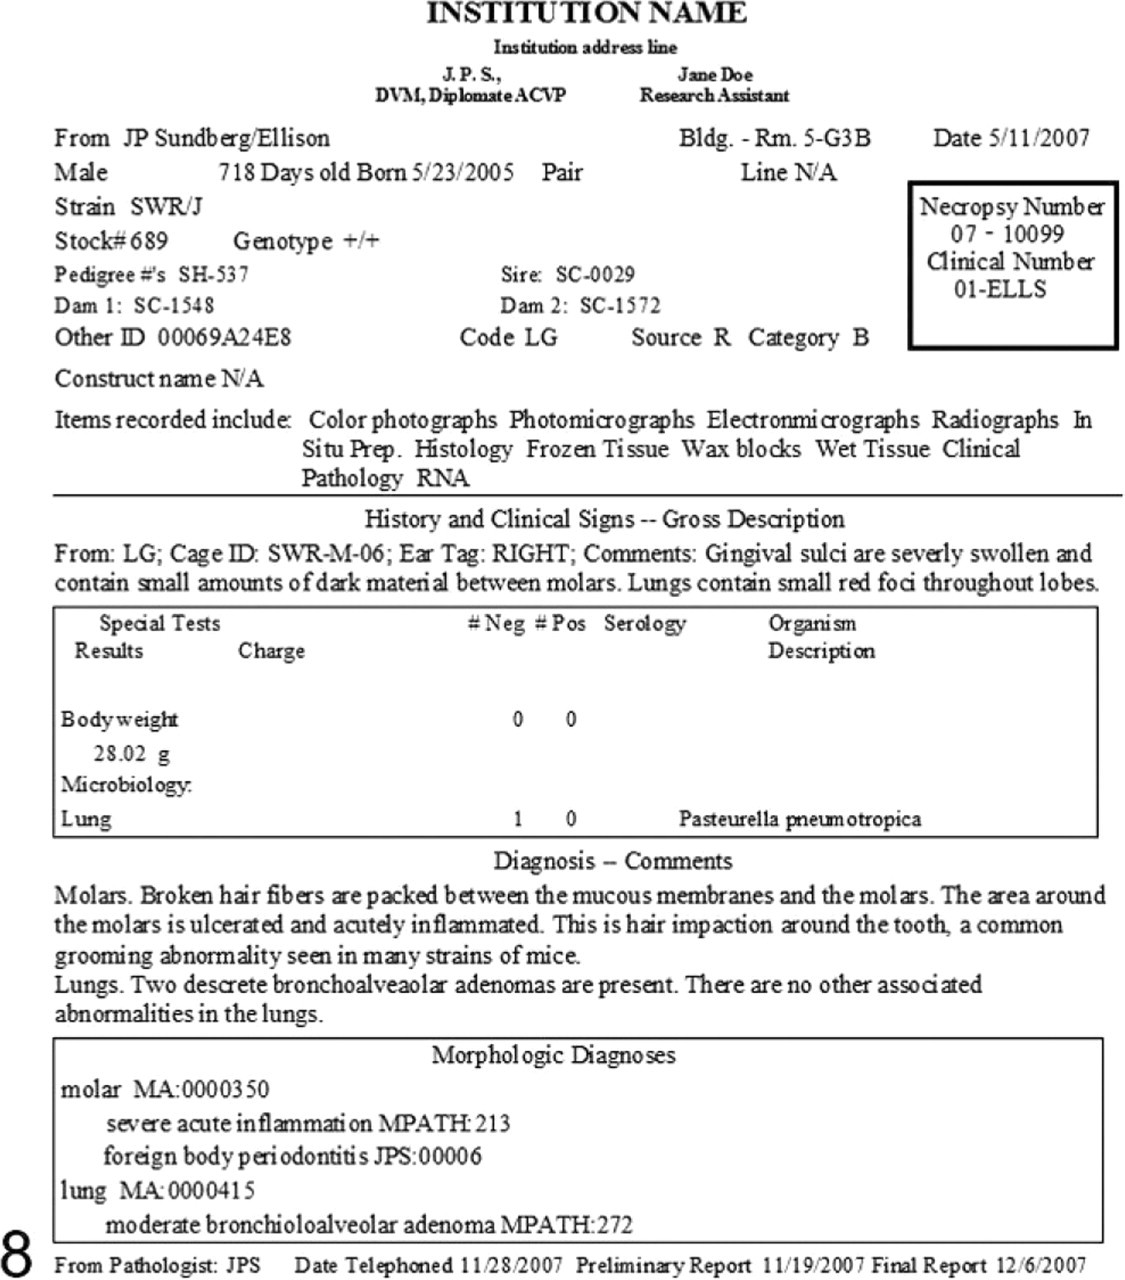
Final printed report.
Study analysis
Many scientists and technicians are familiar with the use of spreadsheets as a laboratory analysis tool. Our database system is used to output a Microsoft Excel spreadsheet of selected data for analysis. All database fields can be searched for and selected for output (Fig. 9). This spreadsheet is then used for additional data collection of project-specific data that do not need to be kept in the larger historical database. Analysis tools in the spreadsheet package include summarization, statistics, and graphs. Final copies of tables and graphs can be created that are of publication quality. Graphs and tables can be copied to word processing software for inclusion in papers or to presentation software such as Microsoft PowerPoint, Adobe Illustrator, or Adobe InDesign. Spreadsheets can be used as input to statistical programs (JMP Statistical Discovery Software http://www.jmp.com/) and gene mapping programs for further analysis.
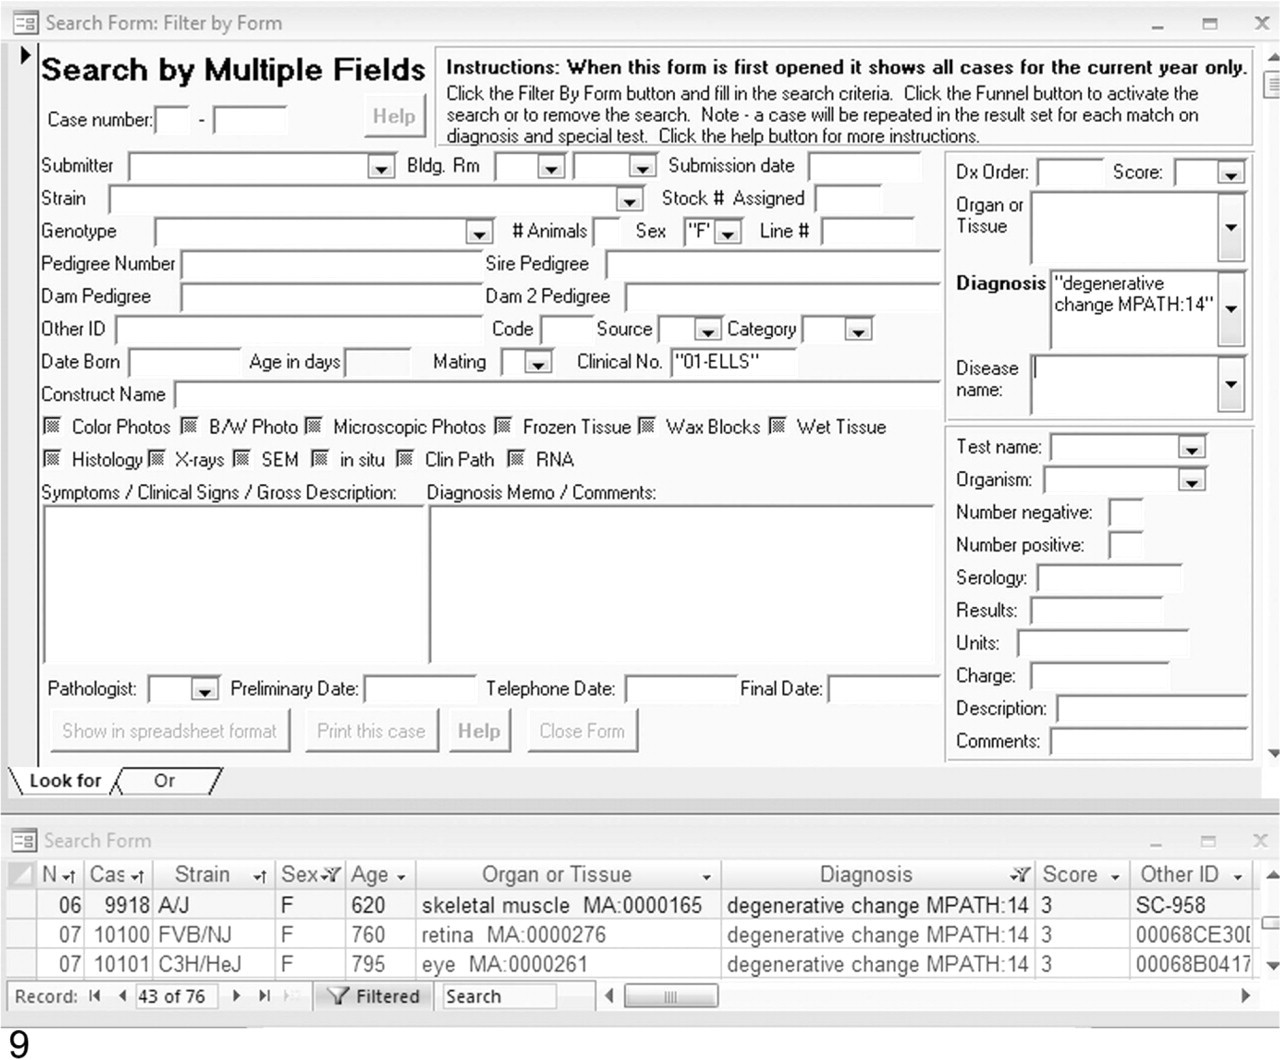
Top: An example of the search form for entering multiple criteria. A search on the “degenerative change MPATH:14” diagnosis, “01-ELLS” clinical no., and “F” sex resulted in the data sheet (bottom) listing 76 cases, which may be printed or exported in Microsoft Excel and several other formats.
Documentation
An extensive user guide is included, which contains instructions, examples with illustrations, and suggestions. The technical documentation provides step-by-step installation instructions, details about multiple users, how to use various operating systems, and problem-solving tips.
Data output
Apart from output to the documentary pathology report (see above), structured data can also be output as character (or comma) separated values standard file format for upload into other databases. The formal constraints resulting from the use of standard ontologies mean that coded diagnoses are unambiguous and computable within any environment and uses the same standard description frameworks (MA and MPATH). Future developments of MoDIS will enable XML output into a defined schema for pathologic diagnosis and allow data transmission and upload into larger databases and integration with other phenotype and genotype data. Extensive documentation is provided online, which details how this can be done.
Multiple users, security, and data tracking
The Access software can be used individually or with a server for multiple simultaneous users, which is how we use it. It is also possible, as long as the server is on the institutional network, to do data entry and manipulation off site. Security and data manipulation abilities are controlled by user passwords. User permissions are controlled by the system's administrator. There are 3 levels of access: administrator (full), user (add/edit), and guest (read-only, search, export, and print). Anyone may be given add/edit permission and data can then be entered by designated technicians, research administrative assistants (secretaries), and/or the pathologists. Guest users may not make any additions or changes. They have full abilities to view, search, and print. There is no tracking of updates to the database fields by user or time stamp. Several date fields are provided to track the completion status of a case: “submission date,” “preliminary date,” “telephone date,” and “final date.” We use these to indicate when a case was necropsied, when the signalment was entered, when the pathologist telephoned the investigator or otherwise reported results, and when the case's data entry was complete. The database contains fields for identification of the pathologist, which allows records input by multiple users to be discriminated. In addition, there are the fields, “clinical number” and “code,” in which codes, grant numbers, project numbers, etc. can be entered to allow filtering by project ID and, for example, the principal investigator.
Discussion
An inability to maintain organized records limits the speed at which a study can be finalized and reports and/or manuscripts generated. Data collection based on a single accession number incorporated into a relational database enables centralized storage of all information on an individual, pooling of information in the form of summary reports, or copying to compatible programs. Spreadsheets, statistical packages, colony management, and gene mapping software that are compatible with the database make rapid analysis possible. Many marker analysis programs today accept data from standard spreadsheet programs as input. Many different programs of these types exist, and it would be impossible to identify all of them here.4, 13 Use of a single accession number for all materials collected from an individual provides ease of storage and retrieval of specimens. Retrospective studies can be done by using the stored data and by finding the original material for verification, photography, etc. Linking to an online reference database (Pathbase) provides a “virtual second opinion” for those pathologists not familiar with the complexity of mouse pathology.
The population of major mouse phenotype databases, such as Europhenome10 and Mouse Phenome Database,3 will be facilitated by the development of data-capture tools such as MoDIS, which can capture and upload pathology data into central databases. Standardization of semantics and data structure is an essential prerequisite for the seamless integration of these data, and we believe that the principles followed in the development of MoDIS provide a useful model for expert-friendly tools that gather and structure the data needed for phenotype analysis. It is important that the tool be familiar and intuitive to the expert who is collecting information, in this case, the pathologist, and, as a consequence, the data are uploaded in a curated form that requires no further restructuring before integration into the central database. The software and documentation for MoDIS can be downloaded from (http://research.jax.org/faculty/sundberg/index.html).18
Footnotes
Acknowledgements
This work was supported by grants from the Ellison Medical Foundation, the National Institutes of Health (CA34196, CA89713, and AG025707) and the Commission of the European Community, Framework Programme 6 contract nos. LSHG-CT-2006-037811; CASIMIR, and EUMODIC; LSHG-CT-2006-037188.