
Abstract
Abstract
Purpose
One method of predicting leg-length discrepancy at maturity is the Moseley straight-line graph. Beumer et al developed an alternative graph, using a more modern Dutch population. The purpose of this study was to compare the prediction accuracy of these two graphs in a cohort of patients treated at our institution using epiphysiodesis.
Methods
We identified 76 patients treated using epiphysiodesis for leg-length discrepancy who were followed to maturity and had adequate preoperative radiographic assessment for straight-line graph construction. We compared predicted long leg length (after epiphysiodesis), short leg length, and residual leg-length discrepancy to actual outcome for both methods, using both chronological and skeletal ages.
Results
Both methods were more accurate using skeletal age rather than chronological age. The Rotterdam graph showed modest improved accuracy compared to the Moseley graph in developmental aetiologies and in Hispanic patients. Using a difference of one centimetre in prediction error as clinically relevant (long leg [after epiphysiodesis], short leg, and leg-length discrepancy in each of the 76 patients, 228 predictions), we found comparable predictions in 171, more accurate prediction using the Rotterdam in 32, and using the Moseley in 25 predictions.
Conclusions
Straight-line graphs provide a generally more accurate prediction of leg lengths at maturity by virtue of multiple preoperative evaluations. The Rotterdam straight-line graph was equal to or superior to the Moseley graph in most patients in this cohort. Use of skeletal age resulted in more accurate predictions than chronological age. Clinicians should remain familiar with the concept and use of the straight-line graph.
Level of evidence
III, case-control study.
Keywords
Introduction
Phemister 1 was the first to describe epiphysiodesis to manage leg-length discrepancy, with further contributions provided by Green et al.2,3 Important considerations in selecting appropriate timing of epiphysiodesis in managing individual patients include estimations of projected leg-length discrepancy at maturity, and the amount of growth remaining in the lower extremity physes (typically, the distal femur and proximal tibia). An early estimation of the amount of growth remaining in these two physes was provided by White and Stubbins, 4 subsequently modified by Menelaus.5,6 Anderson et al 7 in 1963 published graphs of growth remaining in the distal femur and proximal tibia by skeletal age and gender, based on studies in 100 boys and girls. In 1964, Anderson et al 8 published charts and tables of the normal distribution of the lengths of the femur and tibia from age one year to maturity, from a longitudinal study of 67 boys and girls from the Boston area started in 1930 by Reed and Stuart. 9
In 1977, Moseley 10 described the straight-line graph method for predicting the length of the long and short legs at skeletal maturity. Moseley used the mean lengths of the legs (combined femoral and tibial lengths) from the tables of Anderson et al, 8 with the normal leg length depicted as a straight 45° diagonal line on scaled graph paper, each square on the grid representing one centimetre. Male and female nomograms adjust for standard deviations in length from age 1 year to maturity; although Anderson et al 8 reported their data by chronological age (subjects were evaluated annually on or near their birthdays 9 ), the Moseley graph records the nomograms by skeletal age. Timing of epiphysiodesis with this method is based on long-leg growth inhibition induced by epiphysiodesis of the distal femur, proximal tibia, or both (so-called ‘pan-genu’ epiphysiodesis). Lines of ‘growth inhibition’ induced by epiphysiodesis complete the graph (Fig. 1a). Per Moseley,11,12 three scanograms and corresponding bone ages at least six months apart should be used to construct an appropriate straight-line graph for any individual to determine the length at which the normal (long) leg should undergo epiphysiodesis.
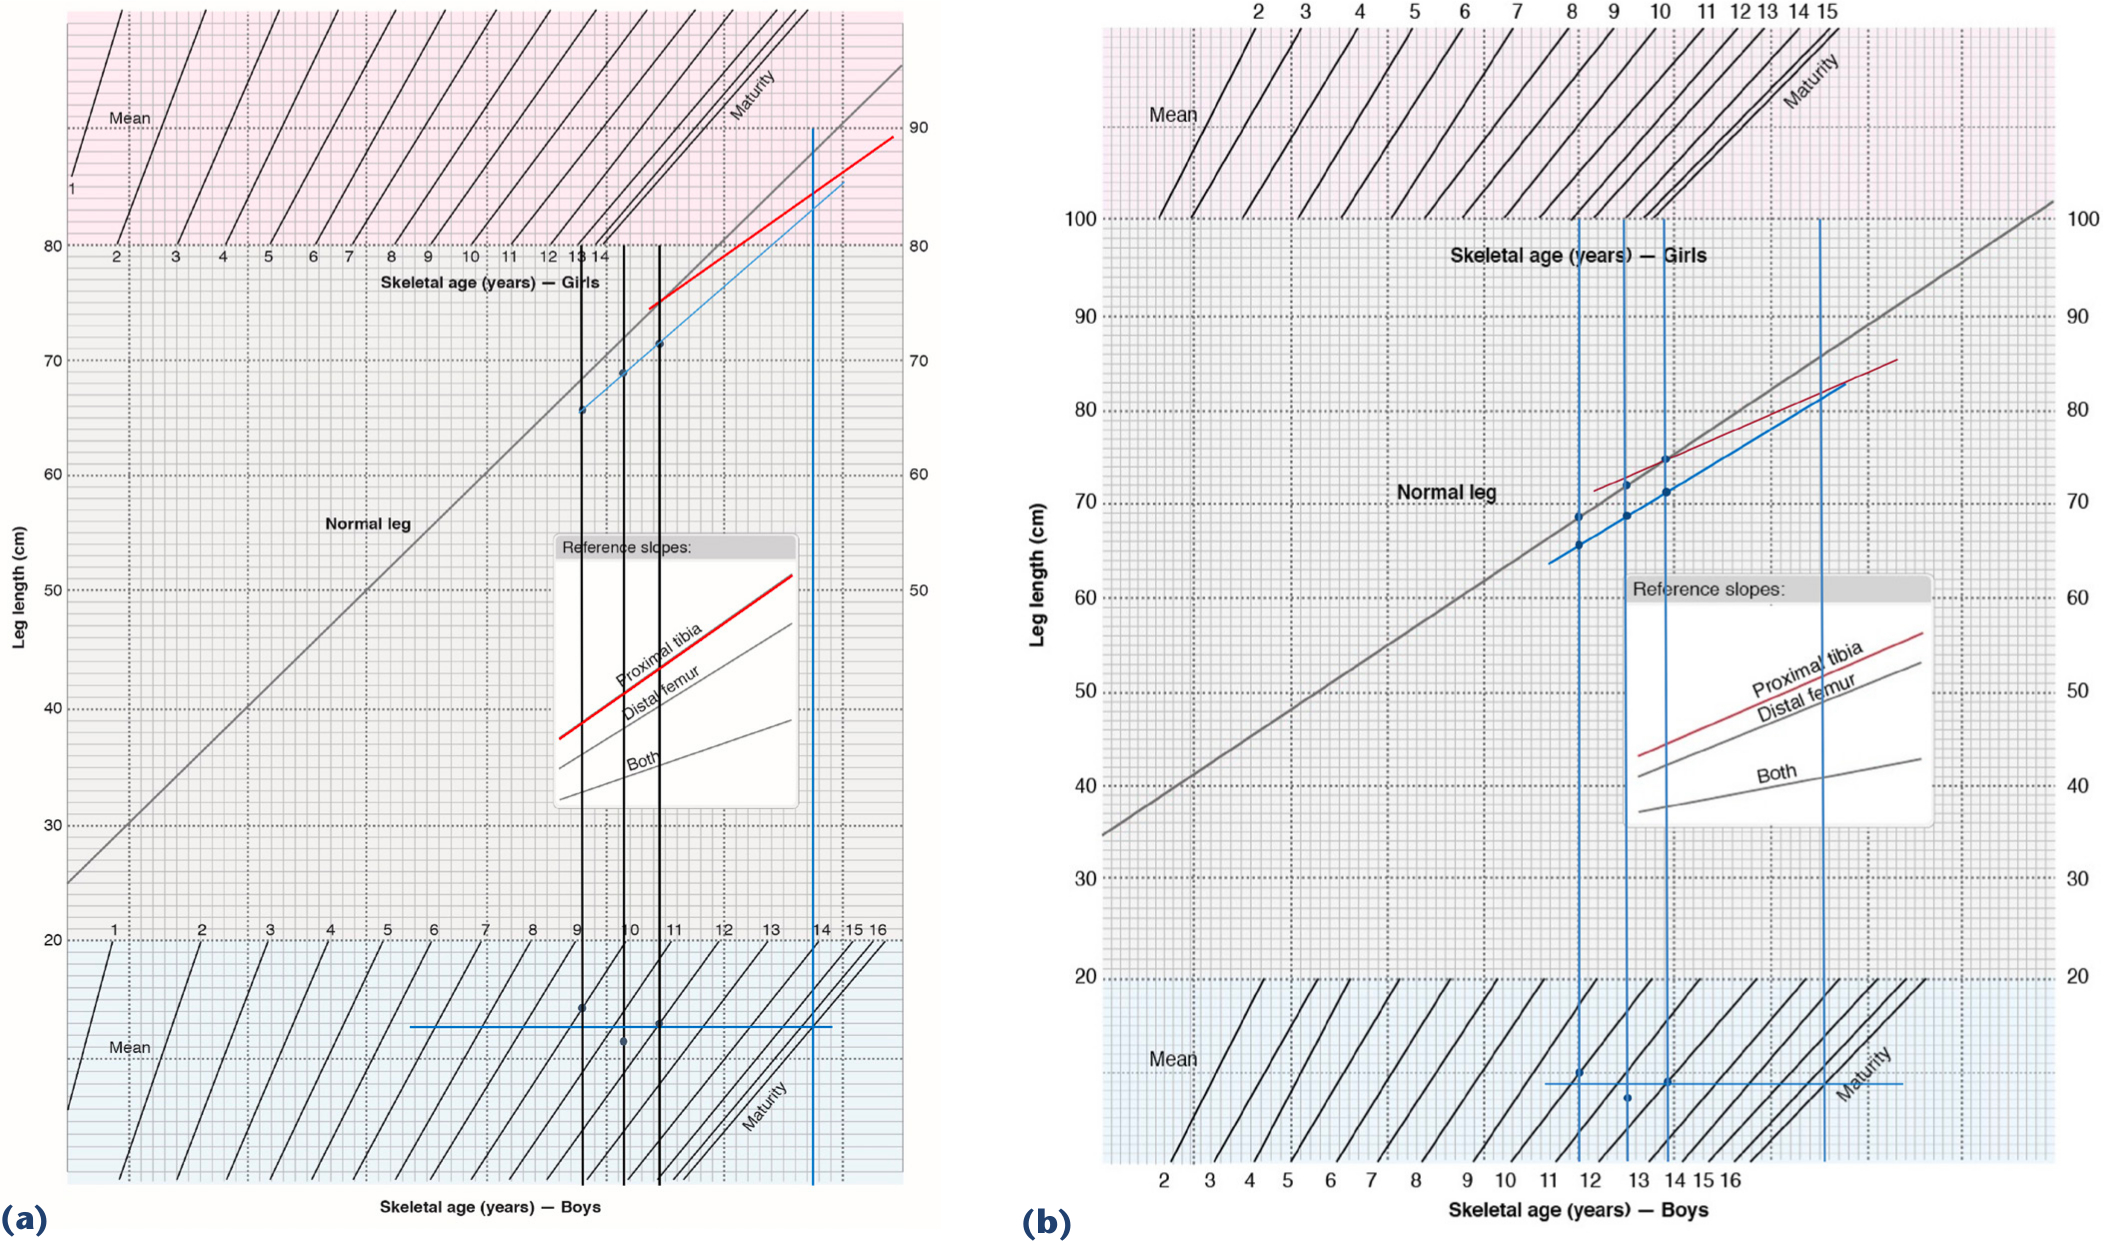
Moseley
10
and Rotterdam straight-line graphs,
13
constructed from the observations in an Asian male with congenital fibular deficiency who underwent proximal tibial epiphysiodesis. At maturity, the long leg was 83.7 cm, the short leg 83.5 cm, with a residual leg-length discrepancy of 0.2 cm. Graphs redrawn from original publications with permission.
One concern with the Moseley straight-line graph is that the growth data of Anderson et al, 8 based on a relatively homogeneous Boston-area cohort from the 1930s, 9 may not accurately represent the size of a more modern population. Beumer et al 13 studied a Dutch population of 182 children observed between 1979 and 1994. They found that the mean femoral and tibial length had increased in both boys and girls compared to the findings of Anderson et al. 8 They also identified variations between skeletal and chronological ages in their cohort, and published a modified straight-line graph (‘Rotterdam’ straight-line graph), based on their data, including skeletal age (Fig. 1b). Because their cohort was taller, they used a more horizontal normal leg line (for convenience of scale), and extended the female maturity age to 15 ¼ (from 14 ¼ in the Moseley graph). They found that their modified straight-line graph produced more accurate predictions of the length of the short leg at maturity in 22 of 34 epiphysiodesis cases, and equal results in five.
The purpose of this study was to compare the accuracy of predictions of long leg length (after epiphysiodesis), short leg length, and residual leg-length discrepancy using the Moseley and Rotterdam straight-line graphs in a cohort of patients treated using traditional Phemister or open curettage epiphysiodesis to manage leg-length discrepancy.
Material and methods
From a database of 863 patients treated at our institution by epiphysiodesis to manage leg-length inequality, we identified 76 subjects who met inclusion criteria: three scanograms and accompanying hand-and-wrist film for skeletal age determination at least six months apart; the last preoperative scanogram obtained within three months of epiphysiodesis; no postoperative complications; and a scanogram at skeletal maturity. Skeletal age was determined from hand-and-wrist films using the Greulich and Pyle atlas. 14 This cohort has been included in prior publications regarding complications associated with epiphysiodesis, 15 and a comparison of the accuracy of predictions of the methods of White–Menelaus, Anderson–Green, multiplier as described by Paley et al., 16 and the Rotterdam straight-line graph. 17 Leg lengths were measured from the top of the femoral head to the centre of the tibial plafond on hard-copy films or digital radiographs. All hard-copy films were subsequently scanned into the Picture Archiving and Communication Systems (PACs) system to facilitate repeated measurements. Per our previous report, 17 initial measurements were made by the junior authors, and verified by the senior authors. A portion of those measurements were evaluated for inter-observer reliability, where we found an inter-class correlation coefficient ranging from 0.97 to 0.99. No formal intra-observer reliability assessment was performed. Skeletal ages were reported by experienced paediatric radiologists in our institution, and independently verified by the senior author. When unusual skeletal age patterns were identified during the construction of the straight-line graphs (such as very delayed or advanced skeletal age; highly varying ages; or no change in skeletal age despite increasing chronological age), the skeletal age was verified a third time by the senior author. No formal intra- or inter-observer error study regarding skeletal age was performed, however.
To construct the Moseley and Rotterdam straight-line graphs, we imported appropriately redrawn graph templates into PowerPointTM. Straight-line graphs were constructed for each subject using the long leg, short leg, and skeletal age data from their three respective radiographic observations. The short-leg line was constructed by consensus of the authors as the ‘best-fit’ line described by the three short-leg length points, without consulting the actual final leg lengths. The horizontal maturity line in the gender-specific skeletal age nomogram was constructed as the mathematical average of the three skeletal age points. The appropriate epiphysiodesis slope was drawn from the final preoperative normal leg length to the maturity line. Graphs were also constructed using chronological instead of skeletal age. The predicted length of the long leg (after epiphysiodesis), short leg, and residual leg-length discrepancy were read directly from the graphs and recorded. We then compared the predicted and actual outcomes for each method. Representative Rotterdam and Moseley straight-line graphs are depicted in Fig. 1a and b. A prediction error was calculated by taking the absolute difference between actual and predicted values for skeletal and chronological ages. A paired t-test was used to compare two methods, and two age types at a significance level of 0.05.
Results
The demographic characteristics of the 76 patients with respect to gender, ethnicity, aetiology of leg-length discrepancy, and location of epiphysiodesis are summarized in Table 1. The average age of the subjects at the time of epiphysiodesis was 11 years, 11 months in girls (range, 10+5–13+11), and 13+3 in boys (range, 9+7–15+6). The average leg-length discrepancy was 3.7 centimetres at the time of surgery (range, 2.0–8.3 cm), and 2.0 centimetres at maturity (range, 0–5.3 cm).
Demographic characteristics of 76 patients undergoing epiphysiodesis for leg-length discrepancy.
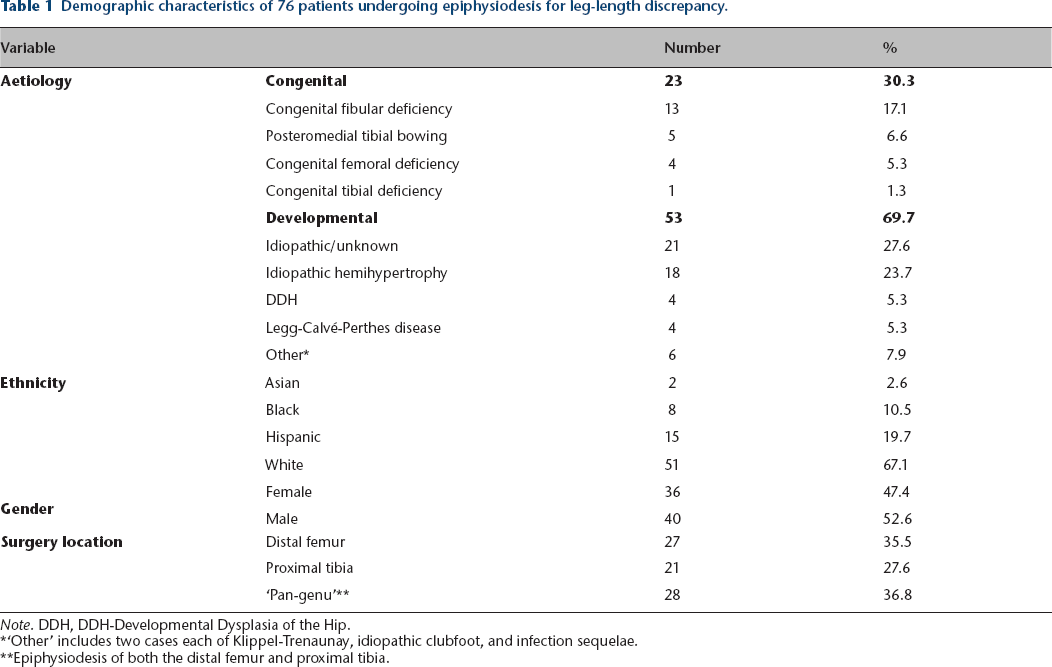
Note. DDH, DDH-Developmental Dysplasia of the Hip.
‘Other’ includes two cases each of Klippel-Trenaunay, idiopathic clubfoot, and infection sequelae.
Epiphysiodesis of both the distal femur and proximal tibia.
The comparison of prediction errors of the short leg, long leg (after epiphysiodesis), and residual leg-length discrepancy using skeletal or chronological ages for both methods are summarized in Table 2. As can be seen, there was a statistically significant improvement in prediction accuracy of each parameter by the use of skeletal age in both methods.
Comparison of prediction error using chronological or skeletal age for both the Rotterdam and Moseley straight-line graphs.

At skeletal maturity.
Mean error ± standard deviation, in centimetres.
p-value based on paired t-test.
After epiphysiodesis.
Table 3 summarizes the comparison of the Moseley and Rotterdam methods for each parameter using skeletal age. As can be seen from the table, there were no statistically significant differences in prediction errors between the methods for the entire group. We analysed each case, selecting a prediction-error difference of 1 cm or more as being clinically relevant. Comparison of the Moseley and Rotterdam graph results using that threshold for the long and short leg lengths and leg-length discrepancy is summarized in Table 4. For the combined observations (long leg [after epiphysiodesis], short leg, and leg-length discrepancy in each of the 76 patients, 228 observations), the Moseley graph was better in 25, the Rotterdam graph better in 32, and the results comparable in 171.
Comparison of prediction error between the Rotterdam and Moseley straight-line graphs, using skeletal age.
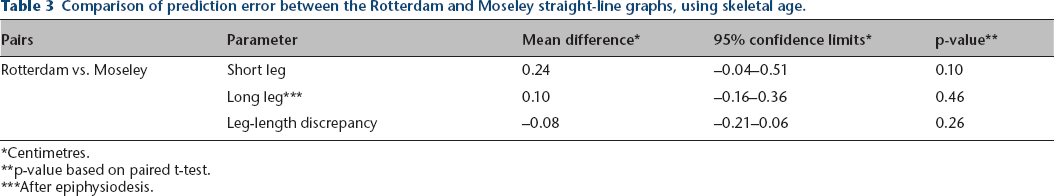
Centimetres.
p-value based on paired t-test.
After epiphysiodesis.
Prediction error differences between Moseley and Rotterdam straight-line graphs exceeding one centimetre, using skeletal age.
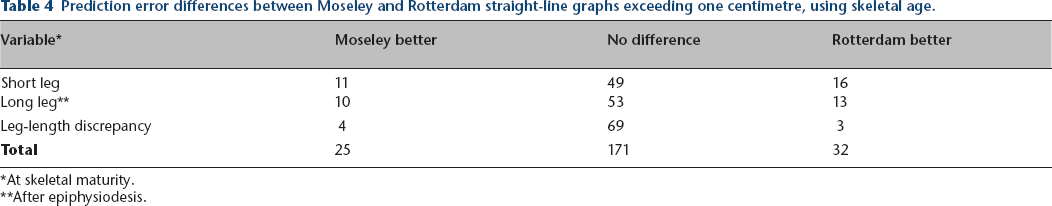
At skeletal maturity.
After epiphysiodesis.
Tables 5–7 compare prediction accuracy of both methods using skeletal age, analysed by gender, ethnicity, and aetiology of the leg-length discrepancy (congenital or developmental). As noted in these tables, statistically significant prediction error improvements of the Rotterdam graph compared to the Moseley graph were noted in leg-length discrepancy in females, short leg length prediction in males, in short and long leg lengths in Hispanics, and in long leg length prediction in developmental aetiologies. No other statistically significant differences were noted.
Comparison of prediction error between Rotterdam and Moseley straight-line graphs, using skeletal age, by gender.
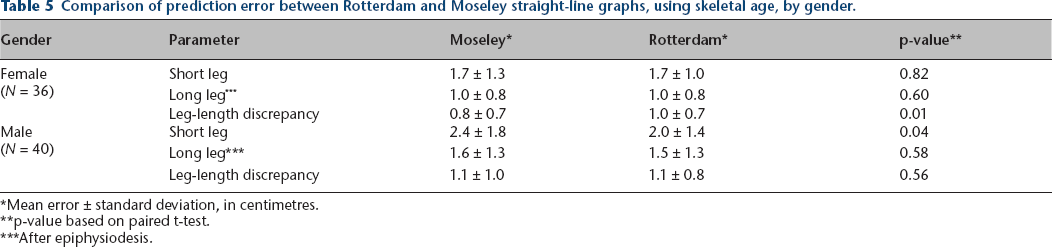
Mean error ± standard deviation, in centimetres.
p-value based on paired t-test.
After epiphysiodesis.
Comparison of prediction error between Rotterdam and Moseley straight-line graphs, using skeletal age, by ethnicity.
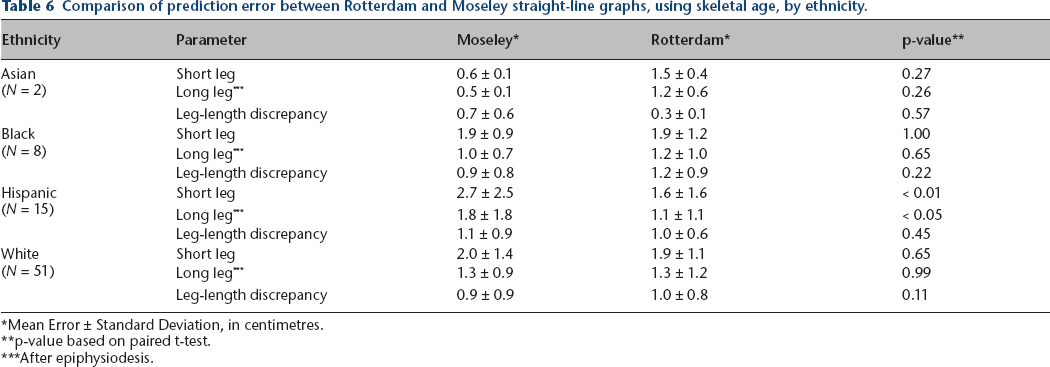
Mean Error ± Standard Deviation, in centimetres.
p-value based on paired t-test.
After epiphysiodesis.
Comparison of prediction error between Rotterdam and Moseley straight-line graphs, using skeletal age, by aetiology.
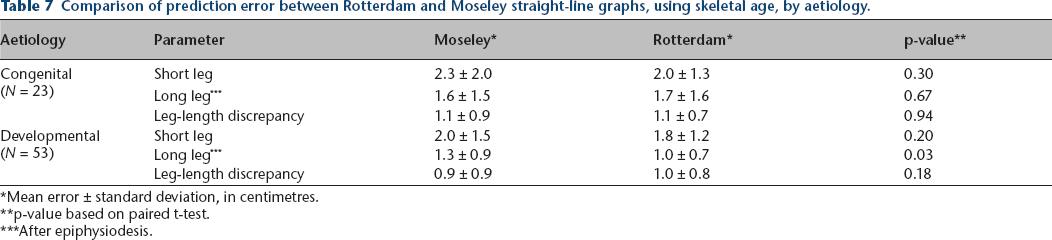
Mean error ± standard deviation, in centimetres.
p-value based on paired t-test.
After epiphysiodesis.
Discussion
In a prior publication 17 we reported that the Rotterdam straight-line graph and the White–Menelaus methods were the most statistically accurate methods of determining the lengths of the long and short legs at maturity, and residual leg-length discrepancy after epiphysiodesis. The purpose of this study was to affirm that the Rotterdam graphs were more accurate, based on a more modern population, than the Moseley graph, which is based on Anderson et al 8 data in an historically earlier population. It is important to note that our studies compare the statistical accuracy of the different methods in predicting the length of the long leg (after epiphysiodesis), short leg, and residual leg-length discrepancy, rather than the frequency of achieving a specific residual discrepancy target range. To provide some clinical relevance to our analysis, we also evaluated prediction differences of greater than 1 cm between the two straight-line graph methods.
While straight-line graphs have been criticized as requiring too many radiographs (three at least, based on the recommendation of Moseley 12 ), we do well to remember the admonishment of Anderson et al3,8 that in undertaking epiphysiodesis, it is important to understand the dynamics and vagaries of growth embodied in each child over as long a period of observation as possible. One important consideration in the prediction of the short leg length at maturity (and thus the predicted leg-length discrepancy) is the growth inhibition of the short leg relative to the normal leg, i.e., the rate at which it is ‘falling behind’ the growth of the longer leg. This can be calculated as the increment of the difference of the length increase at two observation points, as is used for the Anderson–Green and multiplier methods (for ‘developmental’ aetiologies), or presumption of a constant growth inhibition factor in congenital anomalies (as the multiplier method does). However, careful inspection of the illustrative cases published by Anderson et al 8 (Charts I and II), makes it clear that appreciably different growth inhibition would be determined for those patients, depending on which two points are selected for that calculation. Furthermore, Shapiro 18 in a longitudinal study of 803 patients with leg-length inequality, identified five different patterns of growth inhibition, of which only one was constant. Therefore, there is potential for clinically significant errors in these predictions when only one or two observation points are used to define the dynamics of growth in individual patients. The straight-line graph method by using (at least) three observation points to construct the short-leg line likely results in better distribution of growth vagaries. The relative subjectivity of constructing the short-leg line in some cases (specifically, by not drawing converging lines without obvious clinical confirmation of spontaneously decreasing leg-length discrepancy) may enhance the accuracy effected by the use of multiple observation points.
Another potential shortcoming of the Moseley graph is the transposition of chronological age measurements to skeletal age nomograms. The cohort of 67 boys and girls which constitutes the longitudinal studies of both Reed and Stuart 9 and Anderson et al 8 were examined on or near their birthdays. It is clear that individuals within study cohorts can have skeletal ages appreciably different than chronological. Cundy et al 19 found in a study in which four radiologists independently reported skeletal age in 60 hand films that 50% of the cases were assigned skeletal ages that varied more than one year between observers, and by more than two years in 10%. Their tabular data also document that 19/60 films were read as being more than one year different from chronological age by all four radiologists. We found that approximately 25% of our cohort had a skeletal age more than one year different from their chronological age as well. 17 It should be noted that not all studies recommend use of skeletal over chronological age,5,6,20 despite these findings.
A complaint against the straight-line graph methods is that they are too tedious to construct. However, we found that these graphs were easily constructed and interpreted by transposing the graph template onto PowerPointTM images, with bullets and lines embedded to represent individual length measurements, corresponding verticals and horizontals, and epiphysiodesis-induced growth inhibition lines.
Our study has significant limitations. The use of the Greulich and Pyle atlas to determine skeletal age has significant deficiencies, including inter-observer error and substantial age gaps in the atlas. Further study of improved accuracy with more ‘modern’ methods of skeletal age determination, particularly as applied to leg-length discrepancy and epiphysiodesis timing, are warranted. Our study population was distinctly heterogeneous, and thus substantially different from those of Greulich and Pyle, 14 Anderson et al, 8 and Beumer et al. 13 The findings in our study may be influenced by these ethnic and racial differences. Furthermore, most of our demographic subgroups are relatively small, potentially introducing sample-size inaccuracy to our findings.
In conclusion, we found in this cohort that the Rotterdam straight-line graph was equal to or better than the Moseley straight-line graph in the majority of subjects, albeit modestly so. We believe that paediatric orthopaedic surgeons considering epiphysiodesis to manage leg-length discrepancy by epiphysiodesis should remain conversant in the use of straight-line graphs.
Footnotes
All other authors report no conflict of interest.
MRM: Supervised data collection, graph construction, data analysis, participated in the preparation of the manuscript.
CHJ: Provided verification and statistical analysis of the data, participated in the preparation of the manuscript.
JGB: Designed and supervised the study, prepared and revised the manuscript. references