
Abstract
Scientists aspire to measure cause and effect. Unfortunately confounding variables, ones that are associated with both the probable cause and the outcome, can lead to an association that is true but potentially misleading. For example, altered body weight is often observed in a gene knockout; however, many other variables, such as lean mass, will also change as the body weight changes. This leaves the researcher asking whether the change in that variable is expected for that change in weight. Ratio correction, which is often referred to as normalization, is a method used commonly to remove the effect of a confounding variable. Although ratio correction is used widely in biological research, it is not the method recommended in the statistical literature to address confounding factors; instead regression methods such as the analysis of covariance (ANCOVA) are proposed. This method examines the difference in means after adjusting for the confounding relationship. Using real data, this manuscript demonstrates how the ratio correction approach is flawed and can result in erroneous calls of significance leading to inappropriate biological conclusions. This arises as some of the underlying assumptions are not met. The manuscript goes on to demonstrate that researchers should use ANCOVA, and discusses how graphical tools can be used readily to judge the robustness of this method. This study is therefore a clear example of why assumption testing is an important component of a study and thus why it is included in the Animal Research: Reporting of In Vivo Experiment (ARRIVE) guidelines.
Keywords
Scientists aspire to measure cause and effect. Consequently, experiments are designed to isolate the effect of interest as we manipulate a variable (the independent variable) to see what effect it has on a second variable (the dependent variable). Unfortunately, confounding variables (also called confounders, lurking variables or confounding factors) can lead to studies where the internal validity can be questioned. A confounding variable is one that it is associated with both the probable cause and the outcome. When confounding variables are uncontrolled, an erroneous conclusion can be drawn. Typically, experiments are designed using random allocation to remove the potential effects of confounding variables. However, in many experiments this is not possible and statistical methods for handling non-equivalent groups are necessary. 1 This manuscript uses real data from phenotyping experiments to discuss this issue.
Using the mouse as a model organism, targeted inactivation of a gene can yield a diverse range of phenotypic manifestations. 2 Body weight is a highly heritable trait, and consequently commonly altered in knockout lines of mice. 3 Body weight is known to correlate with many other biologically interesting variables (e.g. grip strength, heart weight and bone density); therefore, it is unsurprising when the knockout also results in difference in these other variables. It raises the question as whether the change in these variables is greater than expected given the observed change in body weight. Statistically, body weight in these examples is described as a confounding variable.
Ratio correction, which is often referred to as normalization, is a method frequently used in biological research to remove the effect of a confounding variable. 4–9 In this method, data are ‘normalized’ by the calculation of a ratio with the idea that this will give a relative value. For each individual, the dependent variable measurement is divided by the confounding variable measurement (e.g. grip strength/body weight). A statistical test, such as a Student's t-test, is then used to compare the ratio across the control and treatment groups. The theory is that the relative ratio will remove the effect of differences in the confounding variable, as the ratio will be constant if the difference between the variable of interest is due solely to the confounding variable. However, there have been publications, particularly in physiology and anthropology, which have raised concerns about the use of the ratio correction approach. 10–16 For example, in a discussion of morphometrics data, Reist 14 stated that while it was perhaps the most prevalent method, the superficial simplicity of ratio correction masked a host of potential problems. Similarly, two studies in human obesity looking at variables such as body mass index and percentage body fat, demonstrated that mathematical ratios can lead to spurious conclusions. 17,18
Statistical literature suggests the use of analysis of covariance (ANCOVA) to address confounding variables. This method examines the difference in means after adjusting for the confounding relationship. 19 For example, ANCOVA was used to remove the effect of body weight difference in a study looking at the impact of a weight loss programme on coronary heart disease risk factors in mildly obese women. 20 Furthermore, the use of ANCOVA was recently recommended by Tschöp et al. 21 in a guide to analysis of mouse energy metabolism.
This report aims to raise awareness of the generic nature of the issues with ratio correction. Two methods, ratio correction and ANCOVA, were used to adjust multiple parameters for the effect of confounding variables; the results were compared, with particular focus on mouse phenotyping data. In line with the ‘Animal Research: Reporting of In Vivo Experiment (ARRIVE)’ guidelines, the assumptions underpinning the analysis methods are assessed. 22 The manuscript goes on to recommend that researchers should use ANCOVA, and discusses the strengths and weaknesses of this method.
Materials and methods
Mice
The care and use of all mice in this study was carried out in accordance with UK Home Office regulations, UK Animals (Scientific Procedures) Act of 1986. Mice were maintained in a specific pathogen-free unit on a 12 h light:12 h dark cycle with lights off at 19:30 h and no twilight period. The ambient temperature was 21 ± 2°C and the humidity was 55 ± 10%. Mice were housed using a stocking density of 3–5 mice per cage (overall dimensions of caging: (L × W × H) 365 mm × 207 mm × 140 mm, floor area 530 cm2) in individually ventilated caging (Tecniplast Seal Safe1284L; Techniplast, Buguggiate, Italy) receiving 60 air changes per hour. In addition to Aspen bedding substrate, standard environmental enrichment of two nestlets, a cardboard fun tunnel and three wooden chew blocks was provided. Mice were given water and diet ad libitum. At four weeks of age, mice were transferred from a breeders diet (Mouse Breeder Diet 5021; LabDiet, Richmond, IN, USA) to a high fat (21.4% fat by crude content) dietary challenge (Western RD 829100, Special Diet Services, Essex, UK).
Dual-energy X-ray absorptiometry
At 14 weeks of age the mice were weighed and then anaesthetized with either Avertin (1.25% 2,2,2-tribromoethanol; Sigma Aldrich, Dorset, UK) or with ketamine (100 mg/kg, Ketaset; Fort Dodge Animal Health, Hampshire, UK) and xylazine (10 mg/kg, Rompun; Bayer Animal Health, Berkshire, UK). Body length (nose to tail base) was measured and dual-energy X-ray imaging performed using a PIXImus II Bone Densitometer (GE Medical Systems, Buckinghamshire, UK). The region of interest on the resulting images was manually selected to exclude the skull, and then the Lunar PIXImus software package (GE Medical Systems) calculated body fat mass (g), lean mass (g), fat percentage estimate (%), bone area (cm2), bone mineral density (BMD) (g/cm2) and bone mineral content (BMC) (g). Quality control using a phantom mouse was performed prior to imaging. The ketamine/xylazine anaesthesia was reversed using atipamezole hydrochloride (1 mg/kg, Antisedan; Pfizer Animal Health, Surrey, UK). To avoid introduction of bias, the experimenters were blind to the genotype during the procedure. Furthermore, cages were processed randomly and different genotypes could be housed together, hence there was no pattern to the order in which animals were processed. Mice were returned to their group-housed cages and placed on a heated recovery rack until they were fully ambulant at which point they were placed on holding racks and kept for further unrelated experiments.
Data-sets
To examine the relationship between body weight and the dual-energy X-ray absorptiometry (DEXA) variables, wild-type data were collected for three strains, C57BL/6Dnk (B6Dnk), C57BL/6NTac (B6N) and C57BL/6Brd-Tyrc–Brd
;C57BL/6Dnk;C57BL/6N (B6Brd;B6Dnk;B6N-Tyrc–Brd
), as detailed in Supplementary Table S1 (available online only at
Data analysis
Data analysis was completed using the commercial software SPSS, Version 17.0.2 (IBM SPSS software, NY, USA) and the freeware statistical program R. 23 The analysis was reported in accordance with the ARRIVE guidelines. 22
Results and discussion
Body weight was found to linearly correlate with the DEXA variables
To confirm a correlation between body weight and DEXA variables (fat mass, lean mass, fat percentage estimate, bone area, BMD and BMC), wild-type data were collected and the relationship between the DEXA variables and body weight examined with a scatter plot and a linear regression. There was a linear correlation between body weight and the DEXA variables for all three mouse strains examined (Figure 1, Supplementary Table S2 and Supplementary Figure S1; available online only at Representative scatter plots to show the correlation between body weight and the DEXA variables. Data shown are from B6Brd;B6Dnk;B6N-Tyrc–Brd
wild-type female mice for fat mass (a) and lean mass (b). DEXA: dual-energy X-ray absorptiometry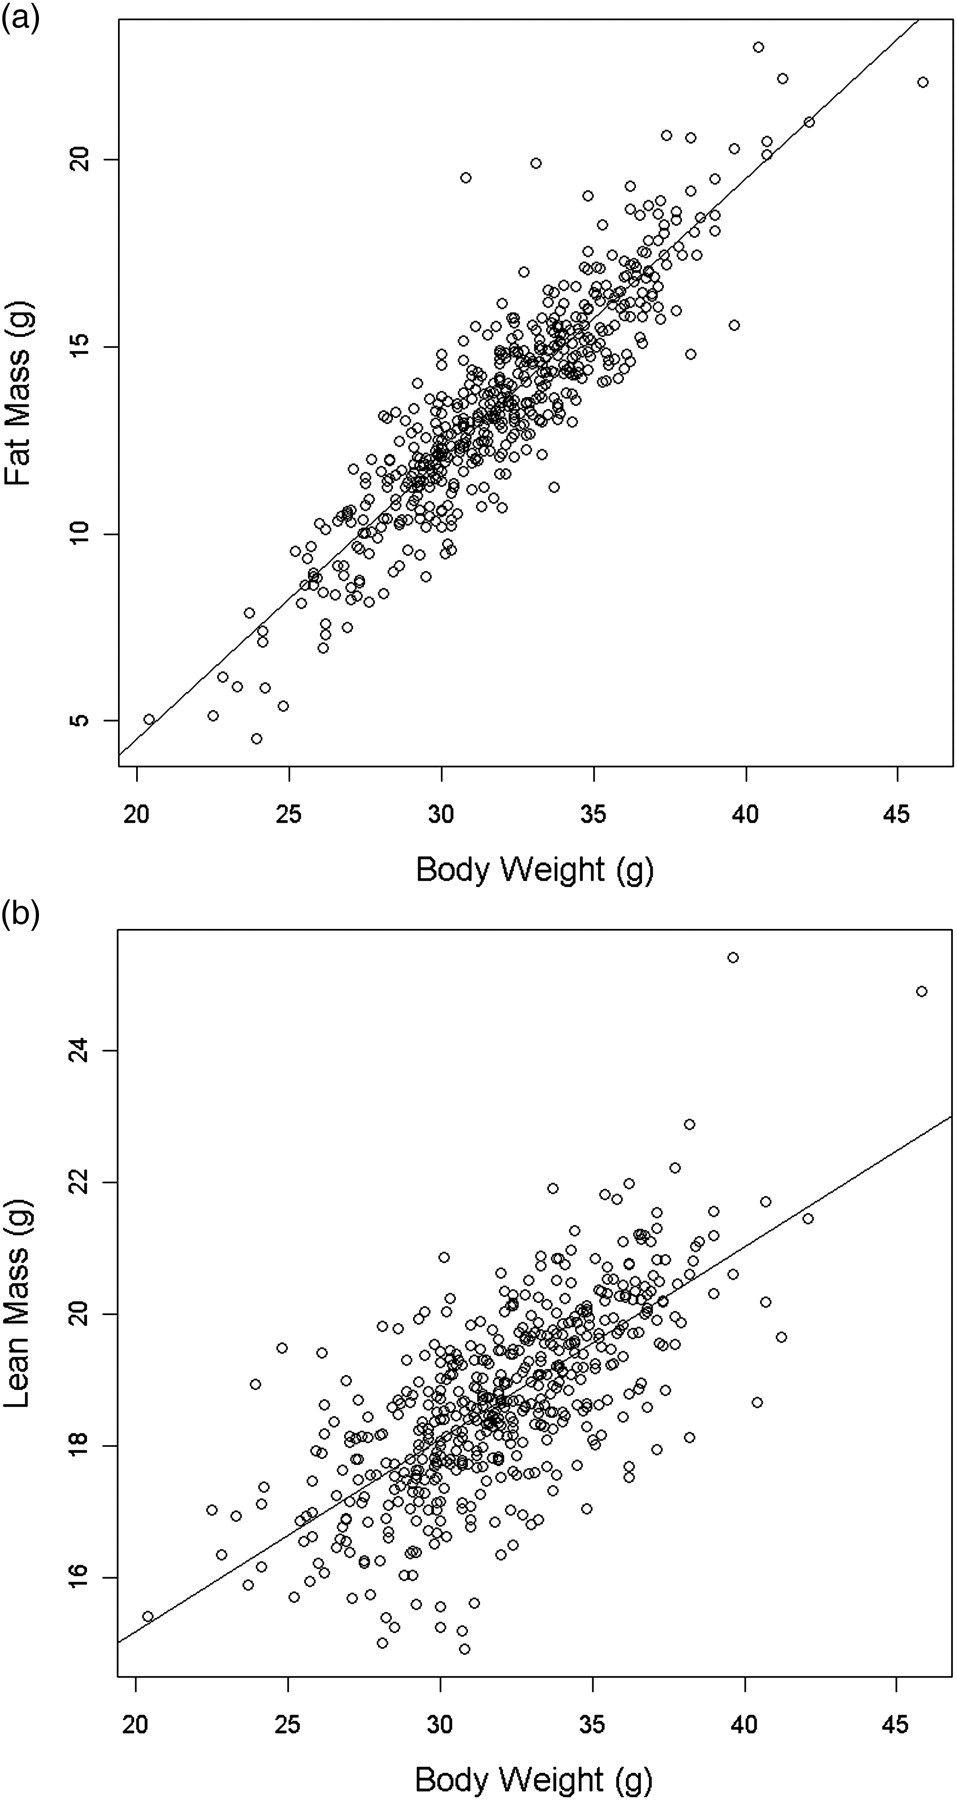
Comparison of statistical calls using ANCOVA and the ratio correction approach
Females homozygous for the thymoma viral proto-oncogene 2 (Akt2) targeted inactivation allele Akt2tm1Wcs
, were found to have a statistically significant decrease in both body weight and in the DEXA variables (Figure 2 and Table 1). This decrease was classified as a large effect since the Cohen's d measure was >0.8
25
for each variable (Table 1). This raised the question as to whether the changes in the DEXA variables were expected with this change in body weight (i.e. the proportion of these variables had stayed consistent), or whether the make-up of the animal had also changed alongside the body weight change.
Box plot comparisons of the impact of Akt2 genotype (wild-type [WT] controls versus Akt2tm1Wcs
homozygotes [HOM]) on body weight and DEXA variables. The whiskers extend to the most extreme data point which is no more than 1.5 times the interquartile range. Points beyond this are classed as outliers and are shown individually as open circles. DEXA: dual-energy X-ray absorptiometry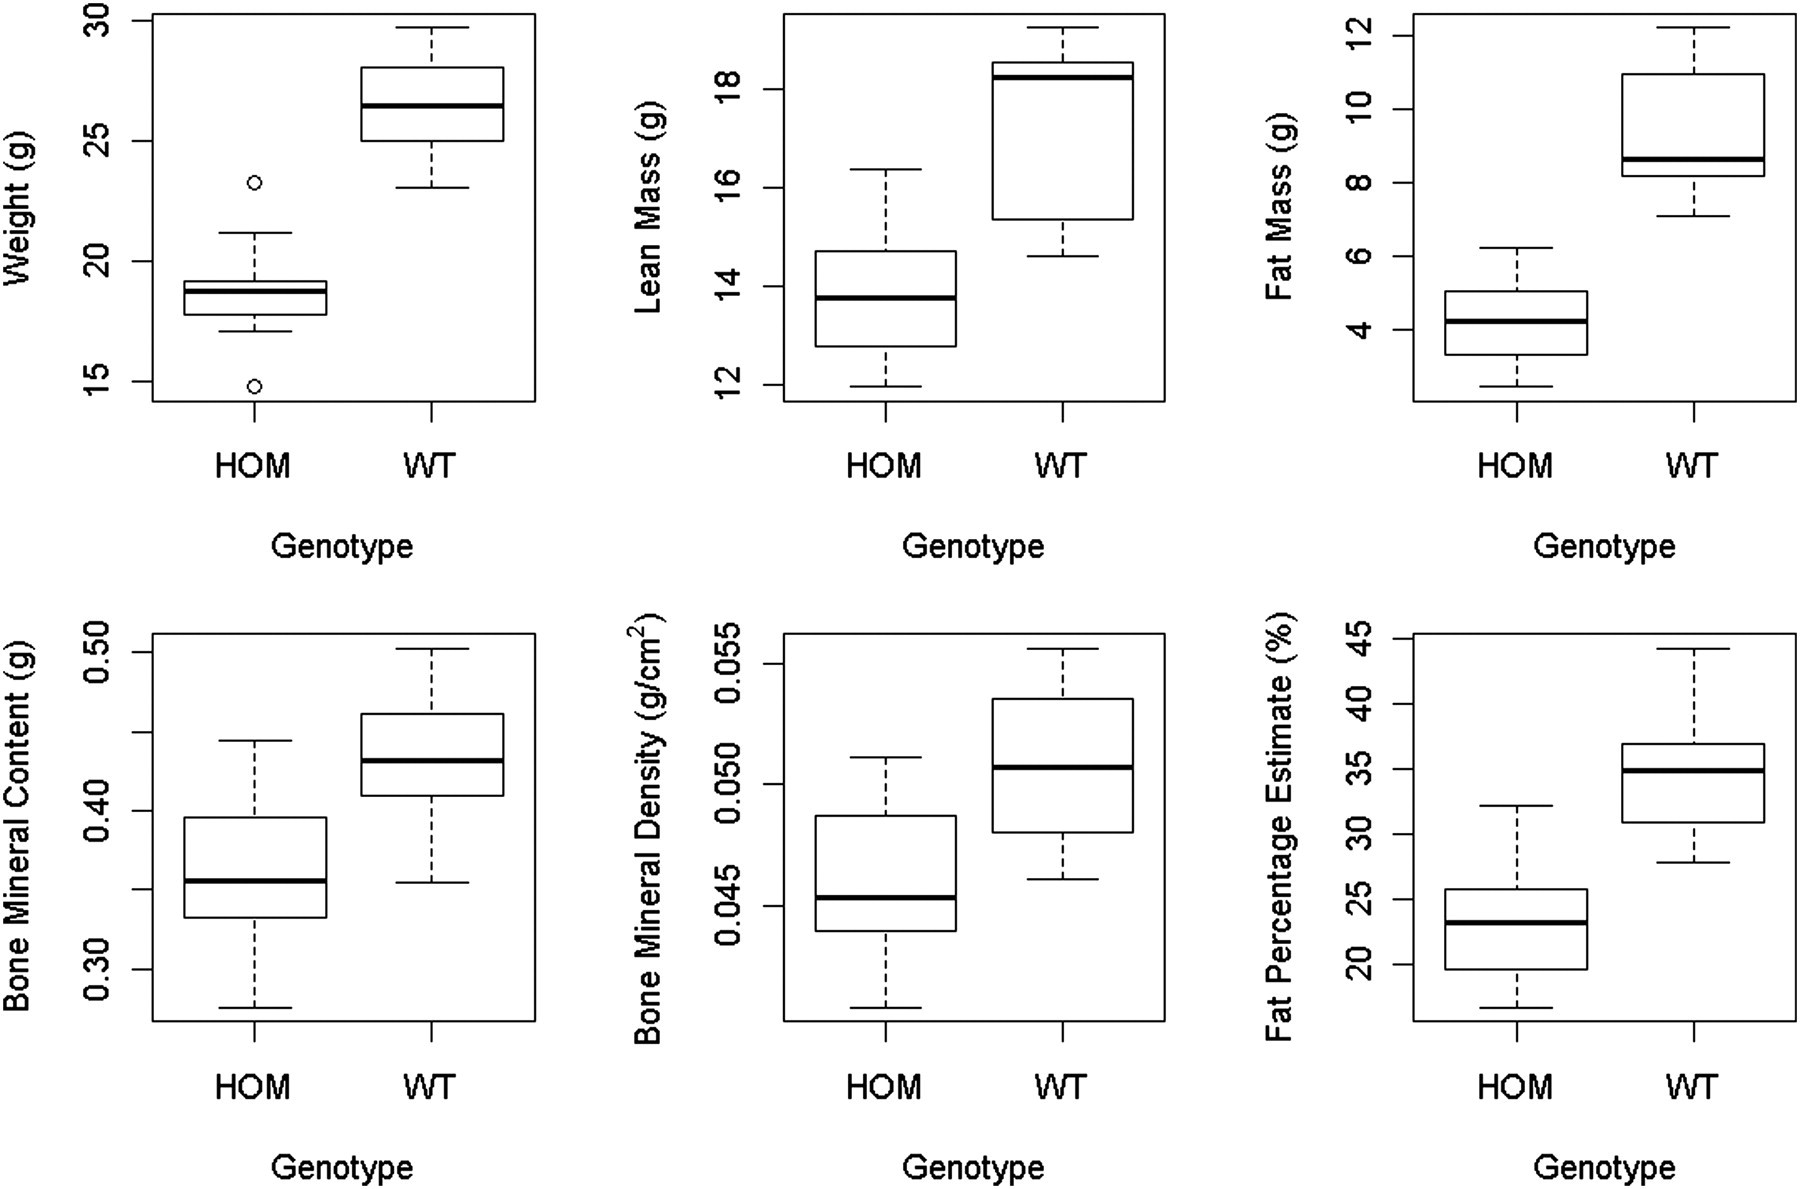
Statistical significance when assessed with different approaches
The statistical outcome for the comparison of body weight and DEXA variables for female Akt2tm1Wcs mice is presented when the data were analysed using classic statistical tests with raw and ratio corrected data, and then using ANCOVA. Cohen's d is a measure of the strength of the treatment effect and is calculated as the difference between the means (control mean − knockout mean) divided by the average standard deviation. 25 A measure of the treatment effect was only calculated in situations where a statistically significant difference was detected DEXA: dual-energy X-ray absorptiometry; ANCOVA: analysis of covariance
Both ANCOVA and ratio correction are methodologies proposed to remove the effect of a confounding variable, thereby allowing the experimenter to assess whether the underlying variable would have changed with the treatment if the confounding variable effect was removed. Looking at the ratio correction approach, where the variable of interest was divided by the body weight and a Student's t-test was used to compare the resulting ratios, a statistically significant difference was detected for four of the five DEXA variables assessed. Furthermore, the Cohen's d measure indicated that each difference was a large effect (Table 1). For lean mass, BMC and BMD, the results from the ratio correction approach suggested that while there was a drop in these DEXA variables with the knockout, once body weight was accounted for, the knockout had an increase in these variables, as the relative ratio was significantly higher in knockout mice. For fat mass, the ratio correction analysis suggested that once weight was accounted for, there was a decrease in the amount of fat mass per unit weight in knockout mice. By contrast, when the effect of body weight on the DEXA variables was removed using the ANCOVA method, no statistically significant difference was detected for any of the DEXA variables (Table 1). In summary, while targeted inactivation of Akt2 clearly affected body weight, the ratio correction method suggested that the knockout also had effects on the DEXA variables to body weight proportions, while ANCOVA analysis indicated that there was no significant difference in the DEXA variables once the relationship with body weight was accounted for.
Are the results from the ratio correction approach meaningful?
As with all statistical tests, the ratio correction approach makes a number of assumptions that affect the performance of the test. Specifically, it assumes a linear relationship with the confounding variable through the origin (i.e. the relationship can be described with a gradient term and not a significant intercept term), that the ratio is normally distributed, that the measurements are independent, and finally that the variance in the two groups being compared is equivalent (homogeneity of variance). From wild-type data, a linear relationship was demonstrated such that as body weight increased so did the DEXA variables (Figure 1, Supplementary Table S2 and Supplementary Figure S1). This relationship can be described by a linear equation (Equation 1) which has both a significant intercept and gradient element (Supplementary Table S2), where x is the body weight, y is the DEXA variable of interest, c is the intercept and m the gradient.

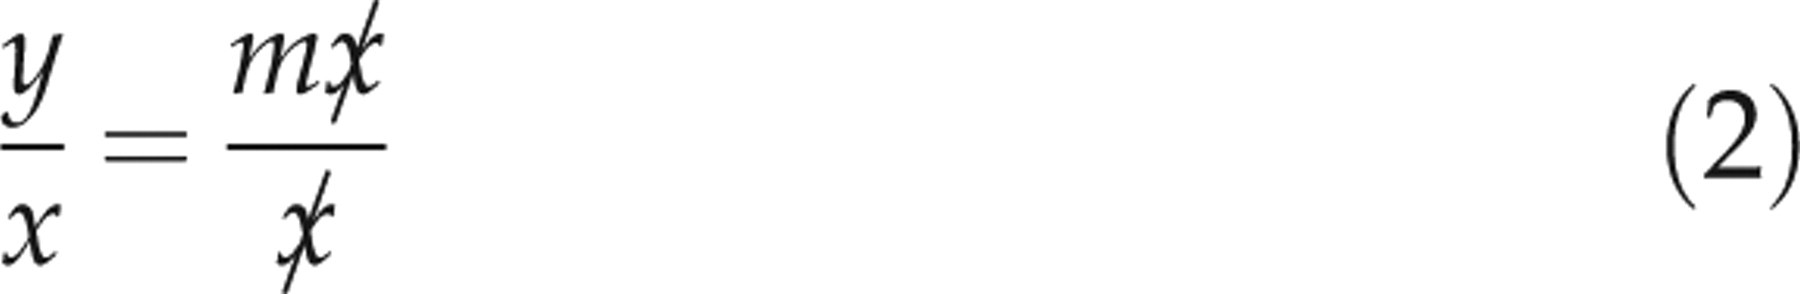
In the ratio correction approach, the variable of interest (y) is divided by the confounding variable (x). If the linear relationship can be described with only a significant gradient, then on division by x, the ratio becomes equal to the gradient:
When the linear relationship is described by both a significant gradient and an intercept then the dependency on x is not removed. Rather the ratio becomes inversely dependent on x, such that as the confounding variable increases the ratio decreases (Equation 3). This happens as the confounding variable is now dividing the intercept component, so as it increases, the element added to the gradient element gets smaller, and so the calculated ratio decreases.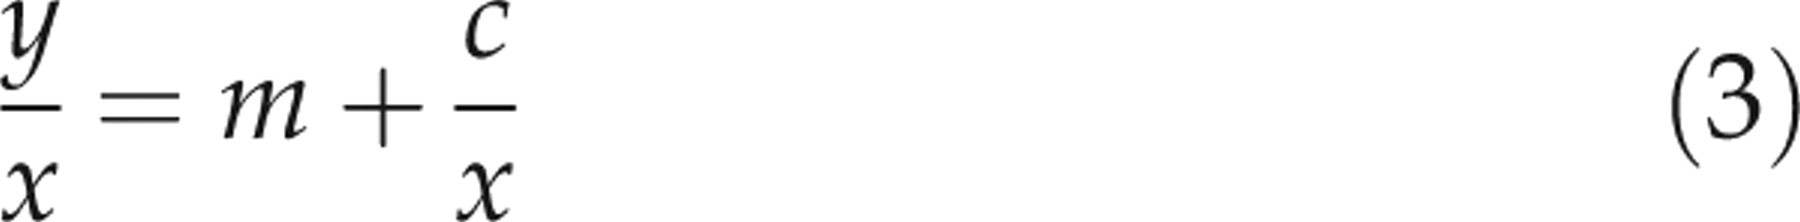
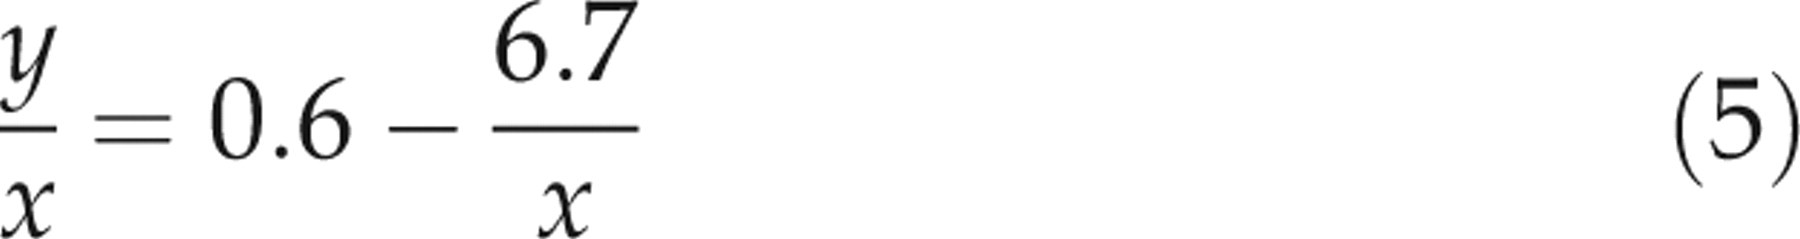
Therefore in the comparison of wild-type and Akt2 knockout mice, where the relationship between weight and the DEXA variable had both a significant intercept and gradient, the calculated ratio decreased significantly between the wild-type and the knockout mice, and a negative Cohen's d value was seen as the dependency on body weight had not been removed. There were two exceptions to this. Firstly, the ratio correction approach on the fat mass variable gave a positive Cohen's d, indicating the calculated ratio increased from the wild-type to the knockout mice. This was explained by looking in more detail at the linear relationship between fat mass and body weight in the Akt2 data-set (Equation 4). Since the intercept element (−6.7) was negative, and the body weight was dividing the intercept value, as the body weight increased the amount being subtracted decreased, and hence the calculated ratio increased (Equation 5). The key component in this instance was the negative intercept, which gave rise to the positive Cohen's d value that was observed.
The second exception was that fat percentage estimate was not significant after applying the ratio correction approach, but was significant when comparing wild-type and knockout raw, unadjusted data (Table 1), indicating that the effect of the confounding variable had been removed by the ratio correction approach. This was explained by looking in more detail at the linear relationship between fat percentage estimate and body weight in the Akt2 data-set (Equation 6).

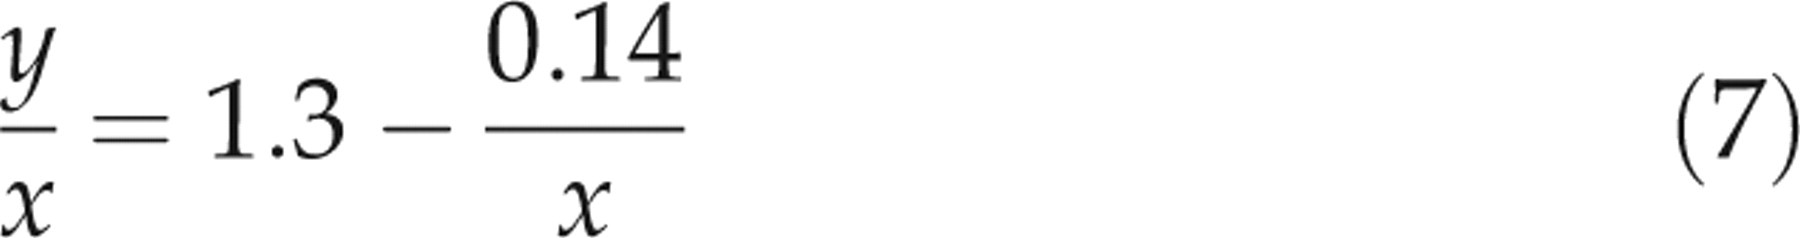
For this variable, the dominant component in the relationship was the gradient (1.3), while the intercept component, which gave a dependency on body weight even following the normalization step, was not a statistically significant component of the relationship, contributing <1% of the total signal seen. Therefore, a change in body weight between the wild-type and knockout mice did not have a statistically significant impact on the ratio, and thus the ratio correction approach, as per Equation 2, removed the dependency on body weight. The key component in this instance was the negligible intercept value (−0.14).
A basic assumption of the ratio correction approach is that a linear relationship through the origin exists between the variable of interest and the confounding variable. The Akt2 data clearly provide an example where the ratio correction approach can generate misleading results when this assumption is not met.
Are the results from the ANCOVA approach robust?
ANCOVA uses regression analysis to adjust for the confounding variable by first estimating the linear relationship between the confounding variable and the variable of interest, and then testing whether the adjusted group means vary significantly from each other. The ANCOVA assumes homogeneity of variance, normality, independent sampling of the measurements and a linear relationship between the confounding variable and the variable of interest. This is similar to the ratio correction approach, except that these assumptions apply to the raw data and the linear relationship can have both a significant intercept and gradient. The ANCOVA has two additional assumptions that are not required for the ratio correction approach. These are homogeneity of regression slope, and independence of the confounding variable and the treatment.
The linearity and homogeneity of regression slope assumptions were assessed together as follows. Scatter plots of the data (Supplementary Figure S1) supported the assumption that, for wild-type mice, a linear relationship existed between body weight and the DEXA variables. This assumption was tested for the Akt2 data-set by visually plotting the data (Supplementary Table S3; available online only at Testing the assumption of homogeneity of variance. An example scatter plot, from Akt2tm1Wcs
homozygous mice versus control study, of the confounding variable (body weight) against the DEXA variable of interest (lean mass) which has a regression line fitted for each treatment group (control shown with triangles versus knockout shown with circles) visually suggests that the regression line is equivalent between the two groups. An ANCOVA which included an interaction term calculated a P value for this effect of 0.702, meaning this term would not be considered a significant component of the data and that the slopes are equivalent between the two groups. The ANCOVA calculated a P value for the body weight as a confounding factor as P < 0.000 which indicates it is a highly significant component of the analysis. DEXA: dual-energy X-ray absorptiometry; ANCOVA: analysis of covariance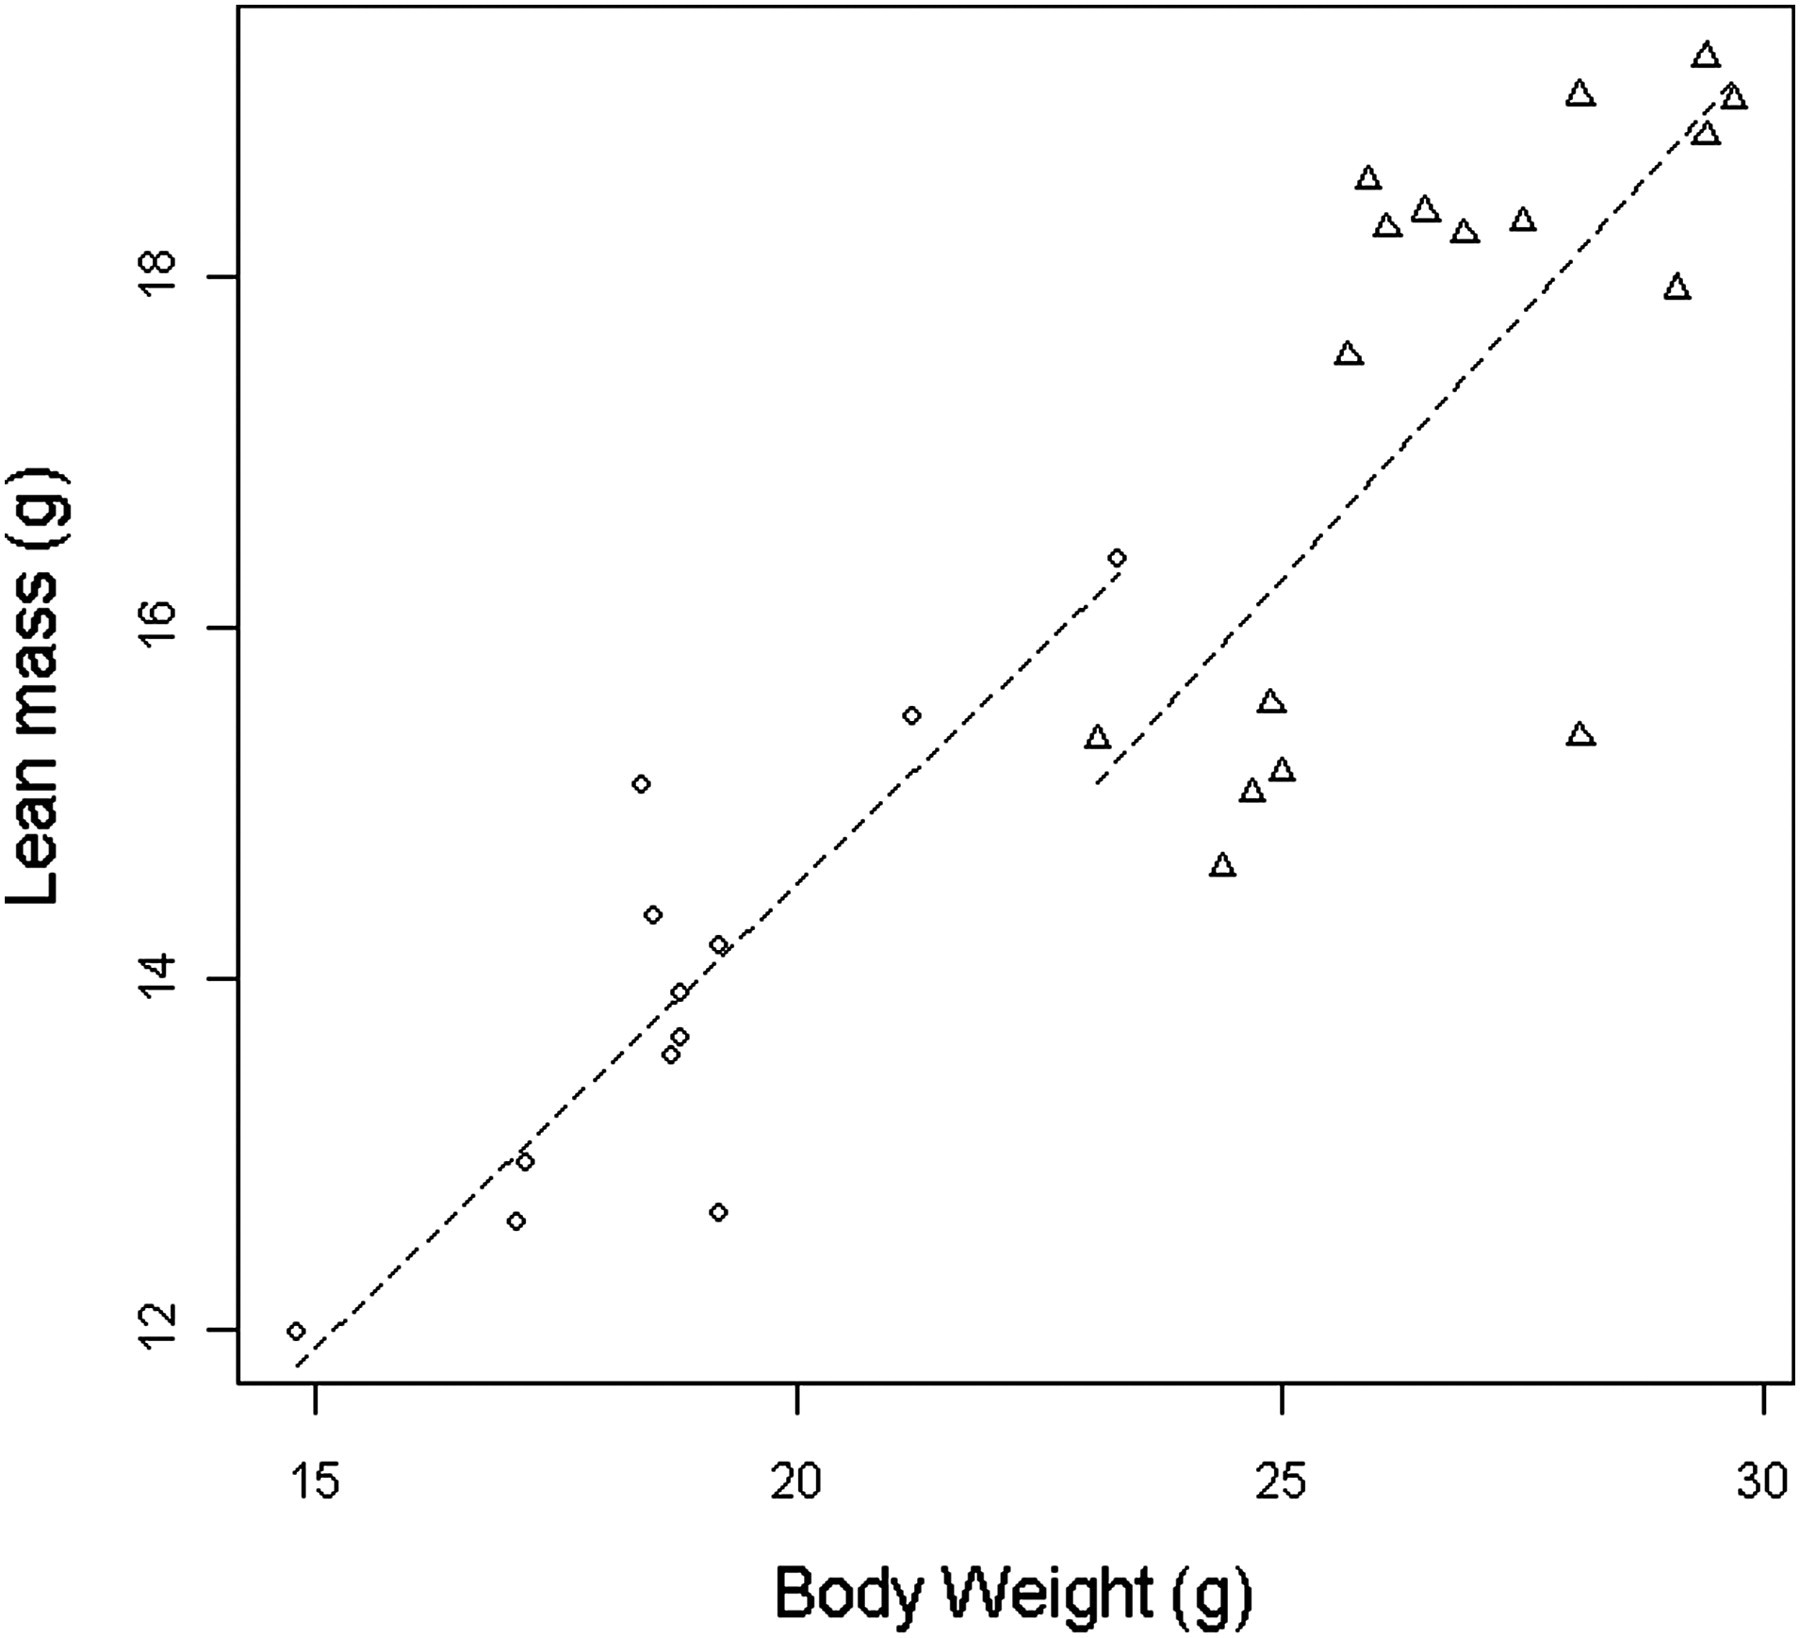
The linear relationship underpinning the ANCOVA, includes an intercept element that is not plausible biologically. For example, in our scenario a mouse of zero body weight is not going to have minimum body composition. The poorly fitting regression at low signal arises as many morphological and physiological variables are scaled relative to the body size, according to a power equation; see Equation 8 for general form. This is described as allometric scaling.
27
The power equation can be converted to a linear form by a log transformation of Y and X (Equation 9). In a situation of allometric scaling, where Equation 8 represents the relationship, an ANCOVA will be more precise when the dependent variable and body weight variable are logged; as the underpinning relationship would have been modelling more accurately.
28
This approach has a number of assumptions. Firstly, that animals are geometrically similar and secondly that Equation 9 defines the relationship. As the regression assumption was met in this analysis over the dynamic range the body weight varied, an allometric approach was not applied.


The second ANCOVA specific assumption, that the confounding variable and treatment effects are independent, can be met provided that the experimental conditions do not affect distribution of the confounding scores, and that the confounding variable does not influence the nature of the experimental condition. This assumption is frequently violated in instances where ANCOVA is used specifically to ‘equate’ groups that differ on a confounding variable rather than the more common use of reducing the variance. In the present study, this assumption was clearly violated as shown by a statistically significant difference between the knockout and control mice for body weight, the confounding variable concerned (Table 1). Trying to remove the effect of a confounding variable is risky, because in the process you may remove part of the treatment effect. 19,26,29 Wright 1 argued that ANCOVA does have a role in situations where a confounding variable varies with the treatment but highlights the need to be clear about which research question is being asked and which assumptions are being made. Mathematically, the ANCOVA is assuming a common regression line and when groups are distinct this line is being extrapolated from one group to the other. Therefore, there is a risk that the line fitted is one that removes the treatment effect rather than the underlying concerning correlation between the two variables. This effect, unlike the issues with the ratio normalization, is a conservative effect as it leads to false-negatives rather than false-positives. To examine the risk that the regression slope being fitted within the ANCOVA is removing more than the confounding relationship, visual inspection of the data is therefore essential to ensure that the overall linear fit would be appropriate for each group independently, and only then is it valid to ignore this assumption and complete the analysis cautiously. This was completed for the Akt2 data-set by examining the scatter plots (Figure 3 and Supplementary Table S3) which confirmed that a linear relationship existed between the confounding and measured variable that was not dependent on the genotype. The ANCOVA, therefore, was robust to the violation of the assumption that the treatment and confounding effects were independent.
As the ANCOVA-specific assumptions were met for the Akt2 data-set, the next step was to assess the more general assumptions of independence, normality and homogeneity of variance. The assumption of independent sampling was met as the experiment was designed such that one reading was taken from one mouse and we know of no significant reasons to expect clusters in the data. The final assumptions of homogeneity of variance and normality were assessed using graphical tools to inspect the distribution of standardized residuals. Standardized residuals are the difference between observed and expected values from the fitted ANCOVA after they have been standardized for the variability in the data (Figure 4 and Supplementary Table S5; available online only at Representative standardized residuals scatter plot for the Akt2tm1Wcs
homozygous mice versus control data-set. In this example, the standardized residuals for the lean mass variable were plotted against body weight. Data from knockout mice are shown with a triangle and controls with a circle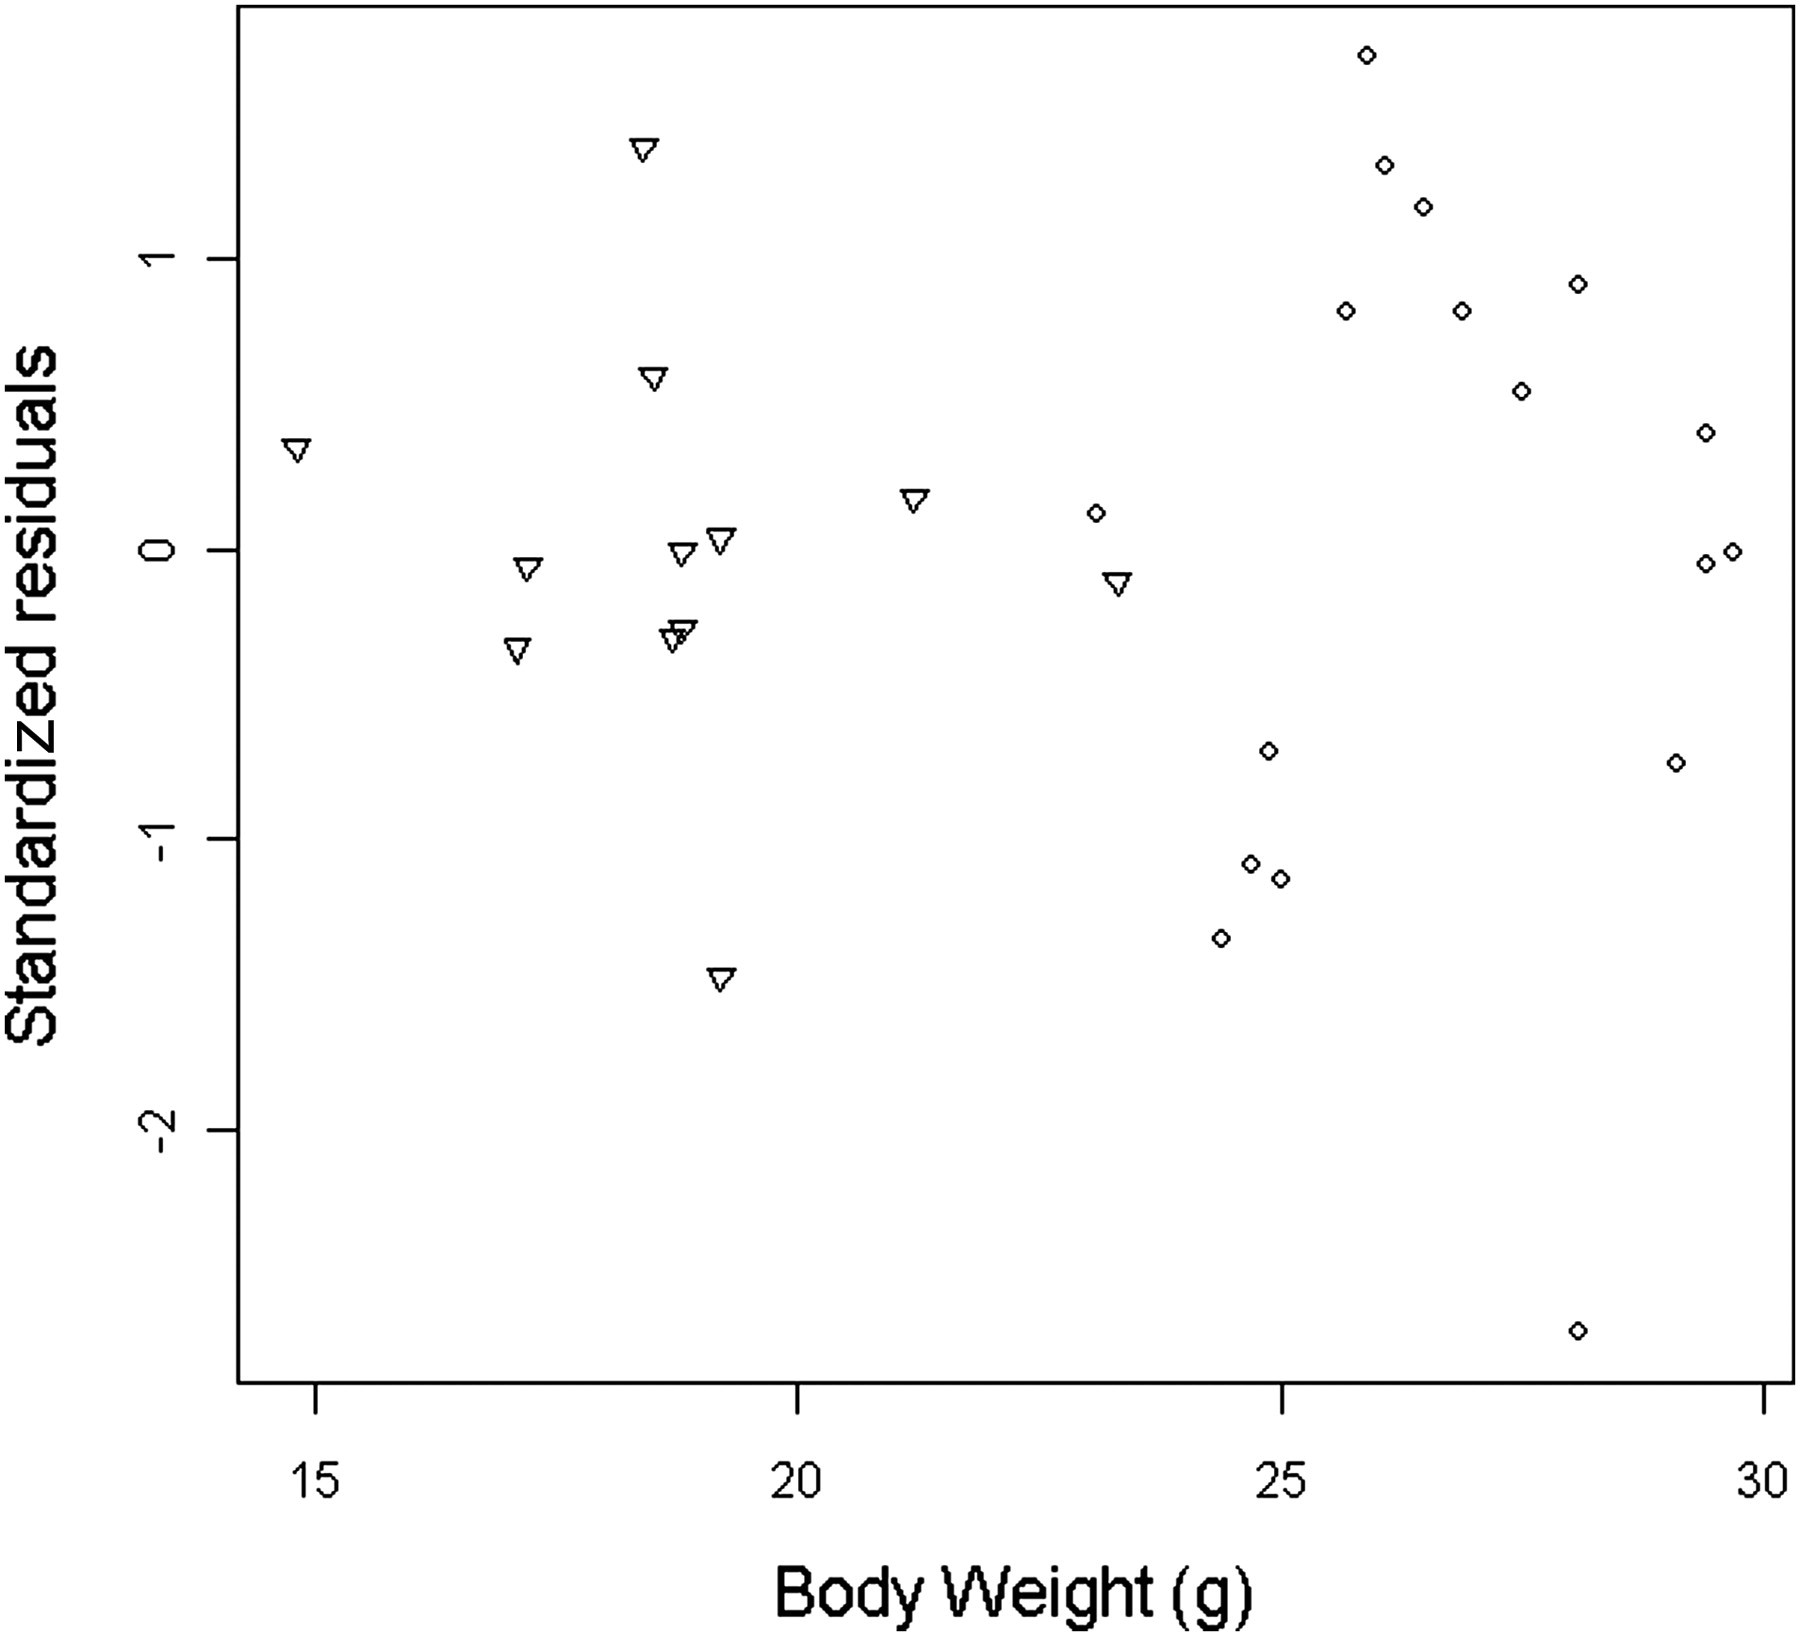
Conclusions
The presence of confounding variables can lead to an association that, while true, is potentially misleading. This is commonly seen during phenotypic characterization of genetically-altered lines of mice, such as knockouts, where multiple abnormalities can be detected and the experimenter will want to assess whether there is a significant difference once the relationship with the confounding variable was accounted for. The ratio correction approach, often referred to as normalization, is a highly risky approach that is commonly used. The problem with this approach is that the underlying assumptions become hidden and, when these assumptions are not met, the outcome lacks meaning and can lead to inappropriate biological conclusions. This was seen in the Akt2 knockout data-set where the ratio correction approach suggested that, after adjusting for weight, an increase in some of the DEXA variables was biologically significant, thus leading to the conclusion that the knockout had a direct impact on the body composition along with a change in body weight. By contrast, ANCOVA suggested that the changes in the DEXA variables were all associated with the change in body weight seen in this knockout line.
Kilkenny et al. 30 in a review of animal studies, found that testing the assumptions of the analysis methods used was rarely completed. The authors argued that it was a requirement for robust biological findings and consequently the ARRIVE guidelines include this as a required component for publication to ensure compliance with the 3Rs. 22 This manuscript demonstrates how assumption testing is essential to ensure an analysis method is robust and therefore the results reliable. In this case, both ANCOVA and ratio correction assume a linear relationship between the confounding variable and variable of interest. However, the ratio correction method commonly fails because it assumes a linear relationship through the origin. So while the ratio correction method is simplistic to apply, the outcome can be misleading and, in our opinion, this methodology should not be used. Instead, ANCOVA with assumption testing is the process by which researchers should be assessing this type of data. The sample size frequently used in animal experiments is often low and can reduce the power of ANCOVA; however, this is also an issue for any other statistical approach and hence this is not an argument against using the ANCOVA. As a first step, the researcher needs to test the basic premise, i.e. assess whether a linear relationship actually exists between the confounding variable and the variable of interest. An example of this was raised by Yin et al. 4 who discussed that body weight was thought to be a confounding variable for heart weight, as biologically larger animals would be expected to have large hearts. However, frequently no linear relationship could be seen between body weight and heart size, and instead they proposed tibia length as a more appropriate confounding variable. ANCOVA at times is not an ideal method as it assumes a single linear relationship exists and in situations where the groups are quite different, as in this phenotyping example, there are risks with this assumption and the accuracy of this calculation. However, as this effect is conservative and no other technique is available, we support the use of ANCOVA to address confounding factors within data-sets. Unlike ratio correction, ANCOVA relies on the use of statistical packages. InVivoStat, a free-to-use R-based statistical software package (www.invivostat.co.uk) aimed at animal researchers includes ANCOVA as a tool 31 and automatically generates the diagnostic plots along with text explaining what the user should look for and how the assumptions can be assessed.
Footnotes
ACKNOWLEDGEMENTS
We thank staff from the Sanger Institute's Research Support Facility, Mouse Genetics Project and Mouse Informatics Group for their excellent support. This work was funded by the Wellcome Trust (grant number: WT077157/Z/05/Z).
References
Supplementary Material
Please find the following supplemental material available below.
For Open Access articles published under a Creative Commons License, all supplemental material carries the same license as the article it is associated with.
For non-Open Access articles published, all supplemental material carries a non-exclusive license, and permission requests for re-use of supplemental material or any part of supplemental material shall be sent directly to the copyright owner as specified in the copyright notice associated with the article.