
Abstract
It has previously been shown that high-calorie diet alters the function of the mammalian circadian clock and that obesity has an influence on circadian organization of hormone secretion. That prompted us to test whether inbred Wistar Ottawa Karlsburg W (RT1u) (WOKW) rats developing facets of the metabolic syndrome show changes in their metabolic profiles under different feeding conditions (high-fat, high-sugar versus control diet) and under two different 12 h:12 h light–dark (LD) cycles. At the age of four weeks, these rats were divided into four groups. Groups 1 and 2 were kept under initial LD cycle (lights on at 05:00 h). Group 1 was fed with a normal rat diet while group 2 received a high-fat, high-sugar diet from 10 up to the age of 21 weeks. Groups 3 and 4 were kept under a shifted LD cycle (lights on at 11:00 h). Group 3 was given a normal diet while group 4 received a high-fat, high-sugar diet from an age like groups 1 and 2. Several metabolic traits were studied during the observation period of 21 weeks. The blood samples were obtained 2 h before lights off. Body weight gain (P < 0.001), leptin (P < 0.001), triglycerides (P < 0.001) and cholesterol (P < 0.05) were significantly reduced in group 4 versus group 2, but comparable between control groups (1 versus 3). The insulin concentrations were reduced in groups 3 and 4 versus groups 1 and 2 without effect of diet. In conclusion, the results provide evidence that light conditions influence diet induced changes in phenotypic traits like body weight gain, lipids as well as hormone levels (insulin and leptin) in WOKW rats.
So-called endogenous clocks regulate all important mechanisms in metabolism, endocrine and immune systems. In animals and humans, circadian rhythms are characterized by an accurate 24 h rhythm involved in the optimal adaptation of metabolism under the daily changes of the environmental conditions. Circadian rhythms are affected by external stimuli such as sunlight and meal times. In addition, circadian rhythms are genetically determined so that specific metabolic processes execute in the body at a definite time period. When food is plentiful, circadian rhythms of animals are powerfully entrained by light–dark (LD) cycles.1–3 However, if animals have access to food only during their normal sleep cycle, they will synchronize their circadian rhythm to match the food availability. The perturbations of the endogenous clock system and sleep are risk factors for disorders including obesity, diabetes mellitus, cardiovascular disease, thrombosis and even inflammation. 1 For instance, reduced sleep duration in children is associated with an increased risk of being overweight.4–6 Additional studies showed that the consumption of a high-calorie diet altered the function of the mammalian circadian clock and that obesity has an effect on circadian organization of hormone secretion.7,8
As aforementioned circadian rhythms are affected by light and diet. Under two various LD cycles from 4 to 21 weeks, the end of the observation period. WOKW rats were fed with a normal or high-fat, high-sugar diet from 10 to 21 weeks of age. WOKW rats develop a nearly complete metabolic syndrome closely resembling the human disease with obesity, hyperinsulinaemia and insulin resistance of adipose tissue, hyperleptinaemia, dyslipidaemia and impaired glucose tolerance.9–13 The first changes of metabolic facets of WOKW rats were observed between eight and 10 weeks and increasing with age in WOKW rats.10,12 In order to avoid fasting before treatment as stress factor, 14 blood samples were taken 1–2 h before the dark active phase of rats so that nearly fasting values can be assumed. Therefore, rats were subjected to a single 6 h advance of the LD cycle (lights on at 11:00 instead of 05:00 h). In our study we compared the body weight and serum parameters between two different LD cycles (before the active dark phase with a single 6 h advance of the light cycle). The aim of our study was to investigate whether changed LD cycle affects the metabolic profile of the WOKW rats under a normal or high-fat, high-sugar diet.
Animals, materials and methods
Animals and procedure
All rats were barrier-bred in our own animal facility. The barrier was free of the pathogens listed in the FELASA recommendations for the health monitoring of rodent and rabbit colonies in breeding and experimental units (Appendix 3). 15 All animals had free access to food and acidulated water. All experiments were performed in accordance with the regulations for animal care of the Ministry of Nutrition, Agriculture and Forestry of the Government of Mecklenburg-Vorpommern (Germany).
Male WOKW rats (F98) were bred and kept under a 12 h light:12 h dark cycle (05:00–17:00 h) and were divided into four groups at the age of four weeks. Groups 1 and 2 were kept under the normal LD cycle as before (05:00–17:00 h). Group 1 (n = 11) was fed with a normal rat diet (Ssniff R, Soest, Germany, 21% protein, 39% carbohydrates, 3.8% fat), while group 2 (n = 10) received a high-fat, high-sugar diet (Ssniff R; 18% protein, 30% carbohydrates, 52% fat) from 10 to 21 weeks of life, the end of the study. Groups 3 and 4 were subjected to a single 6 h phase advance of the LD cycle (lights on at 11:00 h). Group 3 (n = 11) was fed with a normal rat diet like group 1, while group 4 (n = 10) received a high-fat, high-sugar diet from 10 to 21 weeks like group 2. The animals were housed in groups of two in Makrolon cages type 3 with raised cover (Ehret, Emmendingen, Germany). Ambient temperature and relative humidity were at 22 ± 2°C and 60 ± 5%, respectively. Cage change was undertaken twice a week. The schedule of experimental conditions is shown in Figure 1 (LD cycles) and Figure 2 (changed time of the light and diet).
Schedule of lighting conditions (black bar = dark phase, white bar = light phase) starting at the age of four weeks. Body weight measurement and blood sampling 2 h before the dark phase are indicated by ↓
Determination of traits
Body weight was determined weekly from the third to 21st weeks of life. Blood for determination of serum parameters was collected by puncture of the retroorbital vein plexus 2 h before the dark rhythm started so that nearly fasting values can be assumed (collection between 15:00 and 17:00 h in groups 1 and 2 and between 09:00 and 11:00 h in groups 3 and 4). Blood collection was undertaken under anaesthesia (Sevoflurane, Abbott, Wiesbaden, Germany). All rats were killed with an overdose of anaesthesia (Sevoflurane, Abbott). Thereafter, left and right inguinal adipose pads were removed and weighed to calculate the adiposity index (sum of adipose pads/body weight × 100). Serum leptin, insulin, triglycerides and total cholesterol were determined at the age of 21 weeks. Serum leptin was determined using a radioimmunoassay kit (Rat Leptin RIA Kit; Linco Research, St Charles, MO, USA) and insulin was determined using an enzyme-linked immunosorbent assay (ELISA) (Rat Insulin ELISA, Mercodia, Uppsala, Sweden). Serum lipids (triglycerides and cholesterol) were determined with lipid electrophoresis using a SAS-3 Cholesterol Profile Kit according to the manufacturer's instructions (Helena BioSciences Europe, Sunderland, UK). Blood glucose was measured at the age of 21 weeks using the glucose analyser (ESAT 6660-2, Medingen, Germany). For measurement of food intake, 18-week-old rats were individually housed for five days in metabolic cages.
Data analysis
Results are expressed as means±SD. Differences were assessed by one-way analysis of variance corrected by Bonferroni–Holm using the Statistical Package for the Social Sciences (SPSS, Chicago, IL, USA). Differences were considered to be statistically significant at a level of P < 0.05.
Results
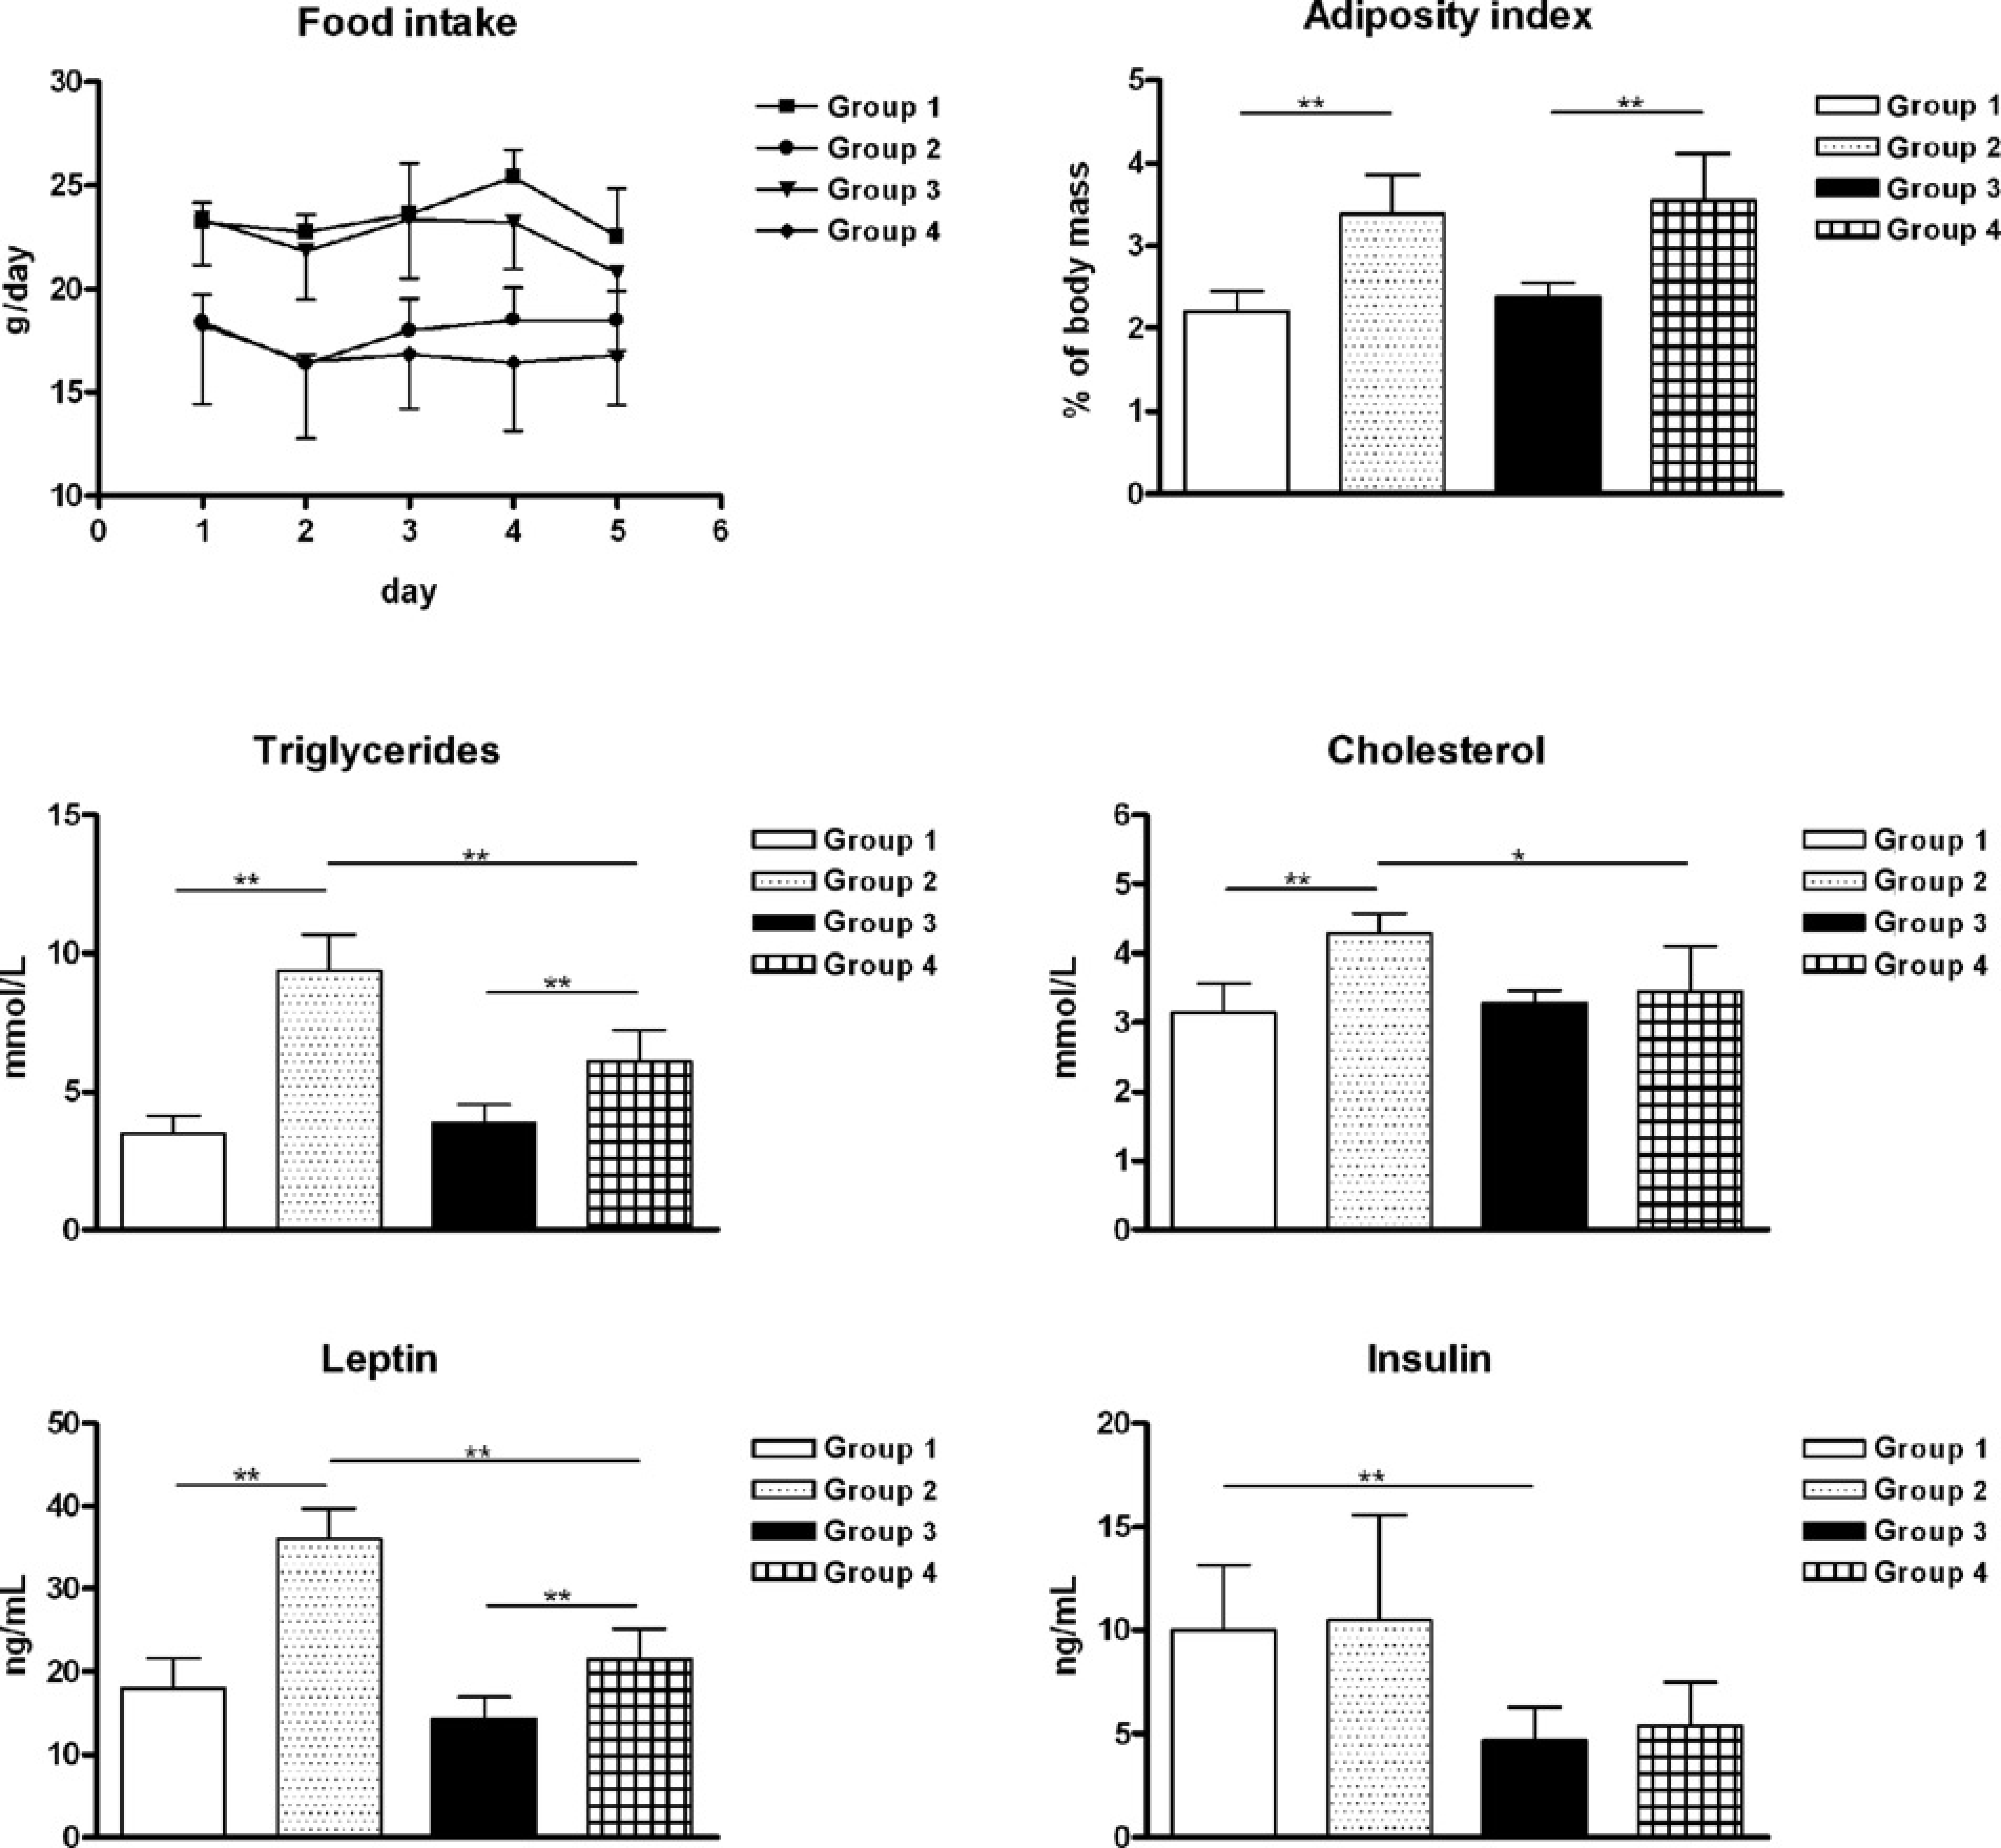
All animals studied were normoglycaemic at the age of 21 weeks. The glucose values changed between 78 and 96 mg%. At the age of 17 weeks, body weight gain was significantly increased in group 2 in comparison to all other groups fed with a high-fat, high-sugar diet and kept under a light cycle: 05:00 h light and 17:00 h. dark (cf. Figure 2; group 1: 447 ± 23 g; group 2: 512 ± 35 g; group 3: 404 ± 28 g; group 4: 450 ± 25 g). The body weight was also significantly increased in group 4 compared with group 3 from 17 to 21 weeks of age. As shown in Figure 3 different results were obtained between groups for adiposity index, trigycerides, cholesterol, leptin and insulin. Food intake was comparable between groups (1 and 3) with normal or groups (2 and 4) with high-fat, high-sugar diets. The adiposity index was significantly higher in groups with a high-fat, high-sugar diet than in their appropriate control groups. Serum triglycerides and leptin showed comparable results: the values were significantly increased in both groups (2 and 4) with a high-fat, high-sugar diet compared with their control groups (1 and 3l). In addition, serum triglycerides and leptin were significantly decreased in group 4 versus group 2 while both control groups (1 and 3) did not show significant differences. Also serum cholesterol indicated similar results except for groups 3 and 4 where no significant differences were found. The insulin concentrations were reduced in groups 3 and 4 versus groups 1 and 2, respectively.
Body weight gain is represented from age 10 to 21 weeks. Values are means±SD. Significant differences between the groups are shown (group 2 versus all other groups **P < 0.001, group 3 versus group 4 * P < 0.01). t1 changed lighting conditions at the age of four weeks, and t2 changed diet at the age of 10 weeks Data of food intake are represented for five consecutive days at the age of 18 weeks. Adiposity index, serum triglycerides, serum total cholesterol, serum leptin, and serum insulin are represented at the age of 21 weeks. Values are means±SD. Significant differences between groups are indicated: * P < 0.05 or ** P<0.001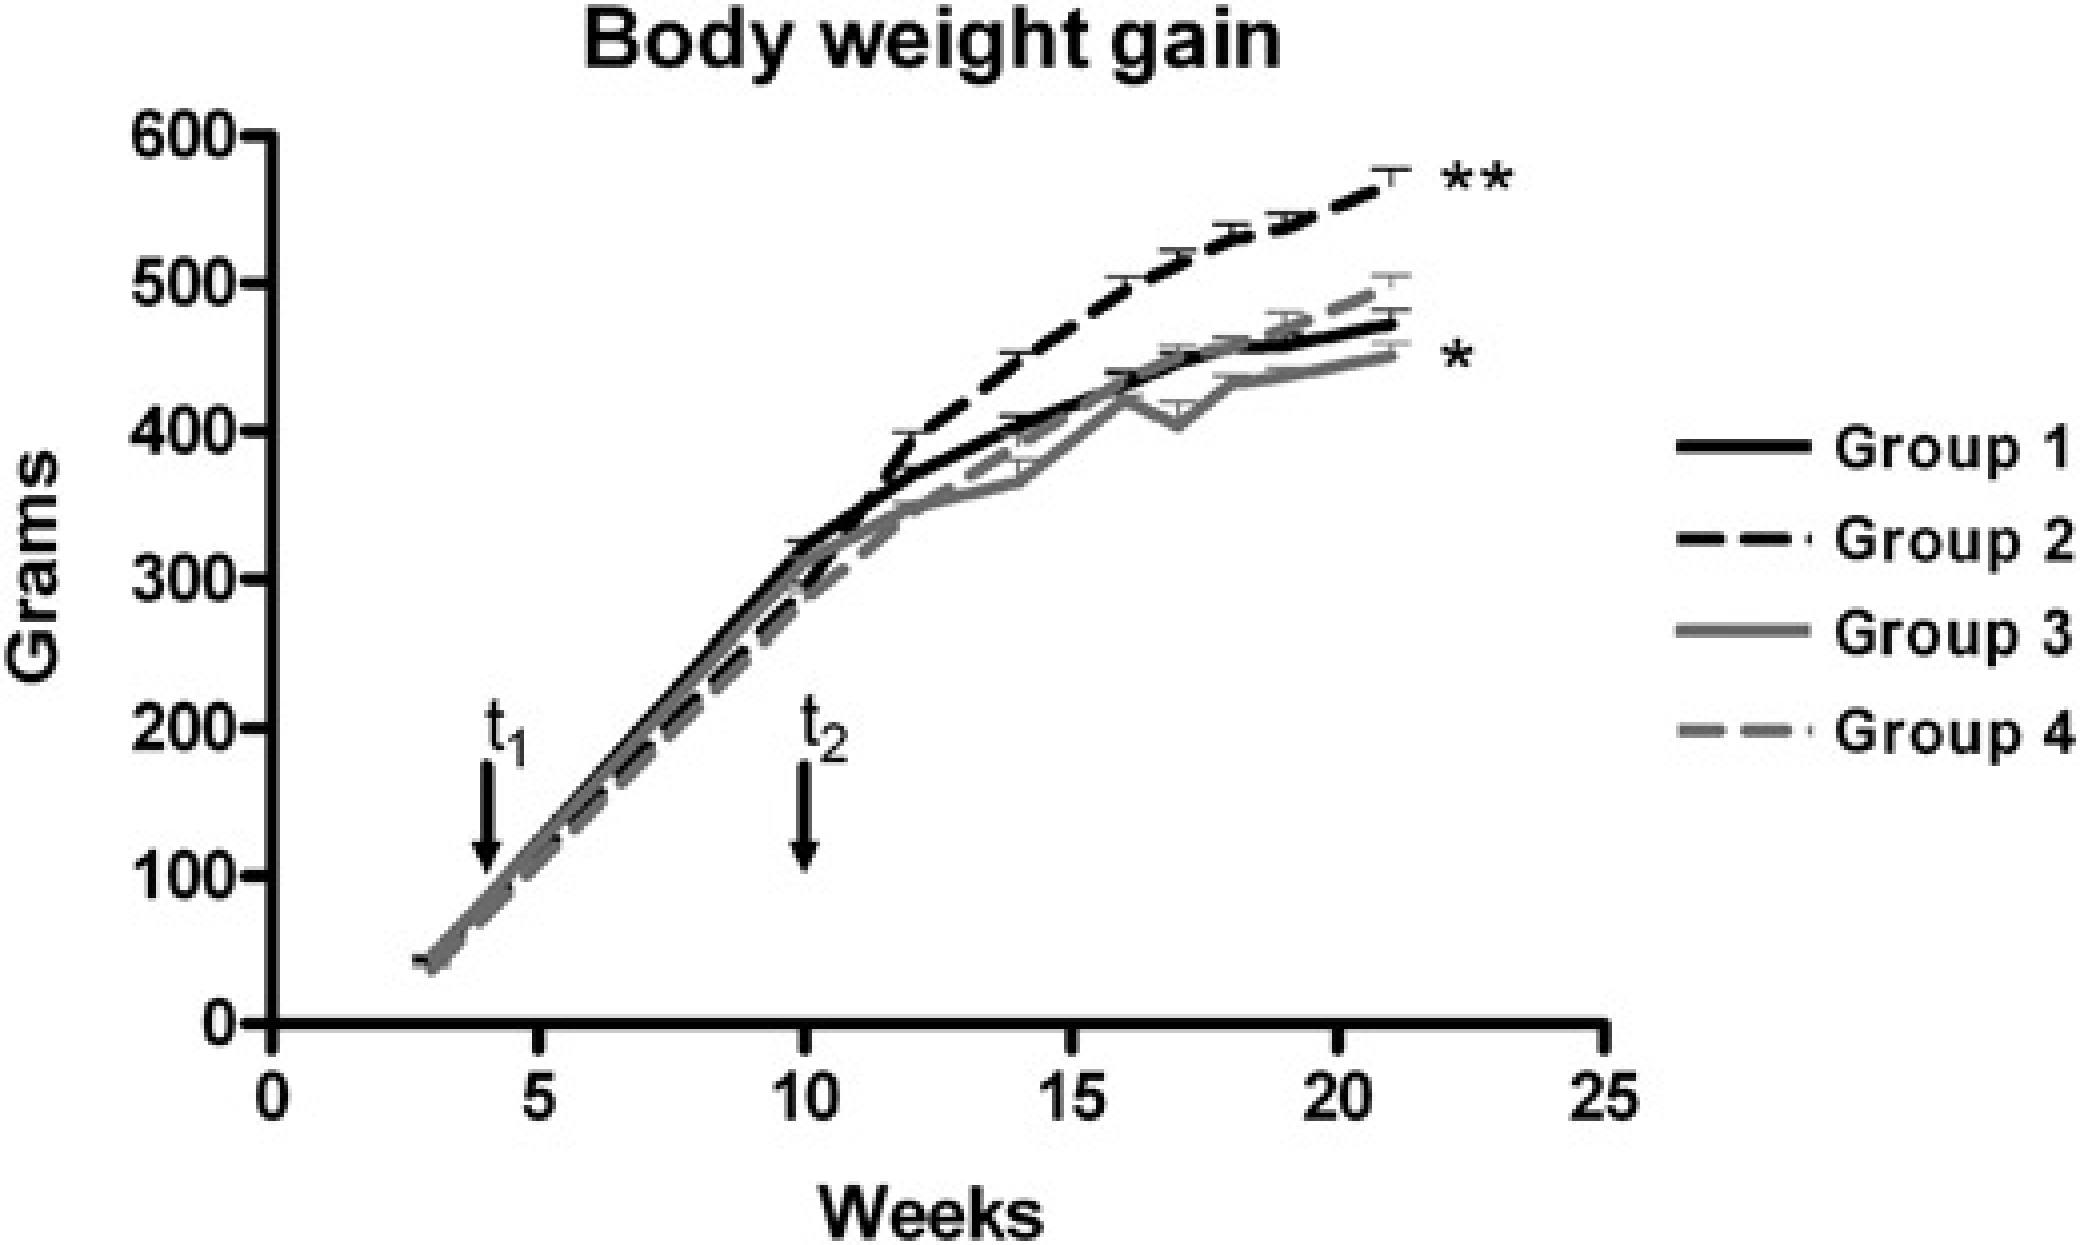
Discussion
In mammals, most physiological traits and behaviour are influenced by the circadian clock including sleep–wake cycles, cardiovascular activity, renal activity, gastrointestinal tract, endocrine system, body temperature and hepatic metabolism.16,17 The main circadian clock is located in the hypothalamic suprachiasmatic nucleus (SCN), which is termed the master pacemaker whereas the other clocks in various peripheral tissues are slave oscillators to this.18,19 Light is the most important environmental factor and the most potent synchronizer for SCN. 20 By contrast, food and feeding regimes affect either peripheral clocks or the central clock in the SCN. 17 Studies showed that when feeding of nocturnal rodents is restricted to the daytime, the phase of rhythm in peripheral clocks (e.g. in the liver and kidney) is specifically shifted, in contrast to SCN rhythm.21,22 Other findings indicated that consumption of a high-calorie diet alters the function of the mammalian circadian clock or that photic regulation of the circadian system can be altered by eating a diet enriched with saturated fatty acids.7,23 Furthermore, there is a causal relationship of chronic circadian desynchronization and changes in body weight control in rats. 24
Regarding the shifted light rhythms the adiposity index and food intake showed no significant differences between control groups with a normal diet and groups with a high-fat, high-sugar diet.
In groups with a high-fat, high-sugar diet, the body weight is significantly decreased in the group with shifted LD versus the group with unshifted LD whereas both groups without normal diet showed comparable body weights. Also parameters involved in fat metabolism, such as triglycerides, cholesterol and leptin showed a decreased effect in the group with shifted LD versus the group with unshifted LD. Different studies suggest that the central circadian clock regulates leptin expression or function.25,26 Leptin differences in our study were noticeable only after being fed a high-fat, high-sugar diet, suggesting that a special diet is able to influence circadian rhythms. A few studies show that a high-fat diet leads to minimal effects on the rhythmic expression of clock genes in visceral adipose tissue and liver.27,28 In addition to the disruption of clock gene expression, high-fat diets induce a phase delay in clock and clock-controlled genes. 29
Insulin is reduced in groups 3 and 4 with shifted LD cycle, compared with groups 1 and 2 with unshifted LD, but in both experimental conditions the insulin values were comparable between normal diets and high-fat, high-sugar diets. That means this behaviour is independent of diet. This fact is supported by findings in rabbits. Lesault et al. 30 found circadian variations of plasma insulin level in 48 h fasted and in fed rabbits. Therefore, insulin level was not solely dependent on food. This observation was confirmed by another study with rats. 31 This phenomenon may be explained by a very stable endogenous insulin rhythm depending on day time. In groups 1 and 2 with unshifted LD or group 3 and 4 with shifted LD, insulin was determined between 15:00 and 17:00 h or 09:00 and 11:00 h. The insulin values are higher in the afternoon than in the late morning. This fact is supported by studies by Bellinger et al. 31 and Yamamoto et al. 32 who previously observed that plasma insulin levels increased at the end of the light period. Therefore, insulin levels should be higher when determined between 15:00 and 17:00 h than between 09:00 and 11:00 h. In addition, insulin per se is strongly time-dependent. Diabetic BB rats developing an insulindependent type 1 diabetes can be treated with insulin at 14:00 or 20:00 h because their glucose profile measured over 24 h is comparable and therefore independent from time of insulin treatment as published some years ago. 33 Over several years BB rats were treated with insulin between 07:00 and 08:00 h and the day profile of blood glucose is comparable with data published (data not shown).
A jet-lagged effect cannot be excluded because it will take more than one week for particular physiological parameters to synchronize to the shifted LD. In a study using male adult Wistar rats, body temperature and locomotor activity needed one week to adapt to a new light rhythm. By contrast, liver glycogen, liver protein and other features needed 4–6 weeks for adaptation. 34 Our LD shift occurs relatively early in life (at 4 weeks of age) suggesting clearly that not all behavioural and physiological parameters readjust within six weeks and may be dependent on age of animals used. Considering insulin, it needs more than 14 weeks.
These findings show that consumption of high-fat, high-sugar diets and changed LD cycles together can influence circadian rhythms of behaviour and physiology. Consequently one might postulate that diet and LD are synchronizers of metabolic profiles in the WOKW rat. It seems that the changed light rhythm influences the metabolic system when it is associated with a high-fat, high-sugar diet. Except insulin, levels of most parameters are not influenced through the shift of light rhythm.
In summary, high-fat, high-sugar diets and altered lighting conditions result in changes of body weight and metabolic parameters such as triglycerides, cholesterol and leptin in the WOKW rats. However, insulin levels are only influenced by light rhythm which may be attributed to a very stable endogenous insulin rhythm. This finding supports the crucial role played by the SCN in homeostasis including endocrine secretion.32,35