
Abstract
The aim of this study was to explore the changes of the Doppler flow spectra of the superior vena cava (SVC) in a rat model of chronic pulmonary hypertension (PH). Thirty-two rats were injected with monocrotaline (MCT) to establish a model of chronic PH. Eight rats from the control group had a sham operation by injecting Dulbecco's phosphate-buffered solution. Serial echocardiographic parameters of the SVC were analysed four weeks after treating with MCT or placebo, and the relationship was analysed between the Doppler flow spectra of SVC and the pulmonary arterial systolic pressure (PASP). PH models were successfully established in 29 rats. The right ventricular systolic pressure, mean pulmonary arterial pressure and PASP in the PH group were significantly higher than those in the sham group at 28 days (P < 0.001). The ratios of SVC maximum reverse peak flow velocity/maximum systolic peak flow velocity (VAr/VS) and maximum reverse peak velocity time integral/maximum systolic peak velocity time integral (VTIAr/VTIS) increased significantly (P < 0.05) after MCT injection. These results demonstrate that echocardiography can be used to monitor the haemodynamic changes in SVC in MCT-induced chronic PH rat models. The ratios of VAr/VS and VTIAr/VTIS may be sensitive indices for evaluating PH.
Pulmonary hypertension (PH) can occur idiopathically, as a component of various disease processes (e.g. chronic thromboembolic disease, connective tissue disease and congenital heart disease) or due to exposure to exogenous factors (e.g. appetite suppressants) and infectious agents (e.g. HIV). 1,2 Early diagnosis of elevated pulmonary arterial systolic pressure (PASP) and the consequent changes of the structure and function of the right ventricle and other related cardiopulmonary changes have become important in avoiding acute right heart failure and death. 3,4
At present, accurate diagnosis of PH depends on right-heart catheterization, which is invasive and difficult to use extensively. 5–7 Echocardiography is non-invasive and provides potentially useful information in evaluating PH. 8,9 Traditional echocardiographic indices, including tricuspid pressure gradient, pulmonary artery Doppler flow spectral shapes and isovolumetric relaxation time of the right ventricle have been commonly used to assess the PASP. 10,11 However, these indices are limited in patients with thoracic deformity, fat or chronic obstructive pulmonary disease and the subjects with incomplete or relatively small tricuspid regurgitation. 12 In consideration of the facts that the pressure changes in the pulmonary artery may transmit to the superior vena cava (SVC) and the haemodynamic changes of the SVC could be easily monitored by echocardiography, we hypothesized that Doppler spectral changes of SVC would help in the evaluation of PH.
Animal models have provided, and will continue to provide, valuable insight into the understanding of the mechanisms and the investigating of new therapeutics in human PH. Although monocrotaline (MCT)-induced PH varies among strain and species of animals, MCT-induced PH in rats is currently one of the classic animal models of PH. 13,14 Although the exact mechanism through which MCT causes PH is not known, it is speculated that it causes direct endothelial damage, which then triggers the irreversible development and progression of PH. 14,15
The aim of this study was thus to establish the MCT-induced chronic PH rat model and to explore the feasibility of using Doppler flow spectra of the SVC to diagnose PH.
Material and methods
Animals
Forty 12-week-old Sprague-Dawley rats (180–220 g) were used in this study which were provided by the Animal Experiment Center of the Fourth Military Medical University. All rats were housed four/cage under a 25 ± 1°C temperature, 50 ± 5% humidity and 12 h light/dark cycle controlled room. The cage is 30 cm (width) × 40 cm (depth) × 20 cm (height). They were fed with a standard laboratory rat chow (made by the Animal Experiment Center of the Fourth Military Medical University, with 60Co radiation for disinfection, ShaanXi Province, China), and had access to autoclaved (121°C, 20 min) water ad libitum. Forty rats were used in the initial study (control: n = 8; treatment: n = 32).
Animal model establishment
All procedures were reviewed and approved by the Animal Ethics Committee of the Fourth Military Medical University of the People's Liberation Army of China (Xi'an, China).
After four days of acclimatization, rats were anaesthetized with pentobarbital sodium (30 mg/kg, interperitoneally). The chests were then shaved. After the initial echocardiographic study (see below), rats were randomly divided into two groups. The control group was injected (intraperitoneally) with 0.25 mL of Dulbecco's phosphate-buffered solution (D-PBS). The treatment group was injected with 60 mg/kg MCT. MCT was prepared at 60 mg/mL by mixing 250 mg of the compound with 6 mL of D-PBS and then adding 0.45 mL of 5 N HCl (to dissolve the compound) and 0.12 mL of 10 N NaOH (to neutralize the pH). 16 Rats were then returned to their cages and given standard rat chow and water ad libitum for the duration of the study. After 28 days, the PASP and the Doppler flow spectra of the SVC were measured. Before the echocardiography and right-heart catheterization were performed, anaesthesia was induced by 3% pentobarbital sodium solution which was infused intraperitoneally as a dosage of 30 mg/kg. The rats' head and limbs were tied to the board of suitable size for restrain.
Echocardiography
Siemens Acuson Sequoia 512 Ultrasound System with a 10V4 transducer was used. Echocardiography of the SVC was carried out on each rat before injection and on day 28 after the treatment with MCT or placebo. The aortic arch was first displayed, and then the transducer was moved up along the supraclavicular fossa. Under the guidance of colour Doppler, bilateral SVCs were demonstrated (Figure 1). The transducer was aligned to optimize endocardial visualization and spectral displays of the Doppler profiles.
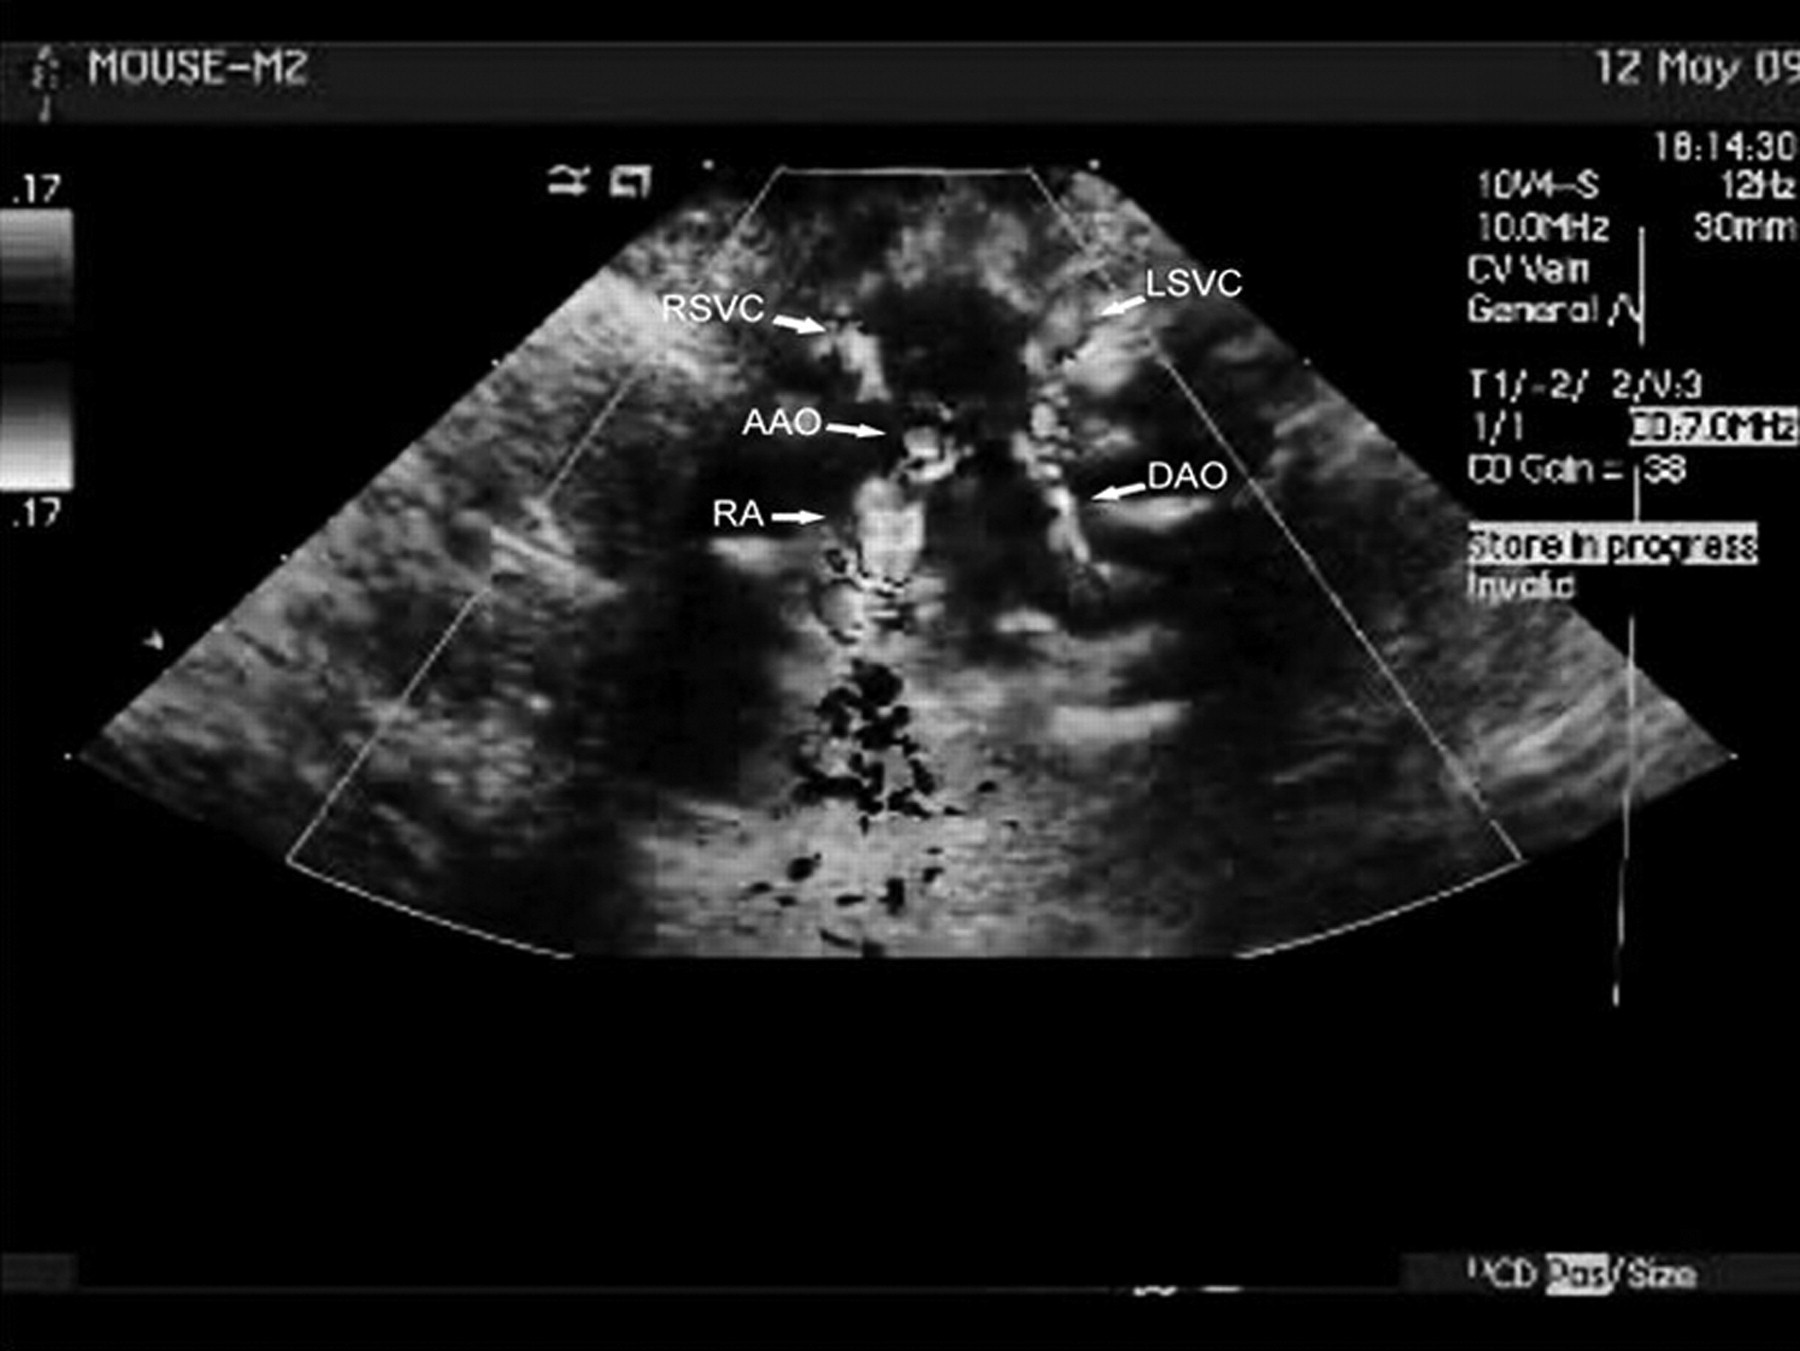
Colour Doppler flow image of the superior vena cava. The figure shows the acoustic contrast image overlaid with the colour Doppler flow image. RA = right atrium; DAO = descending aorta; AAO = ascending aorta; LSVC = left superior vena cava; RSVC = right superior vena cava
A synchronous electrocardiogram was simultaneously recorded. The maximum systolic peak flow velocity (VS), maximum reverse peak flow velocity during atrial contraction (VAr), maximum systolic peak velocity time integral (VTIS) and maximum reverse peak velocity time integral (VTIAr) were derived and averaged for five consecutive cardiac cycles. The Doppler waveforms were recorded at a paper speed of 200 mm/s and stored on the magnetic optic disk for later analysis.
Right-heart catheterization
Right-heart catheterization was carried out in each rat on day 28 to measure the pulmonary arterial pressure after echocardiography. Incisions were made in the right neck of each rat, and dissections were performed to expose the external jugular vein. A home-made 15 cm tube from a SP 2.0-F Mikro-Tip catheter (Terumo Corporation, Tokyo, Japan) filled with heparinized saline and connected to a Grass model 79 polygraph with a Gould-Statham P23ID transducer (Grass Instrument Division, Astro-Med, West Warwick, RI, USA) was inserted into the external jugular vein, SVC, right atrium, right ventricle and pulmonary artery in order. 17 The pressures of the right atrium, right ventricle and pulmonary artery were recorded in turn for later analysis.
Pathological observations
Immediately after the right-heart catheterization, rats were euthanized by an overdose of intraperitoneal pentobarbital sodium. The lungs were removed and sectioned vertically to the pulmonary artery and then prepared for hematoxylin–eosin (H&E) staining. The morphological and distribution characteristics of the pulmonary arteries were then observed under light microscopy.
Statistical analysis
All values were reported as the mean ± standard deviation. The independent samples t-test was used to compare the pulmonary pressure by catheterization between the two groups after MCT injection. Paired samples t-test was used to compare the Doppler flow parameters before and after MCT injection in the PH group. P < 0.05 was considered statistically significant. All statistical comparisons were carried out using SPSS version 13.0 statistical software (SPSS Inc, Chicago, IL, USA).
Results
Animal model establishment
Of 32 PH model rats, one died in an anaesthetic accident, and two died before the endpoint of 28 days after MCT injection, which might be due to the severe pulmonary injury caused by MCT. Twenty-nine PH rat models were established successfully.
Pulmonary arterial and right ventricular pressures
The normal pressure curve of the pulmonary artery demonstrated a dome shape, while the pressure curve in the PH rats showed a distinctive peak. The right ventricular systolic pressure, PASP and the mean pulmonary arterial pressure in the PH group were significantly higher than those in the control group (P < 0.05, Table 1, Figure 2).
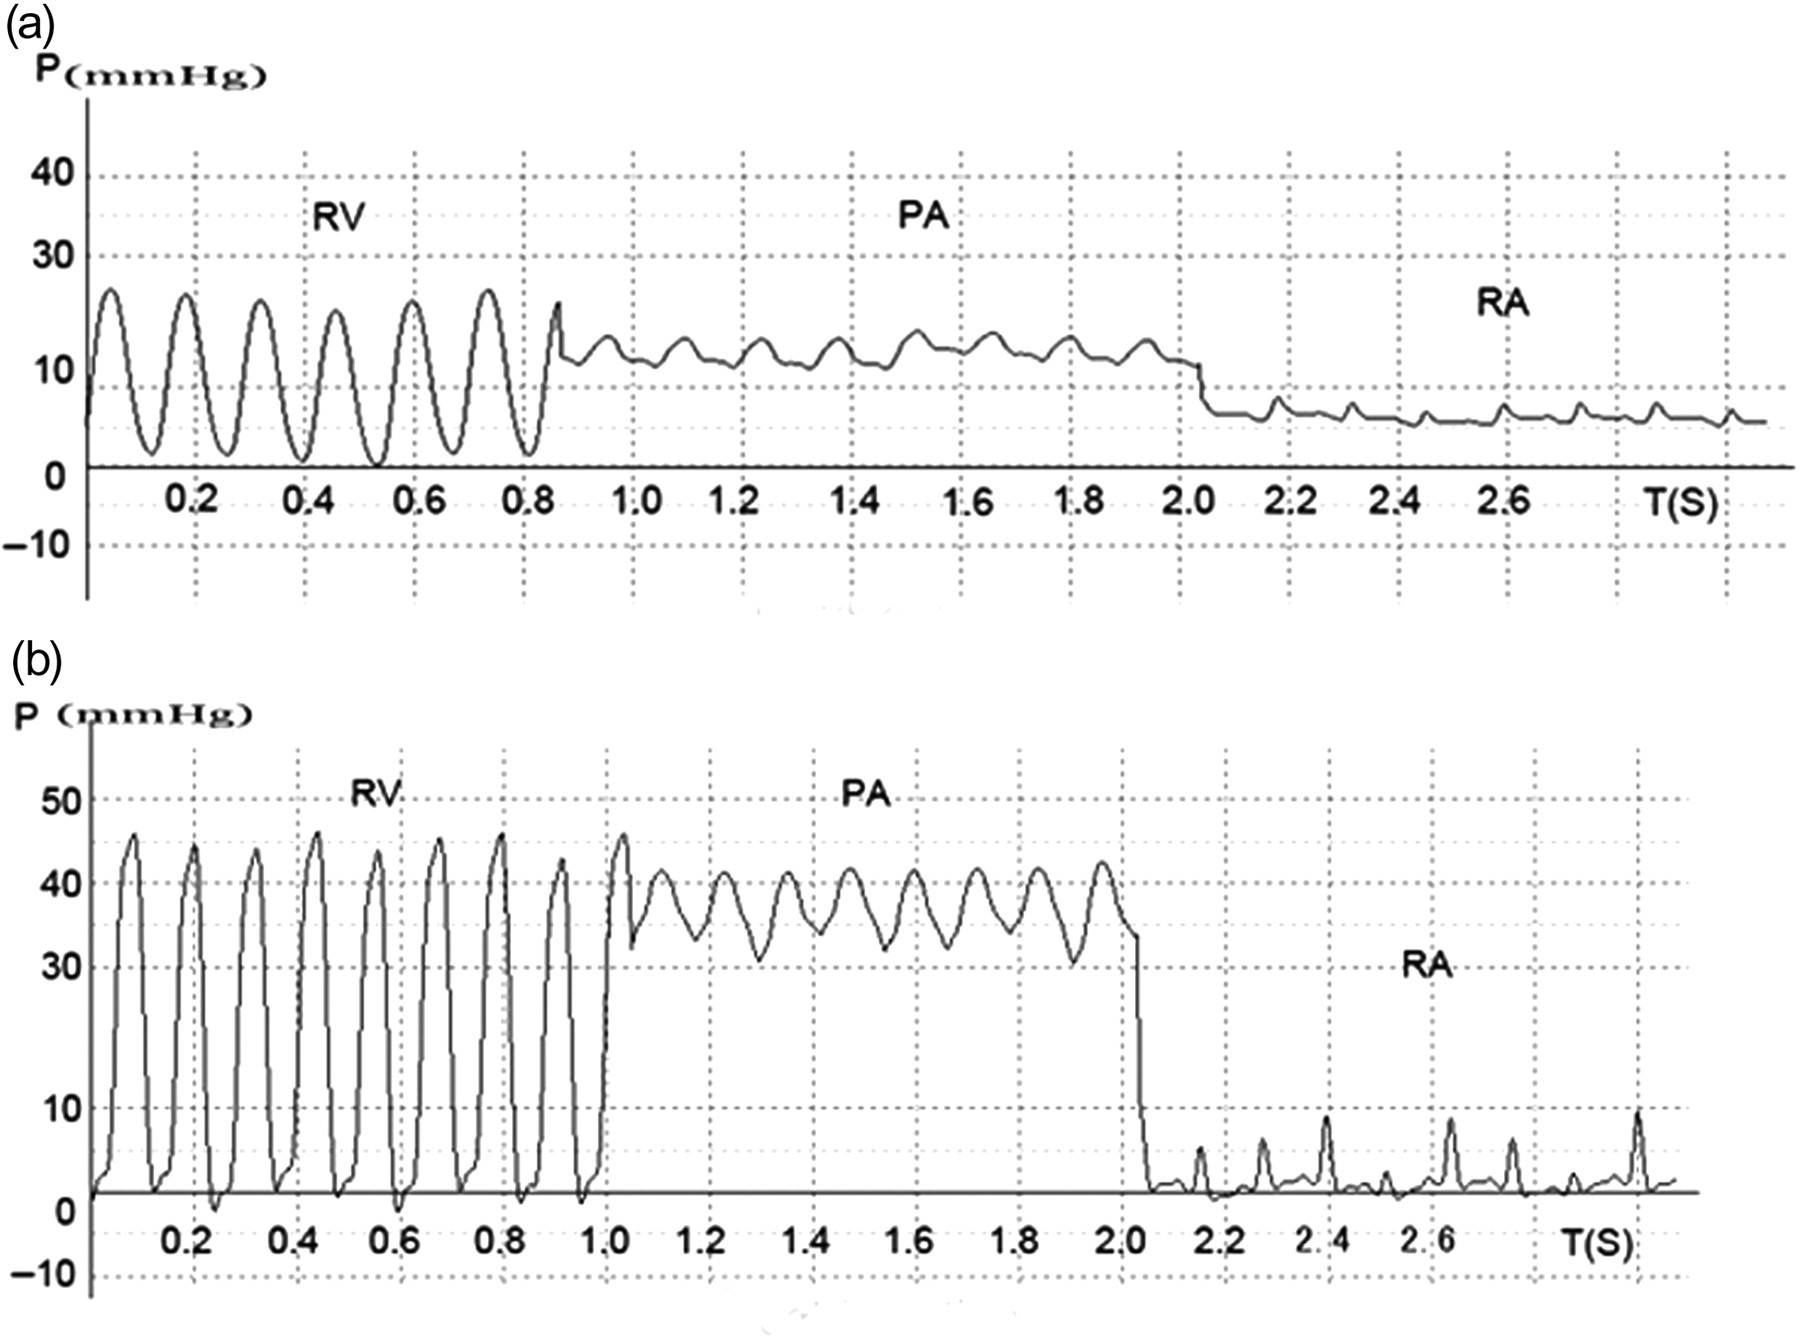
The pressure curve of the right ventricle, pulmonary artery and right atrium in rats before and after monocrotaline (MCT) administration. (a) The pressure curve before injecting MCT. (b) The pressure curve 28 days after injecting MCT. P = pressure; T = time; RV = right ventricle; PA = pulmonary artery; RA = right atrium
Changes in the pressures of the right heart chambers and the main pulmonary artery in rats 28 days after injection (mean ± SD, mmHg)
Probability values were obtained by the independent-samples t-test. PH = pulmonary hypertension; RASP = right atrial systolic pressure; RVSP = right ventricular systolic pressure; PASP = pulmonary arterial systolic pressure; MPAP = mean pulmonary arterial pressure
Doppler spectra changes of the SVCs in rat models
The characteristics of the SVC Doppler flow velocity spectra before and after MCT injection are shown in Figure 3. VAr and the ratios of VAr/VS and VTIAr/VTIS increased significantly in bilateral SVCs (P < 0.05) after injecting with MCT, while the VTIAr showed no significant differences between the two groups. The VS and VTIS of the PH group were decreased compared with those before MCT injection in the right SVC (P < 0.05) but not in the left SVC (Table 2).
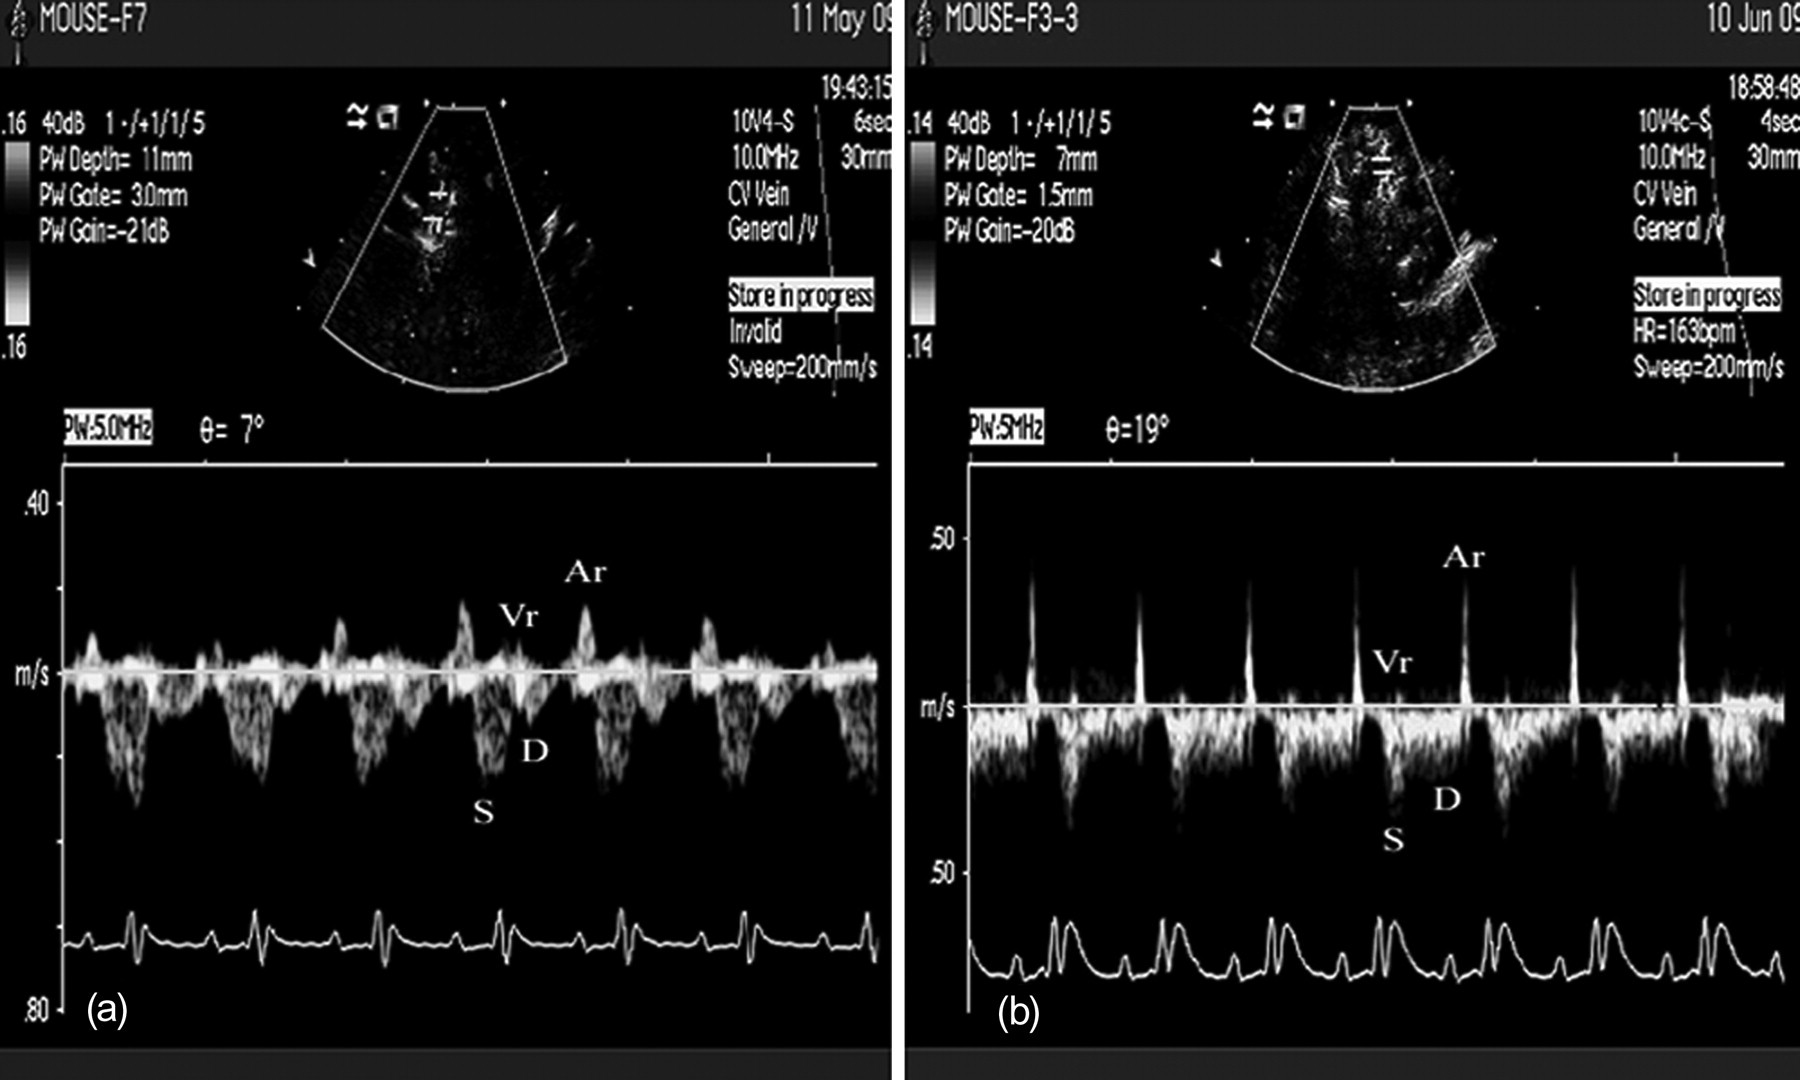
Superior vena cava Doppler velocities, including S, Vr, D, and Ar waves. (a) Before monocrotaline (MCT) administration, the pulmonary arterial systolic pressure (PASP) is 21.83 mmHg. (b) After MCT administration, the PASP increased to 36.17 mmHg. S = systolic waves; D = diastolic wave; Vr = ventricle reversed flow wave; Ar = atrial reversed flow wave
Changes in the superior vena cava Doppler flow spectral parameters in rat models before and 28 days after injection (mean ± SD)
Probability values were obtained by the paired-samples t-test. RSVC = right superior vena cava; LSVC = left superior vena cava; VS = maximum systolic peak flow velocity; VAr = maximum reverse peak flow velocity; VTIS = maximum systolic peak velocity time integral; VTIAr = maximum reverse peak velocity time integral
Pathological observations
In the PH group, H&E staining of the lungs of rats showed that the vascular endothelial and smooth muscle cell proliferated. The diameter of lumens of peripheral pulmonary artery was narrow due to the pulmonary vascular neointimal formation. Light microscopy revealed that the cell population of the vessel wall had increased (Figure 4).
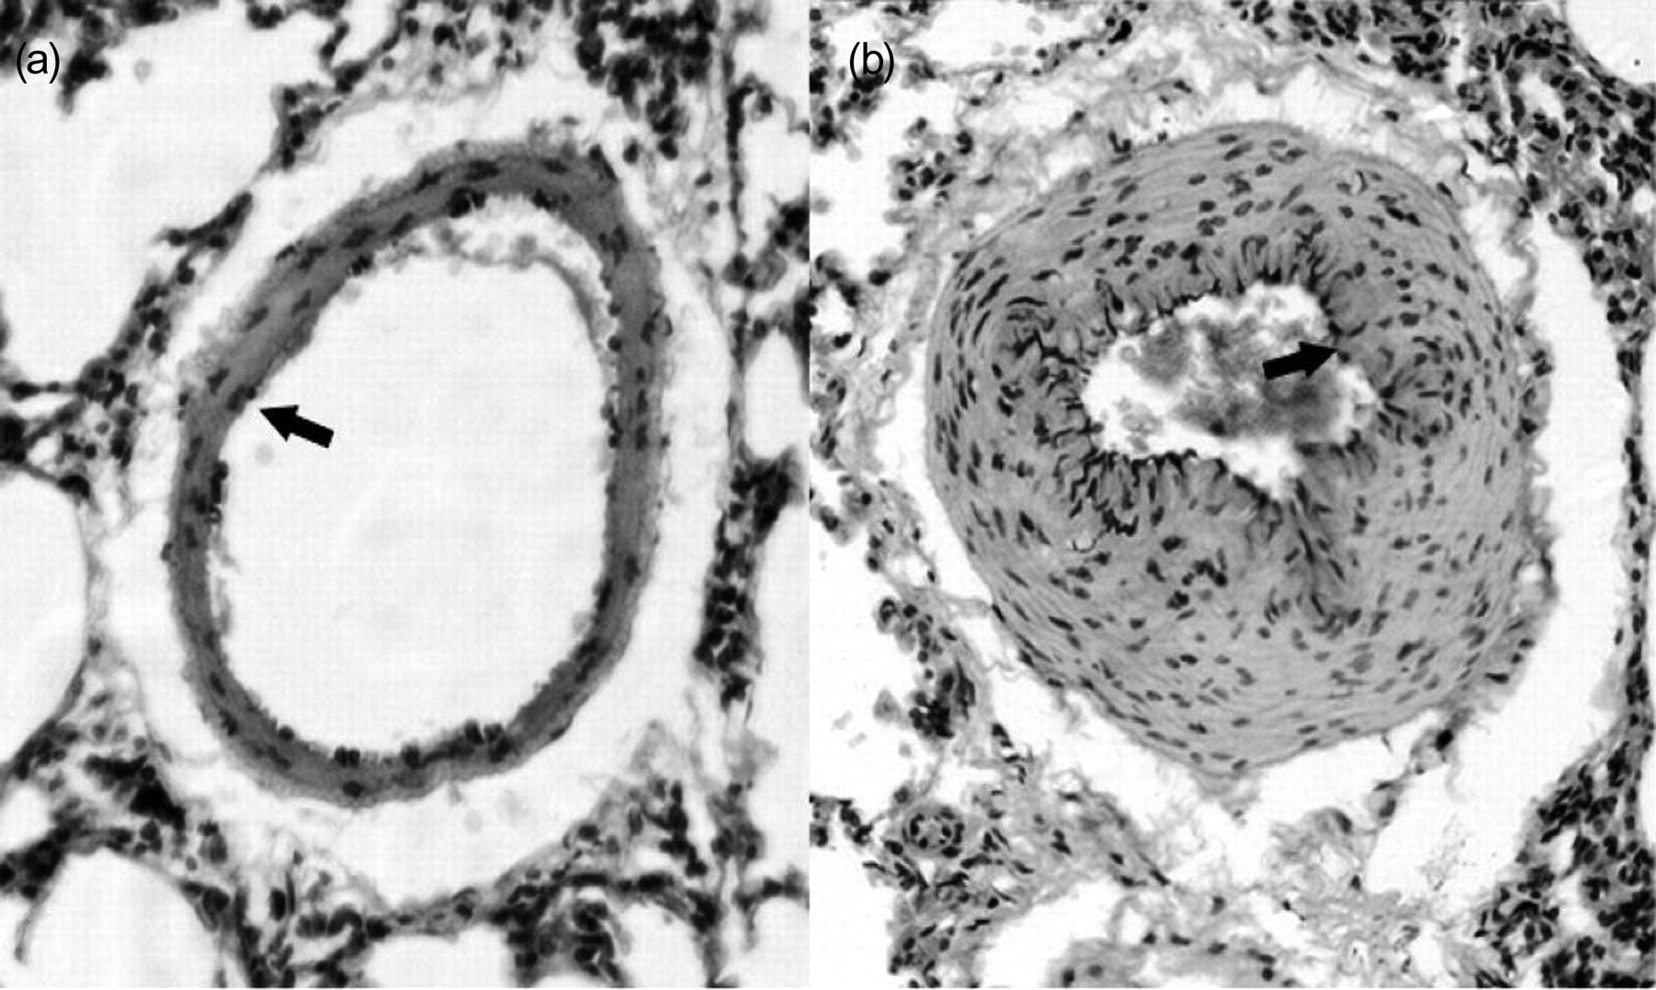
H&E-stained histological section of pulmonary tissue shows hyperplasic cells in the vessel wall (indicated by black arrow, ×100). H&E = haematoxylin and eosin staining. (a) Pathological results before monocrotaline (MCT) administration. (b) Pathological results on the 28th day after MCT administration
Discussion
The present study showed that the ratios of VAr/VS and VTIAr/VTIS were significantly increased in PH rats, indicating SVC Doppler spectral parameters may be used to evaluate the PASP. These results were similar to our previous studies in rabbit acute thromoembolic PH. 18
On SVC Doppler echocardiography, there are usually two distinct forward systolic and diastolic velocities (S and D), due to ventricular systole and early diastole, and two small reverse flow velocities (Vr and Ar), due to late ventricular systole and atrial systole. 19,20 However, only the forward ventricular systolic flow (VS) and the reverse atrial systolic flow (VAr) were able to be analysed due to the fast heart rate of rats in the present study. The VS was significantly lower after MCT injection in the right SVC, indicating that the systolic tricuspid annulus movement towards the apex was limited in PH. The VAr in SVC was remarkably increased in PH rats indicating that there was no right atrial systolic dysfunction at the current stage of mild to moderate PH. These results demonstrate that the SVC Doppler flow velocities could reflect the haemodynamic changes in PH. However, future studies on the correlation between the PASP and the vena cava velocities need to be done to further elucidate the value of SVC Doppler velocities in assessing PH.
Miao et al. 21 reported that the SVC spectrum can reflect the state of the right ventricular diastolic function and that the parameters of Ar are sensitive in PH patients. They found that the velocity time integral of S wave was lower than that of the normal group. Peak of Ar wave and velocity time integral of Ar wave were higher than those of the normal group. Similar results were found in the present study.
Note that VS and VTIS of the left SVC have no significant difference before and after MCT injection. This might be due to the fact that the left SVC is further to the right atrium than the right SVC, so that the blood flow in the left SVC is less affected by the pressure changes in the right atrium and the pulmonary artery. It reminds us that the right SVC Doppler parameters are more sensitive for assessing the right cardiac pressures.
Since the location of SVC and the heart is very superficial in rats, a higher-frequency probe must to be used to clearly display the structures. Due to a faster heart rate in rats, appropriate improvement of frame rate is essential to obtain accurate colour flow parameters. In the present study, the 10 MHz probe is proved to be adequate for displaying the rat SVC.
One limitation of this study is that we did not make close observation of the MCT adverse effects in this model. Some reports described significant liver and kidney damage and myocarditis after injection of MCT. 22,23 Further studies need to be performed in the future.
In conclusion, echocardiography can be used to monitor the haemodynamic changes in SVC in MCT-induced chronic PH rat models. The ratios of VAr/VS and VTIAr/VTIS may be sensitive indices for evaluating PH.
Footnotes
ACKNOWLEDGEMENTS
The authors would like to thank the editors of International Science Editing for language editing of this manuscript. This research was sponsored by the Department of Life Sciences, National Natural Science Foundation of China, Beijing, China. The subject number is 30772057.