
Abstract
Dried bloodspot (DBS) technology has been available for many decades but only in the last five years has it been considered for routine bioanalysis of blood samples collected on preclinical and clinical studies as part of a drug development programme. Advantages of using DBS versus typical plasma samples include smaller blood volumes, less processing of the samples (e.g. no centrifugation) and no requirement for storing or shipping of the samples at frozen temperatures. The current study compared blood concentrations (AUC0− t and C max) from rats given an oral dose of acetaminophen (APAP) using two different sampling sites (caudal venepuncture versus tail snip), two different collection methods (3 separate 15 μL ethylenediaminetetraacetic acid [EDTA]-coated capillary tubes versus an EDTA integrated capillary blood collection system) and variability between blood spots on one card. There were no noteworthy differences (i.e. two-fold or greater) in blood concentrations of APAP using the different sites or methods. Furthermore, comparisons of the APAP blood concentrations in the original spot to a duplicate bloodspot from the same bloodspot card were within 12% of the original concentration.
Dried bloodspot (DBS) analysis can be utilized to determine blood concentrations of compounds (e.g. new chemical entities [NCEs]) in humans and animals. The technique involves spotting a small volume of blood (∼15 μL) onto a paper card, allowing the blood to dry and punching a 3–5 mm diameter hole from the bloodspot to analyse for compound concentration (i.e. bioanalysis). The technology has been available and well established for newborn screening for many decades 1,2 but only in the last five years has it been considered for routine bioanalysis of blood samples collected on preclinical and clinical studies as part of a drug development programme. 3–5 Advantages of using DBS versus typical plasma samples include collecting smaller blood volumes, less processing of the samples (e.g. no centrifugation or transfer of plasma) and no requirement for storing or shipping of the samples at frozen temperatures (no dry ice is required). For rodents, the requirement for smaller blood volumes can reduce the number of animals used on a pharmacokinetic or toxicology study (e.g. approximately 30% fewer rats dependent on exact study design). For mice, serial blood collections are possible with DBS thereby greatly reducing the number of satellite toxicokinetic mice (e.g. approximately 60% fewer mice dependent on exact study design). In rats, it is possible to collect blood for bioanalysis on main study animals (i.e. no satellite toxicokinetic groups). This carries a scientific advantage in that a toxicological event can now be directly correlated with exposure to the test material. The technique can also be used in larger animal species, thus providing the aforementioned sample processing and storage/shipping benefits.
There are multiple blood sampling techniques that can be employed with DBS. The ‘modified tail snip’ technique is a blood sampling technique that involves blood sampling after removal of 1–2 mm of the distal tail of a rodent. 6 This site may be used to obtain multiple samples from a single cut. One concern about the ‘modified tail snip’ technique is the collection of fluids other than blood that could dilute the sample. Therefore, one of the aims of this investigation was to compare blood concentrations from rodents given acetaminophen (APAP) and subsequently sampled using the ‘modified tail snip’ technique versus sampling directly from a tail vein (caudal venepuncture). APAP was utilized in this study based on previous experience in rats. A single dose (600 mg/kg) was selected based on earlier studies where it was well tolerated with no overt toxicity noted (unpublished data).
In addition to multiple blood sampling techniques, there are also multiple blood collection devices. Ethylenediaminetetraacetic acid (EDTA)-coated capillary tubes (i.e. Drummond Microcaps™) are one tube type used to collect blood. These tubes are available in a variety of sizes and thus make blood collection and spotting simple and efficient. Using three separate 15 μL EDTA-coated capillary tubes per timepoint is one DBS collection method used in our laboratories. One concern about this method is the fact that technically the individual capillary collections could be considered three separate samples even though they are collected with immediate succession (i.e. typically within a minute of each other). In order to address this concern, this study also compared this collection technique with a single EDTA-integrated capillary blood collection system where the blood sample was collected all at once into a common container via capillary action and subsequently pipetted onto the DBS card. The APAP area under (concentration) curve (AUC) and maximum concentration (C max) values were compared not only between sampling methods but also between duplicate spots on the same DBS card collected via three separate EDTA-coated capillary tubes.
Our laboratories routinely use three separate 15 μL bloodspots per sampling timepoint instead of one larger spot. The reasons for using this technique include increasing the chances of getting at least one good usable spot, smaller spots are more homogeneous which is important for downstream quantitative processes 7 and allows for repeat analysis without having to punch the primary sample in exactly the correct location.
In summary, the current study was designed to address some of the concerns around implementation of DBS methods. This study compared two different sampling sites (caudal venepuncture vein versus tail snip) and two different sampling methods (3 separate 15 μL EDTA-coated capillary tubes versus an EDTA-integrated capillary blood collection system) utilized for DBS analysis. APAP blood concentrations (AUC0− t and C max) using different sampling sites and different sampling methods were compared to determine whether different APAP blood concentration values were obtained using the different collection sites and/or methods. Lastly, comparisons of the APAP blood concentrations in the original spot with a duplicate bloodspot from the same DBS card were also done.
Materials and methods
Animals
Experiments on animals followed the guidelines established in the Guide for the Care and Use of Laboratory Animals 8 and were approved by the Institutional Animal Care and Use Committee.
Husbandry and dosing
Nine male rats (Crl:CD(SD)) were obtained from Charles River Laboratories, Inc (Raleigh, NC, USA) and were approximately 11 weeks of age. The rats weighed between 360 and 410 g and were offered Certified Rodent Diet 5002 (PMI™ Nutrition International, Richmond, IN, USA) ad libitum throughout the study. Municipal water with treatment by reverse osmosis was available ad libitum. The rats were specified pathogen free (virology, microbiology, parasitology and pathology). Rats were housed three per cage in polycarbonate solid-bottom cages with Bed-O'Cobs™ (The Andersons, Maumee, OH, USA) and a rat tunnel (Bio-Serv, Inc, Frenchtown, NJ, USA) in an environment with a temperature of 17–26°C, 30–70% relative humidity and a 12 h light/dark cycle (lights on at 06:00 h). The animal room had artificial light (30-foot candles at 1 m off of the floor) and had ∼14 air changes/h. The rats were acclimatized to the animal room conditions for nine days prior to dosing.
The rats were randomly allocated to three separate groups by ranked body weight using computer-generated tables to provide approximately equal mean body weights for males in each group (n = 3 per group). Rats were identified by a unique animal number by implanted transponder. Each group of rats was administered a single oral (via gavage) 600 mg/kg dose of APAP (Sigma-Aldrich, St Louis, MO, USA) that was formulated as a 60 mg/mL suspension in 1% methylcellulose in reverse osmosis-treated water.
Blood collection and card processing
Blood was collected at 0.5, 1, 2, 5 and 8 h after dosing and three 15 µL blood samples were spotted onto each FTA DMPK card (GE Healthcare, Piscataway, NJ, USA) at each timepoint. While spotting the blood onto the cards, the technician was careful not to allow the pipette tip or the end of the capillary tube to touch the card. For one group (Group 1) of rats (n = 3), at the 0.5, 2 and 8 h timepoint, blood was collected from the tail-snipped (‘modified tail snip’) 6 rat into three 15 μL EDTA-coated capillary tubes (Microcaps™, Drummond Scientific, Broomall, PA, USA) at each designated timepoint (Figure 1b). Immediately after this sampling, blood (∼60 μL) was also collected into an EDTA-integrated capillary blood collection system (Protech Medical Ltd, Glossop, UK; Figure 1a). Using this collection method, blood was collected into a container and a pipette was used to spot three 15 μL bloodspots onto the FTA DMPK card (Group 1a). At 1 and 5 h timepoints, the collection methods were reversed (i.e. into an EDTA-integrated capillary blood collection system first followed by collection into EDTA-coated capillary tubes). For a separate group (Group 2) of rats (n = 3), blood (∼60 μL) was collected into an EDTA-integrated capillary blood collection system via the tail vein (caudal venepuncture). For the final group (Group 3) of rats (n = 3), blood (∼60 μL) was collected into an EDTA-integrated capillary blood collection system via tail snip (‘modified tail snip’). 6
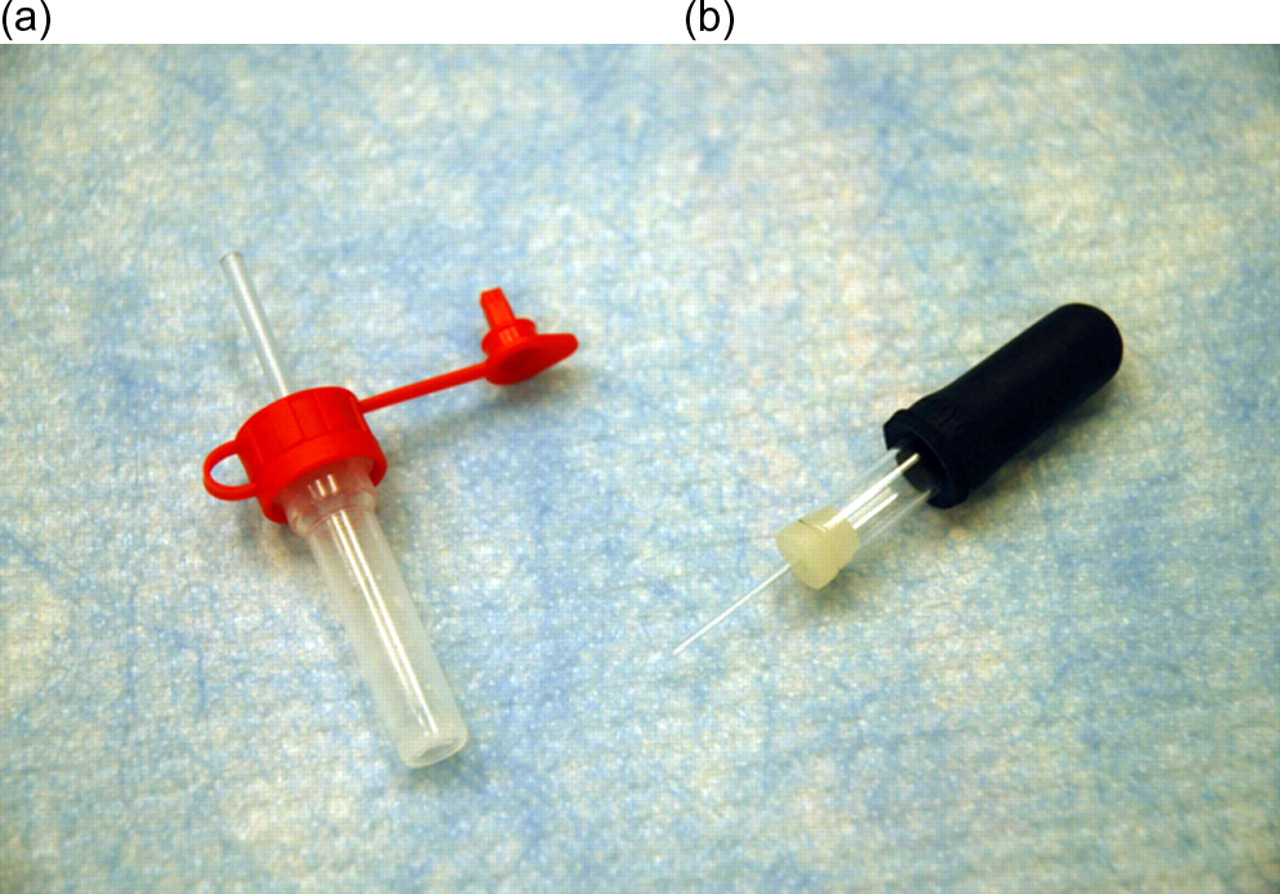
Examples of blood collection devices. (a) An EDTA-integrated capillary blood collection system. (b) An EDTA-coated capillary tube
The DBS cards were allowed to dry at ambient temperature for at least 2.5 h. Once dry, all the cards from a single timepoint were put into an 8 × 10 reclosable plastic bag (RD Plastics, Nashville, TN, USA) with at least two desiccant sachets (GE Healthcare). Cross contamination has not been demonstrated to be an issue for numerous compounds because predose samples have been stored in the same bag as postdose samples and the former have been shown to contain no drug-related material (unpublished data). The 8 × 10 bags were put into 13 × 18 reclosable bags (RD Plastics) for shipment to another site for blood concentration analysis at ambient temperature.
Analytical methodology
The DBS cards were then analysed using a validated method. 4 DBS samples from rat blood were analysed for APAP based on extraction of the 3 mm diameter DBS disc by addition of methanol/water 50/50, followed by high-performance liquid chromatography–tandem mass spectrometry analysis. The lower limit of quantification was 100 ng/mL, using a 3 mm diameter disc punched from the centre of the DBS created from a 15 μL aliquot of rat blood, with a higher limit of quantification of 50,000 ng/mL.
Toxicokinetic analysis of the data was performed by non-compartmental pharmacokinetic analysis using WinNonlin™, Enterprise Edition Version 4.1. The systemic exposure of APAP was determined by calculating the AUC from the start of dosing to the last quantifiable timepoint (AUC0− t ) using the linear-logarithmic trapezoidal rule. The maximum observed peak concentration (C max) was determined by inspection of the observed data. As only three rats per group were used in this study, no comparative statistical methods were used to compare the toxicokinetic data. However, data generated from such small group sizes over many years in our laboratories for multiple NCEs suggest that toxicokinetic data can vary by up to two-fold and still be considered comparable.
Results
Blood concentration results
For Group 1 rats, APAP blood concentrations expressed as AUC0− t and C max sampled by the two different methods, directly into a capillary or into an EDTA-integrated capillary blood collection system, were within 15% of each other (Figure 2). This is within the tolerability of the assay and as such these concentrations are considered to be the same.
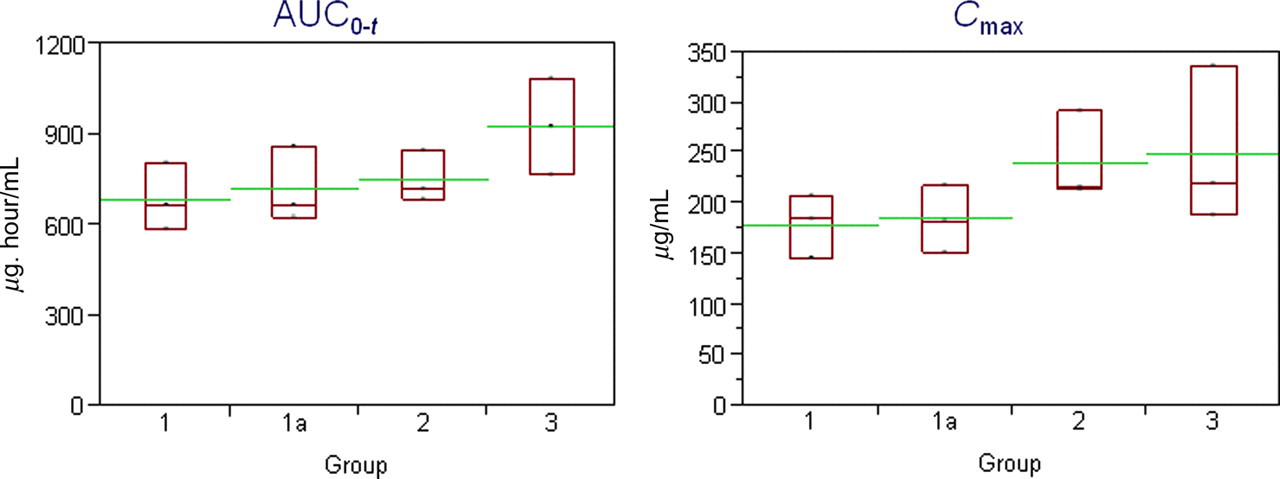
Exposure data in male Crl:CD(SD) rats administered an oral APAP dose (600 mg/kg). Group 1: Rats bled via tail snip into EDTA-coated capillary tubes. Group 1a: Rats bled via tail snip into an EDTA-integrated capillary blood collection system. Group 2: Rats bled via caudal venepuncture into an EDTA-integrated capillary blood collection system. Group 3: Rats bled via tail snip into an EDTA-integrated capillary blood collection system. The boxes represent the range of the data (n = 3 per timepoint), the longer horizontal lines represent the mean of the groups and the shorter horizontal lines represent the median
For rats from Groups 2 and 3 bled into an EDTA-integrated capillary blood collection system via caudal venepuncture or modified tail snip, 6 there was considerable overlap between the groups and no notable difference (i.e. two-fold or greater) between the APAP blood concentrations; however, the concentrations were, on average, higher in animals where blood was collected via the modified tail snip method (Group 3), compared with those bled via caudal venepuncture (Group 2; Figure 2). Additionally, there was also overlap in APAP blood concentrations following tail snip sample collection from rats in Group 1a and Group 3 (Figure 2).
Spot-to-spot variability
In an effort to better understand spot-to-spot variability using the various methods, duplicate spots of blood on the same DBS card were analysed for APAP concentrations approximately five weeks after the original spot was analysed. In the first example (Figure 3a), a comparison is made between blood samples collected via the modified tail snip into an EDTA-integrated capillary blood collection system. The APAP concentrations measured originally at each timepoint and then approximately five weeks later are within 12% of each other. These data equate to an AUC and C max that are within 1.5% and 0.9%, respectively, of each other.
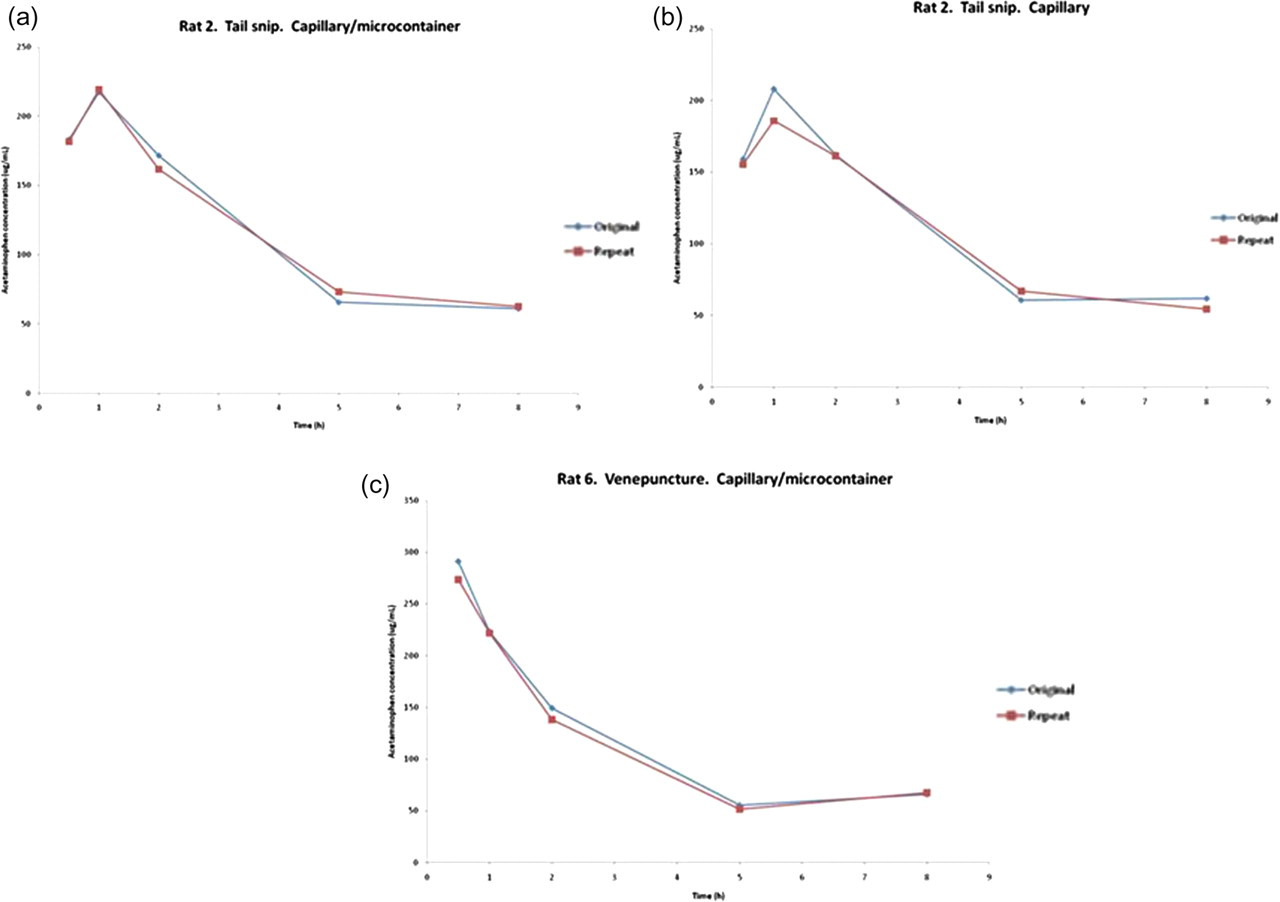
Incurred sample reanalysis results. APAP blood concentration results were obtained from two replicate spots derived from the same sampling point and animal on the same DBS cards. Samples were analysed approximately five weeks apart. Data in 3a are from blood samples collected via the modified tail snip 6 into an EDTA-integrated blood collection system. Data in 3b are from blood collected via the modified tail snip using three 15 μL EDTA-coated capillary tubes/timepoint. Data in 3c are from blood collected via caudal venepuncture into an EDTA-integrated capillary blood collection system
Data from blood collected from the same rat using three 15 μL EDTA-coated capillary tubes per timepoint demonstrate similar results (Figure 3b). The APAP concentrations measured originally and then approximately five weeks later are also within 12% of each other equating to an AUC and C max that are within 1% and 10.6%, respectively, of each other. These results are well within the acceptance criteria described for incurred sample reanalysis. 9
Lastly, the APAP blood concentrations obtained from a rat bled via caudal venepuncture into an EDTA-integrated capillary blood collection system were within 8% of each other equating to an AUC and C max that are within 4.6% and 5.8%, respectively, of each other (Figure 3c).
Discussion
DBS technology is being seriously considered as a way to reduce costs, reduce number of animals required for pharmacokinetic and toxicity evaluation and to provide robust blood concentration data of various compounds. Although the technology has been around for more than 40 years, only recently (last 5 years) has it started being considered as the routine blood collection/analysis methodology with in vivo studies in the pharmaceutical industry. The matrix of choice has historically been plasma due to the ease of transport and analytical considerations namely easier analysis due to homogeneity of plasma 10 but the downside to using plasma is that the blood volume required to yield a sufficient volume of plasma for analysis is relatively large (>100 μL with 250 μL routine) particularly for rodents. DBS analysis can be performed using a 15 μL spot of blood so that the drastic reduction in blood volume required for DBS has created the ability for serially bleeding mice on a routine basis as well as collecting serial blood concentration data in the same rats used for toxicology assessments without affecting haematology/haematopoetic tissue (manuscript in preparation). Similar to large animal species, exposure data are possible on the same rats where pathology endpoints are collected to better correlate findings with exposure.
In this study, blood concentrations of APAP in male rats collected via the tail vein or via a modified tail snip procedure 6 yielded similar results as did collecting the blood into an EDTA-integrated capillary blood collection system or three separate EDTA-coated capillary tubes. Furthermore, repeat analysis of duplicate bloodspots yielded data that were comparable with the original results.
The data presented here address some of the concerns that have been expressed about using DBS methods in routine rodent toxicology studies. Additionally, the authors recognize that there are many different ways to sample blood that involve different sites (e.g. tail vein and tail snip) and different collection vessels (separate EDTA-coated capillary tubes or EDTA-integrated capillary blood collection system) and the initial data presented here demonstrate that different sites and different methods yield comparable results within the context of the limited number of animals routinely employed for toxicokinetic evaluations. In comparison with plasma where blood is collected and spun in a centrifuge to separate the plasma, with DBS, there is further concern around the spotting of the blood onto the bloodspot cards collected by the different methods. While it was beyond the scope of this research to try and address every permutation involved in blood collection, the data presented here begin to address issues around the consistency of blood collection for DBS using a tail vein and a modified tail snip technique. To address the question of whether samples collected using three separate capillary tubes should technically be considered as three separate samples, we have presented initial data demonstrating sample consistency with no more variability than one sample collected into a single container.
Using DBS in rodent studies for toxicokinetic sampling has significant implications for reducing animal use and increasing data quality. Due to the decreased amount of blood required for DBS analysis relative to plasma methodology, extra groups of rats (i.e. satellites) are not required for all studies thereby reducing the number of rats used. Some companies avoid using satellite rodents for toxicokinetic sampling and instead use a sparse/composite sampling strategy from the main study rodents. The application of DBS enables serial sampling from main study animals. From this, more robust data collections may be obtained giving a more complete exposure curve in individual animals. Serial blood collections from mice are also possible due to the reduced blood volumes and can also lead to a significant reduction in the number of mice used in toxicology studies. Furthermore, in rodents bled via the modified tail snip technique, 6 rodent restraint is reduced because the tails do not need to be prewarmed for an extended period of time. This would represent a refinement afforded by the DBS technique.
While the modified tail snip technique does have advantages such as reduced restraint, several laboratories have investigated stress hormone levels using different bleeding techniques.
6,11–13
. The ultimate decision to use one bleeding technique versus another must be made by the investigator taking into account a variety of factors balancing animal welfare, animal usage and local expertise. A more in-depth discussion on the advantages and disadvantages of different blood collection methods can be found on this website:
DBS may not be applicable for all compounds (e.g. ones that dramatically effect haematocrit 14 ) but it should be a consideration for any in vivo animal work as a way to reduce the numbers of animals and to save resources. Further research will fully elucidate the potential of this analytical methodology.
Footnotes
ACKNOWLEDGEMENTS
The authors would like to thank Chhou Liv for his excellent technical assistance in the conduct of this study. The authors would also like to thank Dr Christopher Evans for his study design input and Carie Kimbrough for graphing assistance and advice on statistical analysis.