
Abstract
The technical feasibility of dynamic contrast-enhanced magnetic resonance imaging (MRI) measurement of rat vertebral blood perfusion using a 1.5 T clinical scanner and a small surface coil was investigated in this study. Nine male 7-month-old Wistar-Kyoto rats were used. Computed tomographic assessment of lumbar vertebral bone mineral density (BMD) and MRI assessment of lumbar vertebral blood perfusion were performed twice with 8 weeks' interval. A 4.7 cm surface coil was used for receiving radiofrequency signal. Gadolinium-DOTA (0.3 mmol/kg) was injected through the tail vein of the rat as a quick bolus and dynamic MRI scan was carried out on the central sagittal plane of the lumbar spine for 8 min with a temporal resolution of 0.6 s. Blood perfusion parameters of wash-in rate, maximum enhancement and wash-out rate were derived from the dynamic MR images. No vertebral body size and vertebral BMD difference was detected between the two time points (P = 0.222 and 0.123, respectively). Wash-in rate was 0.105 (±0.016)% and 0.111 (±0.018)%, maximum enhancement 126.5 (±10.6)% and 129.2 (±13.4)%, and wash-out rate 0.788 (±0.182)% and 0.792 (±0.182)% for the two time points. With these parameters, no difference was found between the two time points with a P value of 0.575, 0.889 and 0.754, respectively. We conclude that dynamic contrast-enhanced MRI measurement of rat vertebral blood perfusion using a 1.5 T clinical scanner and a small surface coil is feasible and reliable. This technique offers a non-invasive means to probe vertebral blood perfusion changes associated with rat disease models.
Currently, the relationship between osteoporosis and decreased blood perfusion to the affected bone is being explored. Reductions in bone blood flow and capillary rarefaction in bones of aged individuals are associated with osteoporosis. 1 Decrements in bone blood flow have been reported in healthy humans over 60 years of age, 2 as well as in senescent rats 3 and rabbits. 4 The potential for bone blood flow and the osseous vasculature to have a modulating effect on bone remodelling has led to the hypothesis that reductions in skeletal blood flow with advancing age may contribute to a diminution in bone mass and increased risk of fracture in older individuals. 3,5 Recent clinical studies have shown that, both in male and female subjects, magnetic resonance imaging (MRI)-derived parameters of vertebral marrow blood perfusion are significantly decreased in the osteoporotic subjects compared with those of the osteopenic subjects and normal bone density subjects. 6–8 In the experimental setting, osteoporotic models in adult rats are useful for studying rapidly progressing, high turnover bone loss and assessing the efficacy of various therapies. 9,10 In this study, we investigated the technical feasibility and reliability of an MR perfusion imaging technique using a 1.5 T clinical MR scanner and a small surface radiofrequency (RF) coil. These instruments are readily available in most clinical institutions.
Materials and methods
The experimental protocol was approved by the Animal Experiment Ethics Committee of The Chinese University of Hong Kong (CUHK) and Department of Health, Hong Kong SAR. All the animal procedures were carried out according to the guidelines set out by the Laboratory Animal Services Centre of CUHK. Nine male Wistar-Kyoto rats, bred at the Laboratory Animal Services Centre of CUHK, were used in this study. These animals were 7 months old when the study was initiated. Two to three animals were housed per stainless steel cage at 22°C temperature in a 12:12 h light:dark cycle while receiving a standard commercial rat chow (Prolab RMH 2500, PMI Nutrition International LLC, Brentwood, USA) and water diet ad libitum. For MRI examinations, the rats were anaesthetized using a combination of xylazine (10 mg/kg) and ketamine (90 mg/kg).
MRI studies were performed on a 1.5 T clinical whole-body imaging system (Intera NT, Philips Medical Systems, Best, The Netherlands) with a maximum gradient strength of 30 mT/m. A commercially available surface coil with a diameter of 4.7 cm (Micro 4.7, Philips Medical Systems) was used as the RF signal receiver and the body volume coil was used as the RF signal transmitter. A custom-made plastic cradle was used to hold the surface coil and the rats where the position of the coil is fixed and the rats could be moved in the head–tail direction (Figure 1). Rats were anaesthetized and placed in the cradle supine, and the tail vein cannulated with a 24G heparinized catheter (Introcan Safety, B Braun Medical Inc, Bethlehem, USA). Using the pelvic crest as the anatomical reference, the rat lumbar spine region was placed on the top of the surface coil, aiming to place vertebrae L3 and L4 on the top of the surface coil center. A coronal scout scan was obtained to confirm the desired positioning of rat lumbar vertebrae in relation to the surface coil, and repositioning was carried out if this was not optimal. Following satisfactory coronal scout scan, a sagittal plane through the mid-section of the lumbar spine was prescribed, and a T1-weighted anatomical image was obtained with the following parameters: T1-weighted fast spin echo sequence, slice thickness = 2 mm, TR = 425 ms, TE = 24 ms, echo train length = 3, in-plane resolution = 0.25 × 0.25 mm, matrix = 304 × 243, NEX = 5.
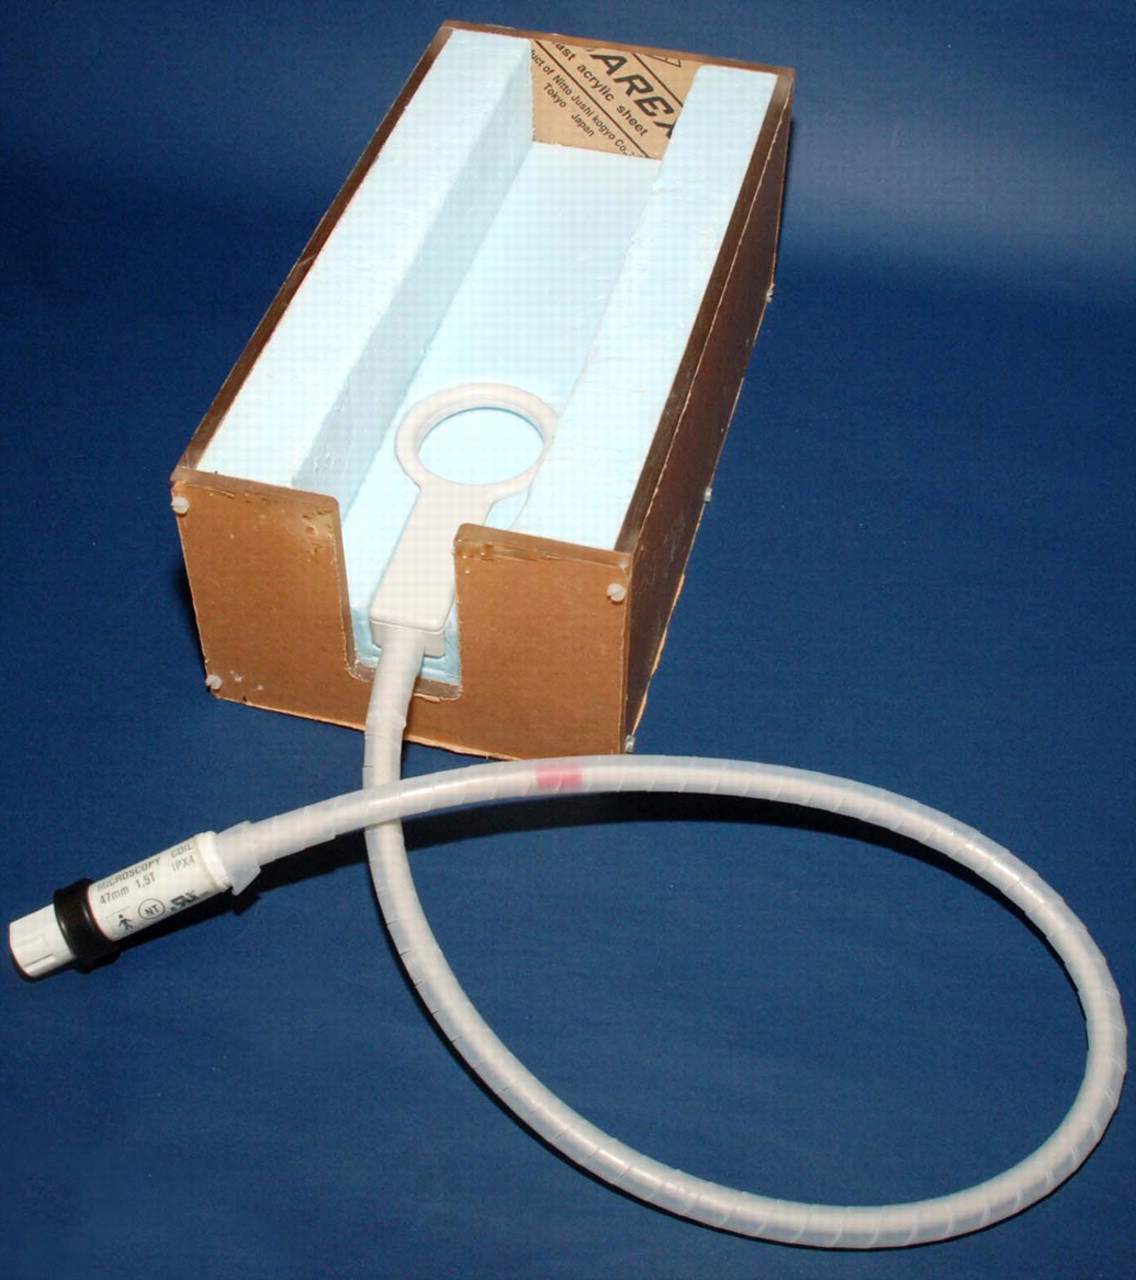
Rat cradle with a 4.7 cm surface radiofrequency coil
Following anatomical image, a dynamic MR scan series was obtained in the sagittal plane, with the following parameters: short T1-weighted gradient echo sequence, TR = 4 ms, TE = 1.4 ms, flip angle = 15, slice thickness = 5 mm, matrix = 128 × 51, in-plane resolution = 0.625 × 0.625 mm, average = 1. The temporal resolution was approximately 0.6 s per image acquisition. MRI contrast agent was Gd-DOTA (Guerbet Group, Roissy CDG Cedex, France). A dose of 0.3 mmol/kg (0.24 mL for a 400 g rat) was injected after initial baseline 60 image acquisitions as quick bolus and followed by a flush of 0.5 mL normal saline. The bolus injection was completed in less than 1 s. This bolus injection and normal saline flush was carried out by the same operator skilled in in vivo small animal procedures. The total dynamic MRI duration was approximately 8 min and 800 images were acquired leading to a temporal resolution of 0.6 s/image.
Dynamic MRI images were processed in a radiological workstation (Viewforum, Philips Medical System). Region of interest (ROI) was drawn over the cancellous part of lumbar vertebrae and the vertebral cortex was excluded. The signal enhancement over time was recorded. Three perfusion parameters were computed: (1) wash-in rate (i.e. enhancement slope), (2) maximum enhancement and (3) wash-out rate.
Wash-in rate is defined as the rate of enhancement between 10% and 90% of the signal intensity difference between maximum signal intensity post-enhancement (SImax) and signal intensity prior to enhancement (SIbase). It was derived from the first-pass phase of signal intensity enhancement according to the following equation:
6,7

Maximum enhancement is defined as the maximum percentage increase in signal intensity from baseline. It was derived from the first-pass phase of signal intensity enhancement according to the following equation:
6,7

Wash-out rate (λ) is the constant to describe the rate of monoexponential decay of the enhancement signal in the tissue (i.e. vertebral body). It was derived from the enhancement signal decay phase according to the following equation:

Whether y refers to the MR signal (Y-axis values) and t refers to time (X-axis values), Plateau refers to the MR signal value when the contrast-enhancement decays to a plateau. Theoretically, this is achieved when MR image is acquired long enough postcontrast agent injection and contrast agent is eliminated completely from the tissue. Span refers to signal difference between SImax and plateau. The enhancement decay half-life (t 1/2) is related to the wash-out rate as t 1/2 = ln(2)/λ (Figure 2).
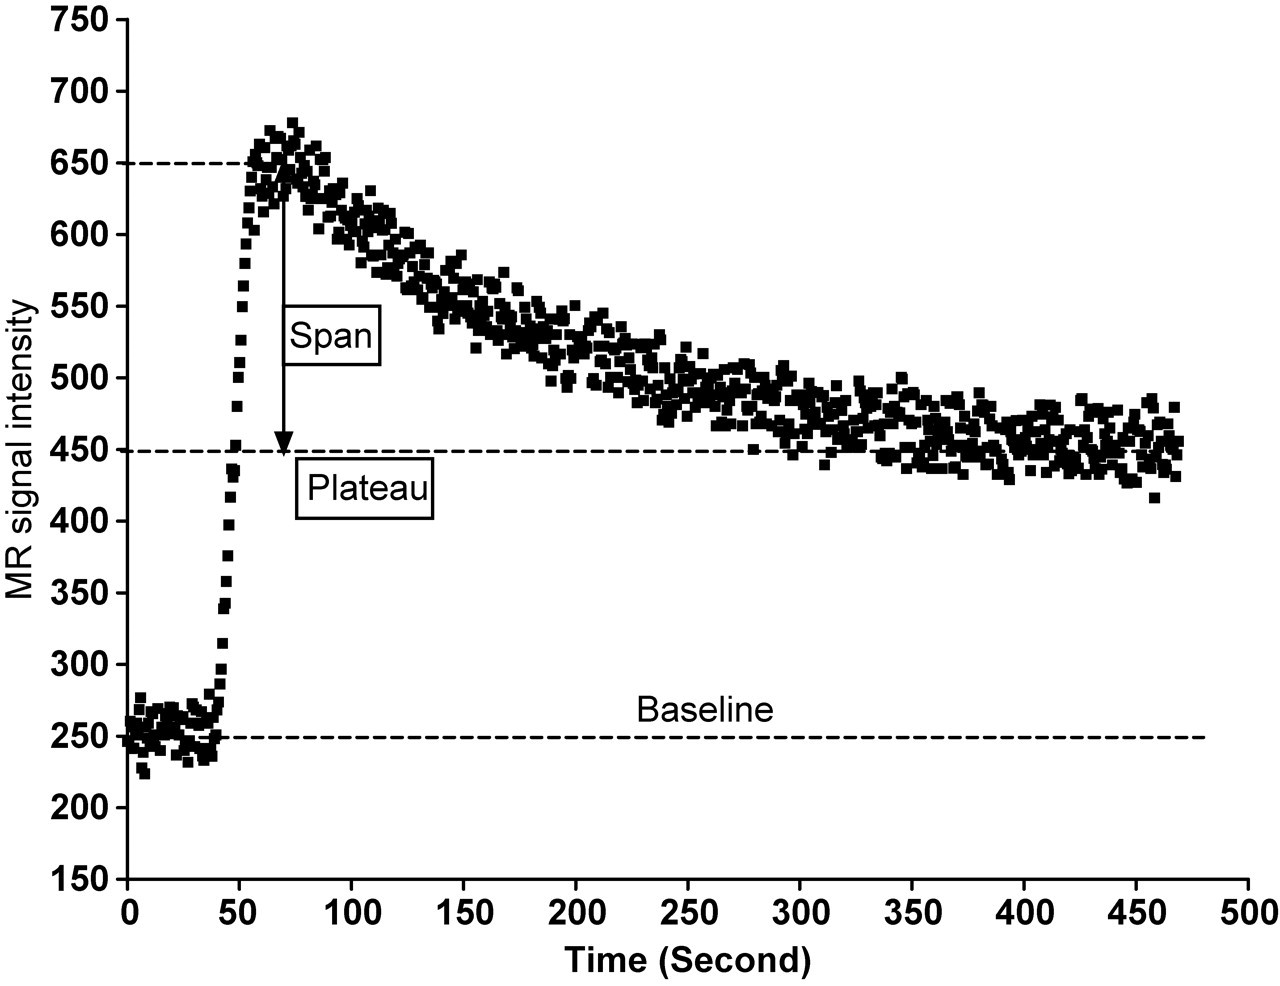
Diagram illustrates the Span and Plateau
The curve-fitting was carried out using GraphPad Software (GraphPad Software, Inc, San Diego, CA, USA). For each examination, four vertebrae where the MRI signal was judged to be homogenous were selected for MRI perfusion data measurement. The mean value of the four vertebrae's MRI perfusion data was considered to represent the value of the animal.
To study the effect of MRI data acquisition duration on the wash-out rate value, in addition to the wash-out rate values computed using the total 800 acquisitions, wash-out rate was also computed using the initial 400 acquisitions with the last 400 acquisitions discarded.
Rat lumbar vertebral bone mineral density (BMD) was measured using a multi-detector CT scanner (LightSpeed VCT 64, General Electric, USA) employing continuous axial 0.625 mm slice thickness acquisitions. A detailed description of the methodology has been reported. 11,12 CT raw data were transferred to a dedicated CT workstation (AdvantageWindows, General Electric, USA) for analysis. The vertebral body BMD was taken as the mean of all acquisitions through the vertebral body. An ROI was drawn manually encompassing each vertebral body, excluding the posterior elements, from L1 to L6. This ROI encompassed both cortical and trabecular bones. The mean BMD value of the six vertebral bodies was considered to represent the lumbar vertebral BMD value of the animal as a small BMD difference was found between lumbar vertebral bodies close to the chest and lumbar vertebral bodies close to the tail. 12 CT assessment of lumbar vertebral BMD and MRI assessment of lumbar vertebral blood perfusion were performed twice with 8 weeks' interval.
Data were expressed as mean ± standard deviation. For comparison, Wilcoxon-signed rank test was used. All statistical analyses were performed using SPSS 14.0 (SPSS Inc, Chicago, IL, USA). All statistical tests were two-sided. A P value of <0.05 was considered statistically significant.
Results
The total MR exam time, inclusive of the positioning of the animal and the scout scans, was approximately 20 min. Satisfactory CT and dynamic contrast-enhanced MRI results for analysis were obtained for all animals at the two time points (i.e. baseline and week 8 post-baseline). T1-weighted anatomical images clearly depicted the rat lumbar vertebrae L1–L6, allowing the ROI to be drawn over the cancellous part of the vertebra (Figure 3). Though signal homogeneous region was usually no more than five vertebrae (Figure 3), where the signal was homogeneous, consistent measurement could be obtained from all the vertebrae (Figure 4).
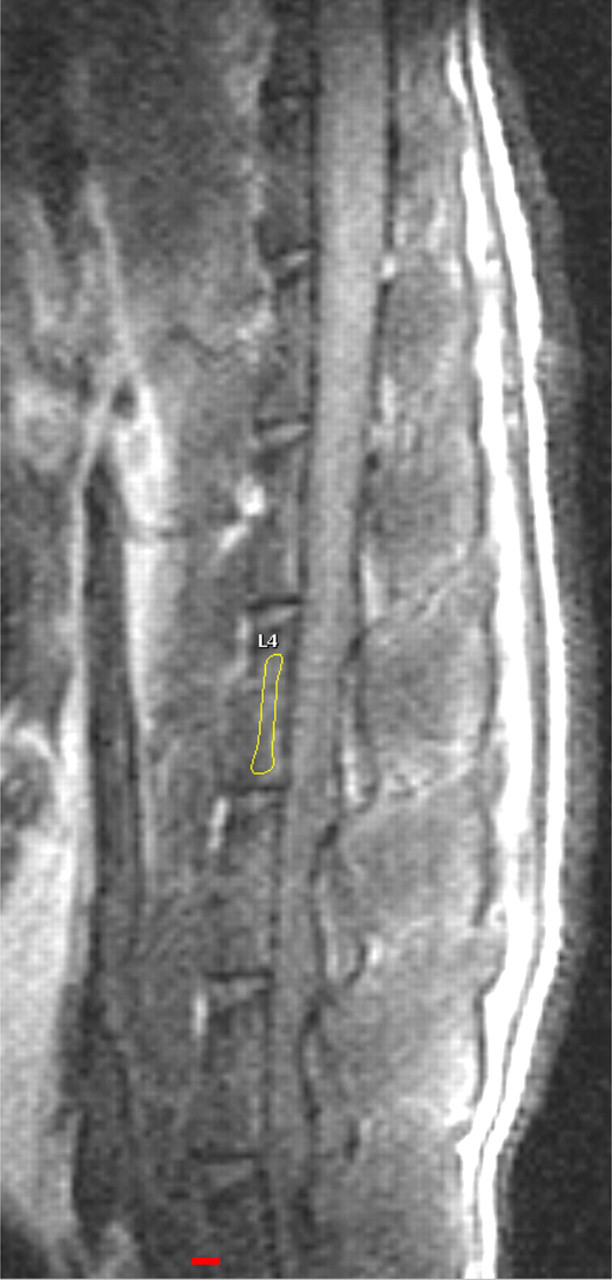
Sagittal anatomical T1-weighted magnetic resonance image of a rat lumbar spine obtained at 1.5 T with a small surface coil. Signal homogenous region covers about four vertebrae. A region of interest on cancellous part of L4 is drawn on the image
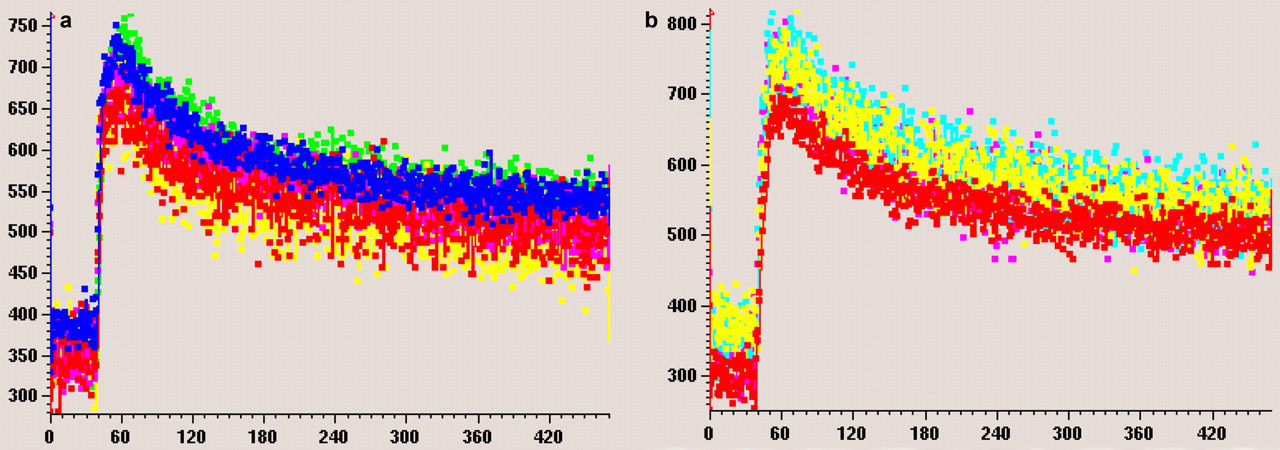
Magnetic resonance image enhancement curve (signal intensity vs. time in s) of the same rat at two time points ([a] for time point 1 and [b] for time point 2). Curves of different colours indicate different region of interests over four different lumbar vertebral bodies. Similar enhancement is seen among the four vertebral bodies, and similar enhancement pattern is seen between the two time points. (Note: the curve color at time point 1 and time point 2 are not correlated)
During the time points 1 and 2, there was a small increase in body weight (407.5 ± 7.6 g vs. 421.7 ± 5.2 g, P < 0.01), however, there was no change in the average lumbar vertebral body volume (57.6 ± 5.2 mm3 vs. 59.5 ± 5.7 mm3, P = 0.222). The rat lumbar vertebral BMD value at time point 1 was 0.947 ± 0.030 g/cm3 and at time point 2 was 0.967 ± 0.053 g/cm3. There was no difference between the two time points (P = 0.123).
The results of MRI perfusion data are shown in Table 1. There was no difference between the two time points with the three perfusion parameters. For the wash-out rate, significant difference was found between values computed using the total 800 acquisitions and those using the initial 400 acquisitions (P = 0.018 for time point 1 and P = 0.028 time point 2).
Rat lumbar vertebral perfusion parameters at two time points
P value denotes comparison between the two time points with Wilcoxon-signed rank test. Wash-out rate 1 refers to the wash-out rate computed using 800 acquisitions while wash-out rate 2 refers to the wash-out rate computed using the initial 400 acquisitions
Discussion
To our knowledge, this is the first report to describe the feasibility and reliability of dynamic contrast-enhanced MRI in assessing rat vertebral blood perfusion. This knowledge is useful if we want to use this technique to probe microcirculation changes of rat vertebrae, or other bone tissues. Until the advent of MR perfusion imaging, there has been no straightforward means of non-invasively measuring intraosseous blood flow and perfusion. As opposed to other invasive means, in vivo MRI permits longitudinal studies of the same animals over an extended period of time, with individual animals serving as their own control. Due to its non-invasive nature, MR perfusion imaging of bones has also been used in studies involving human subjects. 6–8
Recently, a variety of semi-quantitative and quantitative methods have been developed to quantify blood perfusion and capillary permeability in tissues by MR perfusion imaging. 13,14 Besides the gradient of Gd contrast agent concentration between vasculature and interstitial space, wash-in rate is closely related, but not limited, to the microvessel density; maximum enhancement is closely related to capillary permeability and interstitial space (or extravascular extracellular space). The wash-out rate (λ) is related to the backflow of contrast agent from interstitial space to blood flow and being eliminated from the animal body via the kidney. In a clinical study of the vertebral body of human subjects, both maximum enhancement and enhancement slope were approximately one-third less in the osteoporotic group when compared with that of the normal bone density group. 6
Blood perfusion rates in sites consisting primarily of cancellous bone and marrow are greater than in regions composed of cortical bone, which is consistent with the denser vascular network and higher metabolic rates of cancellous bone and marrow. 15 It is in these sites of high metabolic (e.g. bone turnover rates) and haematopoetic activity that blood flow was most affected by various factors, including the aging process. Therefore in this study, the ROI was focused on the cancellous part of the vertebral body and the cortical bone was excluded (Figure 3). In agreement with the data reported previously, our CT data showed mature male rats at the age of 7–10 months with their spine BMD consistent. 16 Taking the reasonable assumption that mature male rats at the age of 7–10 months also maintain consistent lumbar vertebral blood perfusion, results in this study confirmed the reproducibility of our MR perfusion imaging technique. Our results also showed that the wash-out rate was influenced by the total data acquisition duration, therefore for longitudinal and cross-sectional studies, MRI data acquisition duration should be kept consistent. Theoretically, the longer the MR data acquisition, the more reliable the wash-out rate is. However, a long MR data acquisition will be limited by the available MRI machine time.
Ideally, the Gd contrast agent injection should be carried out via an automatic injector. However, no automatic injector capable of injecting such a small volume used accurately in this study was available to us. The injection speed is expected to affect the wash-in rate, but not to a great extent of that of the maximum enhancement and wash-out rate. During our study, the injection of contrast agent was completed within less than 1 s, therefore influence of injection rate on perfusion parameters is expected to be small. Another aspect for potential technical improvement is the use of a dedicated rat body volume RF coil instead of a surface coil. The surface coil used in this study offers good MR signal in the region close to the coil, however, the coverage with satisfactory MR signal is limited to no more than five vertebrae, and therefore MRI perfusion data were measured from four vertebral bodies where MRI signal was judged to be homogeneous. Though MRI perfusion was consistent where the signal was homogeneous (Figure 4), it is known that surface coil-acquired MR images are prone to signal inhomogeneity, therefore averaging of several vertebral bodies' perfusion data is considered to be more representative of the animal than data from a single vertebral body. This will also average out individual vertebra biological variation. A dedicated rat body coil will improve the signal homogeneity and increase the vertebrae coverage, leading to the possibility of studying the thoracic and lumbar vertebrae simultaneously.
Also employing a small number of animals, using the described MR perfusion imaging technique, our pilot studies in osteoporotic models of female rat bilateral ovariectomy (n = 8) and male rat bilateral orchiectomy (n = 8) demonstrated a decrease in vertebral blood perfusion associated with decrease of vertebral BMD. 17,18
In conclusion, this study demonstrated in vivo dynamic contrast-enhanced MRI measurement of rat vertebral blood perfusion using a 1.5 T clinical scanner and a small surface coil is feasible and reliable.
Footnotes
ACKNOWLEDGEMENT
This study was supported in part by RGC (CUHK 464508).