
Abstract
The present study was undertaken in order to evaluate feasibility of a limited sampling strategy (LSS) to predict the systemic clearance of midazolam (MDZ), which is a hepatic CYP3A activity phenotyping probe. Groups of rats pretreated with or without serial doses of ketoconazole, which is a selective inhibitor on CYP3A, were used as training set. Linear regression analysis and a Jack-knife validation procedure were performed based on plasma MDZ concentrations at specific time points after sublingual vein injection of MDZ to establish the most informative LSS equations for accurately estimating the clearance of MDZ. Another group of rats in the same setting was used as the validation set to confirm the individual values of estimated clearance (Clest) that were derived from the predictive equations developed in the training set. LSS that were derived from one, two or three sampling times, namely 90 min, 60–90 min, 30–60–90 min and 30–60–120 min, gave the best correlation and acceptable errors between the values of observed clearance (Clobs) and Clest and were chosen to evaluate hepatic CYP3A activity. Our results supported the hypothesis that using limited plasma sampling is simpler than the usual method of estimating CYP3A phenotyping by predicting the systemic clearance of MDZ when the hepatic activity of CYP3A is reduced in the rat. This experimental design offers opportunities to reduce animal use in the study of drug metabolism.
The use of probe substrates is a widely accepted method for evaluating the activity of cytochrome P450 (CYP) enzymes in individuals. 1–4 Furthermore, the development of a suitable biomarker that can predict or assess hepatic metabolism is highly desirable for establishing a rational regimen of drug administration. As the most abundant of all CYP enzymes, CYP3A accounts for approximately 30% and 70% of the total content of CYP proteins in the adult liver and intestine, respectively, and its isoforms are responsible for the metabolism of 50–60% of frequently used therapeutic drugs. 5 Midazolam (MDZ) is commonly used as a probe to determine CYP3A activity in humans and animals. 6 Thummel et al. 7 reported that systemic clearance of MDZ measured in vivo was highly correlated with hepatic CYP3A activity measured in human liver microsomes in vitro.
The measurement of the systemic clearance of MDZ, however, usually requires the determination of the area under the plasma concentration time curve (AUC) following its administration, for which multiple blood samples collection over several hours is often necessary. It implies that many animals are required and this goes against the principles of good animal-based science, where one should use the least number of animals to obtain meaningful results and cause minimal pain and distress (the 3Rs; Balls et al. 8 ). As a result, the use of MDZ to measure CYP3A activity in vivo is an inefficient and expensive method and thereby limits its use as an easy and routine method to measure CYP3A activity in vivo.
In the limited sampling strategy (LSS) for determining the pharmacokinetic profile of a drug, only two or three blood samples are collected instead of the eight or 10 samples that are required to determine the AUC by the standard procedure. Therefore, LSS is more advantageous than the traditional method to determine the AUC because it limits the constraints of repeated blood sampling. LSS has been used to estimate pharmacokinetic parameters for therapeutic agents 9–11 or to monitor the drug administration regimen, 12,13 and also to predict CYP3A activity using a phenotyping probe drug. 9,14 However, it is still unclear whether the predictive equation for MDZ clearance using a LSS generated from a randomized population in which hepatic CYP3A may have been inhibited to varying degrees could be used to estimate CYP3A-dependent metabolism in the rat liver. Resolving this question is a valuable contribution to metabolism research.
To this end, we designed a study in which we exposed rats to the specific CYP3A inhibitor ketoconazole and thereby, mimic a decreased metabolic function of the liver. Several doses of ketoconazole were administered to the rats in order to obtain different steady-state concentrations of the drug and to attain continuous inhibition of CYP3A. We then tested the availability of a LSS biomarker, i.e. MDZ clearance estimated from the LSS equations (Clest), to predict the drug-metabolizing function of rat liver.
Materials and methods
The use of animals and the experimental protocols to which they were subjected were approved by the ethical committee for animal experimentation of the Tianjin Medical University, Tianjin, China.
Materials
Injectable MDZ was purchased from Enhua Pharmaceutical Group Inc Ltd (Xuzhou, China). Ketoconazole was supplied by Dongya Pharmaceutical and Chemical Inc Ltd (Ningbo, China).
Specific pathogen-free male Wistar rats (8–12 weeks old) weighing 240–265 g were obtained from the Experimental Animals Research Institute of Chinese Academy of Medical Science. The animals were fed a standard laboratory chow diet and tap water ad libitum and acclimatized in a quiet room with temperature ranging from 20–25°C for three days before the experiments.
Experimental protocol
A series of solutions containing different concentrations of ketoconazole were prepared by dissolving ketoconazole in a 9:1 mixture of polyethylene glycol 400 and propylene glycol. The rats were divided randomly into four groups of 10 subjects for each: groups 1, 2 and 3 were treated, respectively, with low, middle and high dose ketoconazole; group 4 was treated with vehicle as control group. The animals were terminally anaesthetized by intraperitoneal injection of 25% (w/v) urethane and their rectal temperature was maintained at 37°C by a warming blanket throughout the experiment. Loading doses (1.2, 10 and 30 mg/kg) of ketoconazole were administered through the sublingual vein (1.0 mL/kg), followed by subsequent constant infusion (0.2 mL/h) through the tail vein at rates of 0.7, 2.0 and 3.0 mg/h/kg, respectively, for rats of groups 1, 2 and 3. These doses were chosen because it has been reported previously that the resultant steady-state ketoconazole concentrations in rats of this size/weight are 1.49 mg/L, 7.16 mg/L and 36.25 mg/L, respectively.
15,16
Vehicle solution was administered to the control group as a loading dose of 1.0 mL/kg followed by constant infusion at a rate of 0.2 mL/kg. Two hours after starting the ketoconazole infusion, 10 mg/kg MDZ was injected within 30 s via the sublingual vein. A volume of 0.5 mL blood was collected by a femoral vein catheter at 2, 5, 10, 20, 30, 45, 60, 90 and 120 min after the injection of MDZ and centrifuged immediately at 1500
Analytical method
The concentrations of MDZ in the plasma samples were determined by high-performance liquid chromatography (Agilent 1100 HPLC workstation, Agilent, CA, USA). MDZ was separated on a C18 column (Huaiyin 150 × 4.6 mm, 5 μm) with a mobile phase of 60% methanol and 40% diammonium hydrogen phosphate (pH 3.9) according to the method described by Zhu et al. 17 with modifications. The column was kept at 45°C and run at a flow rate of 1.0 mL/min. Ultraviolet detection at 231 nm was used.
The calibration samples, quality control samples and tested samples were prepared following the same procedure using an internal standard solution of 50 μL of 5 mg/L diazepam. The plasma standard curve was linear over the range of 0.1–20 mg/L. The lowest limit of quantitation was 0.1 mg/L. Furthermore, the standard deviation of the intraday and interday plasma values of MDZ were <10% and the recovery rates were between 90% and 120% (data not shown).
Data analysis
Pharmacokinetic and statistical analysis
The pharmacokinetic parameters of a two-compartment pharmacokinetic model were estimated using a Data and Statistics (DAS) software package (provided by the Chinese Pharmacological Society). These parameters were k 10 (terminal elimination rate constant), T 1/2(β) (the terminal half-life), V d (apparent volume of distribution), AUC0−t (AUC from 0 min to 120 min) and the extrapolated AUC0−∞ . The systemic clearance (Cls) was calculated using the equation: Cls = dose/AUC0−∞ . The resultant value of Cls was taken as the ‘observation’ of parameter values (Clobs). Student-Newman-Keuls t-test was used for statistical inference.
LSS development for systemic clearance
Stepwise multiple linear regression analysis was performed on 20 randomly chosen subjects (training set) from the four groups in order to determine the relationship between clearance (Clobs) and plasma concentration. 18 Following a distribution test for all data, logarithmic transformation for Clobs and plasma concentrations was performed. The results of this analysis produced equations of the following form: log Clobs = A 0 + A 1 × log C t1 + A 2 × logC t2 + ··· + A n × log C tn , where A n are coefficients and there are a variable number of samples. The regression equations were then ranked according to the coefficients of determination (r 2) to identify those that provided the best fit for one to nine timed plasma samples for following validations of LSS.
Validation
The LSS models that were developed for estimating the clearance of MDZ were validated by two procedures. The first one was the ‘Jack-knife’ prediction
19
in which a regression equation was derived using n (in our case n = 2 or 3) fixed concentrations that were chosen from 19 subjects treated with or without ketoconazole and then used to predict the Cls (Clest) for the 20th subject in the same group. Thus, by discarding one observation at a time and fitting a new model for the remaining observations, a slightly different regression equation can be used to predict drug clearance (Clest) in an animal for a different subset of sampling times. The bias of these LSS-derived estimates was assessed by calculating the mean percentage of error (MPE%) from the best estimates using the equation:

Precision was assessed by calculating the mean absolute percentage of error (MAE%) using the equation:

The equation that was chosen for further validation had the lowest MAE value, an MPE value close to zero and the least number of samples whose prediction error was >15%.
As a further validation (external validation) approach, the LSS regression equations derived from the training set were used to validate the values of clearance (Clest) from each individual in another group of 20 subjects with the same treatment (validation set). The resultant values for Clest were then compared with the observation parameter (Clobs) that had been determined from the data-set for each of the 20 subjects.
Results
Pharmacokinetic study
The time-dependent changes in plasma MDZ concentrations at different ketoconazole concentrations are shown in Figure 1. Of all the pharmacokinetic parameters obtained in this investigation, Clobs and Clest were the most important because they were needed for the correlation study. The values of the other pharmacokinetic parameters, such as V
d
, T
1/2(β),
K
10, AUC0−∞
are listed in Table 1. These data are useful for illustrating the effects of ketoconazole on the different pharmacokinetic parameters of MDZ. There was a statistically significant increase in T
1/2(β) and decrease in the values of K
10 and Clobs of MDZ following ketoconazole administration in groups 1, 2 and 3 when compared with those obtained in the control group (P < 0.05 or P < 0.01). The biggest changes were observed when the values of the high-dose ketoconazole group were compared with those of the control group: the mean increase in T
1/2(β) was 133% and the mean decrease for K
10 and Clobs was 36% and 40%, respectively.
The plasma concentration–time profile of intravenously administered midazolam (10 mg/kg) that was obtained after either an intravenously (i.v.) administered low, middle or high loading dose of ketoconazole (1.2, 10 and 30 mg/kg) and a constant i.v. infusion of ketoconazole (0.7, 2.0 and 3.0 mg/h/kg) versus control (n = 10) Pharmacokinetic parameters of intravenously administered midazolam (10 mg/kg) in rats obtained after either an intravenously administered low, middle or high loading dose (1.2, 10 and 30 mg/kg) and a constant low, middle or high intravenous infusion of ketoconazole (0.7, 2.0 and 3.0 mg/h/kg), respectively Values are given as mean ± SD, n = 10. ‡
P < 0.05 vs. control; §
P < 0.01 vs. control; **P < 0.05 vs. low-dose group *Apparent volume of distribution of central compartment
†Elimination half-life time of midazolam
††Elimination rate constant
‡‡Area under the concentration–time curve
§§Observed systemic clearance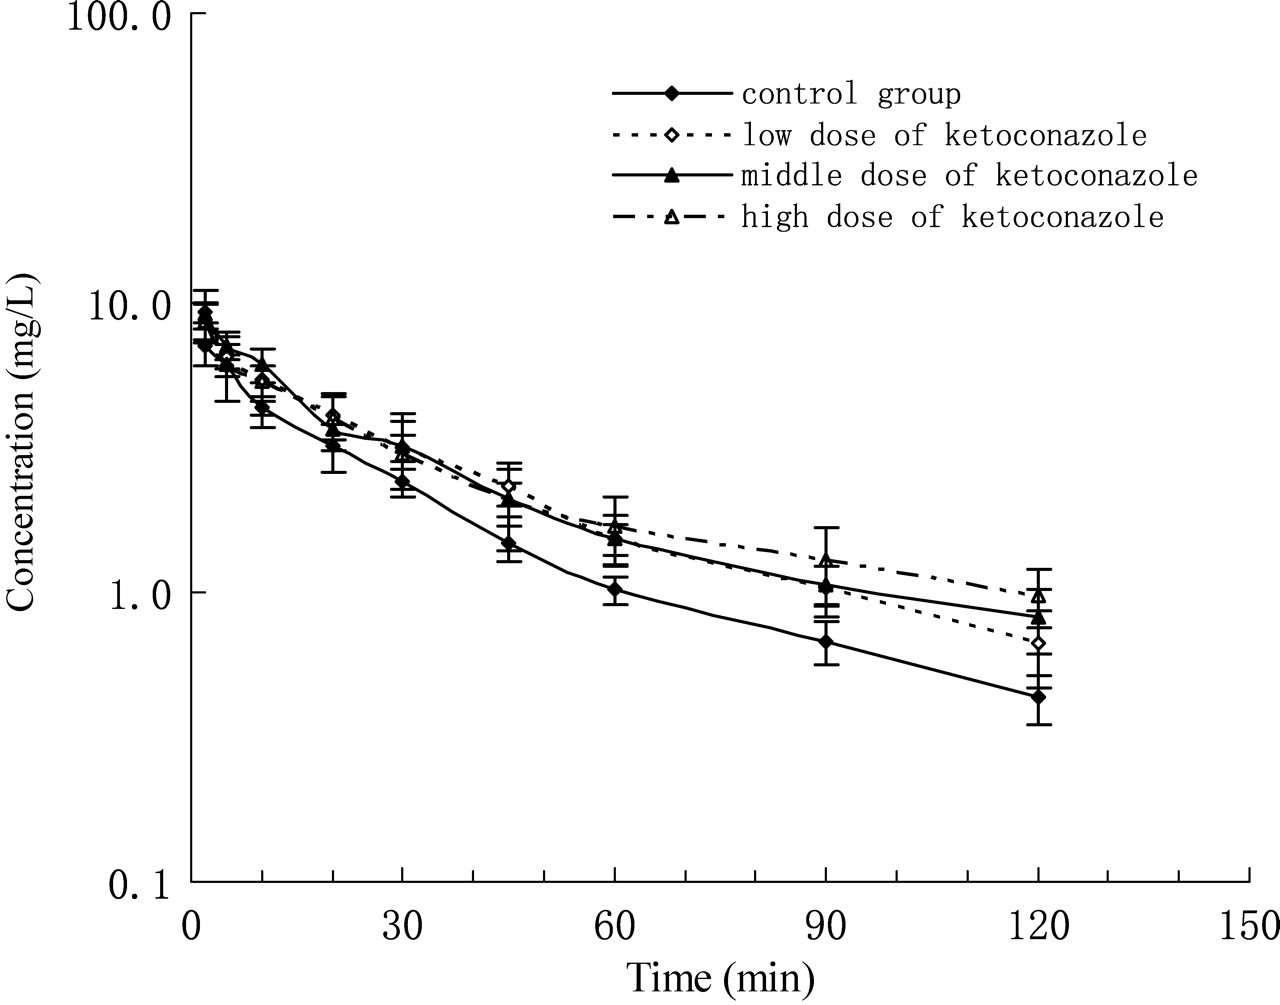
Limited-sampling models for systemic clearance
The r 2 values for different LSS that were derived from stepwise linear regression after logarithmic transformation are listed in Table 2. Although the values of Clest that were derived from the two or three-point LSS model were correlated more closely (r 2 > 0.90, Table 2) with the corresponding Clobs value when compared with that of the one-point model (90 min); all values of Clobs were informative and showed good correlation with the corresponding Clest. When the number of sampling points was increased to more than three, r 2 increased marginally and little was added to the bias or the precision of the estimates of clearance, compared with the respective values of clearance derived from the three-point sampling. Accordingly, we concluded that LSS models based on one, two or three samples are adequate for estimating MDZ clearance in the rat.
The r 2 values for different limited sampling strategies that were derived from stepwise linear regression after logarithmic transformation (n = 20)
P < 0.05 corresponds to each regression equation. Cn : plasma midazolam (MDZ) concentration that was measured at a specified time n (min) following a single dose of MDZ. Clest: estimated systemic clearance
The most informative one-, two- or three-point strategies, namely 90 min, 60–90 min, 30–60–90 min, 30–60–120 min (Table 3), were then used to construct the Jack-knife plots that are shown in Figure 2. In order to validate the LSS that had thus far been developed, the equation that had been derived from the training set based on one-, two- or three-sampling times was then applied to the equivalent concentrations that had been determined at the identical times in another group of subjects (validation set) in order to estimate clearance. In each case, the LSS-derived Clest correlated closely (r 2 > 0.90) with Clobs. The results indicated that the one- (90 min), two- (60–90 min) or three-sampling (30–60–90 min or 30–60–120 min) LSS model that had been developed using the training set, in which the values of MPE and MAE were smaller than 8%, provided good estimates for the values of clearance in the validation set (Table 4).
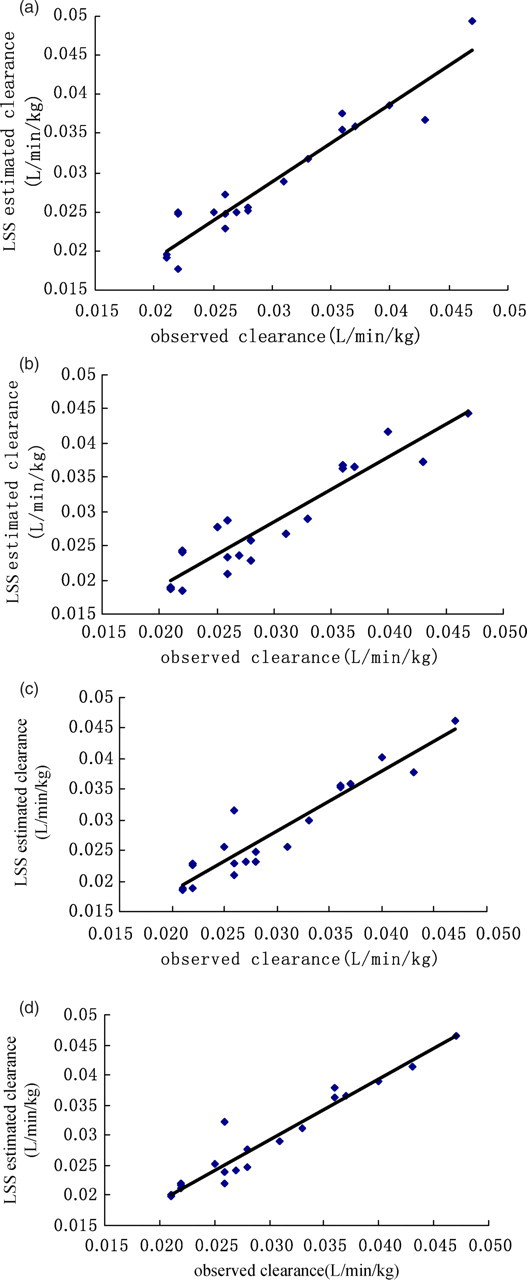
Scatter plots showing the relationship between the observed clearance (Clobs) and a corresponding parameter that was derived from the limited sampling strategy (LSS) (Clest) using a validation set with the same treatment (n = 20). (a) Single-point LSS model using a plasma concentration of MDZ at 90 min (r = 0.95); (b) Two-point LSS using plasma concentrations of MDZ at 60 and 90 min (r = 0.93); (c) Three-point LSS model using plasma concentrations of MDZ at 30, 60 and 90 min (r = 0.94); (d) Three-point LSS model using plasma concentrations of MDZ at 30, 60 and 120 min (r = 0.96)
Validation procedure of limited sampling strategy models for determining the pharmacokinetic parameters of midazolam (MDZ) using the ‘Jack-knife’ validation method
Values are given as mean ± SD (n = 20). Clest: estimated systemic clearance of MDZ; MPE: mean percent error; MAE: mean absolute error
*The least number of samples whose prediction error was greater than 15%
Validation procedure of limited sampling strategy models for determining the systemic clearance of midazolam (MDZ) using data obtained from the validation set with the same treatment
Values are given as mean ± SD (n = 20). Clest: estimated systemic clearance of MDZ; MPE: mean percent error; MAE: mean absolute error
*The least number of samples whose prediction error was greater than 15%
Discussion
Although the availability of specific phenotyping probe drugs are valuable for predicting the activity of important drug-metabolizing enzymes, optimal methods for phenotyping CYP3A in rat have not yet been found.
CYP3A is involved in the metabolism of most therapeutic drugs and its phenotyping has been the subject of numerous investigations. To date, it has been reported that CYP3A in man includes the CYP3A4, CYP3A5, CYP3A7 and CYP3A43 isoenzymes 20 and that CYP3A2 is the major P450 isoform found in male rat liver. 21 All these isoforms are similar in their amino acid sequences, in spite of different catalytic activity. Most in vivo drug metabolism research relies on the total activity of CYP3A, which primarily involves CYP3A4 and CYP3A5 in humans or CYP3A2 in rats because each isoenzyme has similar substrate specificity.
MDZ is a widely used short-acting 1,4-benzodiazepine sedative and hypnotic and is almost exclusively metabolized to 1’-hydroxy-MDZ and 4’-hydroxy-MDZ by CYP3A4 and CYP3A5 in man 22 and by CYP3A2 in mature male rats. 21 MDZ is used as a specific probe to assess CYP3A activity in vivo because of its pharmacokinetic characteristics and good tolerability. 23–27 Because it can be administered both intravenously and orally, it is useful for probing both hepatic and intestine metabolism. 28
Researchers have applied diverse pharmacokinetic parameters of MDZ that include AUC0−∞ , 25–27 Cls, 29 maximal plasma concentration and its elimination half-life, 30 and the plasma ratio of 1’-OH-MDZ to MDZ 7,17,31 to evaluate the activity of CYP3A. The present study used LSS, in which only a small number of blood samples are required instead of a full blood sampling strategy, to determine the pharmacokinetic parameters of MDZ in order to predict CPY3A activity in rats. To establish whether the existing predictive equation that had been generated from a general population could be used to predict MDZ clearance in individuals whose hepatic CYP3A activity was reduced, we designed the present study in which randomly chosen rats were treated with several doses of ketoconazole, a specific CYP3A inhibitor, to generate predictive equations for Clest. When data from this training set were normalized by log transformation, each LSS predictive equation showed excellent precision with minimal bias. ‘Jack-knife’ prediction was then performed for internal validation of the predictive equations and the most informative predictive equations were then used to predict the Clobs of MDZ in another group of rats that were given the identical treatment for external validation.
Validation of the LSS predictive equations was performed by calculating percentage errors. Percentage errors, such as MPE and MAE, provide information about the precision and bias of Clest when using derived models to estimate clearance. These error values can be used to assess the model in which the mathematically-derived parameter with the most precision and the least bias can be predicted. Those models in which the error values are the lowest are the best models.
To establish suitable LSS model(s) for estimating hepatic CYP3A activity in rats, we needed to perform a full-course blood sampling study, which requires multiple plasma samples (usually 8–10) to be collected. As an enzymatic activity-dependent drug, the underlying determinant for metabolism of MDZ (extraction ratio by liver is 0.34) 32 by the liver is the activity of CYP3A rather than the blood flow. It seemed that in this study there was no significant influence on liver metabolism of MDZ resulting from multiple sampling during the course of the test to establish the LSS models. In practice, however, it is difficult to conduct such a sample collection regime during a short period (e.g. 2 h) in a single rat because the blood volume of rats is so limited. A plot of the concentration–time curve usually requires that samples be collected from several rats. The establishment of LSS should reduce the need to use a large number of animals for determining the pharmacokinetic profile of a drug to and therefore promote the 3R principles. 8 On the other hand, all the sampling in this study was conducted on anaesthetized animals rather than conscious ones, which constitutes a refinement to the ‘3Rs’, as stress and distress should be taken into account because of their relevant physiopathological effects.
Four of the LSS equations that were generated from our training set using different subsets had r 2 values that were greater than 0.80 (90 min, 60–90 min, 30–60–90 min, 30–60–120 min). Although single sampling at 90 min was the most convenient LSS, the three-point LSS in which the plasma concentrations were measured at 30 min, 60 min and 120 min gave the best r 2 value (0.97). However, all four LSS, each of which had a good coefficient of determination, were then used to predict the clearance of MDZ in rats in which liver metabolism was reduced by ketoconazole. The values of Clest were closely correlated with those of Clobs and had acceptable MPE and MAE values.
The results of this study indicated that the LSS that was developed using rats that were pretreated with different doses of ketoconazole, which is a specific CYP3A inhibitor, as the training set can reliably predict Cls of MDZ. In other words, the equations generated using LSS can be used to predict hepatic metabolism.
In conclusion, the application of LSS in which up to three blood samples are taken from a single animal instead of taking multiple blood samples from many animals in order to phenotype hepatic metabolism of the rat advances the 3R principles because: (1) it reduces the number of animals but still maintains the quality of the science and (2) refines the procedure because it improves the welfare of individual animals. Furthermore, this in vivo method showed advantage over any in vitro method using liver extracts. First, it avoids discrepancy when extrapolating the in vitro results to in vivo. Secondly, the animals will be still living after the limited sampling. The application of LSS also has large cost- and time-saving benefits.
Footnotes
ACKNOWLEDGEMENT
This work was supported by a grant (No. 2004CB518902) from the National 973 plan fund.