
Abstract
This study evaluated whether the automated behaviour recognition software ‘HomeCageScan’ (HCS) could detect behaviour changes and any positive analgesic effects in two mouse strains undergoing vasectomy (C3H/HeNCrl and C57BL/6). Another objective was to test the effectiveness of HCS in differentiating between the effects of each treatment relative to conventional manual analysis. Each control (unoperated) group consisted of four mice of each strain. They were either untreated mice, mice given meloxicam alone (10 mg/kg) or mice given either saline or meloxicam (10 mg/kg) 30 min prior to isoflurane anaesthesia. The vasectomized mice received either saline or meloxicam at 5, 10 or 20 mg/kg, again, 30 min prior to isoflurane anaesthesia. Filming began one hour following surgery. Each mouse was filmed for 6 min for the manual analysis and then for a further 20 min for analysis with HCS. In a time-matched test, HCS and the manual analysis produced activity data that generated identical conclusions regarding treatment effects and strain differences. Both HCS and the manual analysis found the C57BL/6 controls were overall more active, but not following vasectomy, when both types of analysis detected markedly reduced activity. Low-dose meloxicam (5 mg/kg) had a positive effect on postoperative mobility in the C3H/HeNCrl mice; however, increasing the dose rate progressively reduced this. These effects were also detected with the manual analysis. Overall, HCS provided a sufficiently accurate and rapid method of analysing mouse behaviour encouraging more prolonged assessments in the future. This capability and the possibility of training the software to recognize a greater range of behaviours, including pain-specific indicators, should be of considerable value for assessing postoperative behaviour in both mice and rats. This would allow analgesic requirements to be investigated in a greater range of rodent models than is currently feasible with conventional analysis methods.
Analysing behaviour changes in both experimentally induced and clinical pain states in animals can be an effective means to assess both pain severity and analgesic efficacy. As an integrated response to complex nociceptive stimuli, such analyses offer a more clinically relevant method of assessing analgesic effects than analgesiometry. However, studying behaviour in sufficient detail to detect pain-related behaviour changes and the effects of drugs upon these is extremely time consuming, so studies often only assess a limited range of behaviours, 1,2 or assess for a relatively short time. 3–5 Until recently, automated behavioural analyses have utilized activity monitoring based on infrared technology, 6 simple wheel running 7 or activity recorded via telemetry implants. 8,9 There has recently been a major expansion in the use of genetically-altered mice, and many of these animals require phenotyping to determine the effects of the altered genotype on the animals' physiology, cognition and behaviour. The resources needed to conduct phenotyping tests can be extensive, especially the time requirement. Another drawback is that the common tests measure responses to tasks designed to inform on changes in motor, sensory and cognitive capabilities, rather than spontaneous behaviour per se. Tests of changes in spontaneous (unprovoked) behaviour are the most time consuming of all (such as open-field tests). New advances in motion tracking software, such ‘Phenotyper’ and ‘Ethovision’ (Noldus Information Technology, Wageningen, The Netherlands) provide more detailed information on locomotion than simple beam-breaks, and data can now be obtained describing not just the animals' position, direction of travel, distance travelled, velocity and approach/avoidance behaviour. The main advantages of these methods over conventional behaviour analysis are the capacity to collect data continuously and in a standardized manner, so variation and error should be minimized. As such they have potential to be used to monitor postoperative behaviour, and changes in this due to pain. However, behaviour changes that are caused by pain are often complex, subtle and unpredictable, 5 especially in highly active animals such as mice. Thus, to be truly effective, an automated system is needed that not only monitors where an animal is, and how it got there, but also what it is doing at any given moment. ‘LABORAS’ (Laboratory Animal Behaviour Recognition and Analysis System; Metris BV, The Netherlands), in addition to providing data on position, speed and distance travelled, uses movement-associated vibrations to identify seven types of ongoing behaviour. 10 ‘HomeCageScan’ (HCS; CleverSys Inc, Reston, VA, USA) is another software-driven system that can also analyse parameters on locomotion, however, the developer's claim that it can quantify over 38 different mouse behaviours. It has been validated for processing both normal mouse behaviour and for monitoring the progression of neurodegenerative disease. 11 The most innovative and relevant features of HCS are its unique capacity to allow online review and fine tuning of the behaviour recognition parameters, and that it can be user-trained to recognize new, potentially important activities. In the present study, we sought to make a preliminary comparison of the results of HCS with data obtained manually, where Wright-Williams et al. 5 showed strain-specific effects of surgery (vasectomy) and analgesic treatments on the behaviour of mice. The training capabilities of HCS were not under investigation. The main objective was to assess the precision of HCS relative to an experienced human observer in differentiating between the pre- and postoperative behaviour of groups of mice undergoing anaesthesia and given different doses of an analgesic.
Materials and methods
All procedures were conducted in accordance with the Animals (Scientific Procedures) Act 1986 and with the approval of the local ethical review committee. The experiments also adhered to the guidelines of the Committee for Research and Ethical Issues of the International Association for the Study of Pain (IASP).
Animal husbandry and study design
The animals were groups of 32 C3H/HeNCrl and 34 C57BL/6 inbred male mice aged 10 weeks on arrival. These required vasectomy for use in our Institute's transgenic mouse production facility and were obtained from a commercial supplier (Charles River, Margate, UK). They were housed singly upon arrival in MB2 cages (Tecniplast UK Ltd, Northants, UK) for two weeks to acclimatize prior to the study. Sawdust (Gold Chip, BS and S Ltd, Edinburgh, UK) was used as bedding. Room temperature was maintained at 21 ± 1°C with 15–20 air changes per hour. A 12 h light-dark cycle was used, with lights going off abruptly at 19:00 h. Food (R and M No. 1, SDS Ltd, Essex, UK) and water were supplied ad libitum. Animals were weighed for one week prior to surgery, the day of surgery, and then for five days.
Four mice of each strain were randomly allocated to one of eight treatment groups (Table 1). Groups 1–4 were controls that underwent either no treatments whatsoever (group No), or received only 10 mg/kg meloxicam subcutaneously (s.c.) (NoM10), anaesthesia only (ASa) or both 10 mg/kg meloxicam (s.c.) and anaesthesia (AM10). The vasectomy groups (5–8) all underwent anaesthesia and received either no analgesic (VSa) or meloxicam at 5, 10 or 20 mg/kg (s.c.) prior to surgery (groups VM5, 10 and 20, respectively). Vasectomy was conducted via an incision in the abdomen (details below). Injections of saline or meloxicam were given s.c. 30 min prior to anaesthesia, or 105 min prior to filming (groups 1 and 2 were filmed only). Husbandry conditions (handling times and movements from the holding room to theatre, etc.) were as far as possible identical across groups. A blocked design ensured variation in the time of day that animals in each group underwent surgery were balanced across treatments.
Treatment groups (n = 8 per group)
Experimental procedure
Surgery began at 08:00 h, with the same surgeon operating on all mice. The mice were moved to the operating theatre before surgery began, and injections given at the appropriate time. Anaesthesia was induced with isoflurane in oxygen (induction 5%, 5 L/min; maintenance 2.5%, 1 L/min). The mice were then placed on bedding (VetBed, Kennel Needs and Feeds, Morpeth, UK) on a heating blanket (Harvard Apparatus, Edenbridge, Kent, UK) to maintain body temperature. The lower abdomen was shaved and the skin sprayed with chlorhexidine (Hydrex Derma Spray, Adams Healthcare, Leeds, UK). Surgery consisted of a 1.5 cm transverse incision through the skin and the abdominal muscle wall. The vas deferens was identified and approximately 0.5 cm was removed using cautery. The incision in the abdominal muscle wall was closed with 5/0 polyglactin 910 (‘Vicryl’, Ethicon Ltd, Edinburgh, UK) and tissue glue was used to close the skin (‘Nexaband’, Abbot Laboratories, Queenborough, Kent, UK). Anaesthesia lasted 15 ± 2 min. The animals then recovered in an incubator maintained at 28 ± 3°C for one hour. They were then removed from the incubator and individually transferred to a quiet room for filming. Video-recording for manual behaviour analysis then began; 6 min in a clear cage (Type 1144B, Tecniplast UK Ltd) using a digital video camera (Sony DCR-VX2100E, Sony, Japan). The camera operator remained in the room and used a tripod to track the mouse movements closely so that subtle activities would be observable later. The mice were filmed again to obtain data for analysis with HCS. They were placed into an identical, adjacent cage for filming for a further 20 min, but this time with the camera fixed. This was because an unchanging background was essential for successful functioning of the software. The longer recording period was to take advantage of the system's capability to analyse over longer times, and so maximize the likelihood of differentiating between the behaviour of the various groups. The filming cages contained sawdust bedding but no food or water. These were considered unnecessary during such a short period of filming. Excluding the opportunity for the mice to ‘hide’ under a food hopper meant that they were visible at all times and so this also improved the data quality. At the end of filming, the mice were returned to their home cages and kept in a warm room (24 ± 1°C) for 24 h to aid recovery.
Data processing
The videotapes were digitized in MPEG1 format and transferred to a PC. The manual analysis was conducted by one treatment-blinded researcher using ‘The Observer Video Pro’ (Version 5.0, Noldus Information Technology, Wageningen, The Netherlands). Full details of the ethogram and of the results of the manual analysis are reported elsewhere. 5
The HCS software processes digitized video footage by extracting the moving image of the mouse from the unchanging background of the cage. A demonstration version of HCS is available (
The behaviours used and their re-class(ification) for analysis with HomeCageScan. Also given is a description of each new pooled behaviour category
Statistical analysis
All statistical analyses were conducted using SPSS software (SPSS Inc). Details of the manual data analysis are given elsewhere. 5
The Kolmogorov-Smirnov test and Levene's statistic were used to test for normality and homogeneity of variance, respectively.
The body weight data met the necessary assumptions for parametric analysis and were analysed using the univariate GLM procedure to identify significant changes due to surgery, strain and individual treatment effects. Since the C3H/HeNCrl mice were initially marginally heavier (27.2 ± 1.4 vs. 26 ± 1.3), all body weight comparisons were based on percentage changes from the morning of, to the day following surgery. Individual percentage weight changes were calculated for each mouse and then the group averages were compared with surgery and strain as the ‘between-subjects’ factors. Comparisons between individual treatment groups were made for each strain with Dunnett's correction of probability level.
Exploratory analyses allowed separation of the various activities by their relative frequency and by their change in response to surgery and saline or drug treatments. For example, as shown in Table 2, ‘slow walking’, ‘remain low’ (normal posture for walking) and ‘turn’ were the most frequent exploratory movements in the control groups and all tended to reduce in response to surgery (Active 1). Similarly, Active 2 included the slightly less prevalent reciprocal activities ‘rear up’ and ‘come down’; rearing virtually always preceded ‘come down’. Sniffing was an activity that HCS always scored while the animals were rearing. This was because the system recognized it by a lateral head movement during (attentive) rearing. Because of this it was included in the Active 2 category. Conversely, Inactive 1 and 2 consisted of relatively sedentary activities that occurred less often, and all tended to increase following surgery. This classification process reduced the number of variables analysed to six. The behaviours shown in Table 2 that were not used were excluded, either because they occurred very infrequently or there was no relative difference in occurrence between treatments. Activities related to feeding were irrelevant as no food hopper or water bottle was present during filming. The data for Active 1–4, Inactive 1 and the data on total distance travelled were normally distributed and were compared between groups using GLM. However, as these variables failed Levene's test for homogeneity of group variance, post hoc comparisons between the individual treatment groups were made with Dunnett's C test. Various transformations of the data for Active 5 and Inactive 2 failed to meet the assumptions of parametric analysis, so were analysed using the Kruskal-Wallis test (results denoted by KW). Here, levels of significance for comparisons between the individual treatment groups underwent probability correction (multiplying the relevant probability level by the number of individual comparisons). Means are quoted in the text ±1 SD. The figures show mean values ±2 SE.
Manual versus automated data collection
A two-tiered approach was used to assess the relative merits of the manual analysis and HCS. First, it was necessary to establish the accuracy of HCS in quantifying behaviour relative to conventional scoring. This was followed by a test to determine which approach recorded superior group differentiation according to behaviour.
HomeCageScan versus manual analysis: accuracy
The assessment of accuracy was based on a relatively simple comparison. This assumed that the results of the manual analysis were accurate with respect to two straightforward activities; walking and rearing. The two methods were compared using data on the percentage in each of these relative to normal behaviour (group No). A repeated measures ANOVA was used with strain and treatment as the between subjects factors, and ‘method’ (two-levels) as the within subjects factor. For reasons already given, the analysis could only use data collected during the first 6 min of the HCS analysis as this was the maximum time in the manual analysis. Post hoc paired t-tests were used to assess any individual within-treatment differences between the HCS and manual analysis for each strain.
HomeCageScan versus manual analysis: group differentiation
We wished to determine whether HCS was more capable of differentiating between treatment groups due to its greater capacity to record more widespread changes in behaviour. The data obtained from the manual analysis and those produced by HCS following analysis of the second 20 min period of video footage were subjected to canonical discriminant analysis (DA). This is an established technique for determining the relative contribution of different types of behaviour to treatment effects, and for identifying groups of closely related activities. 12–14 Separate analysis procedures were conducted for each method and each mouse strain. The DA scores assigned to individuals undergoing each treatment were then plotted (Figure 1) to permit visualization of group separation and treatment effects. The behaviour changes that were primarily responsible for differences between treatments were those that were most closely correlated with each canonical function.
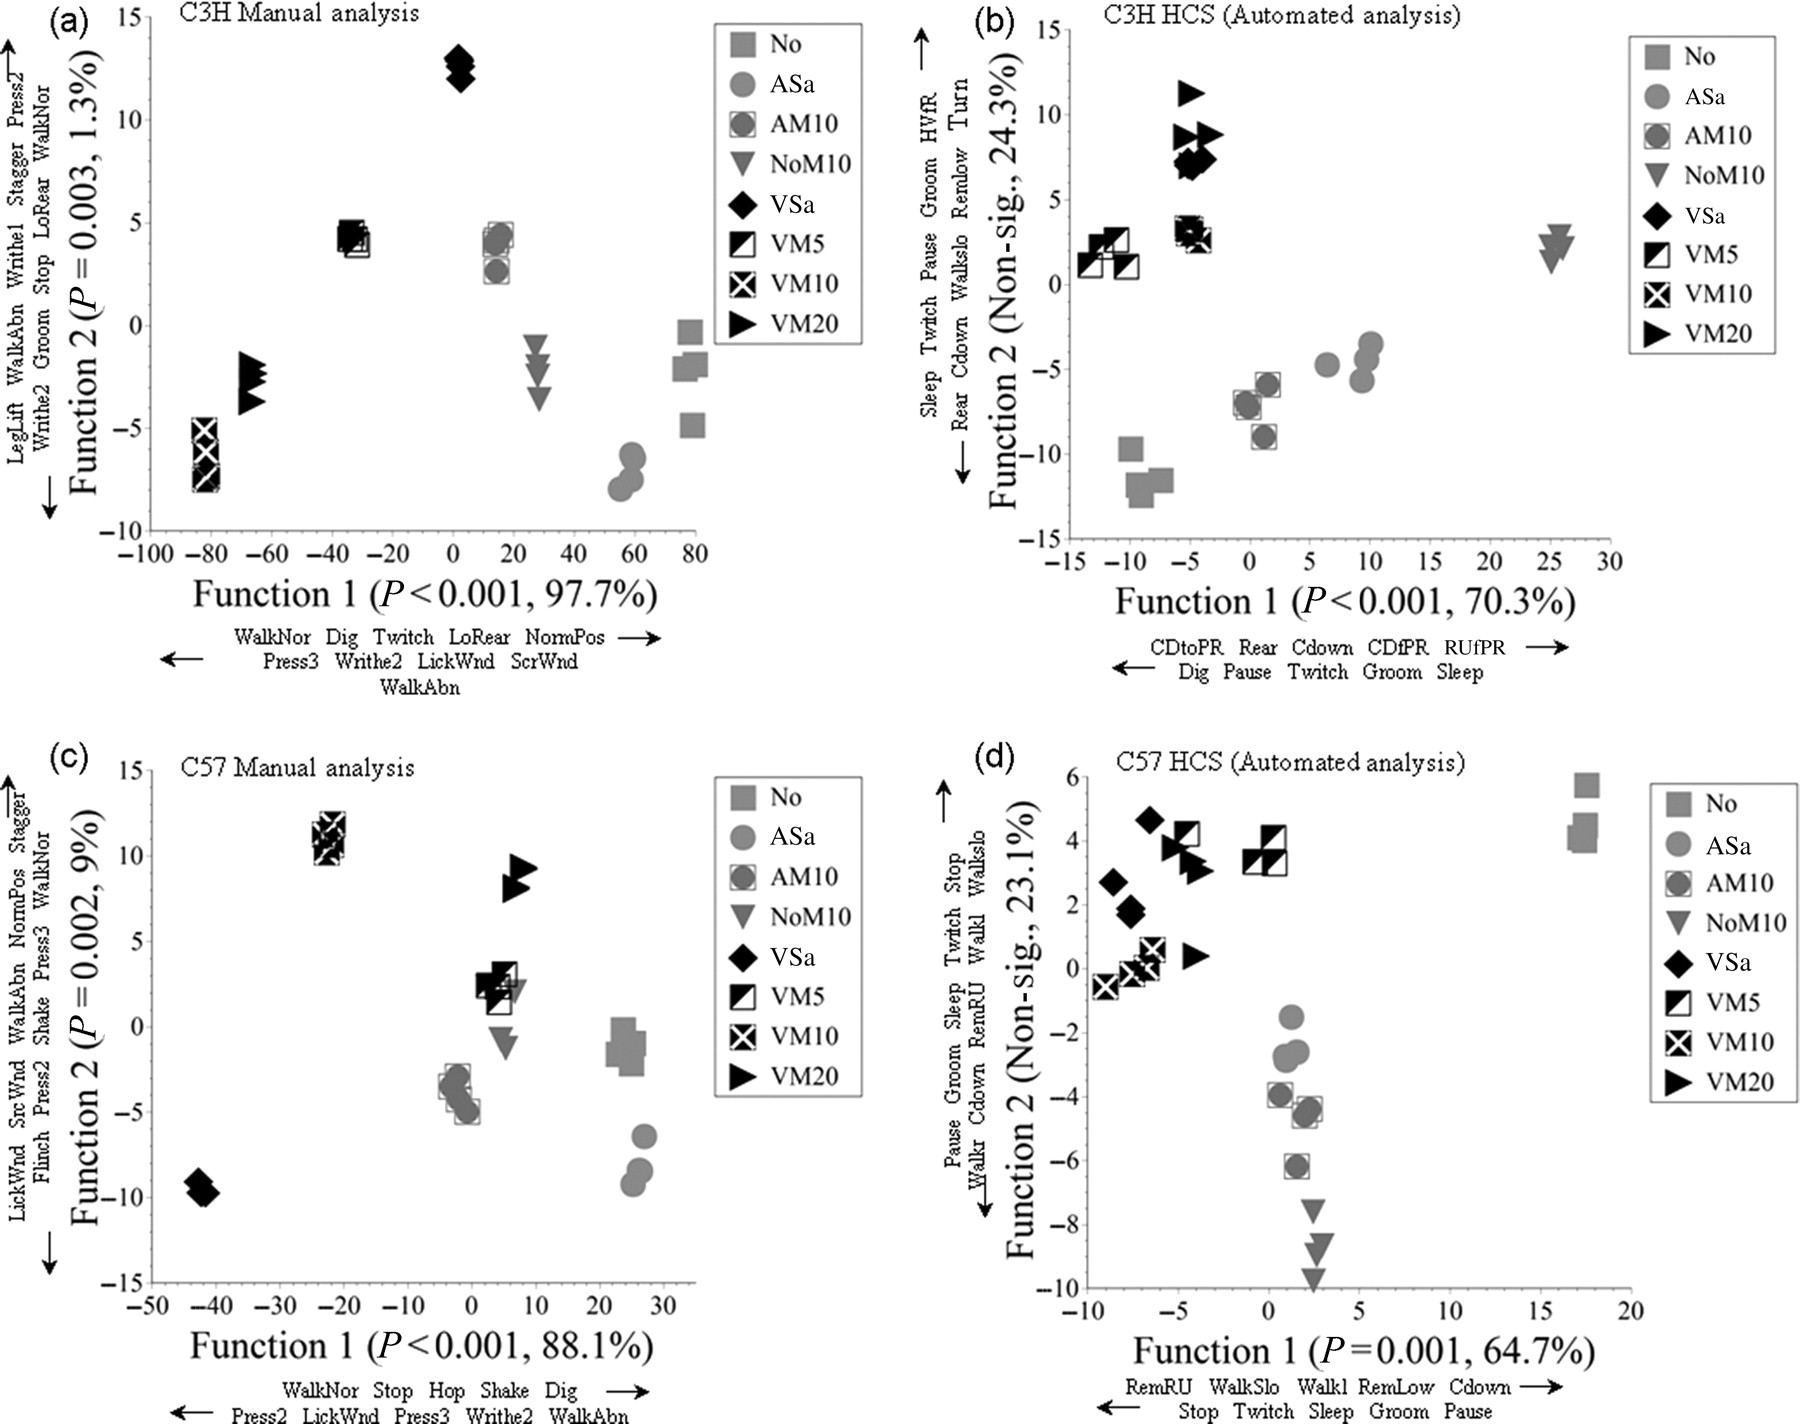
Plots of canonical discriminant scores assigned to individual mice of each strain in each treatment group: (a) C3H/HeNCrl manual analysis; (b) C3H/HeNCrl HomeCageScan (HCS); (c) C57BL/6 manual analysis and (d) C57BL/6 HCS. Data on the significance of each function in separating groups, and the percentage contribution of each function to between-groups variance are given adjacent to each axis label. Axes also show data on the behaviours primarily responsible (most highly correlated with each function) for group separation. Arrows denote behaviours that correlate positively (increase) or negatively (decline) with each canonical function. Manual analysis behaviour definitions (other than self-explanatory) (a) and (c): ‘Dig’, foraging; ‘Flinch’, momentary abdominal muscle contraction; ‘LegLift’, lift rear leg – usually combined with press or writhe; ‘LickWnd’, lick wound; ‘LoRear’, low rear; ‘NormPos’, normal (crouched) posture; ‘Press2/3’, press abdomen to floor (3 more severe); ‘ScrWnd’, scratch wound; ‘Stagger’, momentary balance loss; ‘Stop’, cease walking; ‘Twitch’, brief contraction of back muscles (fur on back moves); ‘WalkAbn’, abnormal walking (poor gait); ‘WalkNor’, walk normally; ‘Writhe1/2’, contraction of flank muscles (2 more sever/prolonged). HCS analysis behaviour definitions (b) and (d): ‘CDfPR’, come down from partially reared; ‘Cdown’, come down; ‘CDtoPR’, come down to partially reared; ‘Dig’, substrate digging/foraging; ‘Pause’, cease movement momentarily; ‘RemLow’, remain crouched; ‘RemRU’, remain rear up (maintain bipedal stance); ‘RUfPR’, rear up from partially reared; ‘Sleep’, >10 s inactivity; ‘Stop’, cease walking; ‘Twitch’, any sudden movement following stop; ‘Walkl, Walkr’, walk to left or right, ‘Walkslo’, walk slowly
Results
Body weight changes
Only the untreated C3H/HeNCrl controls (group No; Table 1) maintained their body weight (Figure 2). Even the untreated C57BL/6 mice showed a small average weight loss, and all other groups that underwent treatment also lost weight. The average weight loss in all of the C3H/HeNCrl control groups was (2.3 ± 2.1%), which was similar to the change in the equivalent C57BL/6 control groups (2.8 ± 3.1%). With surgery and strain as ‘between-subjects’ factors, the analysis showed vasectomy caused significantly greater weight loss in the C57BL/6 mice (Surgery × Strain P < 0.001; 8.1 ± 3.2% vs. 3.9 ± 2.4%). Multiple comparisons were then used to identify individual group differences for each strain. The C3H/HeNCrl mice in group VSa lost 5.7 ± 1.7% and those in group VM10 4.7 ± 1.8%, both have significantly greater losses than occurred in the untreated C3H/HeNCrl group (P < 0.01, P = 0.03, respectively). The C3H/HeNCrl mice showed no other significant group differences. The C57BL/6 mice showed the greatest overall weight loss due to surgery, and surprisingly, those given 20 mg/kg meloxicam lost more weight than any other group (10 ± 1.4%); significantly more than in the untreated C57BL/6 controls (No; 2.6 ± 4%, P = 0.03), the C57BL/6 anaesthesia only group (ASa; 1.7 ± 3.9, P = 0.013) and more than the C57BL/6 meloxicam alone group (NoM10; 1.3 ± 1.3, P = 0.008). Conversely, preoperative meloxicam caused a statistically insignificant but nevertheless noticeable tendency towards improved body weights in the C3H/HeNCrl mice (VSa vs. VM5, 10 or 20).
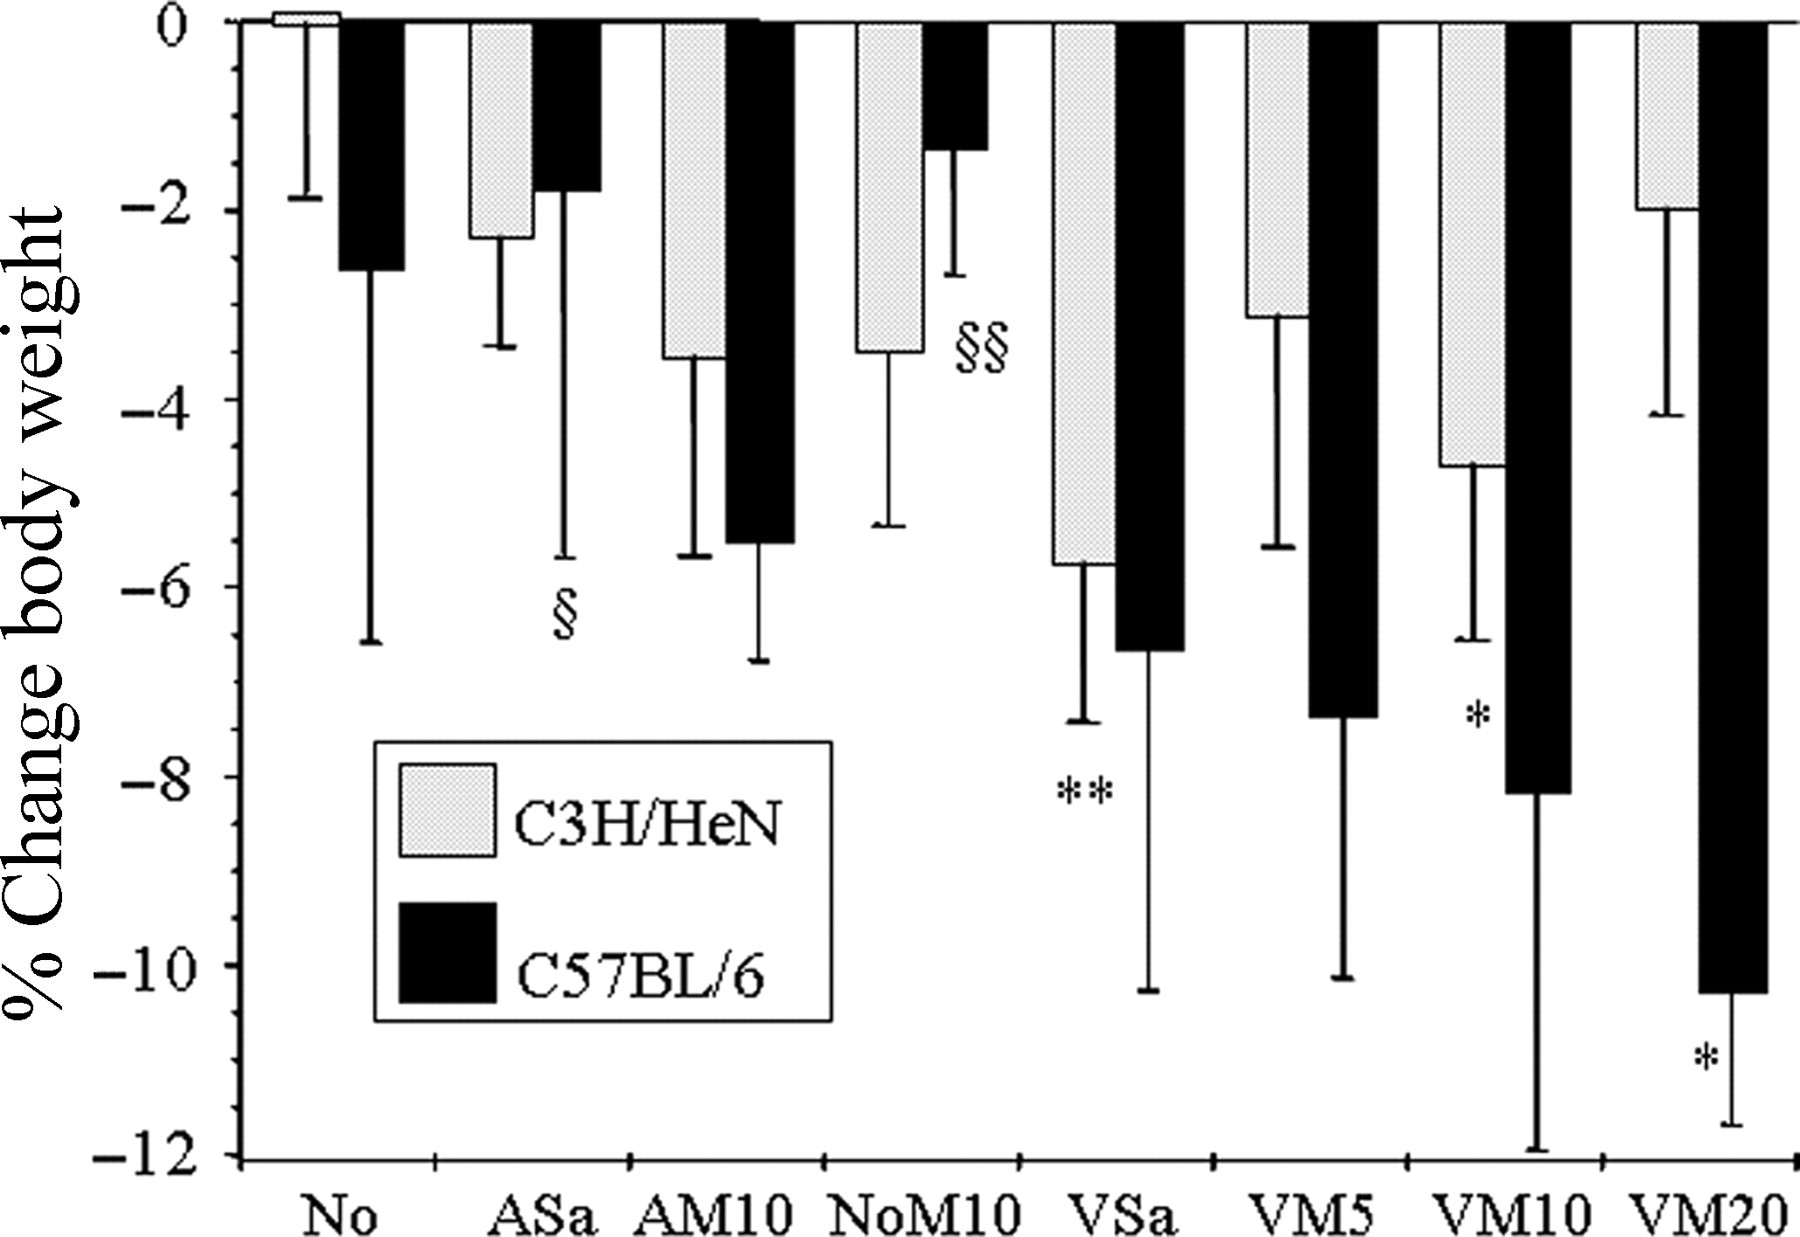
Percentage change in weight, from the morning of surgery to the first postoperative day for each strain and treatment group (mean ± 2 SE). Also shown are the results of individual comparisons between groups for each strain. Symbols indicate significance level: compared either with group No, *(P < 0.01), **(P < 0.001); or compared with VM20, §(P < 0.05), §§(P < 0.01)
HomeCageScan
HCS showed significant differences between the behavioural responses of the two mouse strains to the control treatments and also to surgery. Collectively, the C57BL/6 controls were more active, with more frequent walking and turning while crouched (Active 1, P < 0.01 [Figure 3a]; Active 4, P < 0.001 [Figure 3d], and so travelled further during the 20 min recording period (18 ± 4.7 vs. 11 ± 4 m; P < 0.001, [Figure 4]). The C3H/HeNCrl mice showed more frequent transitions between crouching and partial rearing (Active 3; both following the control treatments [Figure 3c; P < 0.01] and vasectomy [P = 0.023]). The C3H/HeNCrl controls were less active (Inactive 1 frequency was greater, P < 0.01 [Figure 5a]), but not following vasectomy when the C57BL/6 mice were overall marginally more inactive (P = 0.043). Inactive 2 showed no significant strain differences. Distance travelled was also not significantly different between strains in the groups that underwent surgery. Digging and foraging behaviours (Active 5) almost exclusively occurred in the C57BL/6 control mice (Figure 3e; P < 0.001) and comparatively little of this behaviour occurred in either strain following surgery.
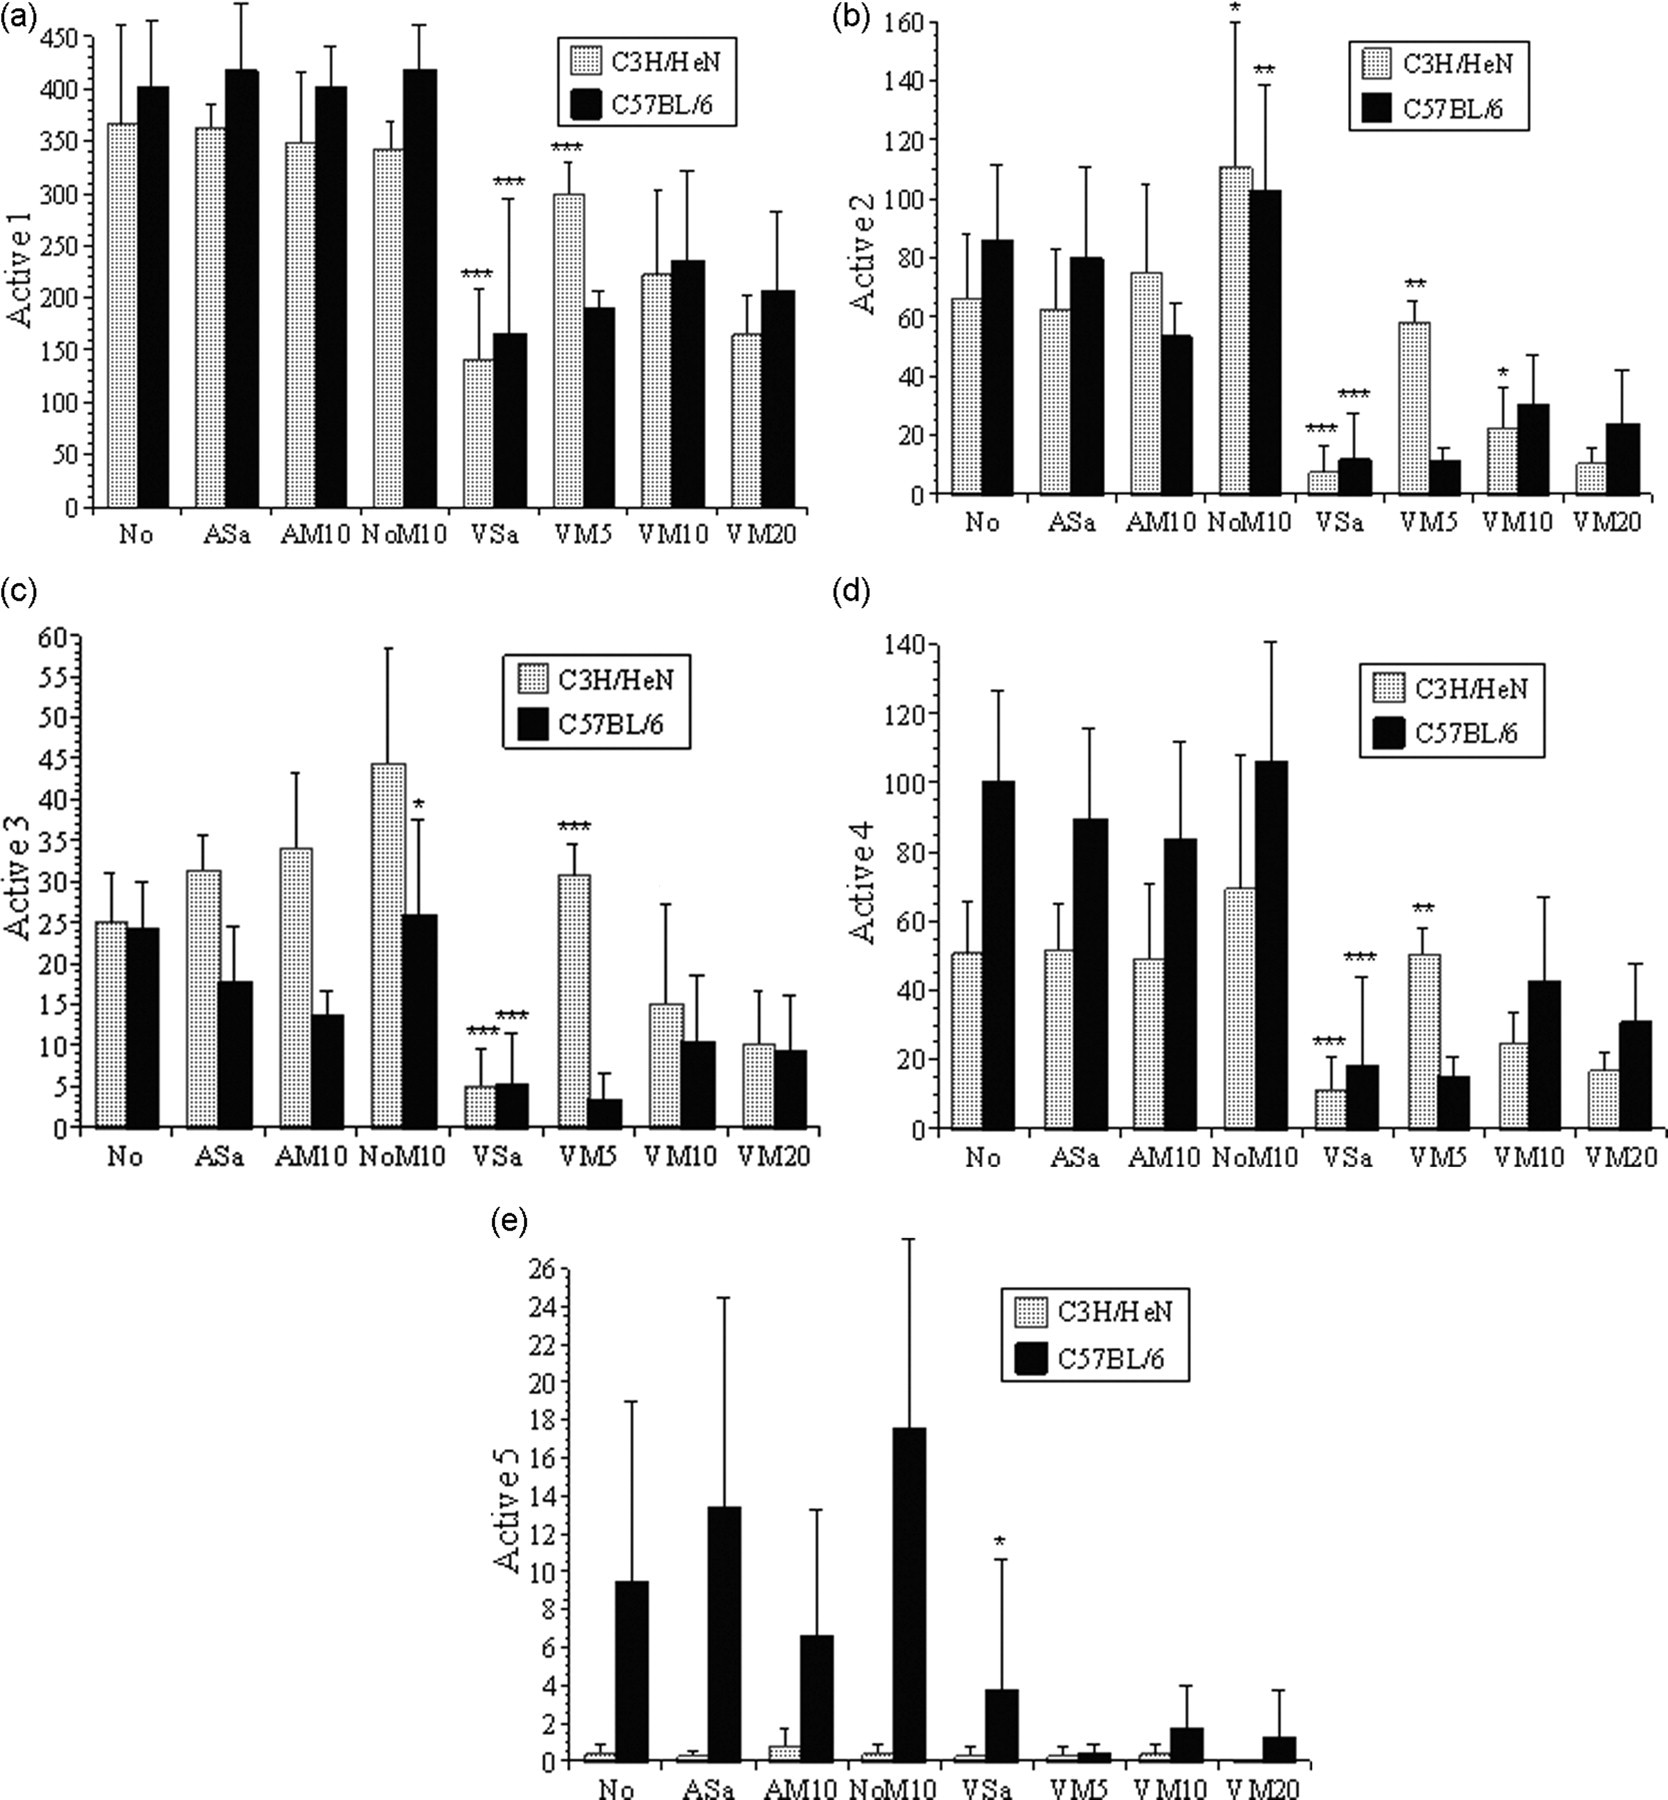
The mean frequency (pooled mean total for 20 min ± 2 SE) of behaviours comprising Active 1–5 (Figures 3a–e, respectively). Symbols indicate levels of significance for individual comparisons of adjacent treatment groups for each strain: *(P < 0.05), **(P < 0.01), ***(P < 0.001). As an example, Figure 3a shows a significant reduction in Active 1 behaviours in both strains (P < 0.001) when mice underwent vasectomy without anaesthesia (groups VM5) compared with mice that received only 10 mg/kg meloxican (group NoM10)
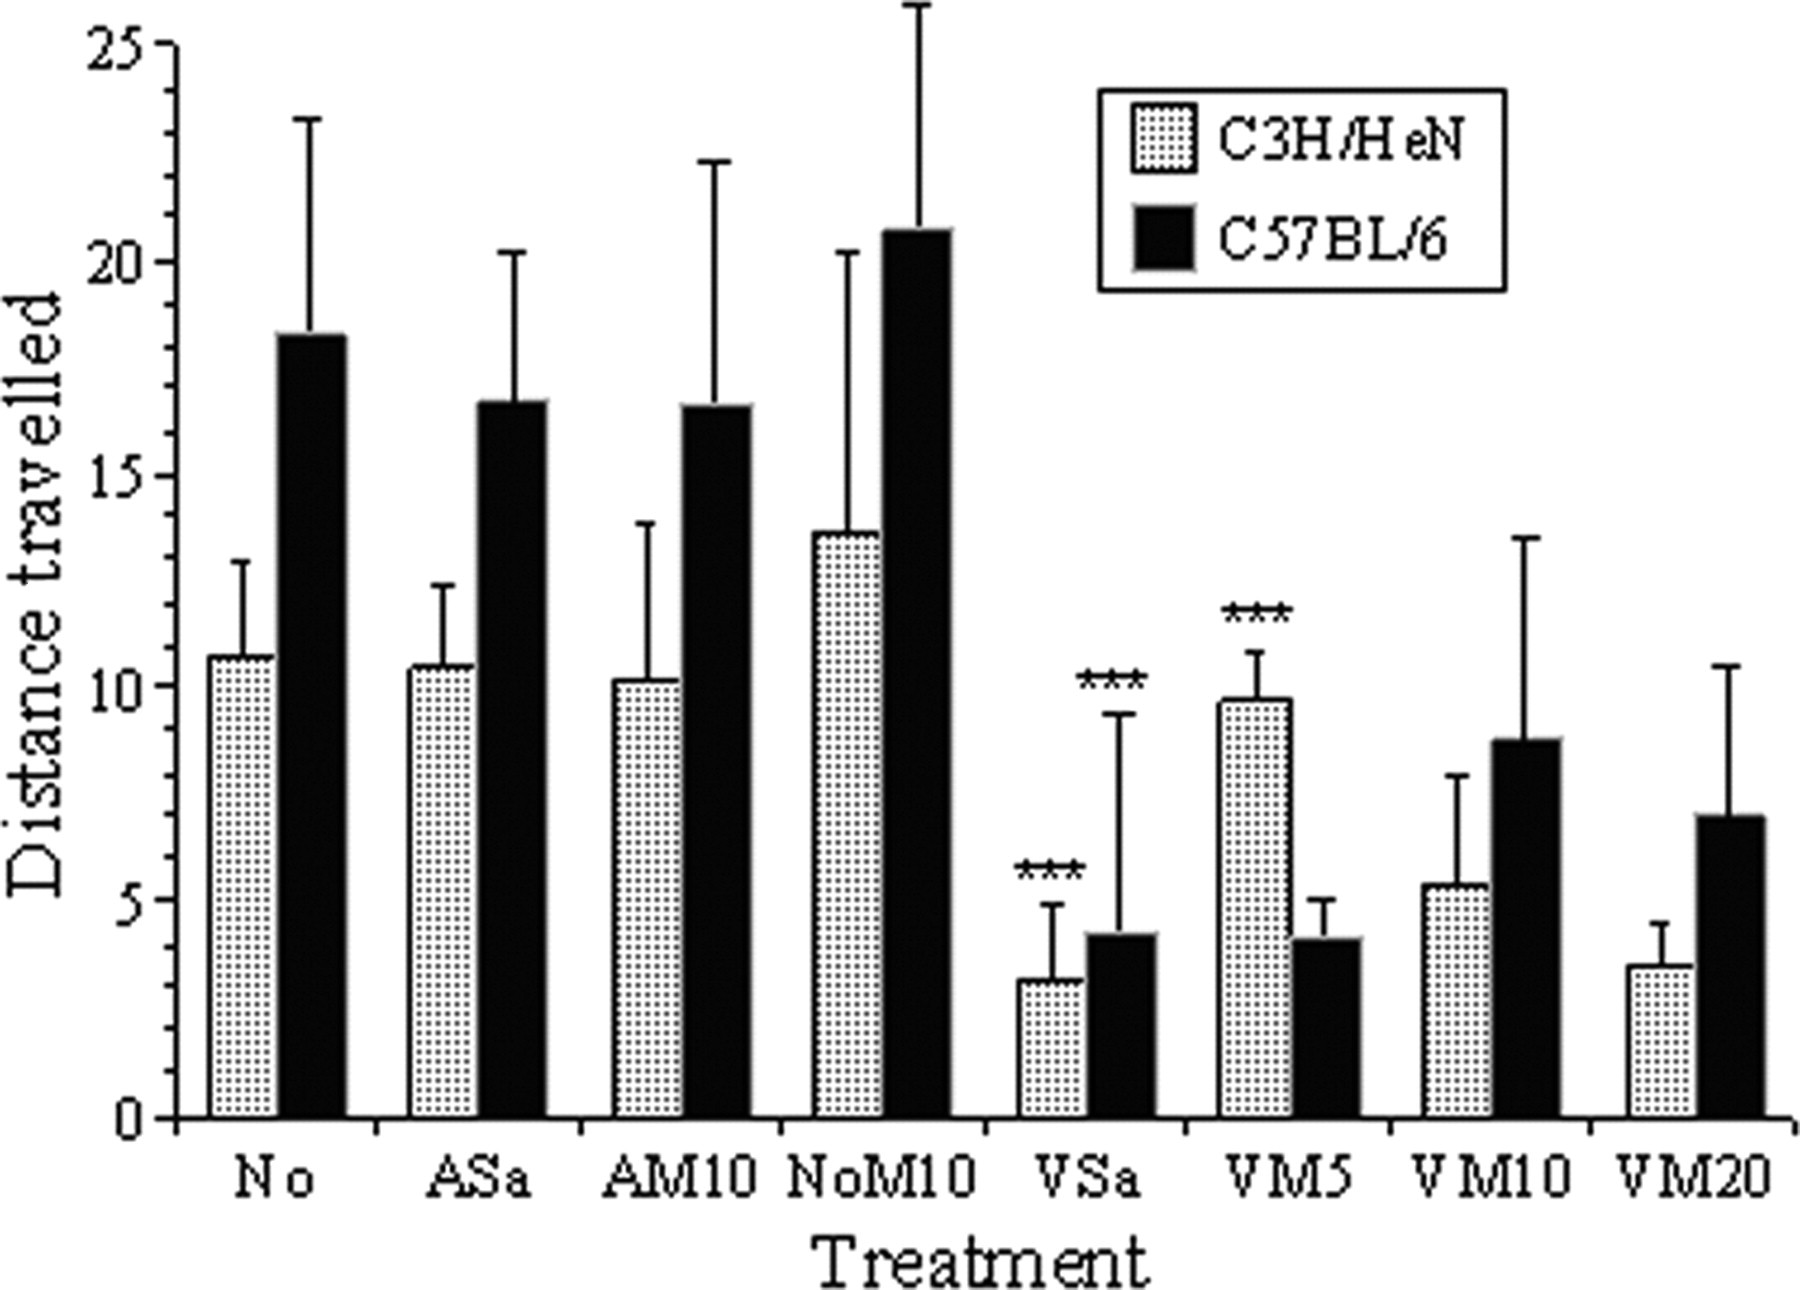
The mean total distance travelled by each mouse strain (metres in 20 min ± 2 SE) following each treatment. As in Figure 3, asterisks indicate the levels of significance found following individual comparisons of adjacent treatment groups for each strain; *(P < 0.05), **(P < 0.01), ***(P < 0.001)
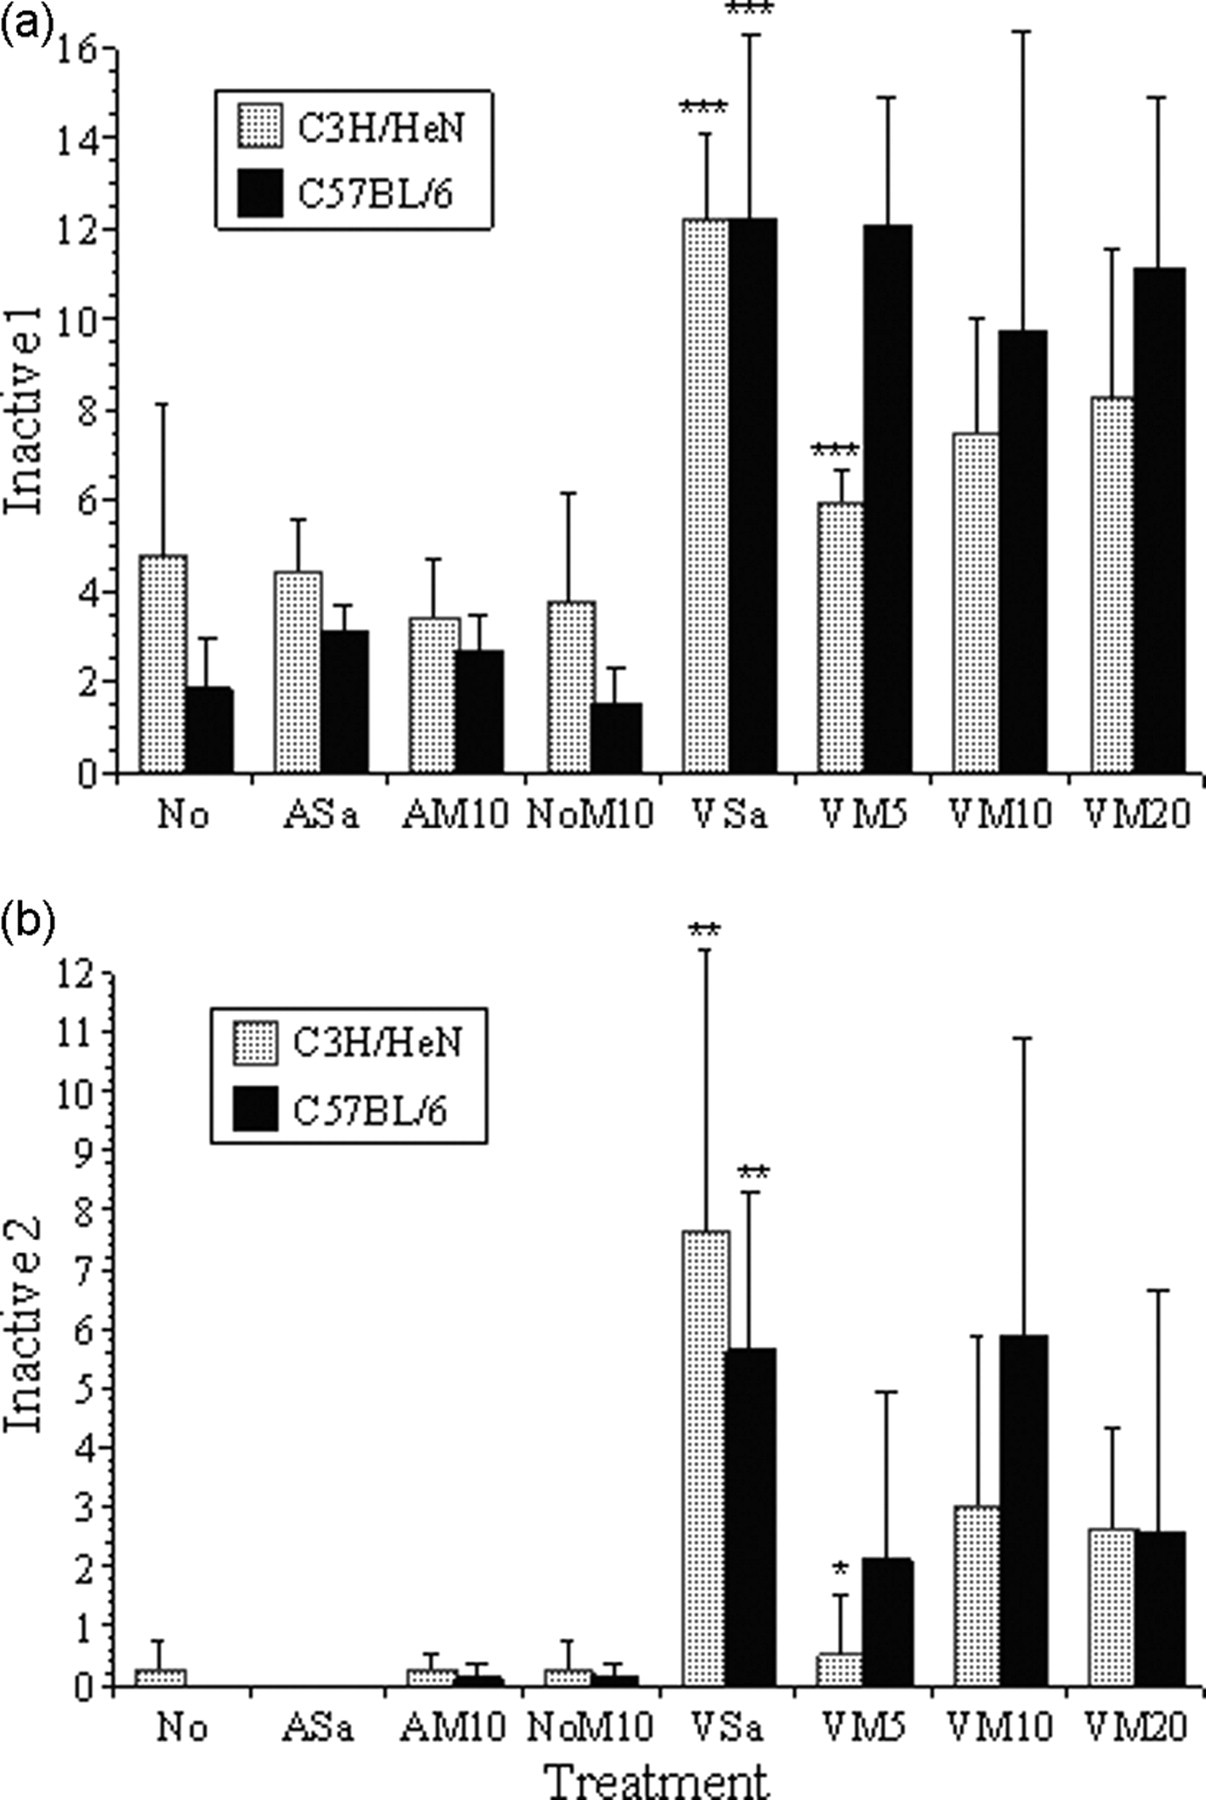
(a and b) show the mean frequencies of Inactive 1 and 2. Symbols indicate levels of significance for individual comparisons of adjacent groups for each mouse strain: *(P < 0.05), **(P < 0.01), ***(P < 0.001). As an example, Figure 5a shows a significant increase in inactive behaviour in both C57BL/6 and C3H/HeNCrl mice in group VSa compared with NoM10 (P < 0.001)
Surgery caused considerably larger overall changes in behaviour than any of the control treatments. In both strains, behaviour categories Active 1–4 were all significantly decreased following vasectomy (Figures 3a–d, P < 0.01, respectively). Unsurprisingly, inactive periods and grooming increased (Inactive 1; Figure 5a, P < 0.01). There was also a significant increase in non-directed sudden movements (Inactive 2; Figure 5b [KW], P < 0.001). The distance travelled also declined following surgery (P < 0.001), but this decline was even greater in the C57BL/6 mice (Surgery × Strain effect; P < 0.001).
Probability corrected multiple comparisons were used to detect individual differences in responses to the various treatments and Figures 3 and 5 indicate the results of comparisons of adjacent treatments for each strain. There were no significant differences between the control treatments for either strain with respect to the active behaviour categories 1, 4 and 5 (Figures 3a, d and e) or both measures of inactive behaviour (Figures 5a and b). Both strains, however, showed a significant increase in Active 2 following treatment NoM10 compared with AM10 (Figure 3b). Only the C57BL/6 mice showed this effect for Active 3 behaviour (Figure 3c). Compared with group NoM10, all of the non-analgesic vasectomized mice (group VSa; both strains) showed significant reductions in active behaviour 1–4, and accordingly, inactive behaviour significantly increased (Figures 5a and b), and the distance travelled declined (Figure 4, P < 0.001 for both strains). Giving progressively larger doses of meloxicam had no significant effect on this or any other behavioural class in the C57BL/6 mice. However, when given 5 mg/kg the C3H/HeNCrl mice became significantly more active; Active 1–4 increased, both inactive behaviour classes declined, and the distance travelled increased. Increasing the dose of meloxicam in the C3H/HeNCrl mice reversed this seemingly positive effect on active behaviour frequency and distance travelled.
HomeCageScan versus manual analysis: accuracy
HCS found relatively more rearing and walking in groups AM10 and NoM10 in the C57BL/6 mice (Figures 6a and b). Overall, however, the pattern of behaviour determined for each treatment was similar between the two analysis methods. The mean percentage change in the frequency of walking and rearing in each strain (relative to normal group; No) was not significantly different between the manual and HCS analysis (walking, C3H/HeNCrl, P = 0.7, C57BL/6, P = 0.06; rearing, C3H/HeNCrl, P = 0.85, C57BL/6, P = 0.62). There were also no significant within-treatments differences between the HCS and the results of manual analysis.
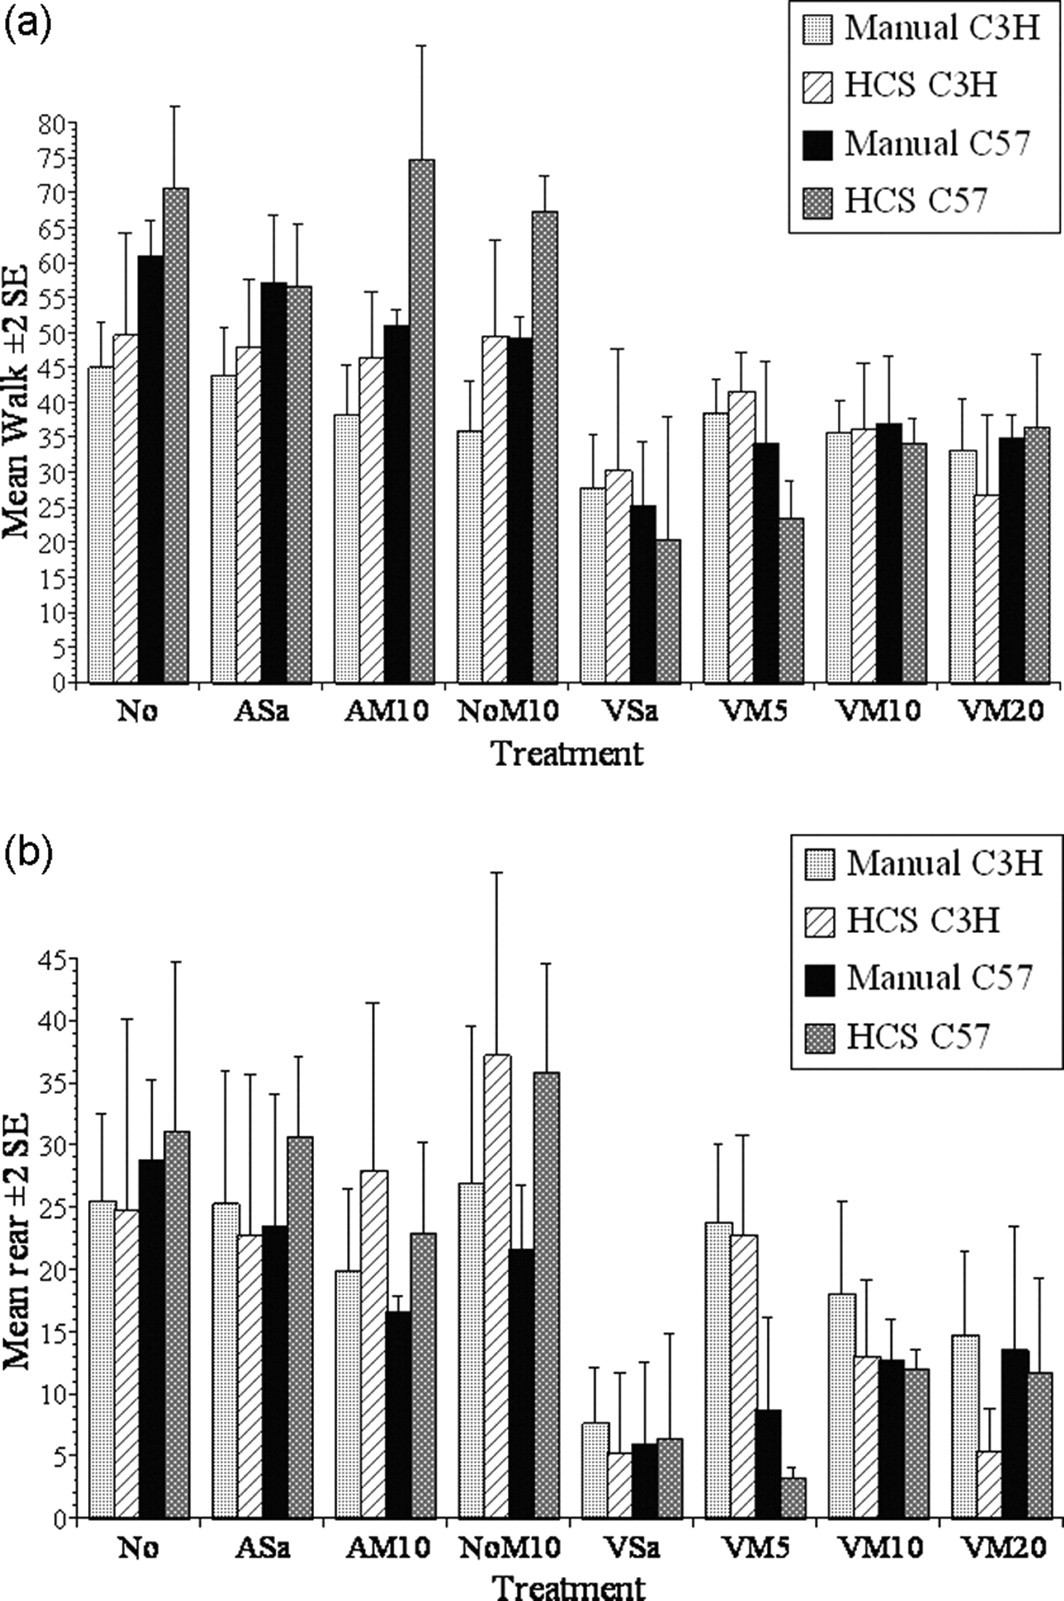
The results of manual behaviour analysis or analysis with HomeCageScan (HCS) showing the mean frequency of walking (a) and rearing (b) for each treatment and strain during the first 6 min of exploration in a new cage
HomeCageScan versus manual analysis: group differentiation
Figure 1 shows scatter plots of the discriminant scores generated by the analysis of the raw data obtained manually (a, c) and by HCS (b, d) following each treatment. Due to the obvious strain differences found with both manual data collection 5 and HCS, separate analyses were conducted for each strain. The figure axes list the activities that most closely correlated with each canonical function (those that made the largest contribution to group differences). Arrows indicate positive or negative correlations (right/up, positive; left/down, negative). Although no individual behaviours in either analysis showed a particularly strong correlation with a canonical function, they collectively contributed to significant group separation. DA of the manual data found the first two functions were responsible for significant separation of treatments applied to the C3H/HeNCrl mice (Figure 1a; Wilks' lambda; Function 1, P < 0.001; Function 2, P = 0.003). Function 1 explained 97.7% of the variation between the groups. Several activities that had been previously paired with signs of pain in rats, such as writhing and wound licking/scratching separated the surgery and non-surgery groups (black vs. grey symbols), whereas rearing and normal walking were more prevalent in the absence of surgery (Function 1). Contrary to expectations, higher doses of meloxicam correlated with pain-like behaviours, and less normal behaviour. With HCS (Figure 1b) only Function 1 was significant (P < 0.001), contributing to 70.3% of the variance. Here, rearing behaviours were responsible for group separation, mainly between-group NoM10 and the other treatments. Function 2 separated the surgery and non-surgery groups but not significantly so; inactive behaviour (sleep, twitch and pause), and rearing and walking were positively correlated with Function 2 which explained 24.3% of between-group variation. In the C57BL/6 mice (Figure 1c), both the first and second functions were significant in the manual analysis (Function 1, P < 0.001; Function 2, P = 0.002); Function 1 contributed 88.1% to the between-group variance. The separation of the surgery and non-surgery groups was less clear in these mice, but the VSa groups were separated from all other groups based on reduced walking, foraging, hop and shake (Function 1) and increased prevalence of the pain-like behaviours press 2 and 3, flinch, wound licking and writhing (Functions 1 and 2). With HCS, Function 1 was also significant in the C57BL/6 strain (P = 0.001; 64.7% variance contribution), but not Function 2. Here, the normal mice (group No) were separate from all other groups based on normal walking and rearing behaviours, and less inactive behaviours identified by HCS as sleep, groom, twitch and stop (Figure 1d). These behaviour changes also contributed to separating the other non-surgery groups from those that underwent vasectomy, but the distinction was less clear. As in the C3H/HeNCrl mice, Function 2 was not significant. Nevertheless, DA indicated the activities responsible for this were phenotypically similar to those highlighted in the manual analysis; reduced walking and rearing linked to surgery groups, and as with Function 1, increased sleep and grooming recognition, and also twitch and stop.
Discussion
Analysing behaviour changes is a standard approach to assessing animal pain and the effects of analgesics. The major drawbacks of this are the excessive time needed for analyses, observer bias and subjective selection of the assessment criteria. As far as we are aware, this is the first report on the use of the automated rodent behaviour recognition system ‘HCS’ in the study of postoperative pain.
Our initial objective was to assess the accuracy of the HCS results relative to conventional manual analysis. Accuracy was compared over a 6 min period using rearing and walking. Although there were no significant differences in the pooled totals for rearing and walking between the HCS and manual analysis, HCS tended to score each of these more frequently, particularly in the control groups. There are several possible explanations for this. HCS can be ‘fine-tuned’ for behaviour recognition and can be trained to recognize new activities. Here, however, we sought only to determine whether such modifications were necessary, thus, the preset configuration was used and we accepted that, initially, the data might substantially differ from that produced by a human observer. We also expected variation due to procedural differences, and carry-over effects due to sequential filming in different cages. It was not ideal that the filming for manual analysis always preceded HCS sessions; however, our primary objective was to obtain information on pain resulting from vasectomy, and whether this could be prevented by the treatment with meloxicam. The results of this are published elsewhere, 5 including the reasoning behind what might initially be considered excessive dose rates of analgesic. Briefly, this was because lower dose rates of meloxicam and other non-steroidal anti-inflammatory drugs (NSAIDs) were ineffective in terms of attenuating behaviour changes in mice. Testing the capabilities of HCS was an important but subsequent aim, so the order of filming for HCS versus manual analysis was not randomized. It was also essential that a camera operator remained in the room to collect the footage for manual analysis. This presence and the lack of food or water during filming (though essential) may have altered the behaviour of the mice. Considering all of this, we felt that the level of agreement between the HCS and manual analysis in quantifying rearing and walking was impressive (Figure 6).
These relatively simple behaviours were chosen; first, because they were likely to be the most clearly recognizable in each analysis method, but also, and indeed perhaps because of this, they have featured in several studies of pain in rats. 5,12,15 Both HCS and the manual analysis showed how, compared with controls, rearing and walking occurred less following surgery and that strain was a significant factor. However, no firm evidence that meloxicam improved postoperative mobility was obtained with either analysis method. This lack of positive analgesic effects did not, therefore, reflect poorly on the capabilities of HCS. The dose rates of meloxicam may have been insufficient, or individual animals may have been highly varied in the intensity of pain experienced, and/or in their responses to drug treatment. It may also be the case that assessing mobility alone does not provide a sufficiently sensitive measure of pain in mice.
The test of accuracy provided considerable reason for optimism, but did not allow us to gauge whether the increased capacity of HCS to collect behaviour data (>50 times faster than manual analysis) actually improved our ability to detect surgery, strain and drug-related effects. Since the comparison only used 6 min of behaviour data, in some respects accuracy was subsidiary to identifing periods of greatest behavioural change. DA has previously been utilized to identify postoperative pain-specific behaviour. 3,12,13 Here, it provided a convenient method to gauge the relative success of HCS in differentiating between the groups more broadly. The specific activities that each analysis used were therefore largely irrelevant; we had never intended HCS for routine pain monitoring, but as a tool to rapidly screen large volumes of behaviour data. Ultimately, it was hoped HCS would allow us to recognize periods of abnormal activity so information could be obtained on the critical times when detailed manual analysis might be necessary. DA showed both HCS and the manual approach could be used to recognize differences in the behaviour of the surgery and non-surgery groups. This was based on a significant reduction in activity levels following surgery and comparatively negligible deviation from normal in the control groups. In both analyses, there were few indicators than meloxicam had any positive effects, aside from a slightly improved level of mobility of the C3H/HeNCrl mice in group VM5 (Active 1–4, Distance travelled, Inactive 1 and 2; Figures 3, 4 and 5, respectively). Postoperative weight losses in this strain at higher meloxicam doses also tended to be less, which can also indicate reduced pain, but were not significant.
An interesting outcome was that both HCS and the manual analysis showed that larger doses of meloxicam, rather than having positive effects, actually reduced mobility in the C3H/HeNCrl mice. Compared with non-selective NSAIDs, meloxicam is known to have low gastrointestinal toxicity and a relatively high therapeutic range in animal models. 16 It is therefore highly unlikely that gastrointestinal (GI) and other toxic effects could explain these changes in mobility. Another unexpected result was that the C57BL/6 mice in group VM20 lost more weight than any other group. HCS also found rearing and associated activities (Active 2) increased in both strains when meloxicam was given alone (NoM10). This was not apparent when meloxicam was given prior to anaesthesia (ASa), or in the anaesthesia alone group (AM10). It was a difficult result to explain, especially since reduced rearing and other active behaviours correlated with treatments VM10 and VM20. Although this did not feature as a result of the manual analysis, it cannot immediately be dismissed as spurious. First, the manual analysis was conducted over a much shorter time period than HCS. Theoretically at least, increasing this time should provide greater sensitivity. It is also possible that partial rearing or highly rapid sequences of rearing were missed in these groups in the manual analysis. We have never before identified such apparently confounding effects of meloxicam either in rats or in mice. Such unexplained/unexpected results at least serve to reinforce the need to include appropriate control groups in studies of this type.
Overall, the data obtained manually provided superior differentiation between the surgery and non-surgery groups. This was not surprising. Decisions on which behaviours to score in the manual analysis were based on their likely relevance to pain assessment; this knowledge having been obtained from countless hours assessing the effects of surgery in mice. This meant that the ethogram used in the manual analysis focused on behaviours believed to be pain-specific (e.g. writhing, twitching, belly press, etc.) rather than on generalized levels of other activities. Now, we know the present capabilities of HCS; we hope to achieve greater precision by training the system to recognize these pain-specific activities, in addition to monitoring activity more generally. Virtually all estimates of analgesic potency in mice, and indeed other laboratory species, are based on the results of nociceptive testing. 17,18 The results of such tests are, however, notoriously variable. It has been reported that institutional differences and individual sampling errors can contribute to a 45% variation in the responses obtained. 19 The results of HCS should be relatively more robust, assuming the cage, camera placement and husbandry procedures are sufficiently standardized. The accuracy and fidelity of HCS could also be improved by further increasing the time period of the analysis. In the meantime, the fact that we were so rapidly able to obtain broadly similar conclusions to those obtained with manual data analysis provided much encouragement. These conclusions came at significantly less cost in terms of time than the manual method.
We are therefore confident that with further development HCS will soon provide a powerful tool for investigating pain responses and analgesic effects following various different types of surgery and other potentially painful conditions in mice, and eventually other rodent species.
Footnotes
ACKNOWLEDGEMENTS
We wish to thank Amgen and the UK National Centre for the 3Rs who sponsored this work.