
Abstract
Summary
The purpose of this study was to investigate the galactose single point (GSP) method, a residual liver function test recently recommended by the US Food and Drug Administration, which can be a useful tool for rat liver function measurement. Rats were treated either with carbon tetrachloride (CCl4) alone (1 mL/kg, intraperitoneally [i.p.]) for one day or with isoniazid (INH) alone (150 mg/kg, i.p.) or (in order to ameliorate the effects of INH) with a combination of INH and bis-p-nitrophenyl phosphate (BNPP) (25 mg/kg, i.p.) for 21 days. Hepatotoxicity was assayed by plasma aspartate aminotransferase (AST) and alanine aminotransferase (ALT) activities and scores of histological activity index-necroinflammation (HAI-NI) of the respective liver specimens. The GSP method in rats was defined by the galactose blood level after 60 min. Significant differences in GSP values were observed between controls and the CCl4-treated rats. After 21 days of treatment, no significant changes in AST and ALT values were observed among the control, INH and INH-BNPP groups. There were significant differences in average GSP values for controls (P < 0.001) and INH-BNPP (P < 0.001) compared with INH alone. Highly significant correlations (P < 0.001) were obtained between GSP and scores of HAI-NI for all the groups. GSP was concluded to be a more sensitive biomarker of INH-induced hepatotoxicity than AST or ALT in the rats. The GSP method has been proved to be a simple and useful tool for the quantitative determination of liver function in rats, which can possibly be extended to other animals.
Several tests, both invasive and non-invasive, have been used to assess hepatic function in rats, monitor the progression of hepatic injury and screen for liver disease. The usual parameters of hepatotoxicity include: (a) indicators of hepatocellular injury: alanine aminotransferase (ALT) and aspartate aminotransferase (AST); (b) indicators of hepatobiliary injury: alkaline phosphatase (ALP) and total bilirubin; (c) supplemental indicators of hepatic synthetic function: total protein, albumin, triglycerides, cholesterol, glucose, urea, activated partial thromboplastin time and prothrombin time (Weingand et al. 1996, O'Brien et al. 2002, Provost et al. 2003, Boone et al. 2005). Currently, there is no routinely used method to quantitatively measure the residual liver function in rats.
Quantitative measurement of the entire liver function involving all processes that take place in the liver is fundamentally not possible (Bircher 1986). A number of methods or drug clearance evaluations have been reported to estimate human liver function (Roberts et al. 1978, Homeida et al. 1979, Baker et al. 1983, Renner et al. 1984). The use of drugs as liver function indicators may increase the burden on liver cells, as well as a certain degree of damage. Measurements of the metabolic capacity of a certain compound, such as galactose, can assume a metabolic rate-limiting step in the liver, making it possible to obtain a representative value of residual liver function (Keiding et al. 1977, 1982).
In patients with chronic hepatitis, cirrhosis and hepatocellular carcinoma, our laboratory has previously shown that the galactose single point (GSP) method is well correlated with the severity of liver disease (Tang & Hu 1992). This GSP method has been successfully applied to drugs which are extensively metabolized or excreted from the liver, such as promazine and cefoperazone clearance in patients with various liver diseases (Hu et al. 1994, 1995b,c). This method has also been recommended by the US Food and Drug Administration (FDA) in the guidance for industry pharmacokinetics in patients with impaired hepatic function (FDA 2003).
Galactose is a naturally forming sugar with a high extraction ratio that is 90% metabolized in the liver. The metabolism of galactose occurs through a cytosolic pathway independent of the cytochrome P450 (CYP) system. Thus, there is less variation in its metabolism because of drug induction or inhibition, or genetic polymorphism (Becker 1998). In the liver, galactose is catalysed by galactokinase through epimerization, converting to glucose-1-phosphate. The reaction with galactokinase is the rate-limiting step of the galactose metabolism in the hepatocyte (Ballard 1966, Keiding et al. 1977, Craik & Elliott 1980). The fact that galactose has a high extraction ratio, however, makes the metabolism of galactose dependent on liver blood flow and hepatic functional mass. To reflect the hepatic enzymatic activity, the metabolic pathway must be saturated by giving relatively large doses of galactose (Tygstrup 1964, Henderson et al. 1982). At high concentrations in rats and humans, galactose follows Michaelis-Menten kinetics (Keiding 1973, Hu et al. 1995a). The galactose elimination capacity (GEC) test was proposed several years ago as a quantitative test to measure human liver function (Lindskov 1982). However, the multiple blood samples required to establish the decrease of galactose concentration made the test difficult in clinical practice, and therefore led to the more practical investigation of the use of the GSP method in the assessment of human liver function (Tang & Hu 1992).
As we wanted to know how GSP would reflect the degree of hepatic injury in rats, we chose to use the hepatotoxin, carbon tetrachloride (CCl4), for its known severe hepatotoxicity and isoniazid (INH) for its mild hepatotoxicity. In the liver, INH is first metabolized into acetylisoniazid via N-acetyltransferase, followed by hydrolysis to acetylhydrazine (Mitchell et al. 1976). Hydrazine, a toxic intermediate product of INH metabolism can be produced both directly (from INH) and indirectly (from acetylhydrazine). The severity of INH-induced hepatocellular damage has a positive correlation with the plasma hydrazine concentrations (Sarich et al. 1996). Both hydrolysis reactions involve an amidase enzyme. Sarich et al. (1999) reported that bis-p-nitrophenyl phosphate (BNPP), an amidase inhibitor, prevented INH-induced hepatocellular damage. The protective mechanism is most likely through the inhibition of hydrazine production from INH.
On these grounds, the present study was designed with the aim of investigating the suitability of the GSP method as an indicator of residual liver function in rats. This GSP value was determined in dried blood samples from the tail vein and compared with plasma AST and ALT activities, and with a score obtained from the histological examination of the respective liver samples.
Materials and Methods
Materials
Carbon tetrachloride (99.8% purity), INH, BNPP and corn oil were obtained from Sigma Chemical Co (St Louis, MO, USA). Galactose injection solution was prepared by the Nang-Kuang Pharmaceutical Company in Taiwan, ROC, using 400 g of galactose (Sigma) dissolved in 1.0 L of distilled water with appropriate buffer system and isotonic reagents for injection.
Animals
Male Sprague-Dawley rats weighing 300-325 g were obtained from the National Applied Research Laboratories and National Laboratory Animal Center (Taiwan). All the experiments were approved by the local Institutional Review Board according to the Helsinki recommendations and were performed in adherence to the National Institutes of Health guidelines for the treatment of animals. All the rats were housed in a room with air/humidity control, with a 12 h light/dark cycle, and allowed access to food and water ad libitum throughout the experiment. All the rats were intraperitoneally (i.p.) anaesthetized with sodium pentobarbital (50 mg/kg). Polyethylene catheters were placed in the right or left internal jugular vein for the administration of galactose. Catheter insertion was performed by a cut-down technique and the distal end of the catheter was tunnelled under the skin and externalized through an incision in the back of the neck. Postoperative discomfort was minimized by giving all animals 5 mg/kg carprofren (Sigma) by subcutaneous injection. After the surgery was completed, the rats were fasted overnight (approximately 16 h) during recovery, but were allowed water ad libitum.
Experimental design
GSP in rats Rats (n = 8/group) were given i.p. CCl4 injections (10% solution in corn oil) of 1 mL/kg body weight. Control groups were injected with corn oil vehicle only. The galactose tests were assayed 24 h after CCl4 treatment in order to study the functional liver cell mass. Galactose was injected intravenously (i.v.) as a bolus (40% galactose, 0.5 g/kg body weight) saturating the catabolic enzyme system. The rate of elimination was determined by the phosphorylation of galactose by galactokinase, which is located in the cytoplasm of hepatocytes.
Dried blood samples were taken from the tail vein at 5, 10, 15, 30, 45, 60 and 90 min after injection. A colorimetric galactose dehydrogenase (GADH) method was used to measure galactose levels using a modification of the neonatal screening test (Interscientific GAL570 nm, USA). The concentration range of the calibration curve was 50-1000 μg/mL. Within-day variations were evaluated by standard deviation and percent coefficient of variation (CV) for each concentration. A maximum of 10% CV was permitted. Day-to-day variations were also checked by comparing the slope and intercept of the calibration curves.
Isoniazid injection procedures
Three study groups were investigated. The first treatment group (n = 7) involved INH i.p. injections of 150 mg/kg per day (dissolved in saline) alone for 21 days. The second treatment group (n = 6) involved INH and BNPP i.p. injections for 21 days. BNPP (25 mg/kg) was dissolved in saline after heating to approximately 60°C, cooled and administered 30 min before the INH injections. The third control group (n = 20) received i.p. injections of saline solution. The GSP method was applied before and 21 days after treatment.
Enzyme measurements For plasma enzyme measurements, blood samples were collected from conscious animals (blood drops from tail) into heparinized tubes before galactose injection, then centrifuged at 5000 rpm for 10 min at room temperature and the separated plasma assayed within 2 h. Plasma enzyme activities were determined at 37°C (AST and ALT) using a Beckman Auto Analyzer (type Synchron LXi 725; Beckman Instruments, USA) with reagent kits provided by the manufacturer (AST: α-ketoglutarate, malate dehydrogenase, L-aspartate, NADH; ALT: α-ketoglutarate, lactate dehydrogenase, L-alanine, NADH) (Henry et al. 1960).
Light microscopy and electron microscopy
At the end of the treatment, the animals were sacrificed under diethyl ether anaesthesia. The liver was immediately removed for histological and electron microscopy analysis. For light microscopy, liver specimens (n = 6, each group) were fixed in 10% phosphate-buffered formalin, dehydrated and embedded in paraffin. Each paraffin-embedded block was cut into 5 μm sections and then stained with haematoxylin & eosin, and periodic acid Schiff for histological observation. For electron microscopy, liver sections (n = 3, each group) were washed in cacodylate buffer (0.1 mmol/L, pH 7.4), post-fixed for one hour in 20% aqueous osmium tetroxide, dehydrated in graded alcohol and embedded in Spurr resin. Ultra-thin sections were cut with diamond knives, stained with uranyl acetate and lead citrate, and examined with a transmission electron microscope (Hitachi 600, Hitachi Co, Japan).
Liver histology was assessed by a pathologist (H S Lee) ‘blinded’ to the results of the liver biochemistry and GSP values. Histology was graded by the histologic activity index (HAI) according to the criteria of Knodell et al. (1981). The total HAI score is divided into two components: HAI-necroinflammation (HAI-NI) and fibrosis. The HAI-NI score includes three components (0-10, piecemeal necrosis; 0-4, lobular necrosis and inflammation; 0-4, portal inflammation).
Statistical analysis
The results were presented as mean ± standard deviation (SD). Means between the two samples were compared with the Student's t-test or the paired t-test. Analysis of variance (ANOVA) with post hoc Bonferroni corrections of t-tests (SigmaStat version 2.03, SPSS Inc) was used to compare the control and treatment groups’ data from the biochemical parameters and GSP. Comparison of continuous variables with skewed distribution between the two groups was tested by a non-parametric test, such as the Mann-Whitney U-test. Correlation between different continuous variables was tested by Spearman's rank correlation. A two-tailed P value <0.05 is considered to be statistically significant.
Results
GSP in rats
Galactose disposition in rats follows a two-compartment open model: one rapid distribution phase followed by an elimination phase. Under the saturated dose of 0.5 g/kg, the linear portion (saturated portion) of galactose blood levels in the control and CCl4-treated rats was different. The mean venous blood concentration-time profile of galactose after quick i.v. injection of 0.5 g/kg galactose in eight control and eight CCl4-treated rats is shown in Figure 1. Significantly different galactose blood levels were found between the control and CCl4-treated rats at 45 (530.1 ± 71 versus 669.5 ± 93.7 μg/mL, P < 0.01), 60 (380.6 ± 80.2 versus 590 ± 57.6 μg/mL, P < 0.001) and 90 min (258.3 ± 84.8 versus 416.9 ± 64.9 μg/mL, P < 0.005) following galactose administration.
The mean (± SD) venous blood concentration-time profile of galactose after quick intravenous injection of 0.5 g/kg galactose in control (n = 8) and carbon tetrachloride (CCl4) treated rats (n = 8). The difference of galactose blood concentrations at 45, 60 and 90 min after infusion show highly significant differences between these two groups. It peaked at 60 min and reduced at 90 min (*P < 0.01, *P < 0.001, §P < 0.005)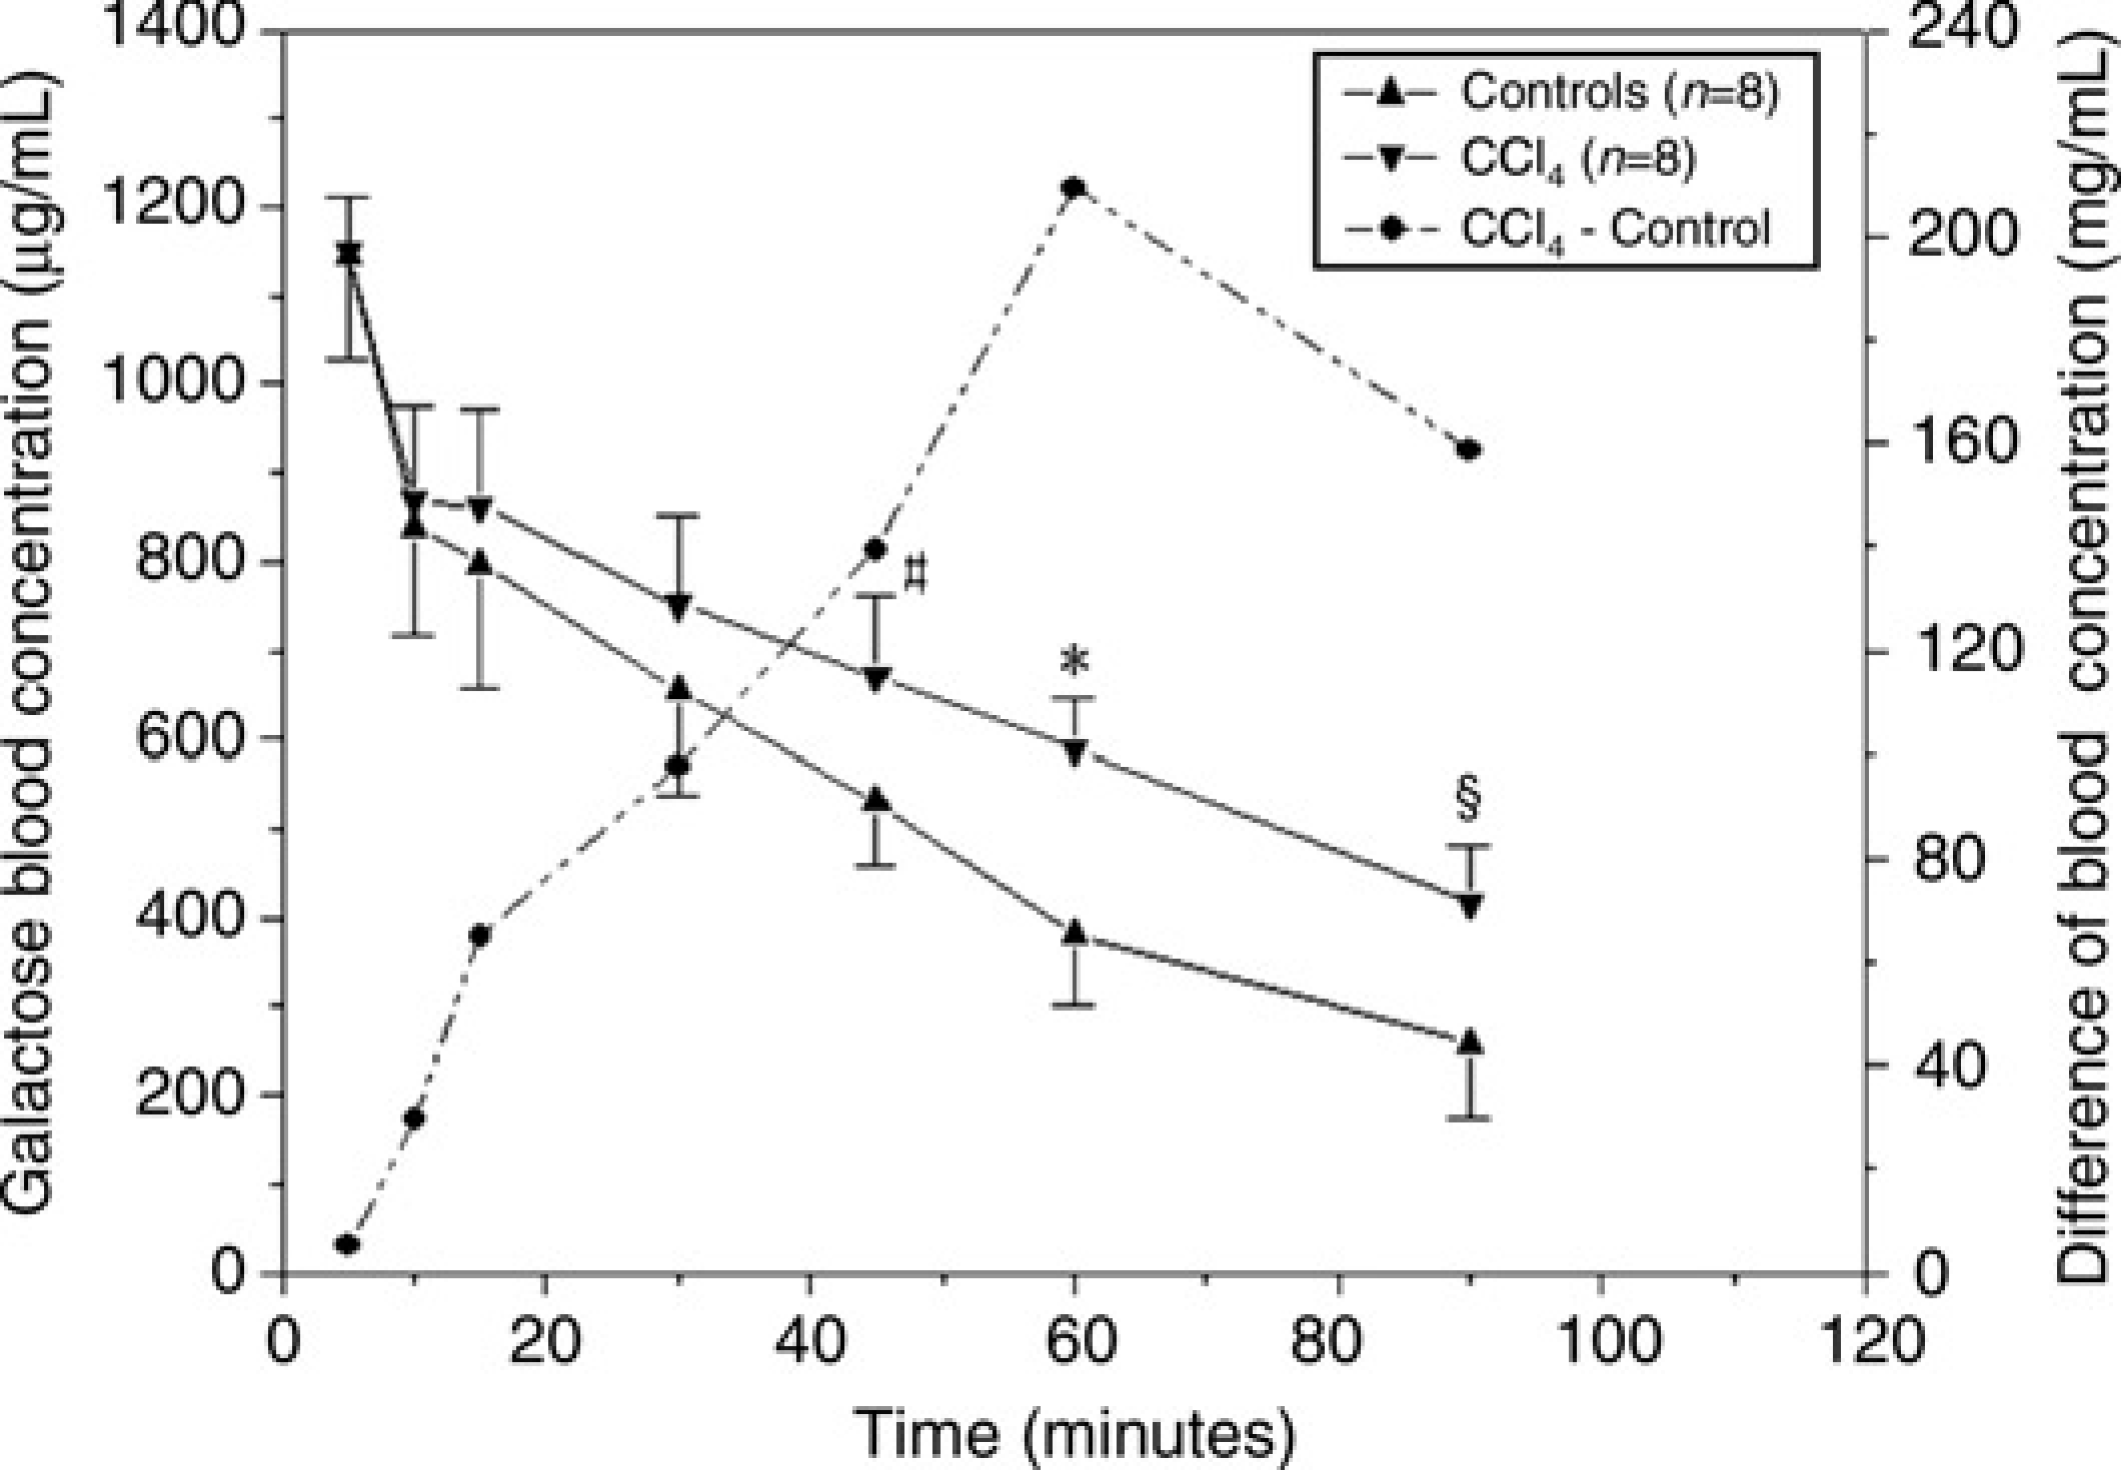
Differences in galactose blood concentrations at different time-points after quick i.v. injection of galactose between these two groups is shown in Figure 1. The maximum difference in galactose concentrations between the control and treated groups occurred at one hour. The optimal time, one hour, was therefore applied to perform GSP to evaluate liver function. The effect of CCl4 treatment on the levels of AST, ALT and GSP is shown in Figure 2. CCl4 treatment for 24 h caused marked increases of AST (81.5 ± 10.3 versus 907.8 ± 152.5 IU/L, 11-fold) and ALT (21 ± 4.1 versus 652.5 ± 73.2 IU/L, 31-fold), which were significantly different from those of the control groups (P < 0.001). In addition, a highly significant difference in average GSP values (380.6 ± 80.2 versus 590 ± 57.6 μg/mL, 1.6-fold) between the control and CCl4-treated rats was found (P < 0.003). There was also a significant difference in HAI-NI scores between the control and CCl4-treated rats (P < 0.001). Furthermore, GSP values correlated markedly with HAI-NI scores (r = 0.841, P < 0.001).
Male Sprague-Dawley rats were treated with carbon tetrachloride (CCl4) (1 mL/kg, intraperitoneally). Plasma was collected for the analysis of aspartate aminotransferase (AST) and alanine aminotransferase (ALT) and galactose single point (GSP) evaluation 24 h later. *P < 0.003, *P < 0.001 for CCl4 versus control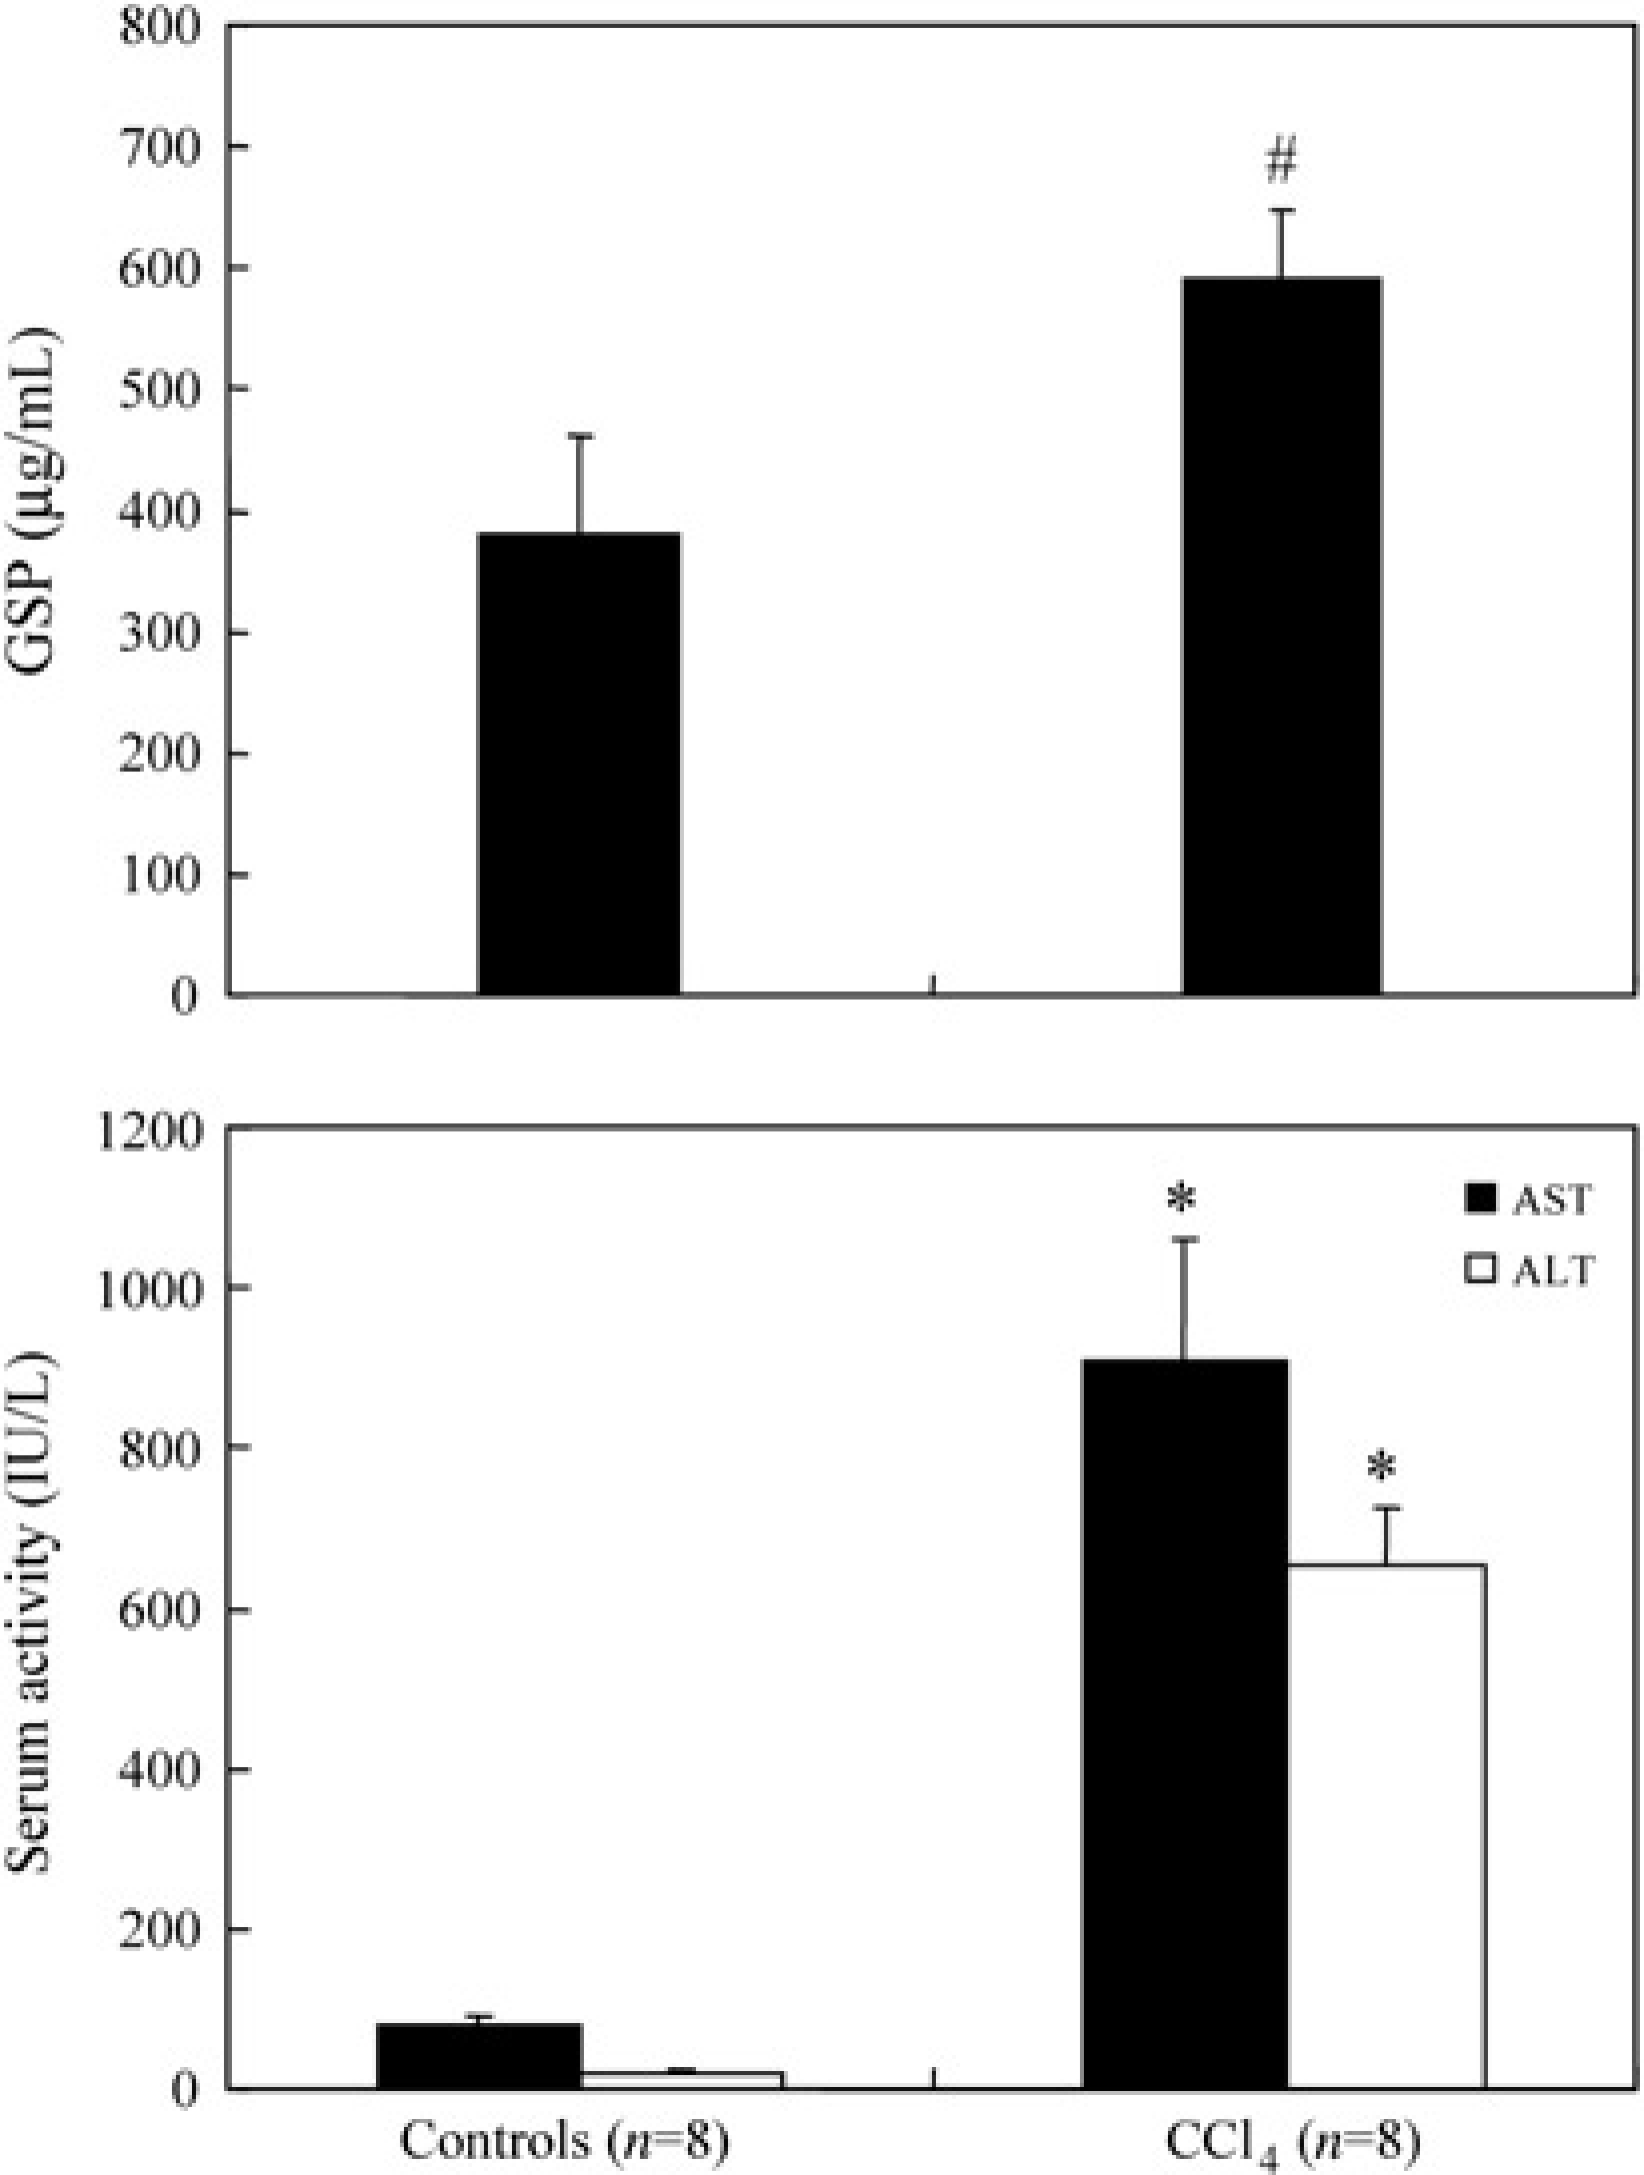
INH-treated rats
Rat liver injury was also induced by INH. A normal liver architecture was found in the saline-treated control group (Figure 3a). After 21 days of INH treatment, histology showed hepatocellular disintegration and vacuolation in the pericentral vein hepatocytes. However, no signs of hepatocytic necrosis were seen (Figure 3b). Compared with the normal control (Figure 3d), electron microscopic examination of the rat livers revealed marked proliferation of rough endoplasmic reticulum (rER) (Figure 3e). Pretreatment of rats with the amidase inhibitor BNPP 30 min before the injection of INH was applied to inhibit the formation of INH-derived hydrazine and reverse of hepatocellular damage. Histopathological features of the liver tissue of the INH-BNPP rats (Figures 3C and F) showed similar patterns of the normal control (Table 1).
Microscopyofthecontrol, isoniazid (INH)-and INH-bis-p-nitrophenyl phosphate (INH-BNPP) treated rat liver
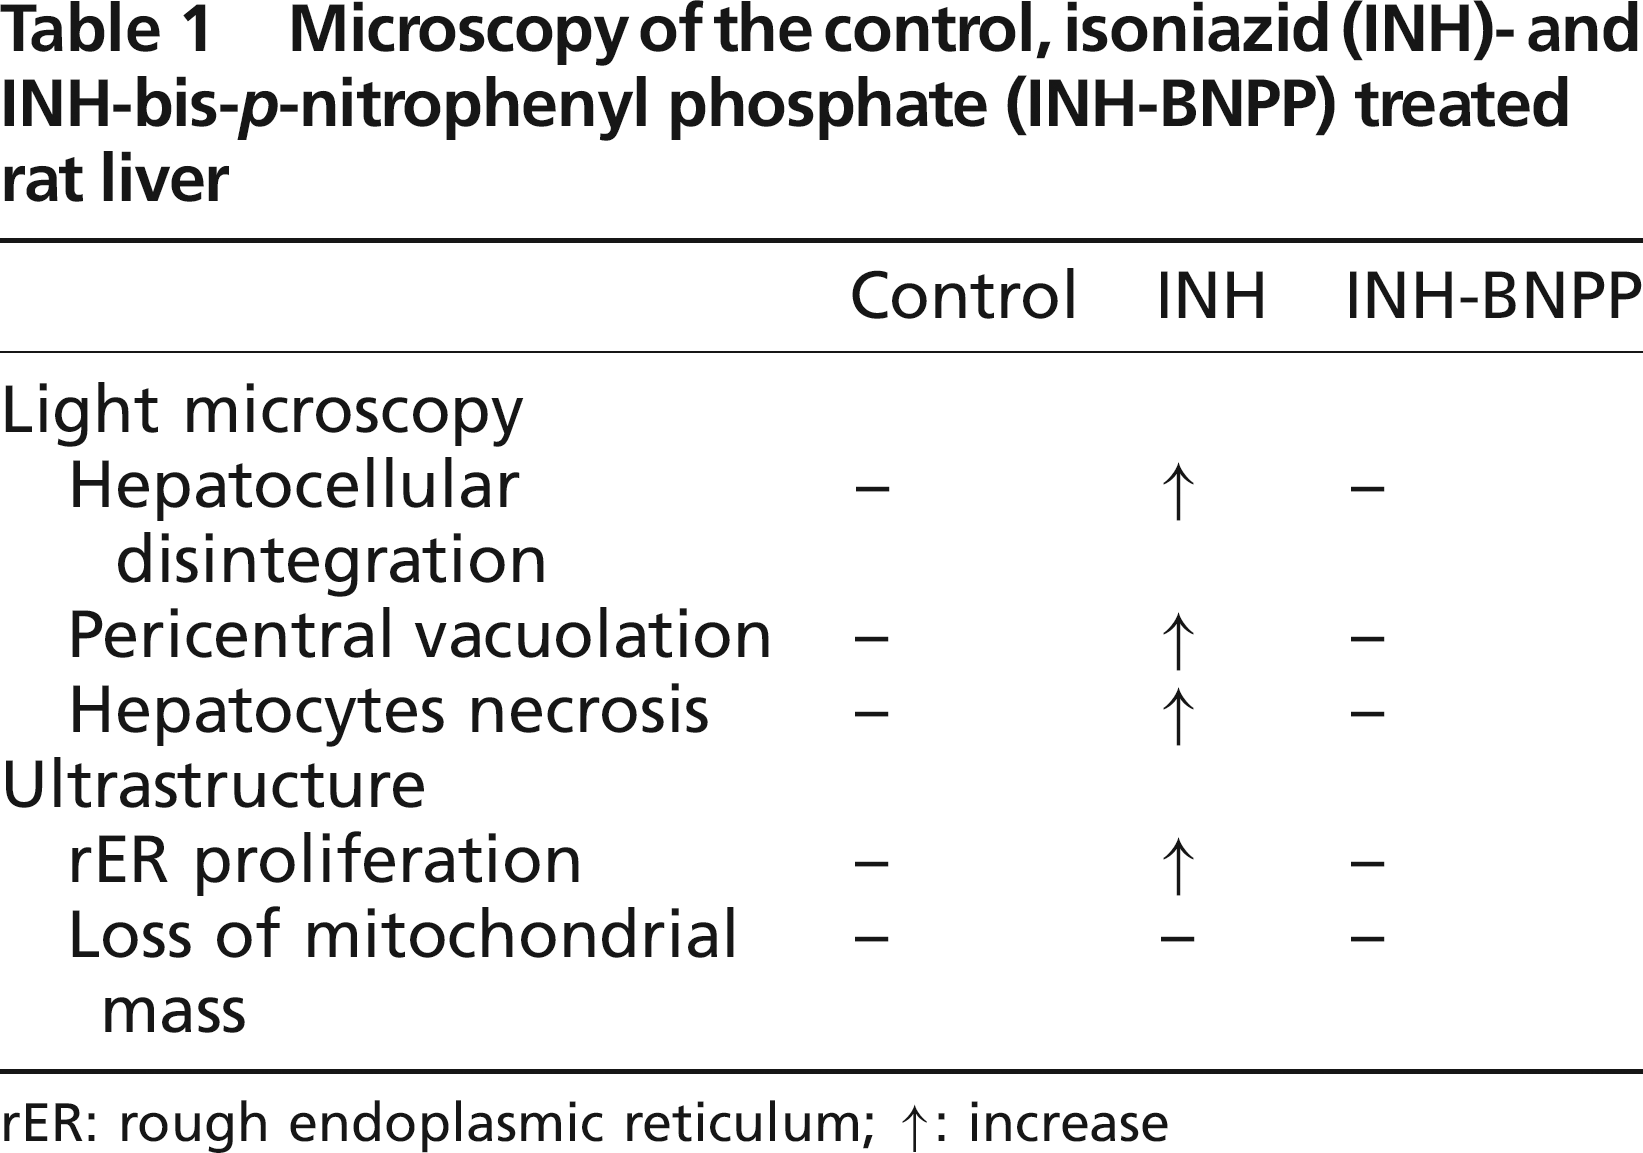
rER: rough endoplasmic reticulum; ↑: increase
Photomicrography of liver sections from rats in the control group (A and D), isoniazid (INH) group (B and E) and INH-bis-p-nitrophenyl phosphate (INH-BNPP) treated group (C and F). (A) Normal morphology of liver tissue in control rats. (B) Hepatocellular disintegration and the vacuolation in the pericentral vein (V) area in INH-treated rats (haematoxylin & eosin stain, original magnification x400). Electron microscopic examination of the rat liver revealed increased proliferation of rough endoplasmic reticulum (rER) (E) compared with normal control (D) (original magnification × 16,000). Histological section of the liver tissue of INH-BNPP-treated rats (C and F) showed similar patterns to the normal control (Nu: nucleus; Mito: mitochondria)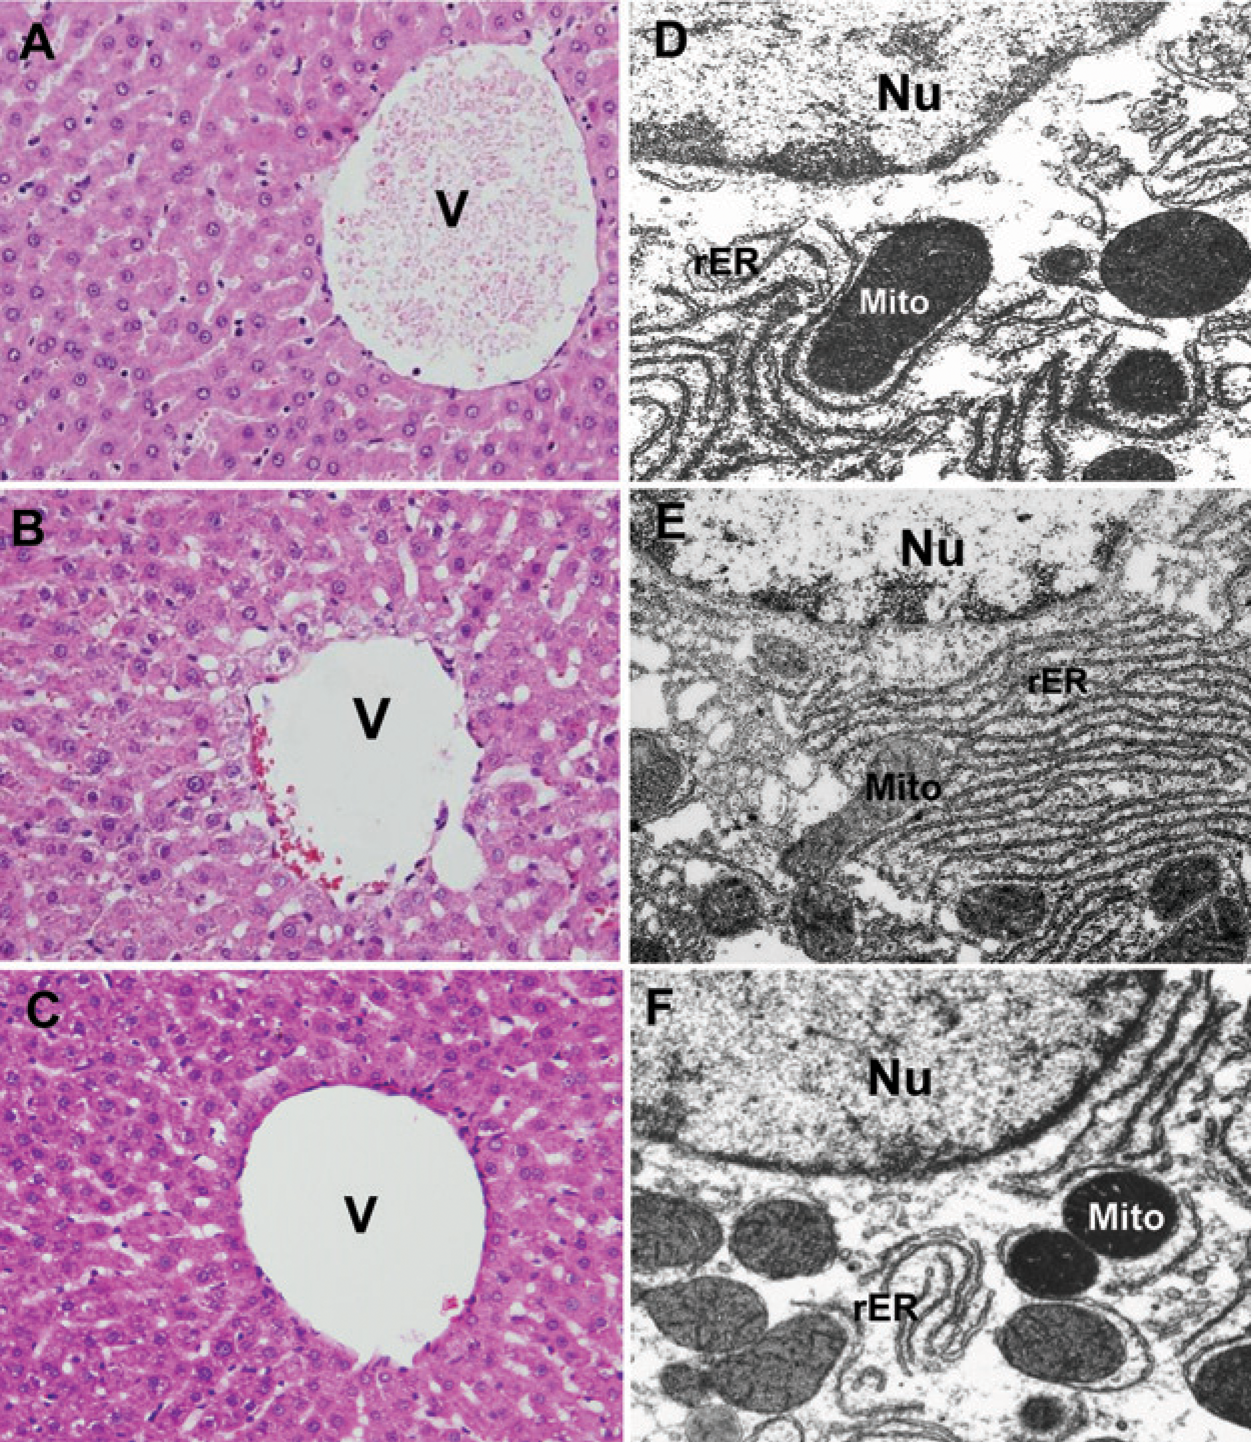
Figure 4 summarizes the effects of INH/INH-BNPP treatments on the level of AST, ALT and GSP. Compared with the control, there was no significant difference of hepatic AST and ALT activities between INH and INH-BNPP treatments for 21 days. However, significant differences in average GSP values for the control group (342 ± 47 μg/mL, P < 0.001) and INH-BNPP group (406 ± 41 μg/mL, P < 0.001) compared with INH alone (546 ± 98 μg/mL) were seen. A highly significant difference was observed when comparing HAI-NI scores from the INH group with respect to the control and INH-BNPP groups (P < 0.001 and P = 0.003, respectively). There were statistically significant correlations in the GSP values and HAI-NI scores between the control and INH groups (r = 0.651, P < 0.001) and between the INH and INH-BNPP groups (r = 0.465, P = 0.019). There was no significant correlation of GSP to AST (r = -0.23) and ALT (r = 0.242) among the control (n = 20), INH-treated (n = 7) and INH-BNPP (n = 6) groups.
Effects of isoniazid (INH) and INH-bis-p-nitrophenyl phosphate (INH-BNPP) treatments for 21 days on serum aspartate aminotransferase (AST) and alanine aminotransferase (ALT) activities (bottom) and average galactose single point (GSP) values (top) in rats. *P < 0.001 for INH group versus the control or INH-BNPP group; *P < 0.05 for INH-BNPP versus the control group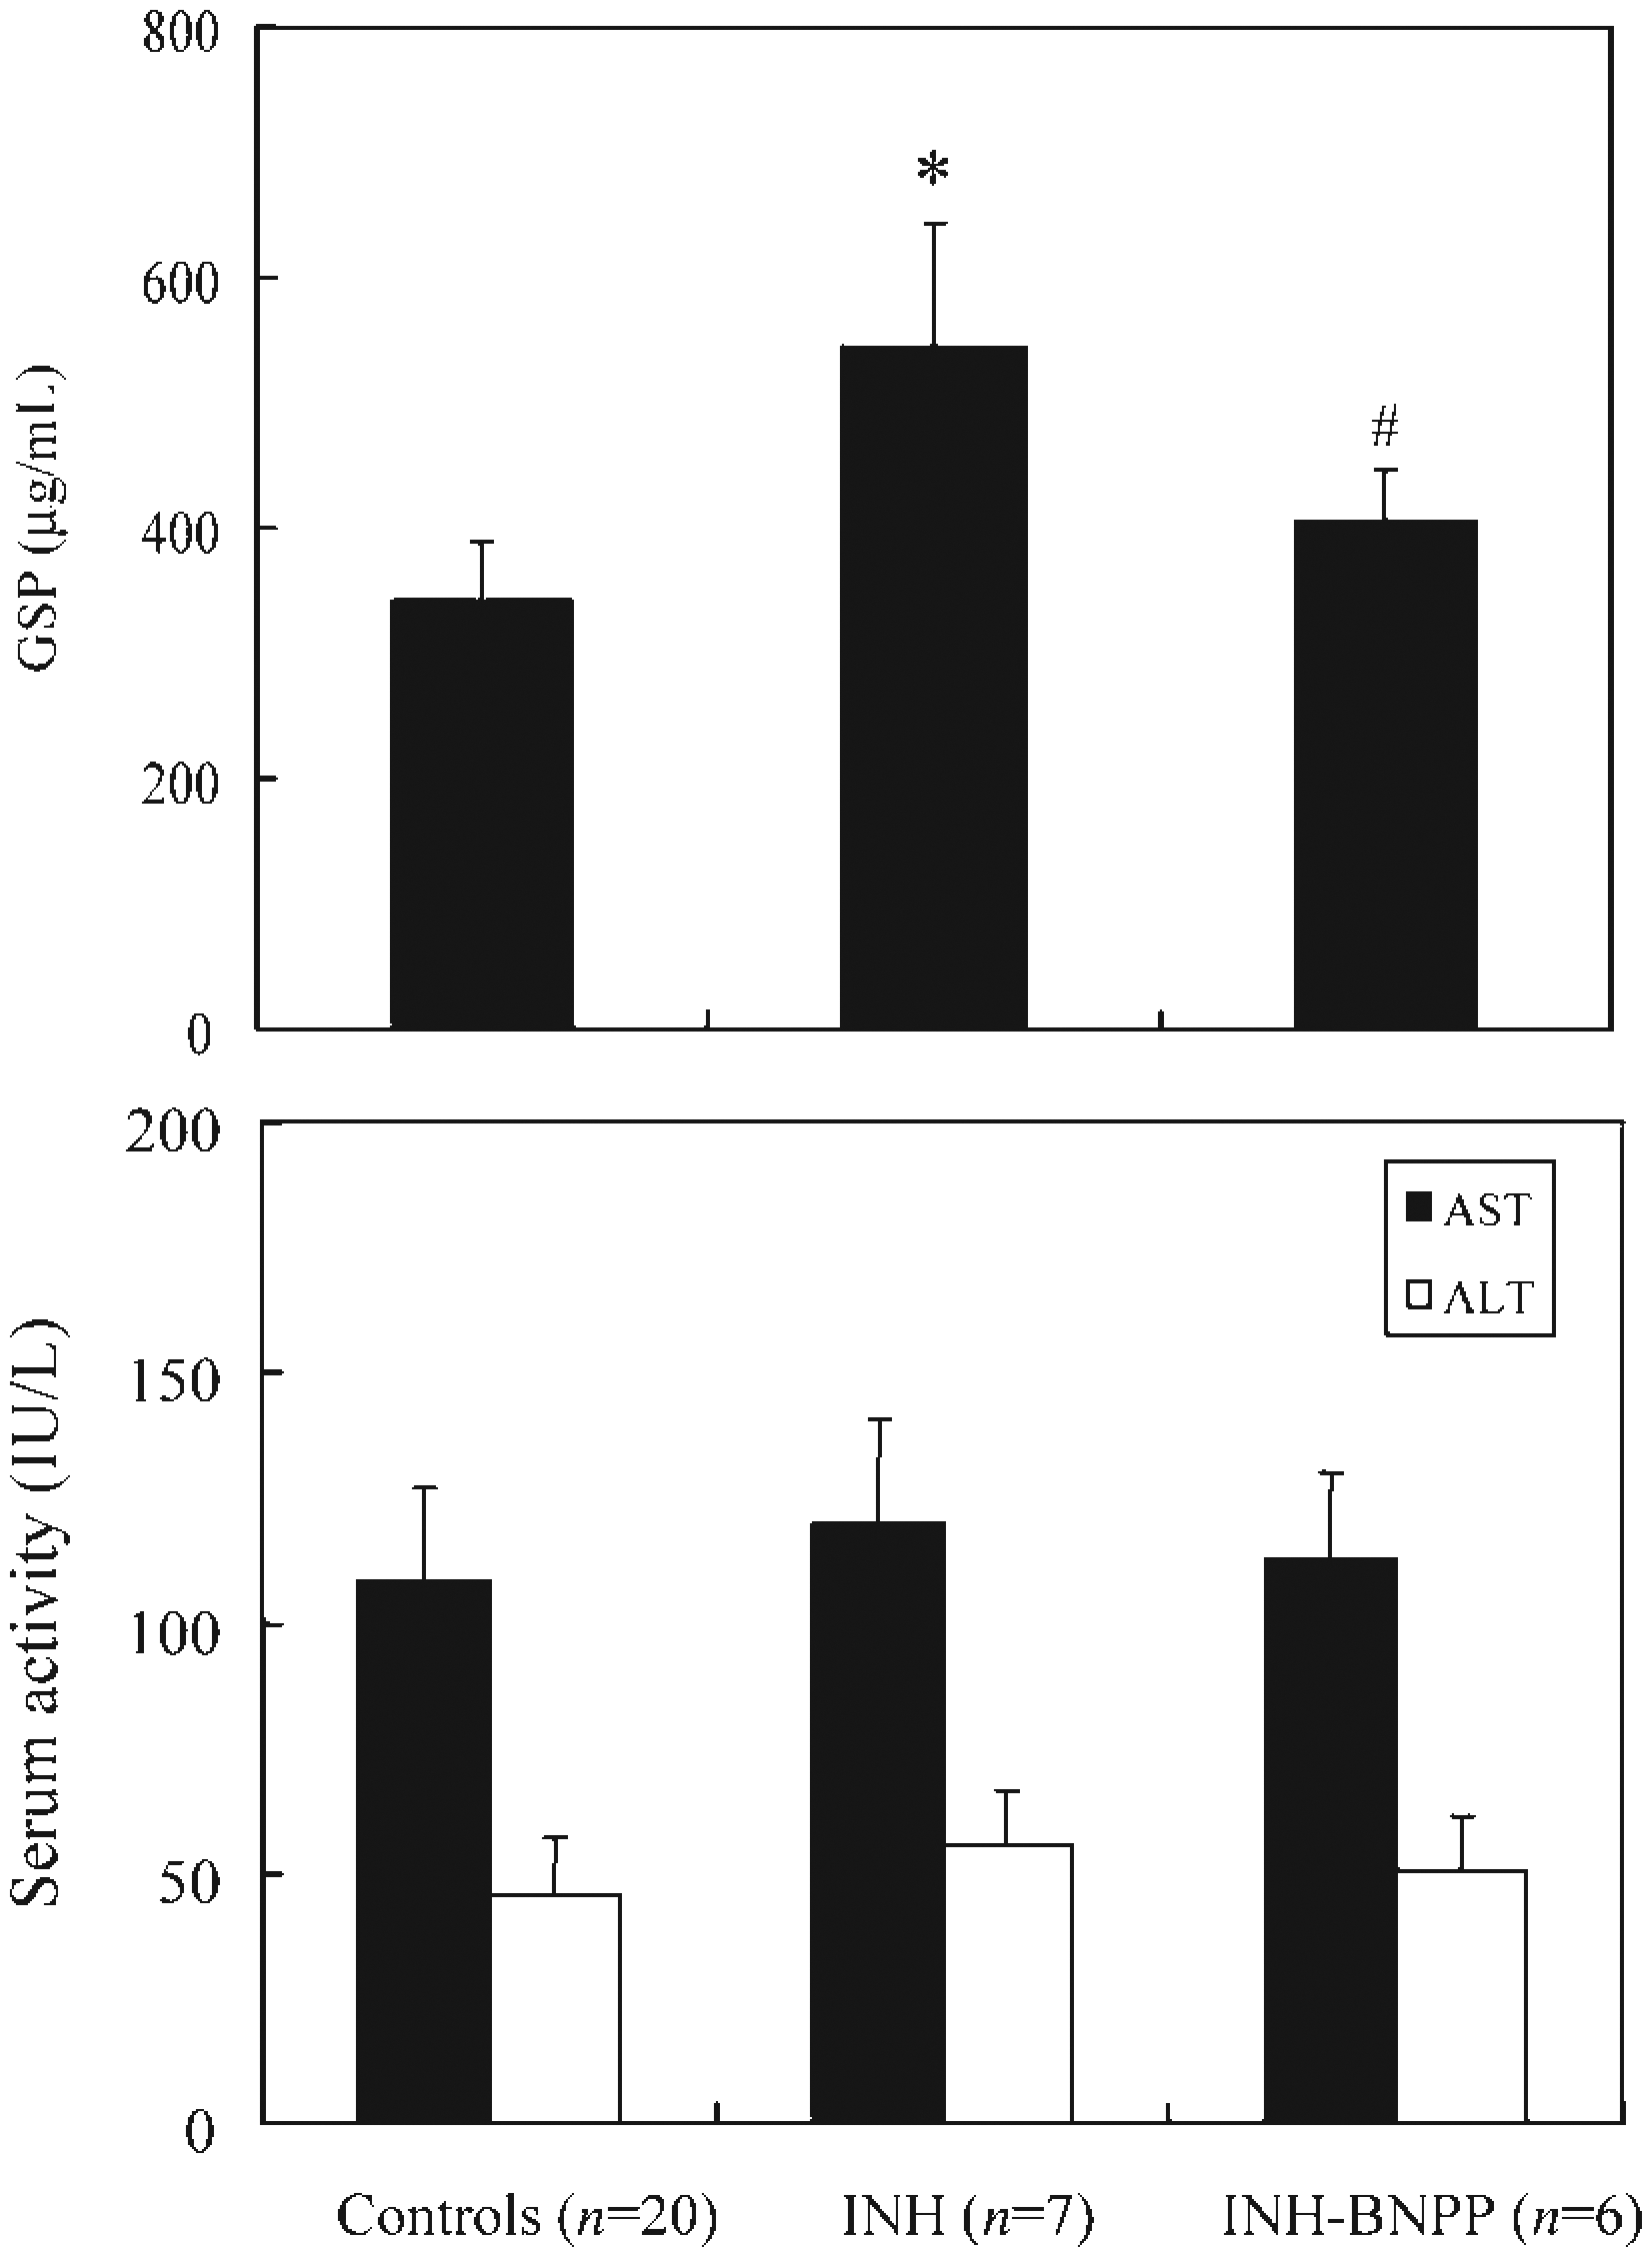
Table 2 shows the effects of INH and INH-BNPP treatments for day 0 (base) and day 21 on hepatic AST and ALT activities, and GSP values in rats. Baseline serum levels of hepatic AST, ALT activities and values of GSP were similar. For 21 days of INH and INH-BNPP treatments, hepatic AST and ALT activities were not markedly changed. However, after 21 days, the value of GSP in the INH and INH-BNPP groups increased by 61.8% and 15.3%, respectively, over the baseline (P < 0.001 and P < 0.05, respectively), which indicated that BNPP could attenuate liver impairment induced by INH (Table 2).
Effects of isoniazid (INH) and INH-bis-p-nitrophenyl phosphate (INH-BNPP) treatments for day 0 (base) and day 21 on values of galactose single point (GSP) and hepatic aspartate aminotransferase (AST) and alanine aminotransferase (ALT) activities in rats
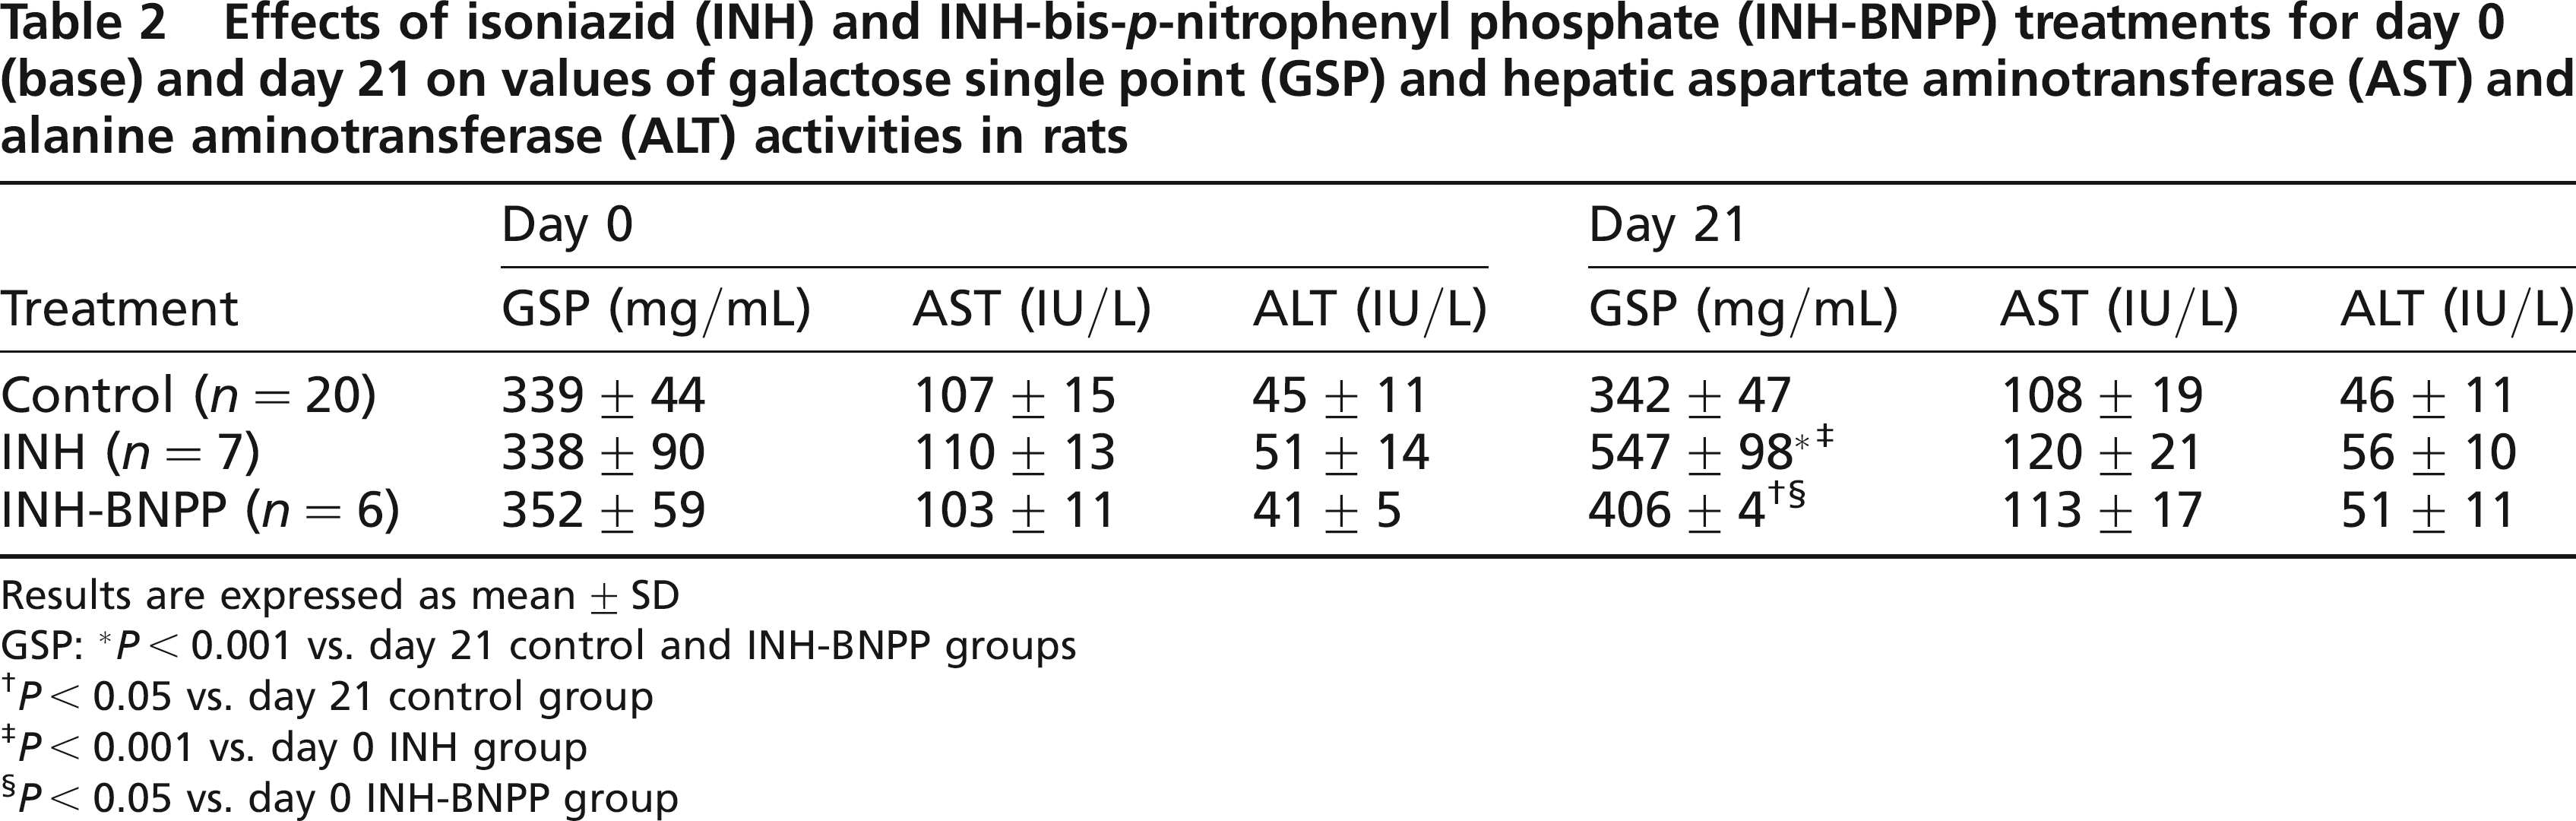
Results are expressed as mean ± SD GSP:
P < 0.001 vs. day 21 control and INH-BNPP groups
P < 0.05 vs. day 21 control group
P < 0.001 vs. day 0 INH group
P < 0.05 vs. day 0 INH-BNPP group
Discussion
Data from the current study confirm earlier observations that the GSP method is not only a simple and clinically useful quantitative liver function test for humans (Tang & Hu 1992), but also a useful tool to evaluate rat liver function with various injuries. In animal experiments, CCl4 has been shown to produce liver damage, including centrilobular necrosis and fatty degeneration in various species (Chopra et al. 1972, Bruckner et al. 1986). AST and ALT are hepatic enzymes that are released into the bloodstream when liver cells are damaged (Fujii 1997). To assess the CCl4-induced liver injury in rats, serum AST and ALT activities and GSP were measured as markers of liver injury. The CCl4-treated rats showed a marked increased in serum AST, ALT and GSP values, which were significantly different from those of the control groups. Plasma AST and ALT activities increased by 11- and 31-fold, respectively, and GSP increased 1.6-fold in acute rodent CCl4-induced toxicity. Thus, both plasma AST and ALT activities and GSP determination may indicate hepatic necrosis after CCl4 exposure.
INH has been widely used as a medicine in the prophylaxis and treatment of tuberculosis. The incidence of anti-tuberculosis drug-induced hepatitis ranges from 1 % to 36%, depending on different regimens and definitions of hepatic injury (Yamamoto et al. 1986, Wu et al. 1990, Huang et al. 2003). Of the various anti-tuberculosis regimens, INH is the main drug that causes hepatotoxicity (Mitchell et al. 1976, Yamamoto et al. 1986, Wu et al. 1990, Lee 1995). We showed here, through the histopathological evaluation of INH-induced hepatotoxicity in rats, the hepatocellular disintegration and vacuolation in the centrilobular region, even though there was no evidence of liver cell necrosis throughout the whole course. Such types of changes have also been observed in experimental rats treated with 100 mg/kg of INH for 21 days intraperitoneally consistent with our data (Yue et al. 2004). Electron microscopic examination also revealed marked proliferation of rER. A similar type of hepatic injury in rats was produced by giving 50 mg/kg of INH intraperitoneally for two weeks. Hence, the higher production of the reactive oxygen metabolites in INH treatment can be speculated (Sodhi et al. 1996).
Our laboratory, using a similar model of INH-induced hepatotoxicity in rats and the pretreatment of rats with BNPP (an amidase inhibitor) 30 min before injection of INH for 21 days, was carried out and produced consistent clinical manifestations. Compared with INH treatment alone, however, there were significant differences in average GSP values for the control and INH-BNPP-treated groups, whereas AST and ALT activities were almost indistinguishable. Plasma AST and ALT activities are very sensitive markers but mainly for hepatocellular necrosis. Hepatic AST and ALT activities failed to indicate mild hepatotoxicity in our experimental models. This failure may be adjusted using GSP as a quantitative liver function biomarker. This may be one of the reasons why GSP is more sensitive than AST and ALT in distinguishing the residual liver function of rats among the control, INH- and INH-BNPP-treated groups (P < 0.001). Among these controls (CCl4-control and INH-control) and the experimental groups (CCl4, INH and INH-BNPP) in the present study, excellent correlation was observed between GSP and HAI-NI scores (r = 0.748, P < 0.001), which suggested that GSP is a potential biomarker of drug-induced hepatocellular toxicity.
Of the residual liver function measured, the GSP value consistently increased by INH-treatment (mild) and CCl4-induced (severe) hepatotoxicity in various degrees of liver injury. Previously, aminotransferases were known to carry little prognostic importance and to be poor indicators of severity (O'Brien et al. 2000). Surprisingly, AST and ALT had a good correlation with GSP values, because of markedly elevated AST and ALT values in the CCl4-treated rats, reflecting severe hepatotoxicity.
Finally, GSP takes the 60 min galactose blood concentration as a measure of residual liver function. Therefore, GSP concentration possibly reflects both the change in enzyme activity and hepatic blood flow (Tang & Hu 1992). To accurately estimate the value of GSP, the calibration curve is of vital importance. Duplicate measurements should be done in six different concentrations for each subject's calibration curve, which covers high and low galactose concentrations after administration. Traditionally, galactose concentration was measured by applying GADH in dried blood spots using fluorometric assays (Fujimura et al. 1981, Orfanos et al. 1986, Yamaguchi et al. 1989). Here, a modified colorimetric GADH method (Diepenbrock et al. 1992) was used to measure values of galactose in dried blood specimen from the rat tail vein.
In conclusion, the GSP method has been proven to be a simple and useful tool for the quantitative determination of rat liver function, based primarily on marked GSP elevation following CCl4- or INH-induced extensive and severe hepatic necrosis, with a high sensitivity for detection even at the early stages of liver disease.