
Abstract
Doppler-echocardiographic assessment of cardiovascular structure and function in murine models has developed into one of the most commonly used non-invasive techniques during the last decades. Recent technical improvements even expanded the possibilities. In this review, we summarize the current options to assess global left ventricular (LV) function in mice using echocardiographic techniques. In detail, standard techniques as structural and functional assessment of the cardiovascular phenotype using one-dimensional M-mode echocardiography, two-dimensional B-mode echocardiography and spectral Doppler signals from mitral inflow respective aortal outflow are presented. Further pros and contras of recently implemented techniques as three-dimensional echocardiography and strain and strain rate measurements are discussed. Deduced measures of LV function as the myocardial performance index according to Tei, estimation of the mean velocity of circumferential fibre shortening, LV wall stress and different algorithms to estimate the LV mass are described in detail. Last but not least, specific features and limitations of murine echocardiography are presented. Future perspectives in respect to new examination techniques like targeted molecular imaging with advanced ultrasound contrast bubbles or improvement of equipment like new generation matrix transducers for murine echocardiography are discussed.
Keywords
Murine models of cardiovascular diseases have become more and more important during the last years, particularly due to recent developments in genetical engineering and various microsurgical techniques. 1–3 The murine genome, cardiovascular anatomy and physiology show a high degree of homology with humans, except for some anatomical differences on the atrial and venous level. 4 Doppler echocardiography of mice has developed into one of the most commonly used techniques in fundamental cardiovascular research, particularly due to recent technical advances leading to improved spatial and temporal resolution. 1,2 Recent technical improvements and implementation of new ultrasound techniques even improved the possibilities for postprocessing. 5–8 Measurements are non-invasive and serial examinations can be performed without any problems. Murine echocardiography is a valuable and generally well-accepted tool and helps understand developmental physiological and pathophysiological changes with ageing or in the course of cardiovascular disease. In this review, we give a concise overview about the abilities to assess global and regional systolic and diastolic left ventricular (LV) function using echocardiographic techniques discussing as well-established ‘standards’ as recently developed techniques and experimental approaches.
M-mode, 2D and 3D B-mode echocardiography
M-mode echocardiography (time motion mode) is the most ancient, but also one of the most frequently used echocardigraphic techniques. It can easily be performed at the ventricular level and with some more effort at the atrial level. M-mode echocardiography performed on the basic left ventricle (LV) leads to a 1D high-resolution temporal course of the diameter changes of the LV and of the wall thickness of the anterior and posterior LV wall in systole as well as in diastole. In principle, the right ventricle (RV) can be visualized using M-mode echocardiography, but due to near-field signal noise and the small dimensions of the murine RV, it is mostly not measured. All M-mode measurements should follow the guidelines of the American Society of Echocardiography.
9
Percentage of LV fractional shortening [LV–FS(%)] as a parameter for systolic function can easily be derived using the formula


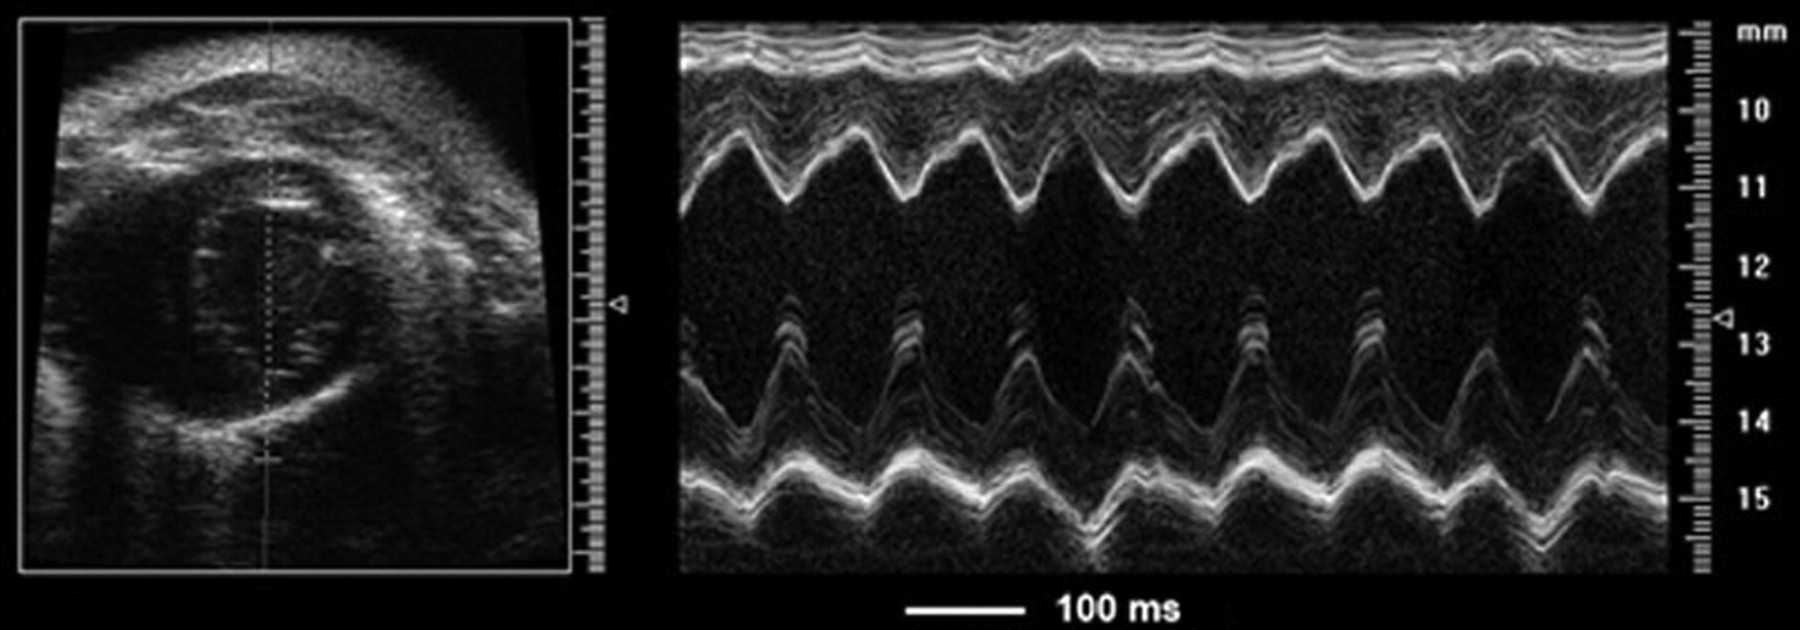
M-mode of a normal adult wild-type mouse
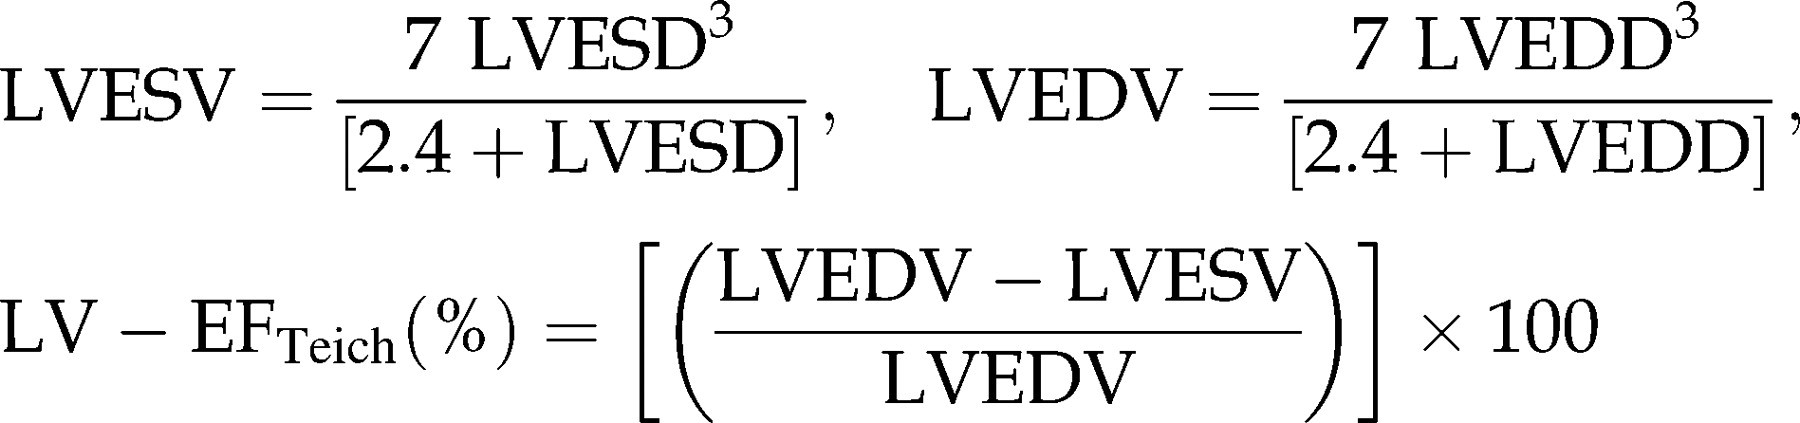
Another possibility to estimate systolic function using M-mode echocardiography is the calculation of the LV ejection fraction using end-systolic and end-diastolic volumes according to Teichholz (LV–EFTeich(%)).
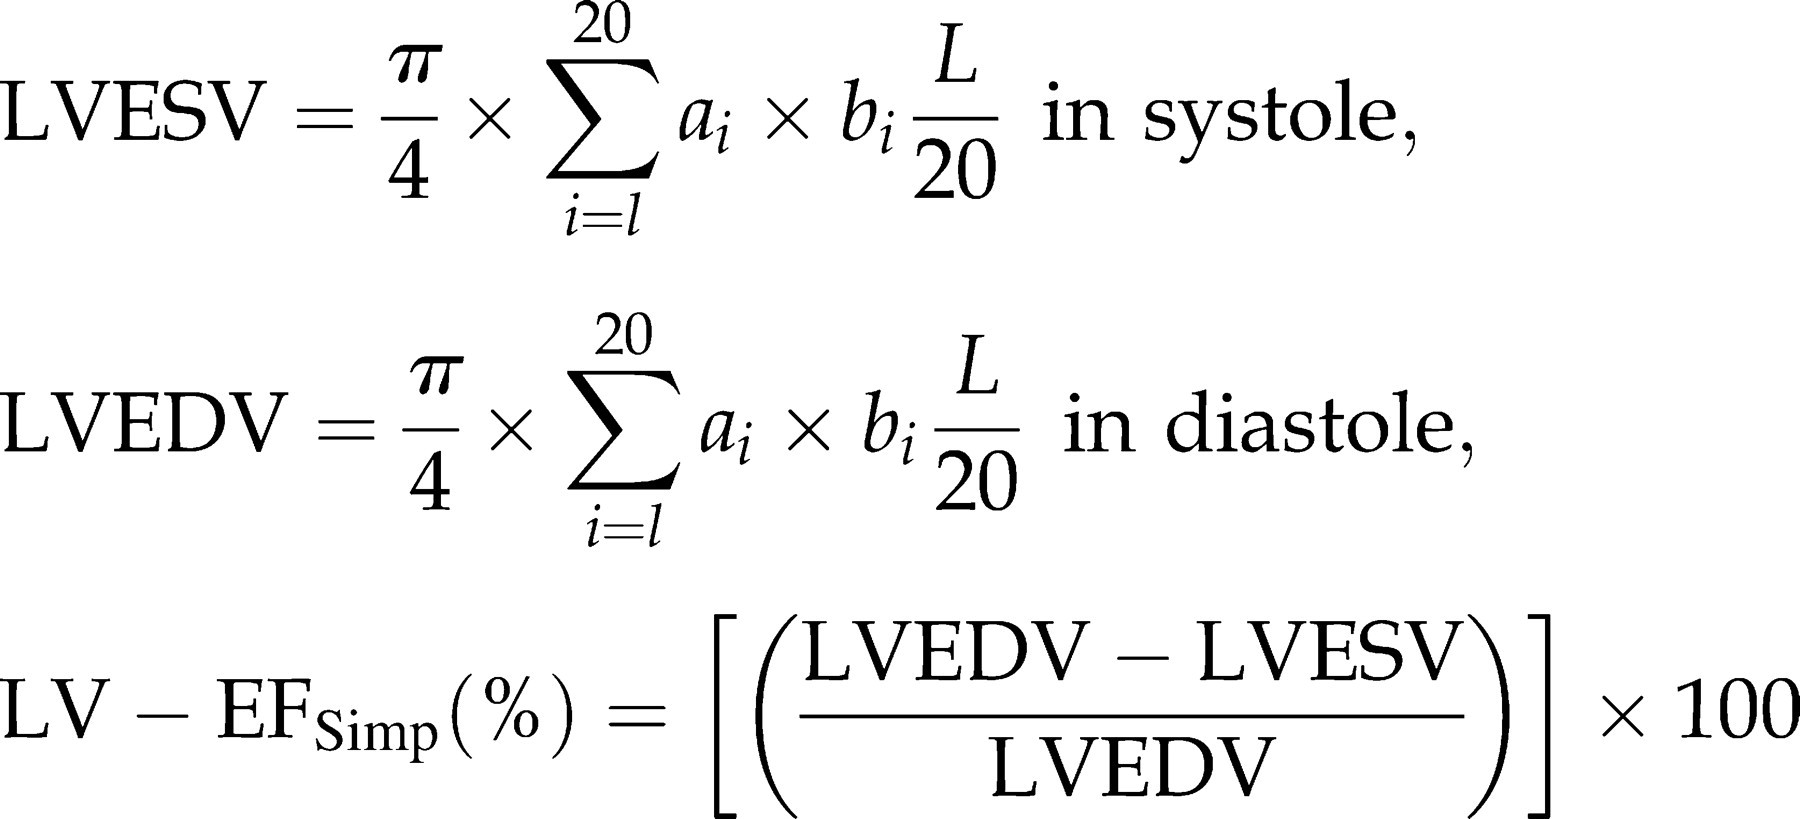
The 2D B-mode (brightness mode) offers further possibilities in estimating global LV function. The two mainly used views are the parasternal long- and short-axis view. In the parasternal long axis (Figure 2A), the complete LV can be visualized from base to apex. Furthermore, the diameter of the left atrium, LV outflow tract (LVOT), aortic root and RV can be measured. The parasternal short axis (Figures 2B and C) shows the diameter of the LV and RV, measurements are mostly performed at the midpapillary, but also at the basal or apical levels. Systolic function can already be judged visually in the moving picture. Using the apical four-chamber view or the long-axis view, the ejection fraction can be calculated using the biplane rule of discs according to Simpson (EFSimp(%)).
17,18
Therefore, the area of the LV is traced in end-diastole and end-systole and EFSimp(%) is calculated (Figure 3):
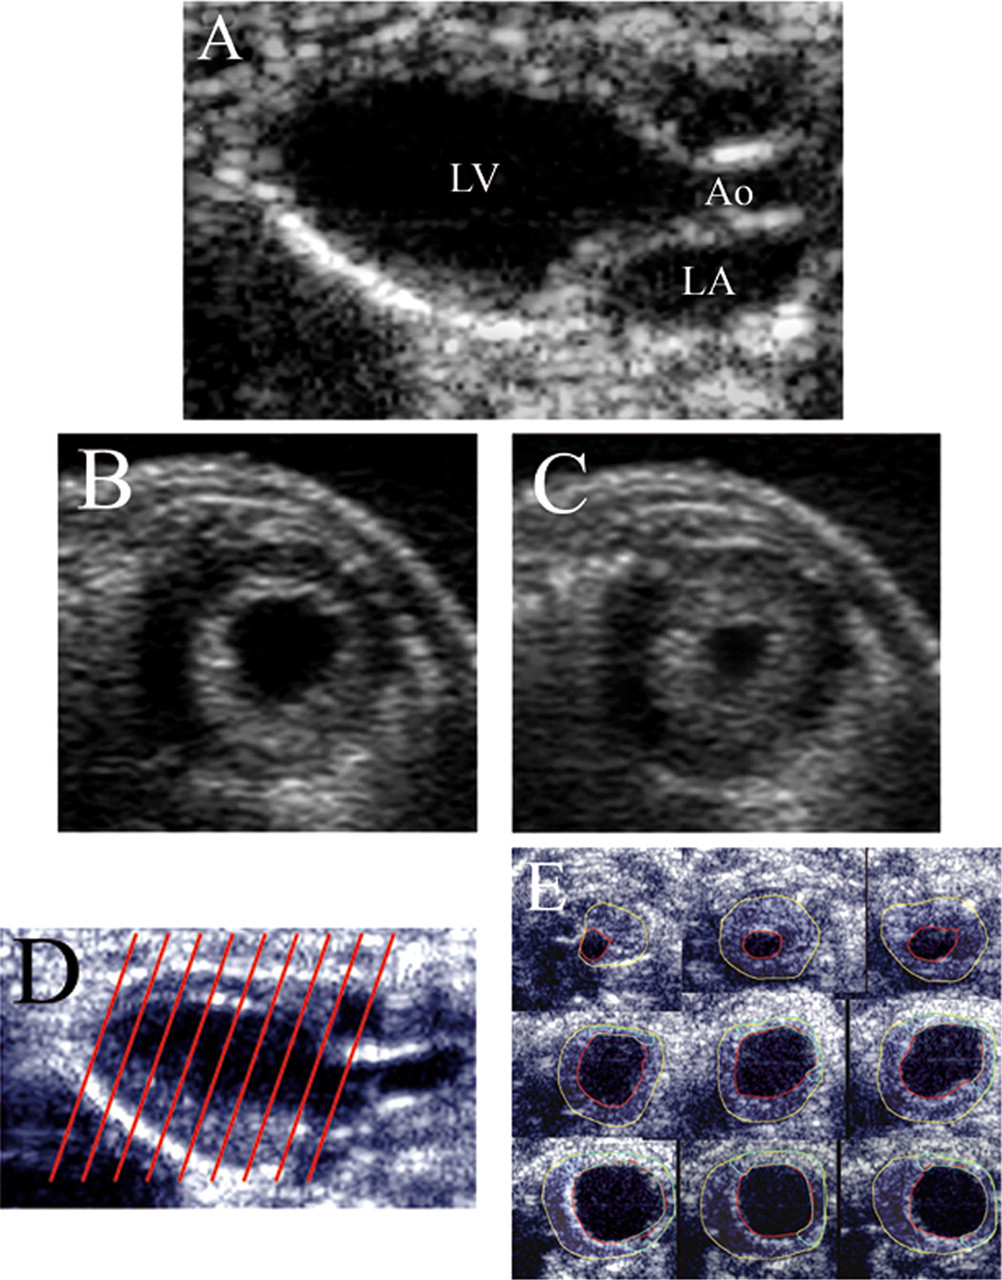
B-mode recordings of normal adult wild-type mice: (A) 2D parasternal long-axis view (LV = left ventricle, LA = left atrium, Ao = aorta), (B) and (C) 2D parasternal short-axis view in diastole and systole, (D) schematic illustration of the slicing of the LV for 3D measurements and (E) different short-axis views from a 3D measurement
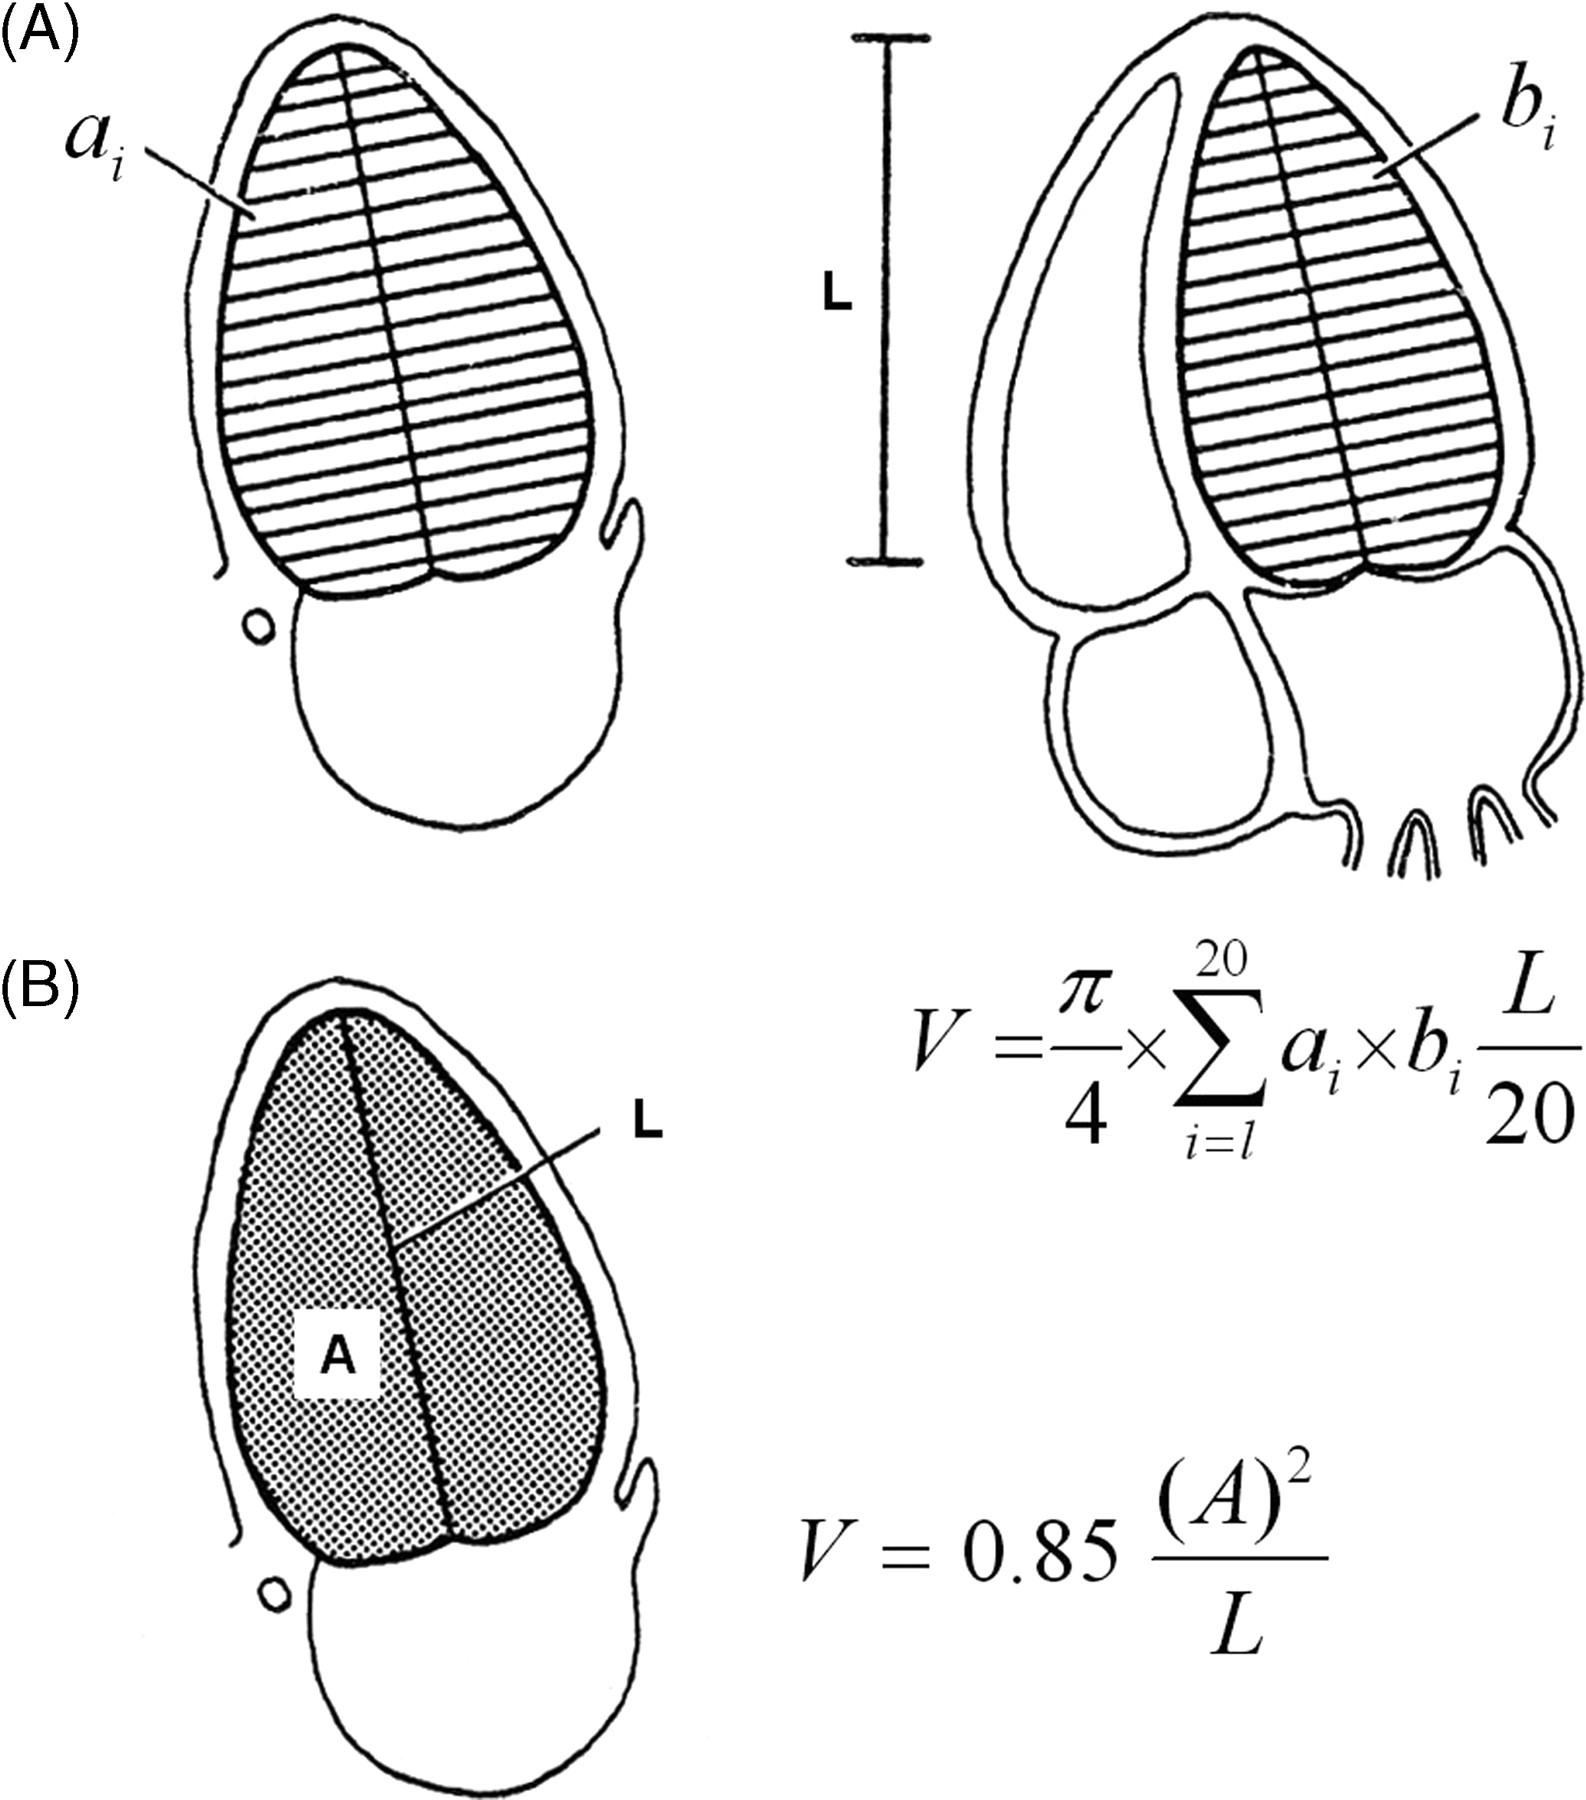
Measurements for the calculation of the LV volume according to the methods of discs (according to Schiller et al. 19 )
Values for LV–EF in mice are in general significantly higher when compared with reference values for healthy humans under contemporary anesthetic regimens, resulting in physiological heart rates (500–600 bpm). 20 The values for LV–EF vary between 60% and 90%. 5,21,22 In humans, EF(%) estimated by the Teichholz method or Simpson method shows a good correlation to radionuclide–angiography as the gold standard, with EFSimp slightly overestimating the EF(%) by radionuclidegraphy and EFTeich showing somewhat more scattering of the individual values. 23–25
The parasternal short-axis view is usually used to assess LV–FAS(%). In principle, LV–FS(%) and LV–EFTeich can also be measured in B-mode, whereas the measurements in M-mode are easier and more reliable.
All the calculated parameters reviewed so far are based on 2D measurements, and – except LV–FAS(%) – even assume symmetry of the LV. The problems arising from these limitations can be overcome by 3D echocardiography.
The acquisition of 3D echocardiographic data-sets of the murine LV is of key scientific interest. To date, most 3D-ultrasound data of the LV of mice are postprocessed by the summation of consecutively taken parasternal short-axis views at 500 μm steps (Figures 2D and E). This technique gives some problems in the assessment of the apical LV due to underestimation of longitudinal movements. The subsequent conjunction of the data does not represent one heart cycle but is a merger of data acquired consecutively. In the near future, progress in technology will reduce the size of matrix transducers to the murine setting which will allow online acquisition of realtime 3D data-sets, thus giving the possibility of getting all necessary information on dynamic changes in cardiac size and structure from apical views instantaneously. Additional information on the wall structure will be possible within the same echocardiographic examination using ultrasound contrast with advanced bubble technologies and targeted molecular imaging.
Doppler echocardiography including tissue Doppler imaging
A completely different approach to assess LV function uses Doppler echocardiography. Here, as a haemodynamic surrogate, the velocity of the blood stream can be measured as a function of time. Measurements can be obtained from the in/outflow of all four cardiac orifices as well as from all larger vessels, e.g. from the aorta and pulmonary veins. Different flow velocities over a constriction (e.g. valve or vascular stenosis) can be used to reliably estimate pressure gradients using modified Bernoulli equations. 26,27
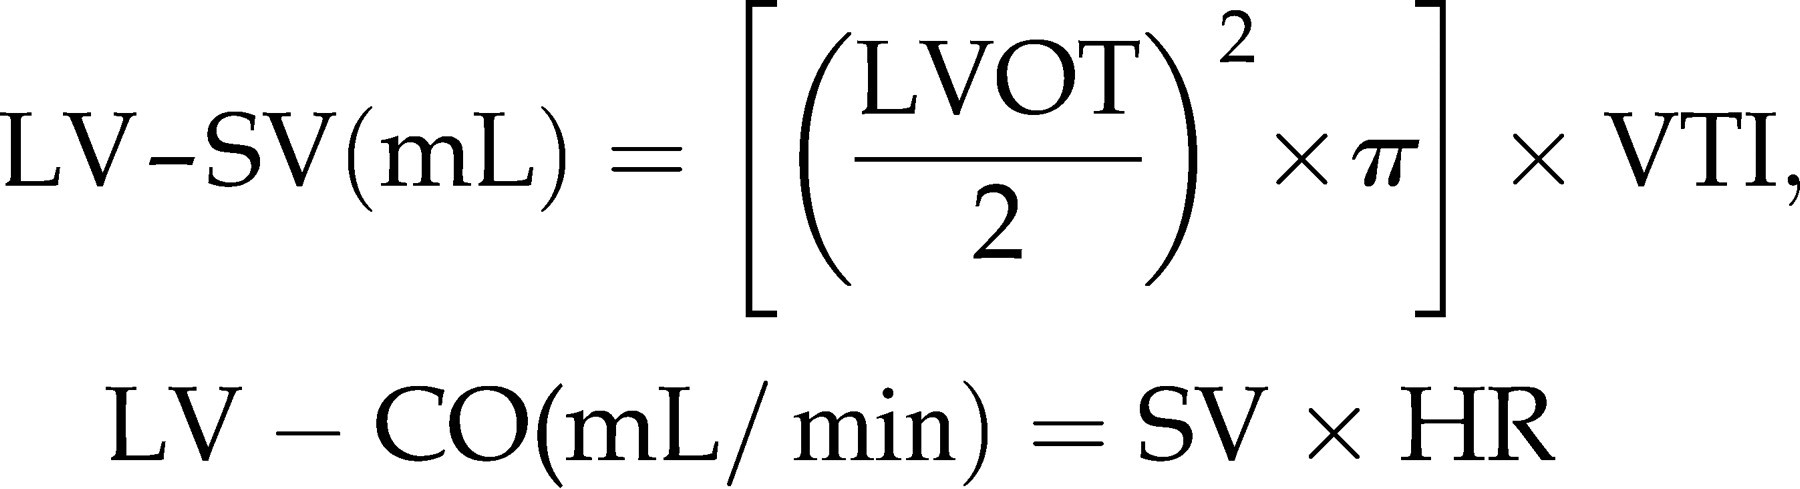
For the assessment of global LV function and valvular incompetence, Doppler measurements of aortic outflow and of mitral inflow are important. For the determination of systolic outflow of the LV, pulsed wave (PW) or continuous wave (CW) Doppler signals are obtained by placing the sample volume parallel to the flow in a modified apical view into the LVOT (Figure 4A). Cardiac output as a measure for systolic LV function can be calculated using the equation.
28,29

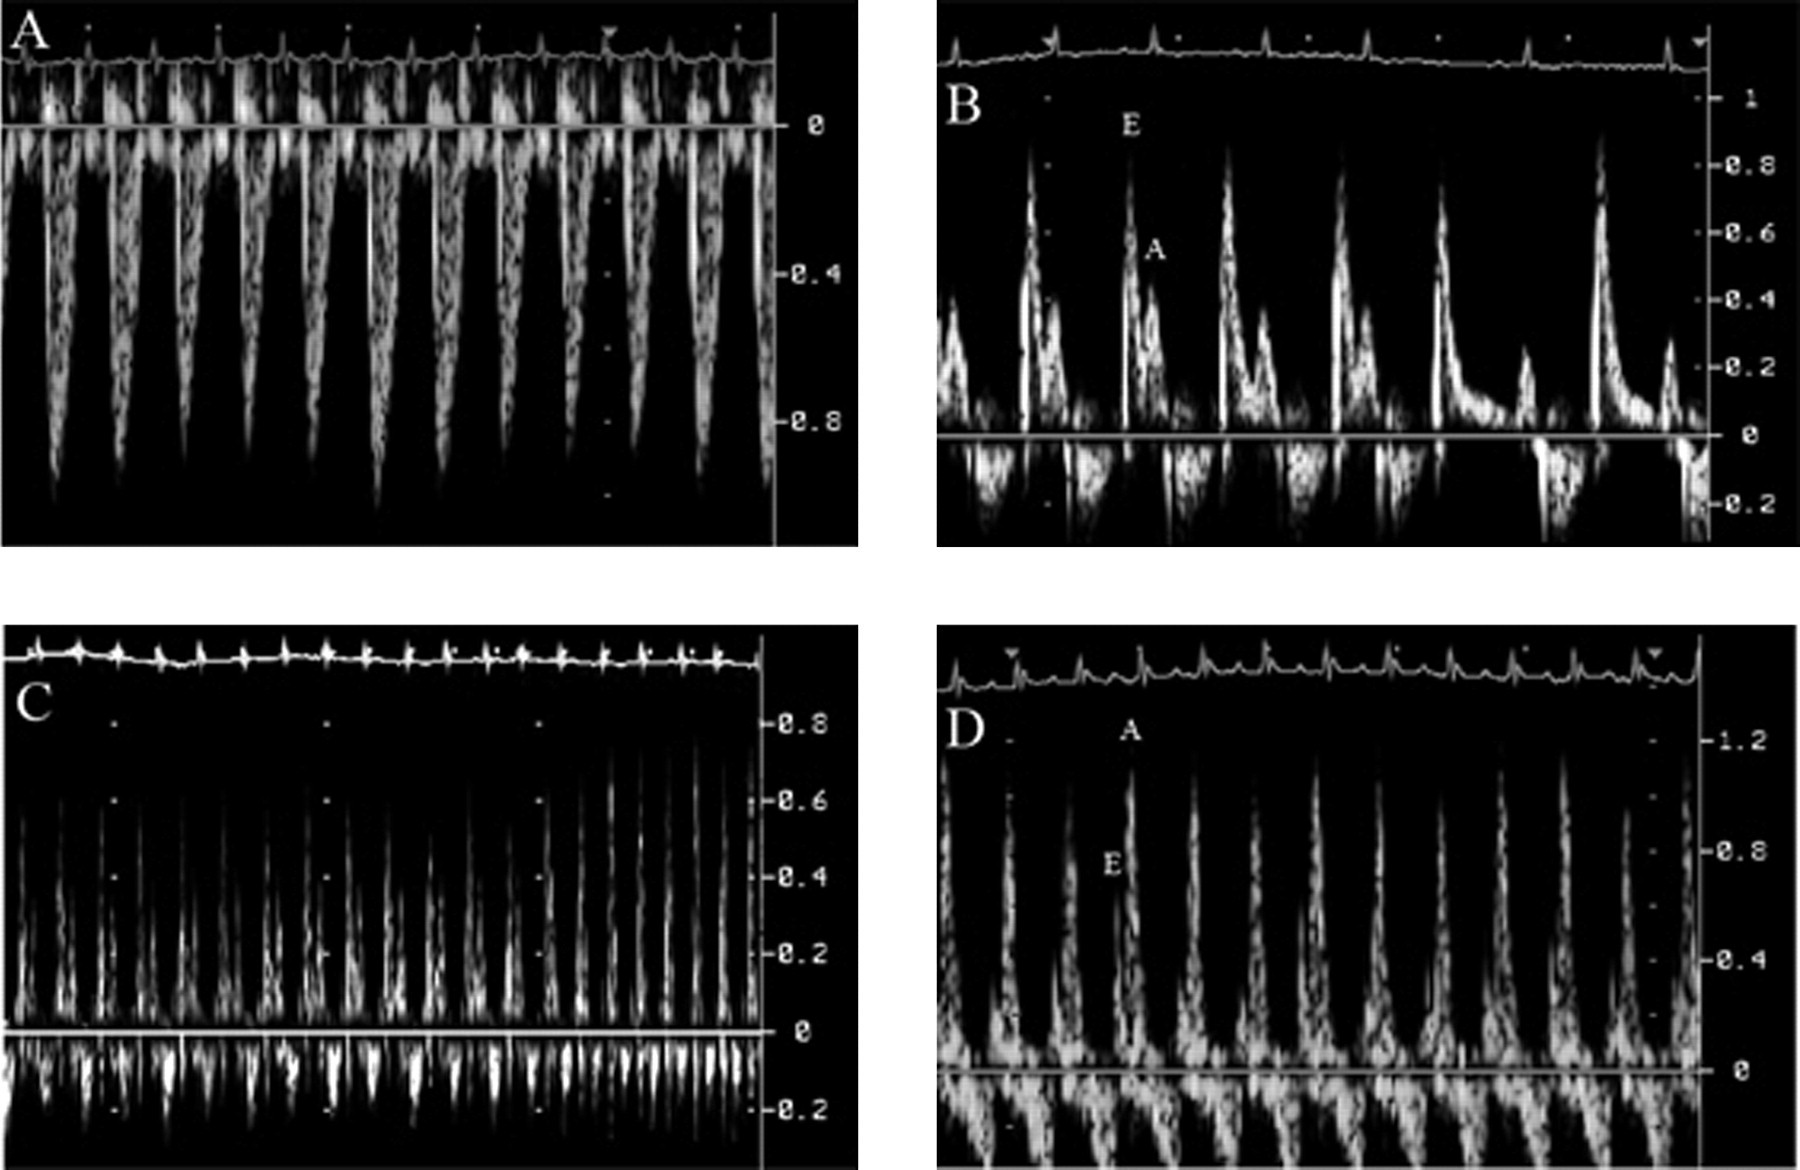
(A) – (C) Doppler recordings of a normal adult wild-type mouse: (A) LV outflow, (B) mitral inflow, at a spontaneous slowing of the heart rate, the split-up of E- and A-wave becomes more prominent, (C) mitral inflow with E- and A-wave fusing at higher heart rate, (D) mitral inflow of a mouse several weeks after transverse aortic constriction. Notice the inversed E/A ratio. (A, B and D: 150 mm/s, C: 50 mm/s)
Another possibility to correct for BW in mice is to calculate the ratio CO (mL/min)/tibia length (mm).
Cardiac output (and index) are distinctly dependent on heart rate, and thus cycle length during examination should be kept as physiological as possible.
Mitral inflow is assessed by placing the sample volume into the LV near the septum into the LV inflow. The physiological LV inflow shows two peaks, the E- and the A-wave (Figure 4B). The E-wave represents the early passive inflow into the LV; the A-wave represents the active atrial kick. Physiologically, the E-wave is higher than the A-wave; at higher heart rates, E- and A-wave usually fuse (Figure 4C). If the compliance of the LV decreases, e.g. by age or hypertrophy due to chronic arterial hypertension, the passive early inflow will decrease; due to the higher left atrial volume and pressure at the end of the passive phase, the A-wave increases (Figure 4D). Consequently, the LV inflow pattern can be used to estimate the LV diastolic function (for detailed review see Khouri et al. 32 ). Unfortunately, there are intermediate stages of diastolic dysfunction, which show a pseudo-normalized pattern and cannot be distinguished from normal mitral inflow pattern by Doppler echocardiography in mice. One limitation of ‘classical’ Doppler measurements is its load-dependency. 33,34 In patients, the normal and pseudo-normalized pattern can be differentiated by a Valsalva manoeuver which, of course, is not possible in spontaneously breathing mice. The limitation of load-dependency can be overcome with the recent implementation of tissue Doppler imaging (TDI) in mice. The principle of TDI is derived from the ‘classical’ Doppler technique. Gain and filter settings are adjusted to eliminate background noise and allow for recording of clear tissue signals. TDI measured the velocity of the change of position of myocardial structures. In mice, mostly the anterior and posterior walls are focused, 35–38 but in principle, each myocardial structure – even endocardial versus epicardial myocardium 37 – can be assessed. Physiological TDI signals show one positive and two negative deflections representing early (comparable to the E-wave) and late (comparable to the A-wave) diastolic and systolic maximal tissue velocity.
TDI has been shown to be rather load-independent. 34 Since this technique is quite new and there is still no standardization in measurements of mice, reference values are not yet available. Thus, TDI values always should be compared with an individual control group. Furthermore, this examination is rather dependent on the platform and settings used. In the future, this technique will certainly become a fairly meaningful tool in assessing systolic as well as diastolic cardiac function.
Strain and strain rate
Non-invasive detection of regional or global changes in LV performance by means of TDI and the derived parameters strain and strain rate is a great challenge for the cardiac ultrasound examination of mice. The need to quantify measurements of complex motions within the LV myocardium presently puts hardware and software of modern ultrasound platforms to their utmost limits requiring high temporal resolutions with frame rates well above 250 frames per second and spatial resolutions beneath 60 μm. Skilled examination techniques and careful interpretation of the results should minimize operator dependency. 39 Especially, angle dependency of TDI on the cosine function does not allow an easy transfer of characteristic solutions favouring the standard long-axis views used in human echocardiographic examination of rodents. Parasternal long- and short-axis views can be obtained with relative ease in mice. It is somewhat harder to acquire a good pure apical view of the murine LV. To the best of our knowledge, up-to-date data on strain and strain rate in mice have only been published in parasternal short-axis views. 37 Passive changes of tissue position caused by tethering lead to displacement which commonly is normalized to the distance from the LV apex to get rid of the cumulative effect of all myocardial contractions along the longitudinal LV wall from base to apex (Figure 5A). Strain, by definition, is relative deformation indicating how much the myocardial tissue has deformed (Figure 5B). Parametric colour coding allows us to visually distinguish three different phases (compression, isoform and stretching). Strain rate is the temporal derivative of strain indicating how fast the myocardial tissue is deforming and therefore is the intramyocardial velocity gradient of tissue deformation (Figure 5C). Strain is a good parameter for regional and global systolic function, whereas strain rate is a good parameter for diastolic regional and global function. Sebag et al. 37 could nicely demonstrate the value of strain and strain rate imaging in mice in a murine sepsis model of acute heart failure. Since myocardial contraction, myocardial stiffness and myocardial compliance are closely dependent on sufficient blood and, thus, on adequate oxygen supply, strain and strain rate indicate something about regional and global systolic and diastolic LV function. Furthermore, there is inherent information about the current tissue condition (e.g. stiffness). Future studies will hopefully help to understand how these changes in strain and strain rates correlate to myocardial architecture (e.g. the degree of fibrosis) and molecular substructures (e.g. strain differences in the molecular structure of actin, myosin or titin). New modalities like speckle tracking or the use of novel 3D-matrix transducers, small enough for the examination of mice, will facilitate the use of strain and strain rate imaging. Hereby, new insights into LV function will hopefully be obtained with more accuracy with online 3D data-sets.
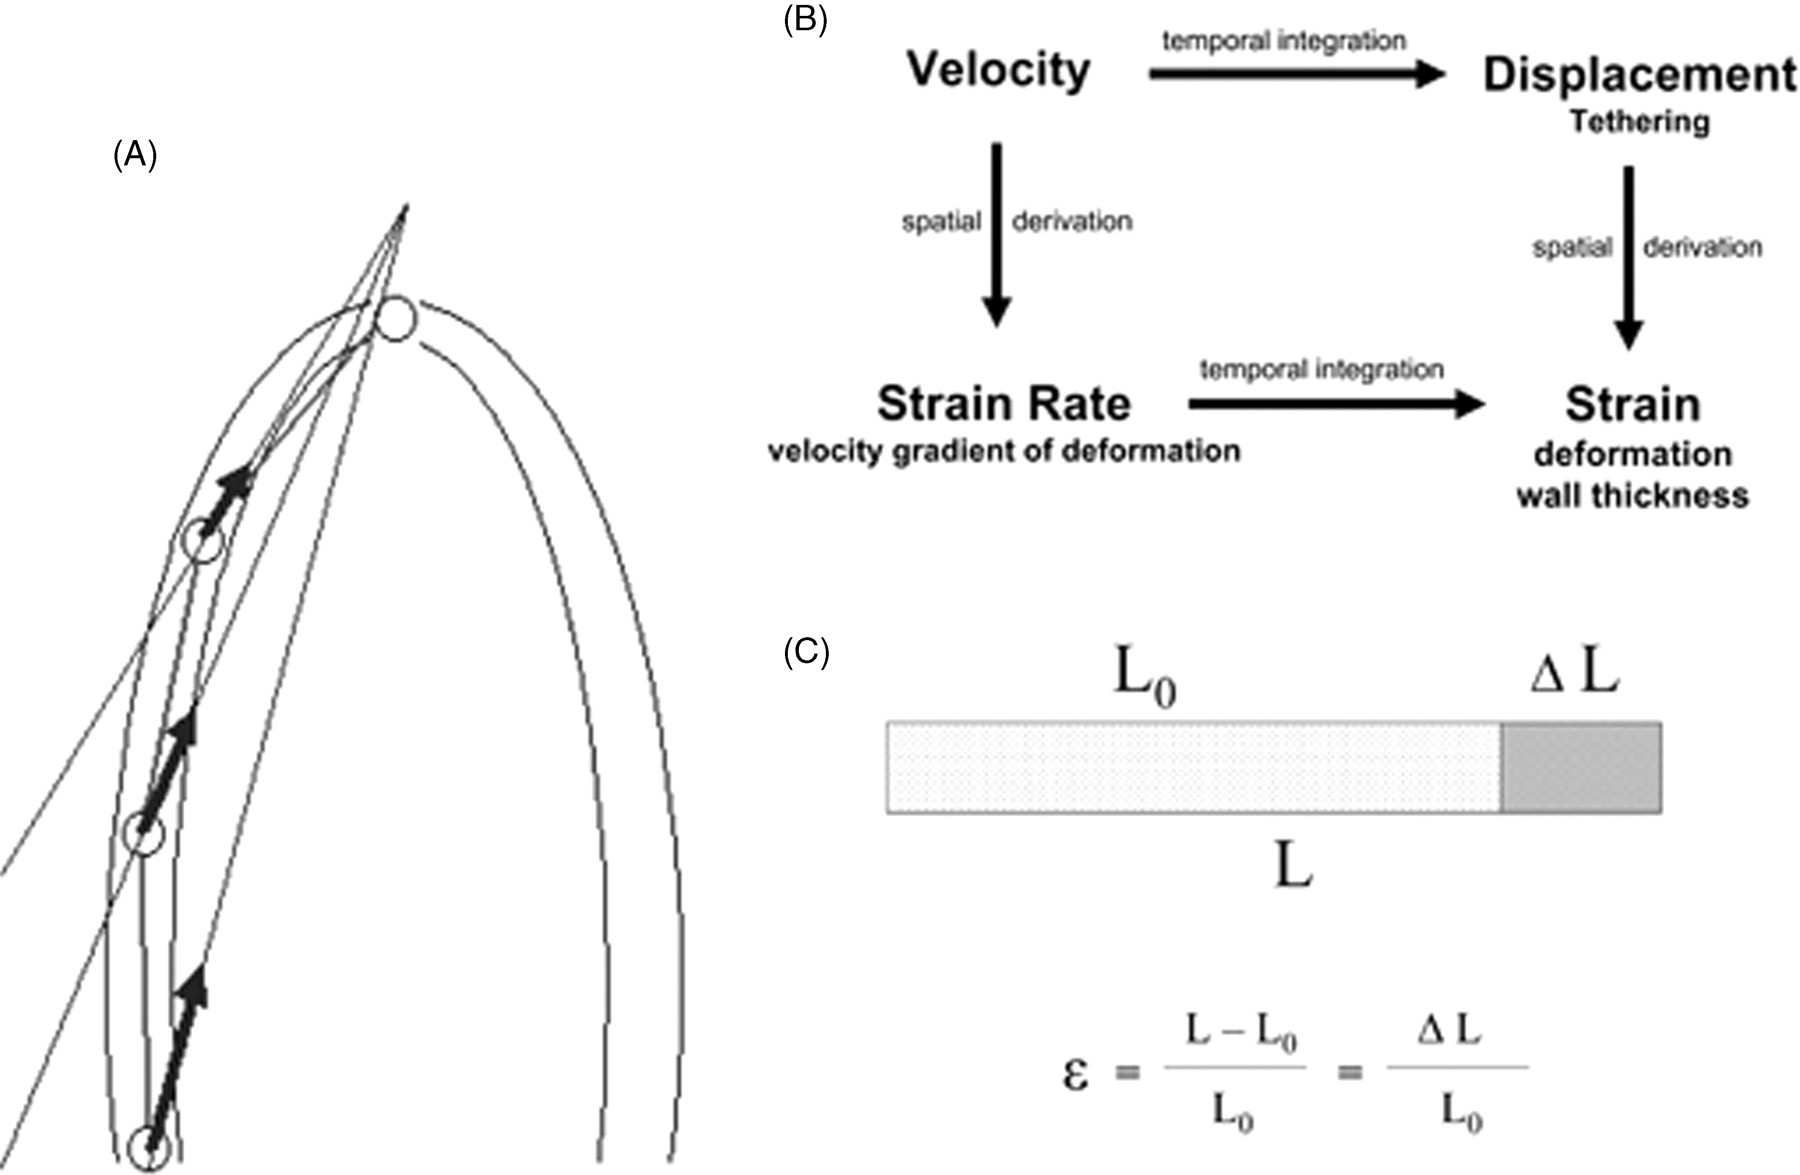
(A) Normalized velocity/displacement. The velocity and displacement in each point along the wall from apex to base is the resultant (sum) of the contraction of all the segments apical to the measuring point. Thus, division of the velocity or displacement at a certain point along the wall by the distance of the point from the LV apex will normalize the velocity and displacement for the distance, resulting in values that are similar to strain rate and strain. (Reprint with permission of Dr Asbjørn Støylen). (B) Relationship between velocity (cm/s), displacement (cm), strain rate (1/s) and strain (%). (C) Lagrangian strain ϵ showing the relation of the length (L 0) at the starting time point being lengthened for the difference in length (ΔL) to the total length at the end of stretching (L). In consequence is for L > L 0→ϵ > 0 and for L 0 < L→ϵ < 0
Specific indices
The myocardial performance index (MPI) according to Tei is a Doppler-derived index of global LV function which combines systolic and diastolic parameters.
40–42
The index is calculated as the sum of isovolumetric contraction and relaxation time (IVCT and IVRT) divided by the ejection time and is reported to be rather independent of heart rate and afterload (arterial blood pressure) (see Figure 6).

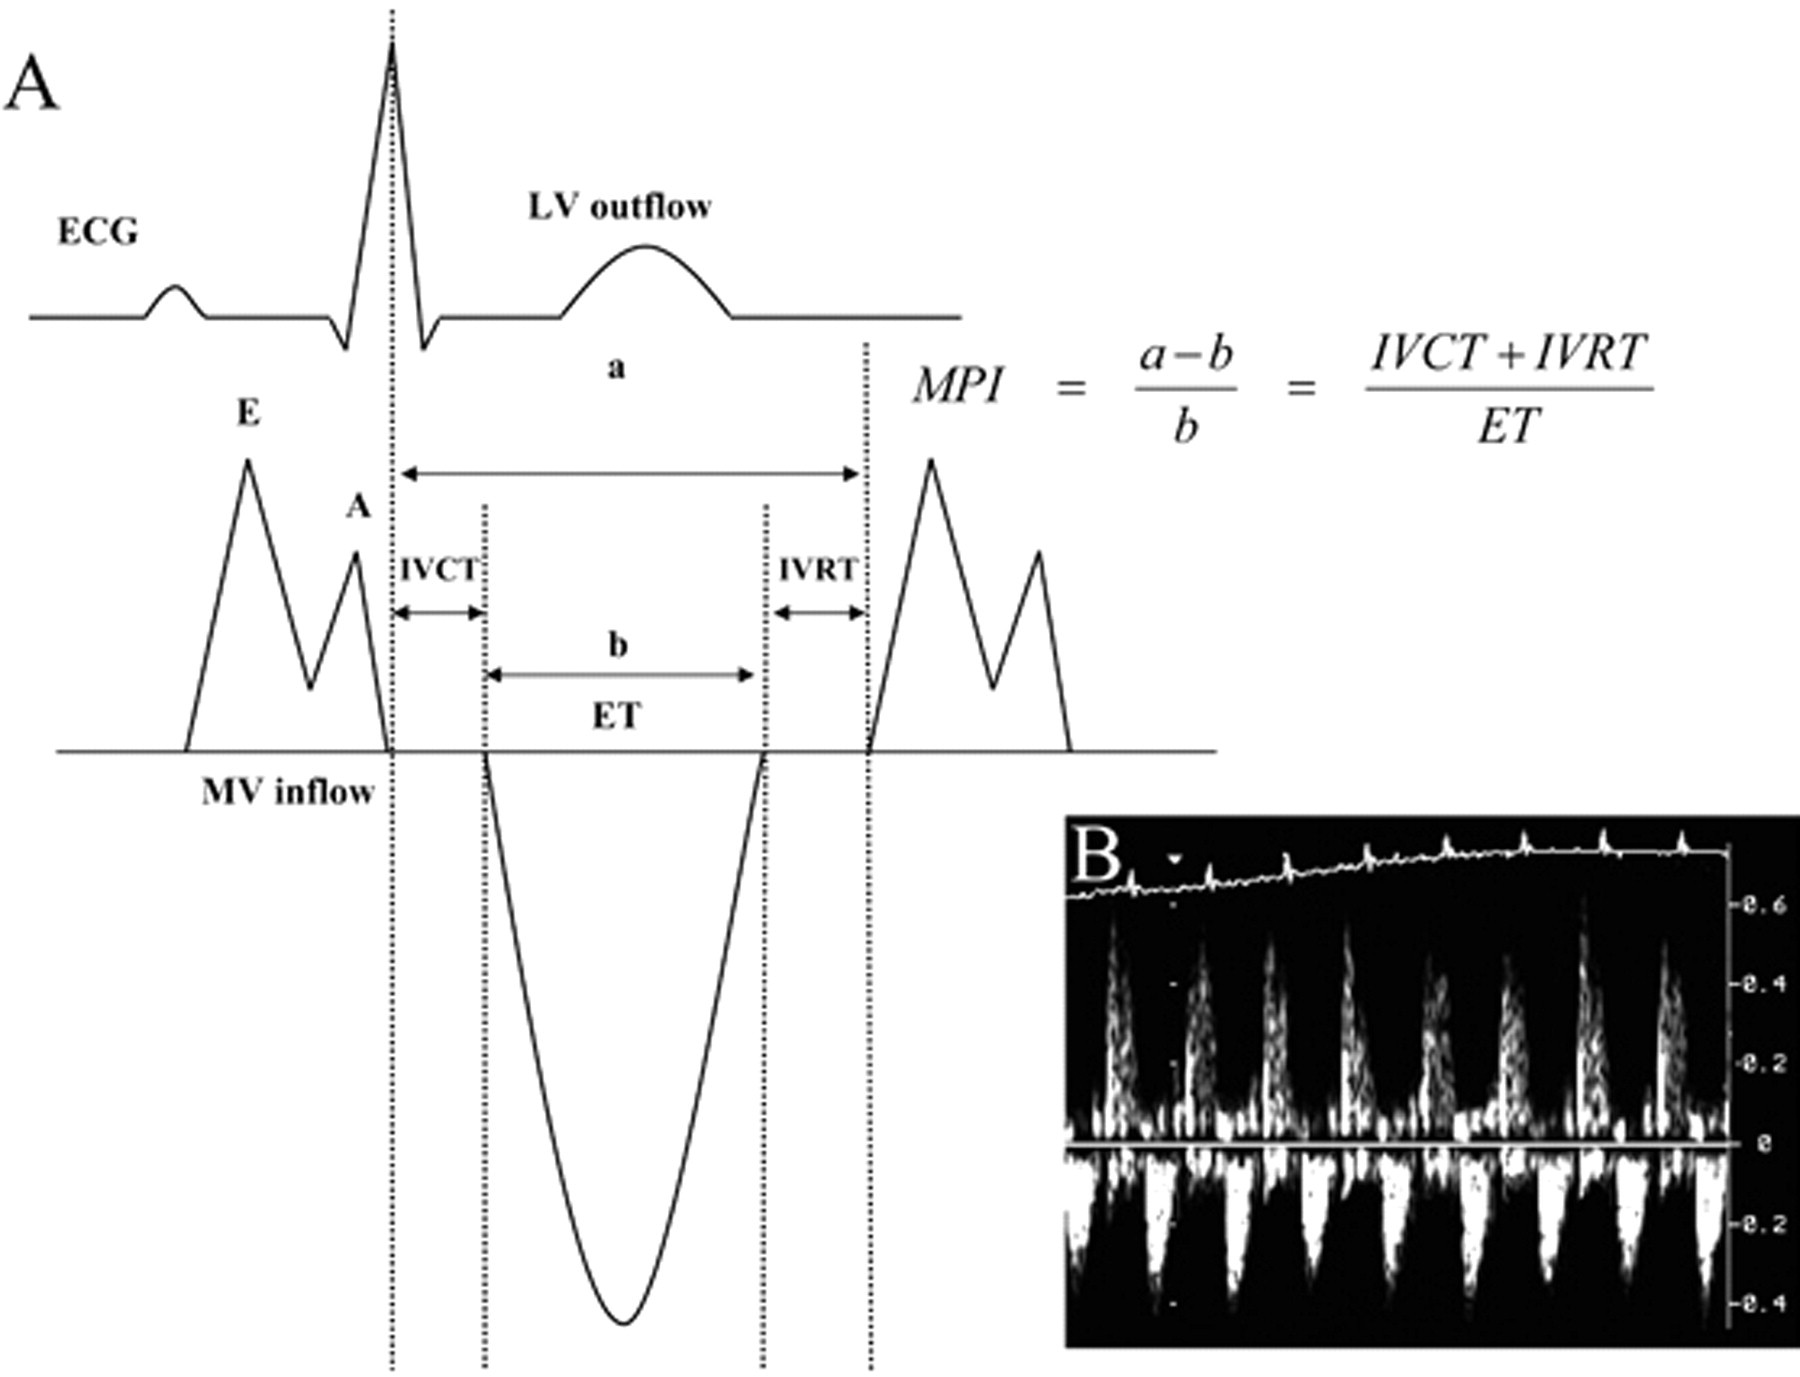
(A) Schematic illustration of the measurements for the calculation of the myocardial performance index according to Tei (according to Stypmann et al. 31 ) and (B) corresponding recording of a normal adult wild-type mouse
The index correlates negatively with global LV function. It has been shown that patients with and without congestive heart failure can easily and reliably be separated using the MPI, even if there are no other Doppler-echocardiographic signs of heart failure. 43 Recently, the MPI as a measure of global LV function in mice has been validated by Broberg et al. 44 The obtained values were only slightly higher than those measured in healthy humans. 43 This could be due to inter-species differences or to the fact that the mice were examined under narcosis. The ratio of FS(%)/MPI showed the strongest correlation with dP/dt max as a measure of systolic function. 44 The index is even applicable in mouse fetuses (E 18.5). 45 Since this index is still relatively new, there are no reference or cut-off values available yet for mice. However, the index can be used in comparison with a control group.
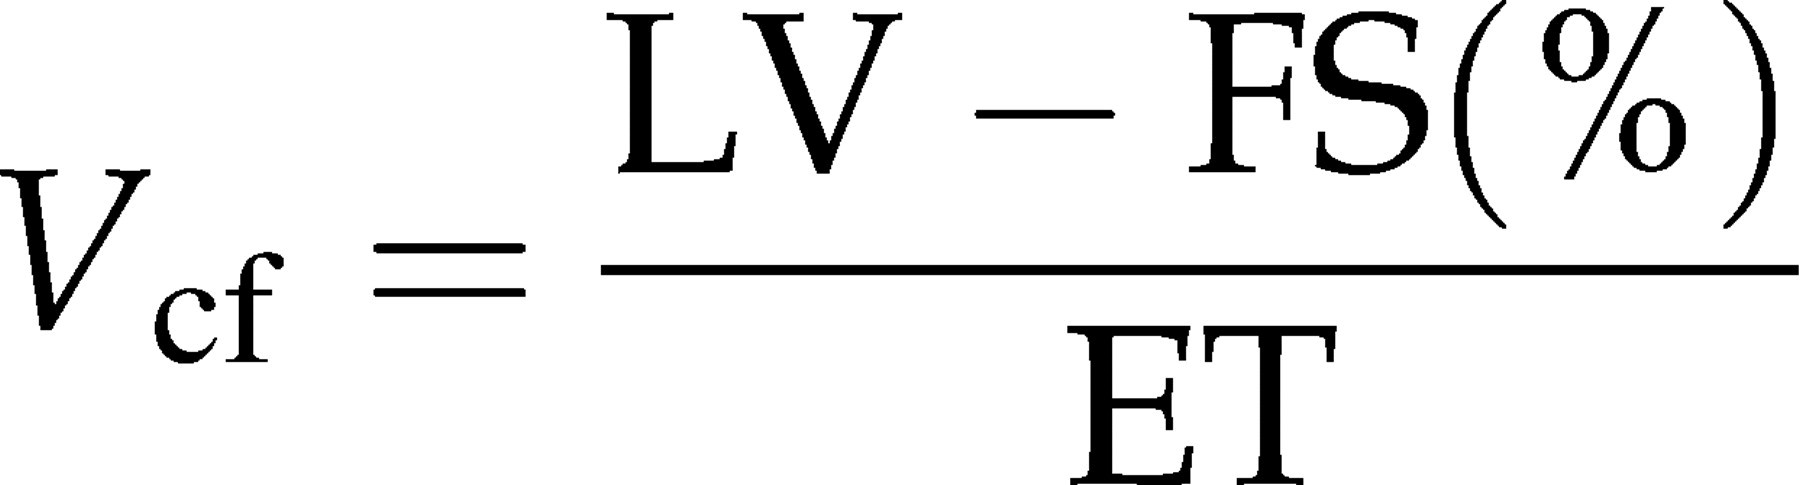
One further commonly used measure of systolic LV function is the mean velocity of circumferential fibre shortening (V
cf). It is calculated as

In addition, end-systolic wall stress (WS) can be calculated as a measure for LV afterload.
44,46,47

Assessment of LV mass, myocardial structure and architecture
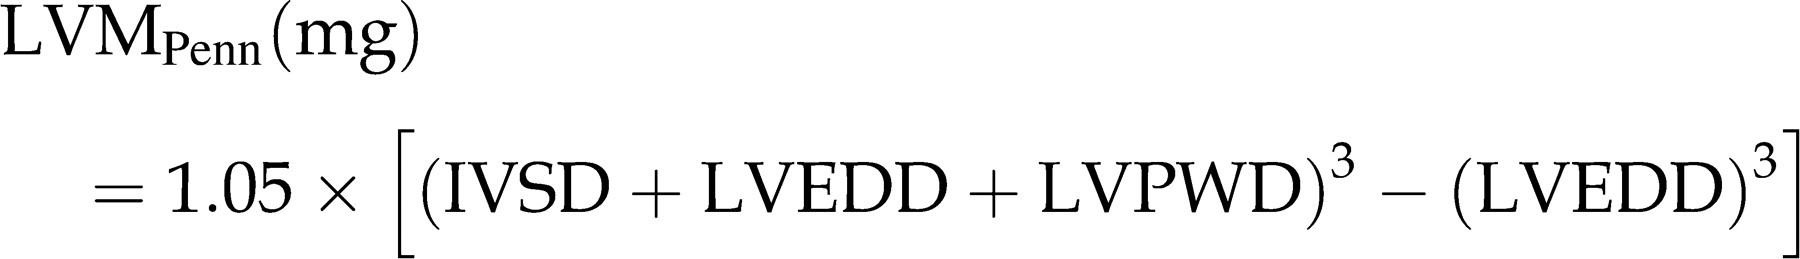
There are different ways to estimate the mass of the LV myocardium. The principle of the three following commonly used conversion formulas is to calculate the volume within the epicardial border minus the LV cavity volume, multiplied by myocardial specific gravity assuming a symmetrical architecture. The first algorithm according to Penn is based on M-mode measurements.
48,49
A second commonly used algorithm is the area–length (AL) method based on short- and long-axis B-mode data where A
1 and A
2 are the epicardial and endocardial short-axis areas, L is the length in the long-axis view and T is the mean wall thickness calculated from A
1 and A
2 (Figure 7).
49–52

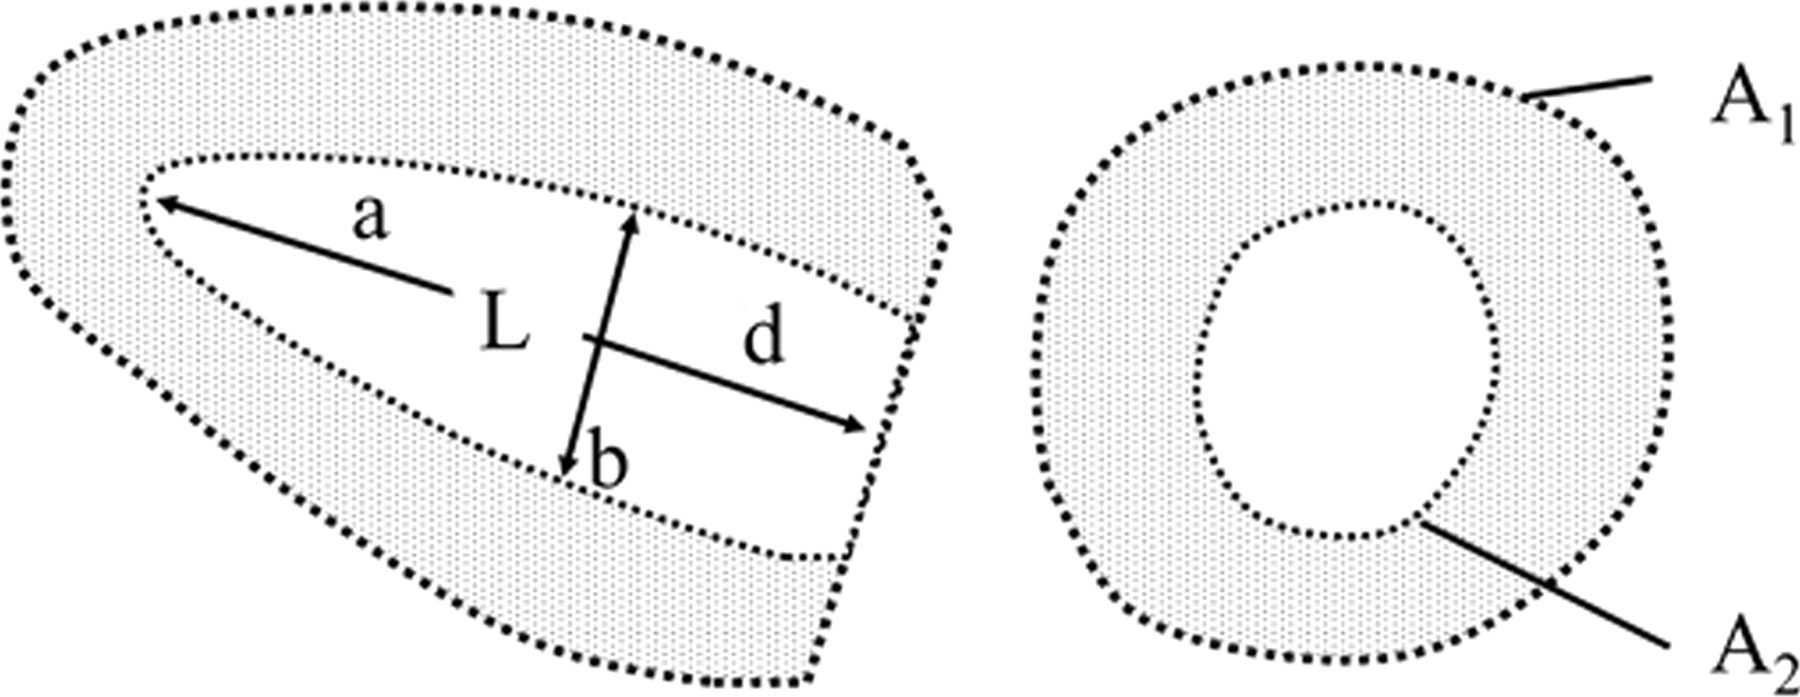
Schematic illustration of the measurements for the estimation of the LV mass according to the area-length method (according to Ghanem et al. 53 )
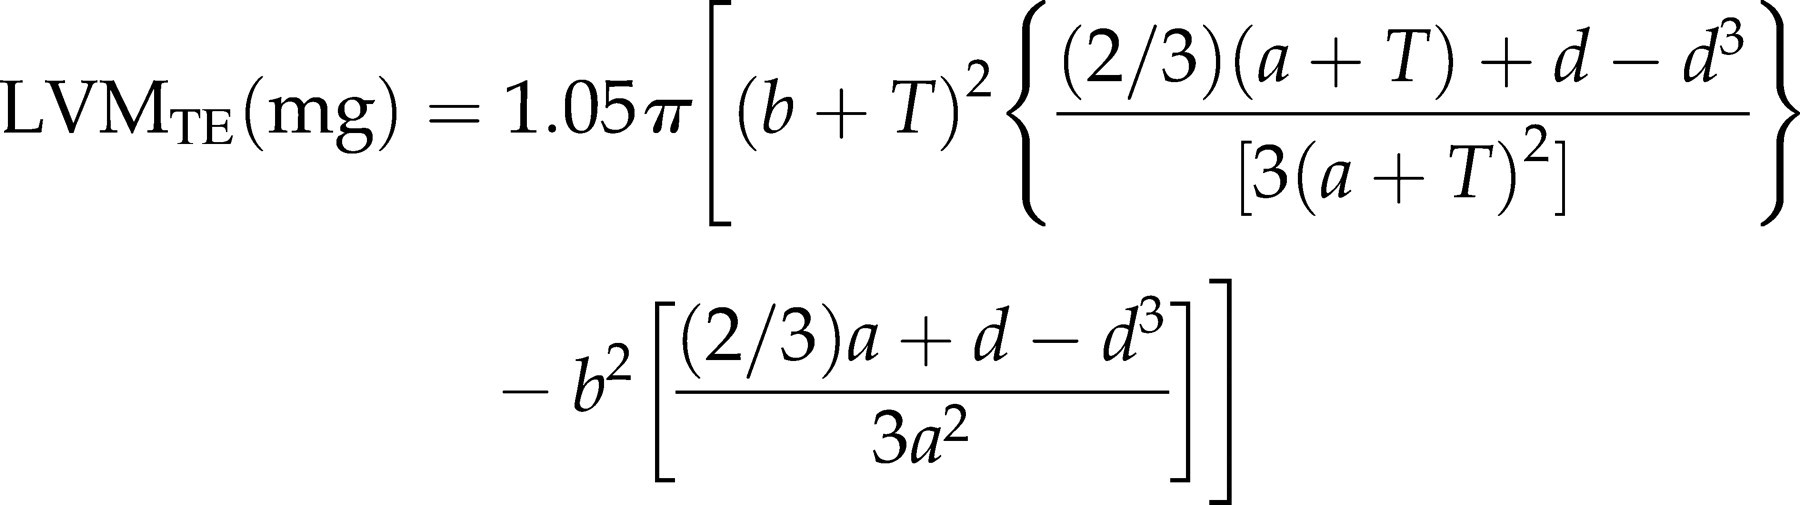
The third equation represents the truncated ellipsoid method (TE), where b is the minor axis radius of the internal diameter of the LV at the tip of the papillary muscle (as assessed in the long-axis view). Figure 7 subdivides the length (L) into the full major radius (a) and the truncated major radius (d):
All three methods have been validated with histomorphometry or necropsy.
52,53
The algorithm according to Penn seems to slightly underestimate the LV mass systematically.
49,52
For adult mice with an LV mass of more than 50 mg, the AL method seems to give the best results.
53
LV mass is often corrected for BW and therefore expressed as LV-mass-index (Figure 7
53
).
13,17,30,54

Summary
In the preceding part of this review, we summarized recent possibilities in assessing global LV function in mice using standard as well as modern echocardiographic techniques. For most standard examinations, particularly in murine models without perturbation of cardiac symmetry (e.g. senescent mice, trained mice, TAC models), standard techniques as M-mode, B-mode and Doppler echocardiography of the LV in- and outflow will be sufficient to access global LV systolic function. If impairment of diastolic function is presumed, TDI imaging of the mitral inflow can be helpful, particularly in differentiating normal and pseudo-normalized diastolic function. In models with disrupted symmetry of the LV (e.g. acute or chronic myocardial injury models with or without reperfusion), determination of function can be difficult due to great influence of section plane. A relatively small difference of the M-mode plane can result in significantly different values for FS(%). Equally, determination of LV mass can be severely disturbed in asymmetric hearts using some formulas (e.g. TE method). Finally, strain and strain rate measurements can be used to determine local reduction in LV function without relevant influence on global function. Thereby – in some cases – early stages of perturbation of systolic function can be determined at earlier stages. Most of the newer techniques are usually not used to replace established standard techniques but for complementary supplementation to get more precise results.
Specific features of murine echocardiography
One major difference between experimental murine echocardiography and clinical echocardiography in patients is that the examination of mice has to be performed under light anaesthesia. Most available narcotics have an impact on cardiac function of the mouse, 5,55–57 partly by their influence on autonomic tone, partly due to a direct cardiodepressive effect. This is especially true for previously commonly used injection narcotics such as ketamine, xylazine, phenobarbital or various mixtures of drugs. 55 The use of diazepam as sedative agent results in a relatively high heart rate, 58 but recovery after the examination can last several hours. Newer volatile anaaesthetics like isoflurane or sevoflurane have much less negative effects on the cardiovascular system, and the depth of the anaesthesia can easily be controlled and adjusted. 56,57 The normal basal heart rate of the awake and unrestrained mouse is around 475–620 bpm, 20,59–62 and heart rates between 450 bpm and 600 bpm can easily be achieved using isoflurane. Few groups have performed echo in awake mice, 5,11,63 but this technique requires a lot of training of the animals, a second researcher and much more time. Furthermore, this technique causes a high level of stress for the animal which again changes cardiac function and will especially increase heart rate. Finally, a change of cardiac morphology by fixing the mouse in a supine position cannot be excluded. The effect of three different anaesthetic regimens (ketamine/xylazine, isoflurane (0.5 − 1.5% in O2) and diazepam as well under baseline conditions and under pharmacological adrenergic stimulation (isoprenaline) are exemplarily shown in Table 1 (data not published).
Effect of different anaesthetic regimens on cardiovascular function
FS: fractional shortening, EF: ejection fraction; V cf: velocity of circumferential fibre shortening
Furthermore, temperature control is extremely important to avoid temperature-related changes in cardiovascular function. 64 Differences between different strains of mice as well as between male and female mice have to be considered. 65
As in clinical echocardiography, murine echocardiography is rather dependent on the experience of the investigator. Further on, most research is done using echo-platforms primarily constructed for clinical echocardiography in patients. Therefore, there are hardly any standardized settings available for echocardiography of mice. This is particularly valid for TDI and strain (rate) measurements. In the future, these problems may at least partly be overcome by introducing guidelines and standards for murine echocardiography and platforms specifically designed for the use in small rodents.
Conclusion and outlook
Ultrasound imaging in mice already provides pictures of high temporal and spatial resolution of the LV. Improvements in computing will increase the frame rate, and new generation matrix transducers will soon give the opportunity of online 3D imaging. Another focus of echocardiographic image improvement will also lie on new strategies as molecular imaging using smart ultrasound contrast agents. This will allow more detailed information to be gained about myocardial function and wall structure even down to subcellular levels. Furthermore, therapeutical application of high-intensity focused ultrasound for non-invasive drug delivery or genetic transfection mediated by micro-bubbles are under development. Contrast echocardiography using the flash-replenishment technique will allow myocardial perfusion to be precisely assessed. Measurement of perfusion and molecular imaging including therapeutic approaches are the main focus of a project of the Collaborative Research Centre (SFB) 656, Project C3.
Footnotes
ACKNOWLEDGEMENT
The first two authors contributed equally to this work.