
Abstract
We assess the impact of the Airport Project Berlin Brandenburg (BER) on the business performance of its owner company, using financial accounting data from Flughafengesellschaft Berlin Brandenburg m.b.H. (FBB) and eight control cases for 2005 through 2023. We analyze how the BER project influenced FBB’s revenues, cost, profitability, equity, and liabilities. The total value consumed by the BER project amounts to €11.915 billion. A forecast of business prospects until 2030 indicates enduring problems. We contribute to the literature by empirically quantifying the impact of poor governance and decision-making failures on project stakeholders. Further, our study shows the usefulness of publicly available financial data for analyzing megaprojects.
Introduction
This article addresses the impact of infrastructure projects. Specifically, our case study assesses the impact of the Airport Project Berlin Brandenburg (abbreviated as the “BER” project) on the economic development of its owner firm, the airport company Flughafengesellschaft Berlin Brandenburg m.b.H. (abbreviated as FBB). We are interested in measuring the impact of an infrastructure project delivered by project-based firms on the economic development of a publicly owned client organization that wants to deliver services to its clients.
Project management research and practice did not always prefer this outcome-oriented view of project success. In contrast to other management research disciplines, such as information systems (DeLone & Mc Lean, 1992, 2003; Petter & Mc Lean, 2009) or innovation management (Hauschildt, 1991) that developed comprehensive systems for measuring the impact of IT systems or innovations, project management has for a long time focused on the fulfillment of goals related to budget, time, and technical specifications (Jugdev & Müller, 2005). The contemporary view is much broader: the intended outcomes for the project stakeholders should be the main success criteria and input-related criteria, such as keeping within budget and timeframes, should be goals used in addition to the outcomes (Pinto & Ika, 2023; Zwikael & Meredith, 2021).
However, the questions of how much value a project creates for its stakeholders, how much value was consumed, and which future value creation may be possible regarding the project’s real option value have not been well answered in the case of projects ordered by public utilities. Their projects become increasingly complex, and their cost and time overruns also increase. The major problem here is that the citizens and most researchers do not get information on when, how, and why such overruns develop and how they impact the business performance of the public utility.
The input-oriented measures of time and budget performance and the output-oriented criteria are not independent. Suppose a costly and complex infrastructure project like an airport needs much more time and consumes many more resources than planned; in this case, the success of the business case will probably be negatively affected. With the current analysis, we want to show how much this matters. We use a long history of accounting numbers from 2005 through 2023 for the Berlin Airport project and its project owner FBB, as well as for comparison cases. We can therefore show how the effects accumulate over time and in which periods earnings or losses accelerate or slow down. The BER case is unique in that it provides specific accounting information that is usually not given in the financial statements of major German public utilities.
In their work on large infrastructure projects, Flyvbjerg and coauthors make the case that cognitive and political biases leading to delusion and even deception can be responsible for large budget and time overruns and lower benefits than pretended. (Flyvbjerg, 2014; Flyvbjerg et al., 2003, 2009, 2018, 2020). Love, Ika, and others have criticized that this would be the dominant source of time and budget overruns and that such overruns may not occur so often (Ika et al., 2023; Love et al., 2019, 2024). Denicol et al. (2020) document that the delusion-and-deception explanations of project failures are the most intensively discussed ones in the megaproject management literature. According to these theories, proponents of a project promise much more than can be delivered to get acceptance for their plans. In the BER case, two competing scenarios were favored by different groups of actors. Initially, the plan envisioned a much larger airport, with promises that the residents of Berlin and its surrounding areas would no longer suffer from noise and air pollution; therefore, such an airport should be located farther from the city. However, the winning coalition in the parliaments of the three project owners—the Federal States of Berlin and Brandenburg and the German State—preferred a location much closer to Berlin to get social acceptance for this plan. They have developed a proposal for a much smaller airport, which could be completed in less time and with a smaller budget. At the time, Berlin suffered from high debt, and Brandenburg had a small gross domestic product (GDP) that did not allow too large investments. The main argument for the smaller alternative near Berlin was the economic viability of such a project. Delusion and deception were also present in the BER case, with the project consistently portrayed more positively than its actual status. However, this was not the primary reason for delays, budget overruns, and lost revenues.
A major issue with public project business plans in Germany is their lack of transparency. Even members of parliament tasked with evaluating and overseeing public projects often do not receive adequate information regarding the initial plans and adjustments made following cost or budget overruns. Instead, there is a selective disclosure process aimed at securing the support of a coalition of parliamentarians to approve additional funding and revised timelines. Added to this is the lack of expertise of those responsible in supervisory boards in companies with governmental law participation.
Therefore, our analysis aims to examine the published and approved financial reports of airport companies to evaluate their business performance and identify which changes were specifically influenced by FBB’s implementation of the BER project, as opposed to control cases that were not undertaking such a large-scale project during the 2005 through 2023 investigation period. The advantage of this method is that interested readers also have access to these public reports and can do their own research on this information base.
We selected the BER project as a case study because of its potential to significantly impact the economic development of FBB. Additionally, specific data is available regarding the annual investments, write-offs, and other financial activities related to the BER infrastructure and other FBB infrastructures. We aim to thoroughly document how the BER project’s cash flows have influenced the parent company’s financial health. While the success of the business case is often emphasized, there is rarely a detailed exploration of how project expenditures directly impact business performance. This is particularly important for citizens, who ultimately bear the financial risks of publicly funded projects but rarely gain insight into how major projects affect the economic development of the public firm responsible for them.
The central research question of this article is: What are the impacts of the BER project on the development of business performance of its owner company FBB?
The term “development” means that we conducted a longitudinal analysis of the BER project and its impact on the FBB. We compared the development of the FBB with the development of the other eight large German airport firms to interpret the accounting figures. We assessed these impacts during the construction, repair, and usage stages. Our impact analysis covers the analysis of financial accounting data and handled passenger volumes from the eight largest German airport companies from 2005 through 2023. We also provide an economic outlook for three scenarios for the FBB in the years 2024 through 2030. We excluded the front end (1990 through 2004) from our financial analysis because it is difficult to get reliable and valid accounting data, as the FBB in its current form was created in 2003 and called FBS at the time. The expenditures during the front and planning stages of the BER project have been much smaller than those during the investigated construction, repair, and usage stages.
The term “business performance” can be interpreted in different ways. Our impact analysis covers five areas of business performance:
The development of passenger volume and freight volume. The development of revenues and expenses and the resulting surpluses or deficits. The development of the expenses for the investment and financing of the BER project. The development of equity and debt. The economic outlook for the years 2024 through 2029.
This study makes three key contributions to project studies. First, it quantifies the impact of poor governance and decision-making failures on project stakeholders, highlighting the need for greater transparency, particularly in publicly funded projects like the BER project. Second, it demonstrates the usefulness of publicly available financial data for analyzing megaprojects, emphasizing that financial realities, not expectations, shape a company’s future. Third, the study documents how negative developments, such as accumulating losses and debts, gradually escalate over time, providing insights into the long-term effects of such projects and their future implications.
The Development of Benefits for Project Stakeholders
Before getting into the detailed analysis, we want to provide an overview of other impacts of the BER project to see how other project stakeholders have been affected. Typically, public infrastructure projects like the BER project should create large benefits for infrastructure users and regional development. Additional revenues and productivity increase in operations should ultimately finance the investment required to undertake such projects. Negative impacts on the environment or people living near the infrastructure should be avoided or compensated.
Benefits and Costs for BER Users
Much fewer passengers use BER than the old Tempelhof, Tegel, and Schönefeld airports, which have been closed. The loss of passengers cannot be explained alone by the COVID-19 pandemic. According to the CEO of FBB, Aletta von Massenbach, compared with the pre-COVID-19 year, 2019, only one-third of the passengers flying within Germany returned (FBB press release 8 May 2024), flights within Europe reached 72%, and intercontinental flights were about the same level as in 2019. In contrast to the old Tegel and Schönefeld airports, which handled 35.6 million passengers in 2019, the new BER airport only handled 23.1 million passengers in 2023 (i.e., the overall recovery rate of FBB compared to the pre-COVID-19 pandemic is only 64.7%). The average recovery rate of the other eight largest German airport companies in 2023 was 79.5%, in other words, 15% higher than BER. In 2024 (January through July), BER had a recovery rate of 68%. The average recovery rate of the other eight largest German airport companies in 2023 was 81.9%, in other words, 14% higher than BER.
Why is BER lagging so much behind in terms of passengers? The fees for flying increased much more than at the comparison airports, and the travel time to reach the BER airport was longer than that of the old Tegel airport. Also, wait times before and after flights were longer at the new airport (Göldner, 2024). “There are times when it still doesn’t work well,” admits the CEO of FBB Aletta von Massenbach at the presentation of the balance sheet for 2023. This also makes her dissatisfied because baggage handling should “always work” (Göldner, 2024). Thießen (2014, p. 5) explains why passengers at the BER sometimes have longer wait times for their luggage:
“In the case of BER, the arrangement of the baggage carousels was chosen in such a way that in several cases only two lanes are available for baggage carts between two baggage carts. The IATA manuals show that a third lane should be available. If the third lane is missing, an airport can in principle also be operated. However, the risk of congestion increases and the capacity of the airport decreases, as it is not possible to react appropriately to congestion in the process. Manual interventions are necessary, which increase personnel costs and thus operating costs. Nobody would plan an airport from the outset with only two lanes for baggage carts. It is not the most cost-effective option in terms of operating costs. It is actually an emergency solution. This emergency solution is already included in the first building application.”
Quality problems plagued BER. Although relatively few passengers used the new airport in 2021, the operational issues were so massive that Lufthansa formally advised its customers to appear at the airport four hours before the planned departure (Spiegel, 2021). In 2022, BER got the lowest quality ranking of all German airports in the quality ranking from Air Help (https://www.airliners.de/airhelp-flughafen-ranking-ber-platz/64963). Every year, the company Air Help, which supports customers in claiming their flight rights, conducts a comprehensive global study on the service quality of airports. This ranking considers time performance (60%), customer opinion (20%), and food and shops (20%). A recent study from Holidu (MAZ online, 13 September 2024b) analyzed 34,766 Google ratings of 85 larger European airports (excluding Ukraine and closed airports) and rated BER 3.0, ranking 82 out of 85. All large German airports were rated better and ranked between 30 (Munich) and 68 (Cologne).
Regarding services, BER is an underperformer. A new airport, advertised to become the most modern one in Europe, should have operations that perform much better. Overall, the passengers of the new airport had to cope with higher costs and higher investments in time and quality problems despite a comparatively low passenger load.
Impact on Regional Development and the Environment
Regarding the regional development of the three regions around the old airports, the former Tempelhof airport site has become a popular location for leisure activities and the temporary accommodation of refugees. A referendum prevented new residential buildings from being built on this site. Tegel was planned to become a location for an applied university, future-oriented start-ups, and better cooperation between industry and research, especially in connection with the neighboring Siemens City. These plans were set back by the admission of refugees in Tegel (Gabriel & Hoppen, 2023) and by a lack of funding for the promised development. Overall, Berlin’s economic regional development effects were limited and much lower than expected and promised. The region around the BER airport has developed economically very well; this was rooted in the economic policy of the Federal State of Brandenburg but is now also fostered by the new BER airport.
However, the passenger volumes at BER have not developed well, and the perspectives for the future are also not very positive. FBB’s CEO assumed BER would not reach the pre-COVID-19 pandemic level before 2030 (MAZ online, 22 March 2024a). Even this reduced goal would imply that the passenger volumes would increase each year by 6%. This is an overly optimistic forecast, since Germany’s gross domestic product is decreasing and a declining labor force caps future growth. In addition, Münster and Böldt (2024) reported that Ryanair—the biggest airline at BER airport—plans to reduce its fleet by 23%. These plans will likely be realized because the tax- and fee-related costs for air travel are not only higher at German airports than at other European airports, but they also increased strongly: “Following the renewed increase in the air traffic tax on 1 May 2024, the state location costs for a flight from a German airport to another European country with a typical medium-haul aircraft (Airbus A320neo with 180 seats, 85% load factor) will add up to between 4000 and 4400 euros. By comparison: in Barcelona, the state location costs are around 660 euros, in Rome around 2200 euros” (Helf & Klay, 2024, p. 2).
The net capacity of the BER airport is not very high because we need to subtract the capacities of the closed Tegel, Schönefeld, and Tempelhof airports. Flight numbers of the new airport were capped by the planning approval decision (“Planfeststellungsbeschluss”) of the Ministerium für Stadtentwicklung, Wohnen und Verkehr (MSWV) des Landes Brandenburg (2004). This initial 2004 planning approval was contested, and further constraints were made by the highest administrative court (Bundesverwaltungsgericht) on 16 March 2006 to keep noise and pollution levels within reasonable limits (Müller, 2020, p. 247):
The 24-hour operation permission was replaced by a restricted night closure between midnight and 5:00 a.m. and a reduced operating volume on the edges of the opening hours. Noise protection was strengthened—that is, no flights for noise measures above 60 dB(A) days and 50 dB(A)/L max = 6 × 70 dB(A) nights were to be allowed.
Furthermore, German air traffic underperforms other European and non-European countries. In 2010, 53% of the passengers from Germany either took a nonstop flight to an Asian destination or a stop at a German hub. In 2023, only 36% used a nonstop flight or a German hub (BDL, 2024). In 2010, the market share of German airlines for passengers flying to Asia was 28%; in 2023, it was only 17% (BDL, 2024). This means that the German air traffic providers have lost competitiveness.
Overall, the new airport’s impact on the regional development of Berlin and Brandenburg is lower than initially intended and lower than that of other airports.
The impact of BER’s development on the people and the environment is mixed. While aircraft noise within Berlin has decreased with the closure of the Tempelhof and Tegel airports, Brandenburg residents, particularly around Schoenefeld, have experienced increased noise due to the new airport. Noise affects fewer people but remains a significant issue in the densely populated BER region. Moreover, noise is only one concern; recent studies highlight other adverse effects of air traffic such as ultrafine particle emissions.
It was important to provide this contextual information at the beginning of our analysis, because infrastructure projects usually benefit users and regional development, but this did not happen in the BER case. Contrary to expectations, the number of passengers went down more at BER than at the other eight large German airports and will probably not reach the pre-COVID-19 pandemic level in this decade.
The Development of Operational Volumes, Revenues, Costs, and Surplus or Loss
The Setting: Passengers and Sales Revenues Until the COVID-19 Pandemic (2005–2019)
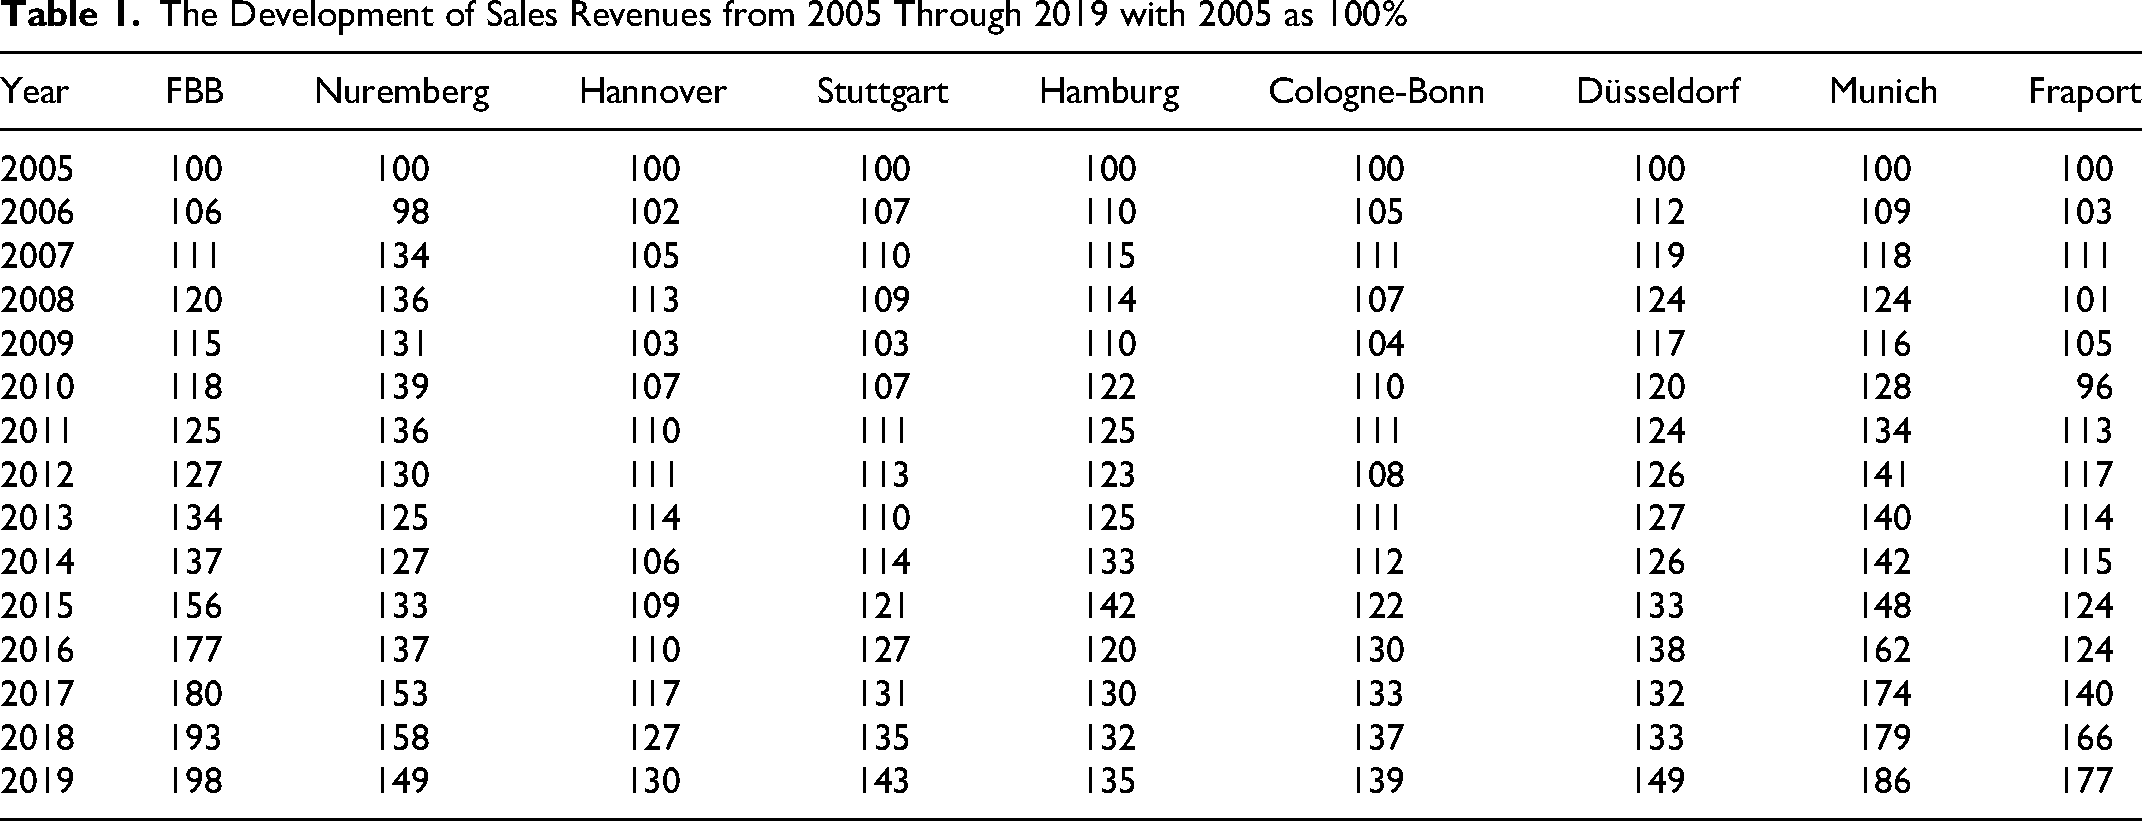
FBB realized the highest passenger growth of the nine biggest German airport companies with its old airports from 2005 through 2019. Compared to 2005, FBB doubled the number of passengers transported (208.4%). Against this background, it is understandable that constructing a new airport made sense. The goal was to move toward the Frankfort and Munich hubs.
The rising number of passengers also led to rising sales revenues (Table 1). Compared to 2005, FBB nearly doubled its sales revenues (198%). The biggest German airport companies also raised their sales revenues very strongly: Munich reached 186%, Frankfort 177%, and the other five airport companies reached between 130% and 150%.
The Development of Sales Revenues from 2005 Through 2019 with 2005 as 100%
FBB’s top managers were delighted with the company’s development. They wrote in their annual report of the FBB (2018, p. 5): “Dear Ladies and Gentlemen, the air traffic location of the capital city region is continuing to develop very dynamically. Therefore, the Airport Company can look back at a successful fiscal year 2018 with substantial growth in the core business. The operative results (EBITDA) of the Berlin airports achieved a new record value in 2018 with EUR 118.7 million.”
The Operating Results Until the COVID-19 Pandemic (2005–2019)
Was this assessment correct? How did the operating results of the FBB develop? We calculated the key metric operating results by deducting the most important expenses regularly incurred in the core business from the revenue. These are the costs of materials, personnel, and other operating expenses. In addition, we deducted depreciation and amortization of assets and interest expenses. The FBB also paid expenses for noise protection for the citizens in the neighborhood. The FBB should have made a provision for this kind of liability and accounted for the realized expenditures under the other operating expenses. However, FBB reported these expenditures as tangible assets instead of deducting them in the period they occurred. To address this questionable accounting practice, for which we have found no legal basis, we have adjusted by subtracting the noise protection expenses in the appropriate period. The notes of the annual corporate accounting reports clearly detail these realized expenditures.
Our analysis shows that FBB’s operating result has been negative since 2006, and an operating loss of €102.4 million was incurred in 2018. Over the whole period (2005–2019), operating losses accumulated to €2,096.4 million. In this situation, we consider it problematic to create the impression that FBB is in a good earnings position (Table 2).
The Development of Cumulative Operating Results from 2005 Through 2019
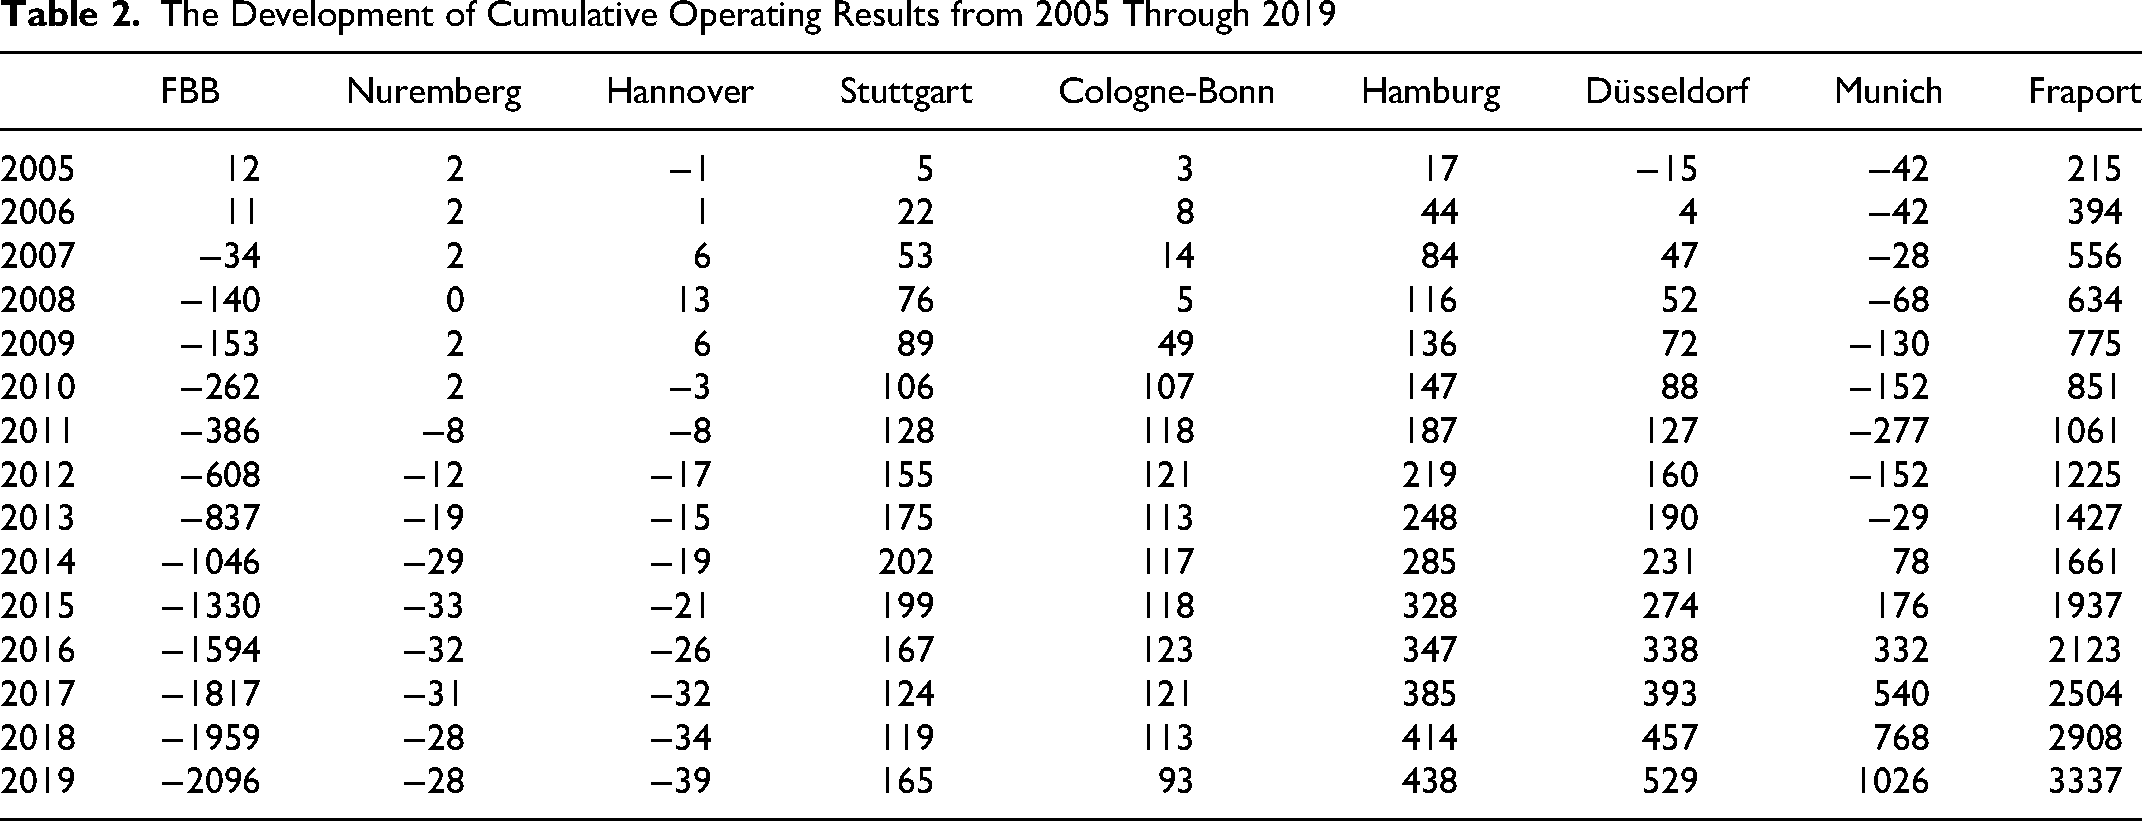
In contrast to these losses, the other larger airport companies have made large to very large operational surpluses:
Fraport €3,337 million Munich €1,026 million Düsseldorf €529 million Hamburg €438 million Stuttgart €165 million Cologne-Bonn €93 million Nuremberg €-28 million Hannover €-39 million
The group of smaller airports has made only modest surpluses or modest negative results:
Compared to its passenger volume, we would have expected a considerable surplus, like in Hamburg and Düsseldorf, from FBB.
What happened in the years after 2019? On 31 October 2020, the BER airport opened during the COVID-19 pandemic. Table 3 documents the operating results
Operating Results in the Years 2020 Through 2023
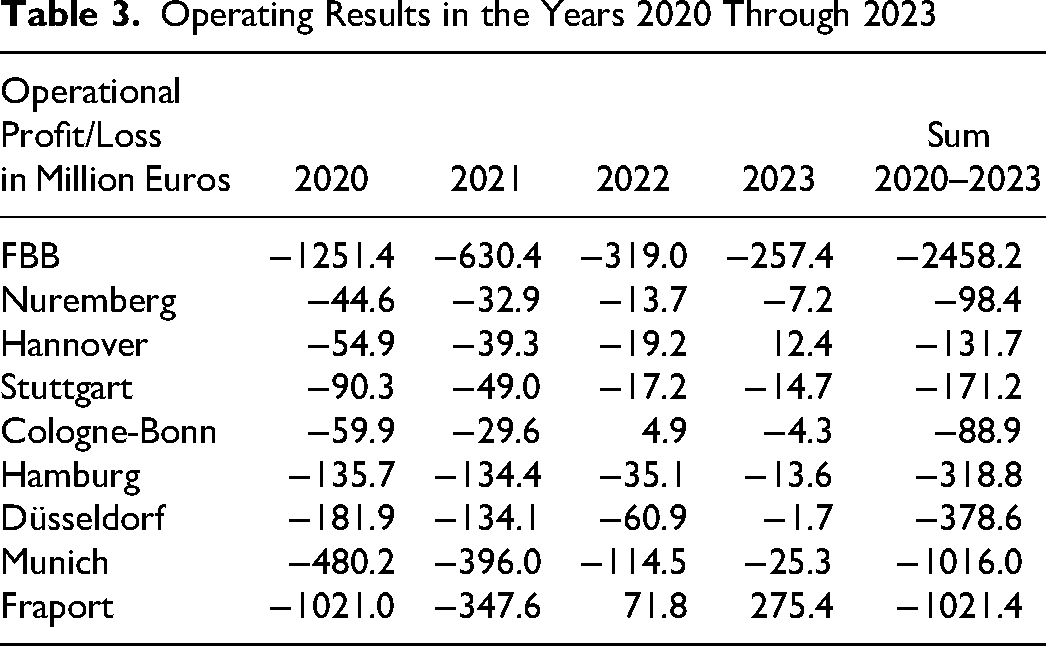
All German airports suffered operating losses in 2020 and 2021 and started to recover in 2022 and 2023. Only Frankfort has had an ongoing operating surplus since 2022.
FBB had extremely high losses from 2020 through 2023. In 2023, the FBB was again the worst-performing German airport company. FBB is a much smaller airport company than the Munich airport company or the Fraport AG. How was it possible to incur such a loss?
One explanation for this loss is that the FBB had to make an extraordinary write-off on its assets in 2020. However, this also means that a considerable proportion of loan repayments can no longer be made through earned depreciation and amortization and that FBB has problems with debt settlement. The need for a high extraordinary amortization existed beforehand (Gemünden & Wolf, 2020; Gemünden et al., 2020a, 2020b), but the situation became critical following the airport’s opening. The drastic downturn in business prospects due to the COVID-19 pandemic crisis intensified the necessity for this adjustment. Failing to make such a correction could have suggested deceit, potentially leading to serious legal repercussions. One may still debate if the correction was high enough for a fair and true valuation of FBB’s fixed assets. However, the ordinary planned depreciation is still very high due to the fixed assets’ remaining book values, which will reduce the operating results for many years to come. In our next steps, we want to determine to what extent FBB’s operating losses can be explained by lower revenues (per passenger or ton of freight), higher expenditures—or both.
The Revenue Side of the Operating Results
Table 4 shows the revenues per passenger earned by the nine largest German airport companies. We differentiate among periods: before the COVID-19 pandemic (2017 through 2019); the exceptional year, 2020, when the COVID-19 pandemic began; 2021, when the pandemic still had a major influence; and the two recovery years, 2022 and 2023. We use a weighted average, dividing the sales revenues earned in a period (e.g., 2017–2019) by the number of passengers transported. This approach is better than averaging the yearly averages, because the years with more transported passengers contributed more strongly to the cumulative operating results. To come up with the revenues made at Frankfort Airport, we subtracted all revenues made at Fraport’s other airports from Fraport’s total sales revenues; then, we divided this number by the number of passengers at Frankfort Airport.
Revenues per Passenger at the Nine Largest German Airports in Three Different Periods
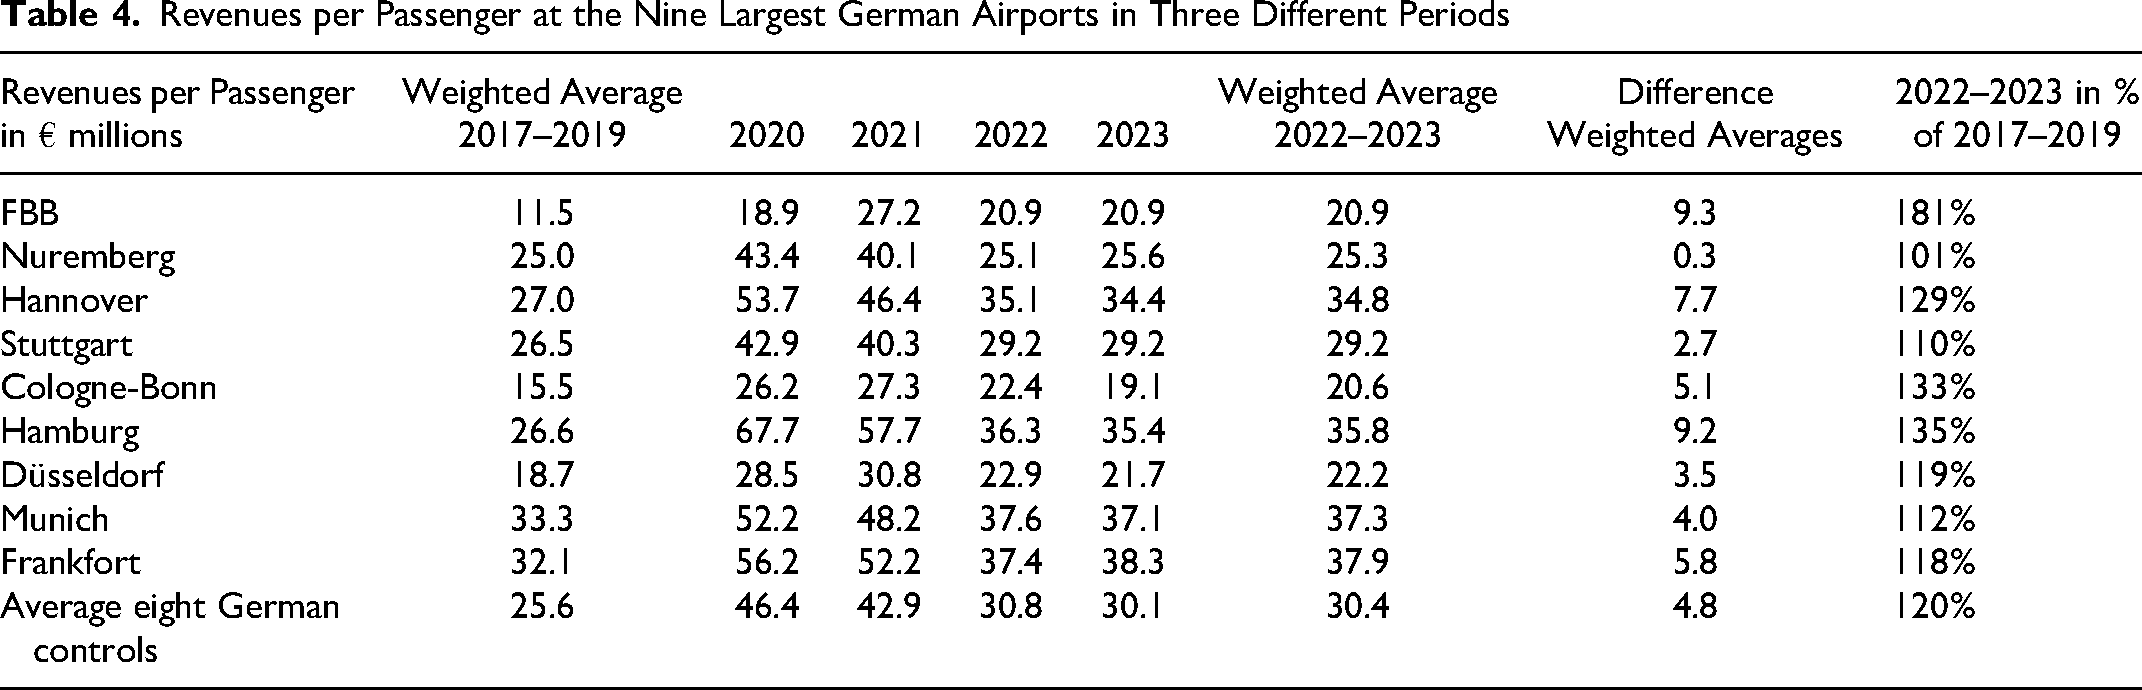
FBB generated by far the lowest revenues per passenger of all bigger German airport companies from 2005 through 2019. These differences are structural, in other words, they have existed since 2005 and persisted. In the two catch-up years, 2022 to 2023, with the new BER airport FBB could nearly double the revenues per passenger. However, this was not only a result of the higher fees, better shopping and dining opportunities, or the more costly parking lots. On average, the other airports also increased their revenues per passenger by 20%.
However, raising the fees at BER very strongly negatively impacted the number of passengers. The recovery ratio is defined as the number of passengers in 2023 divided by the number of passengers in 2019, the last year before the COVID-19 pandemic. The recovery rate of FBB was 64.7% in 2023; the average of the other eight airport companies was 79.5%.
Four factors can explain the low recovery rate at the BER airport:
Flights are more expensive for passengers because airport charges have risen, and traveling to BER has become more costly than traveling to Tegel. Passengers need more time to travel to BER, and luggage wait times are higher than before (Göldner, 2024). The low-cost airlines offered fewer flights because the BER airport had become less profitable for them (Helf & Klay, 2024). Firms started using more videoconferencing during the COVID-19 pandemic and replaced face-to-face meetings with virtual ones.
This means that the increase in sales revenues at BER is significantly lower than the increases in fees and revenue per passenger. The long-term perspective is essential. Passenger numbers will not increase as much in the future with BER’s price-sensitive clientele as with the hubs in Munich and Frankfort, which serve many more profitable international business customers. The meta-analysis from Brons et al. (2002) clearly shows that business-class passengers and long-distance travelers, who are typical hub customers, are much less price-sensitive.
The choice of a business model to attract more profitable international clients was unrealistic (Lufthansa, 2023). The region surrounding BER does not have enough business-class passengers to support multiple intercontinental flights to the same destinations daily. Furthermore, airlines already committed to established hubs in Munich and Frankfort have no interest in abandoning these hubs in favor of Berlin Brandenburg.
Meanwhile, low-cost airlines that once operated at BER have either gone bankrupt (Air Berlin) or significantly reduced their fleets due to the increasing fees at the airport, longer travel times to and from BER, and the substantial rise in air traffic taxes imposed by the German government (Helf & Klay, 2024). Thus, Berlin’s position as a hub for congresses, events, and city tourism has suffered significantly. Politicians who initially advocated for a business model focused on higher revenues per passenger are now blaming the airlines for not offering enough flights, but the airlines simply prioritize destinations that are more profitable for them (Münster & Böldt, 2024).
Overall, the business strategy for BER has failed for these reasons:
The FBB could not establish BER as a hub comparable with Munich or Frankfort and it is unlikely to achieve this status. Many low-cost passengers who once used BER have not returned, as airlines that catered to them reduced their offerings. This has significantly harmed the region’s cultural and business events, leading to job losses and decreased tax revenues. German airports have lost international competitiveness due to rising taxes on air traffic. In 2010, 53% of German passengers flew directly to Asia or via a German hub, but by 2023, that figure had dropped to 36% (BDL, 2024). The rise of new hubs, particularly in Turkey, has further drawn passengers away from German airports, making it harder to increase intercontinental flights.
The Cost Side of the Operating Results
We identified three cost drivers that explained the insufficient operational results of the FBB compared with its comparison airports. All numbers are expressed as a percentage of sales revenues. Figure 1 illustrates the following:
FBB has much higher write-offs and depreciation on assets than the control cases. Between 2005 and 2023, FBB’s depreciation in the income statement accumulated to €2.927 billion. The FBB took big loans to finance the BER project, leading to five times higher interest expenditures than the comparison cases. Between 2005 and 2023, the FBB’s interest expenses accumulated to €1.430 billion. Other operating expenses are also much higher in the FBB case than in the comparison cases. Their volume of €1.736 billion is driven by the noise protection expenditures, which accumulated to €495 million until 2023. We assume that the cost for consultants, lawyers, legal processes, and early termination of executive contracts also contributed to these expenditures because there is such a big difference between the control cases (Loy, 2023).
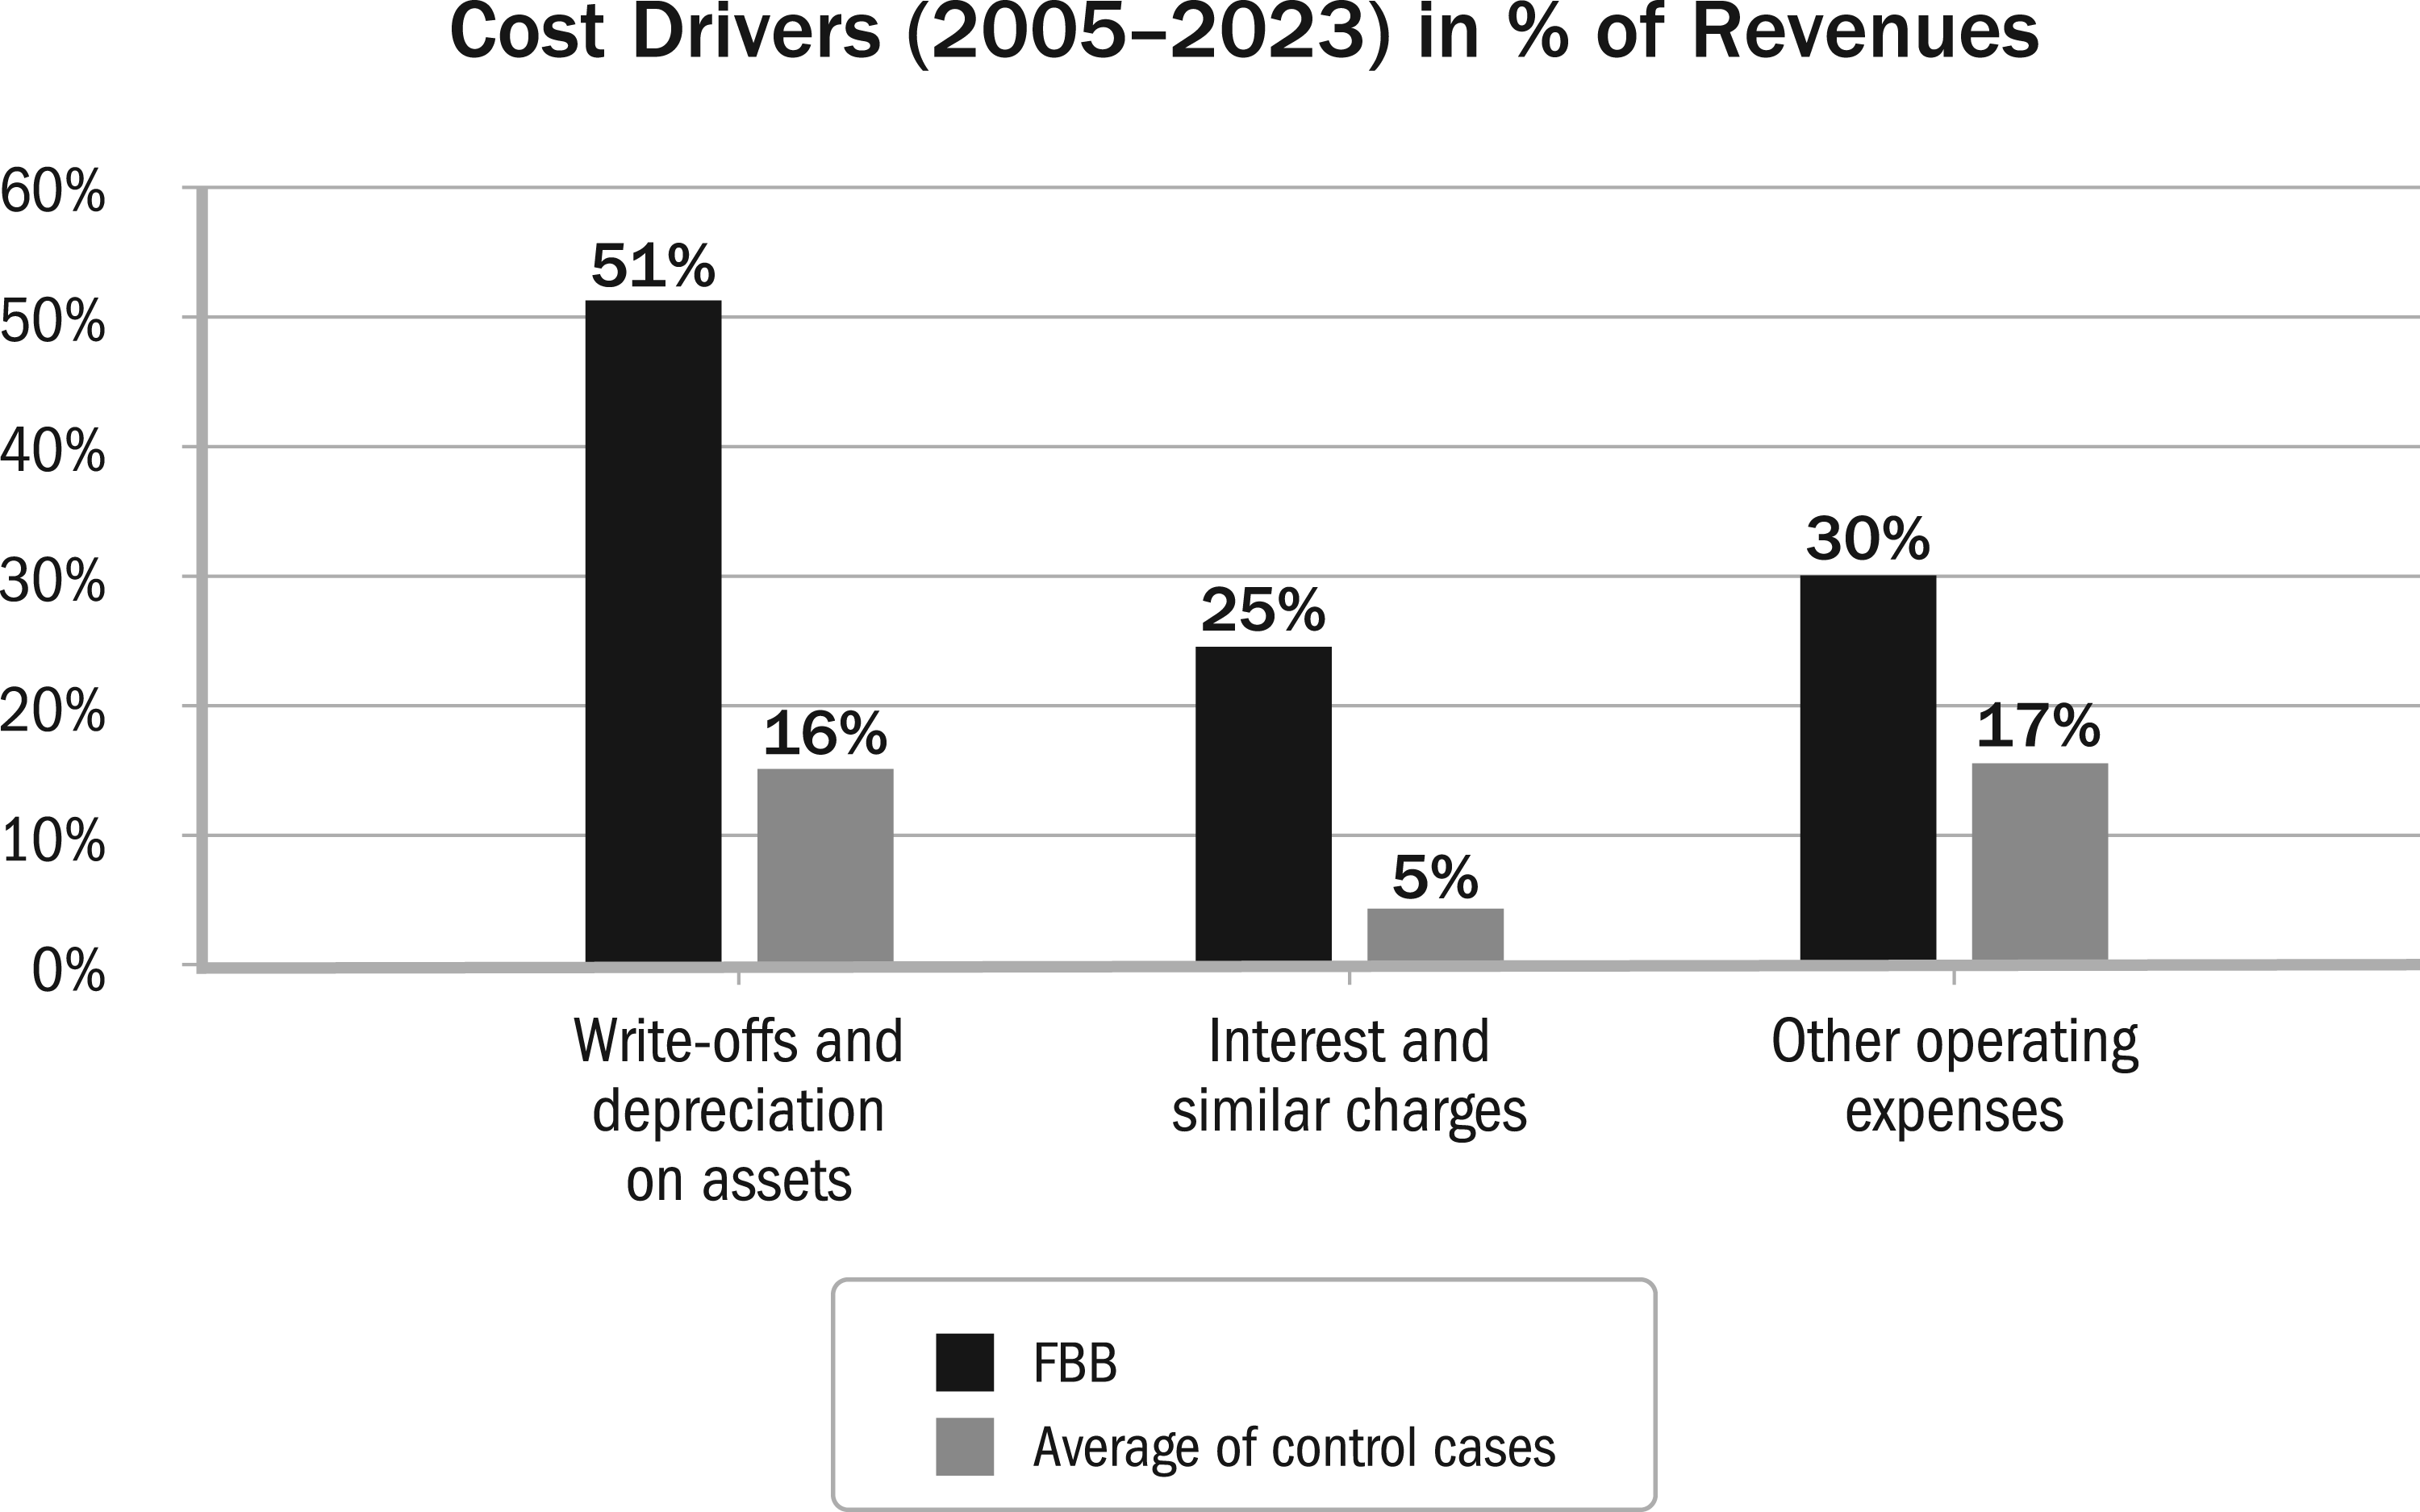
Cost drivers at FBB and comparison airport companies.
The rising costs of depreciation, interest payments, and other expenses had already negatively impacted the operating results of the old airports, but these pressures intensified with the opening of BER, severely disrupting FBB’s financial balance. The old airports did not earn sufficient revenues, but the elephant in the room was the BER project, which had already loaded FBB with more than €2 billion before the airport was opened.
Regarding the ability to finance itself, FBB suffers from revenue and cost problems. While passenger unit revenues have increased, they remain lower than those of the control cases. Additionally, the revenue side remains insufficient due to the relatively slow recovery of passenger numbers to pre-COVID-19 pandemic levels. Considering revenues and costs, it is evident that FBB’s financial situation has deteriorated since the onset of the BER project.
How the BER Project Expenditures Influenced FBB’s EBITDA
An advantage of our case study is that we can show the longitudinal behavior of the accounting figures. We illustrate this by accumulating the earnings before interest and depreciation over time, in other words, from 2005 through 2023. It is defined by subtracting the cumulative costs of material, personnel expenses, and other expenses from the cumulative sales revenues. Table 5 shows that this metric accumulated to nearly €300 million by the end of 2023. It is a positive number—the preferred metric the FBB uses in its report. However, it is a selectively chosen gross margin, it does not show the overall success.
The Influence of the Expenses for the BER Project on the Cumulative Results of the FBB
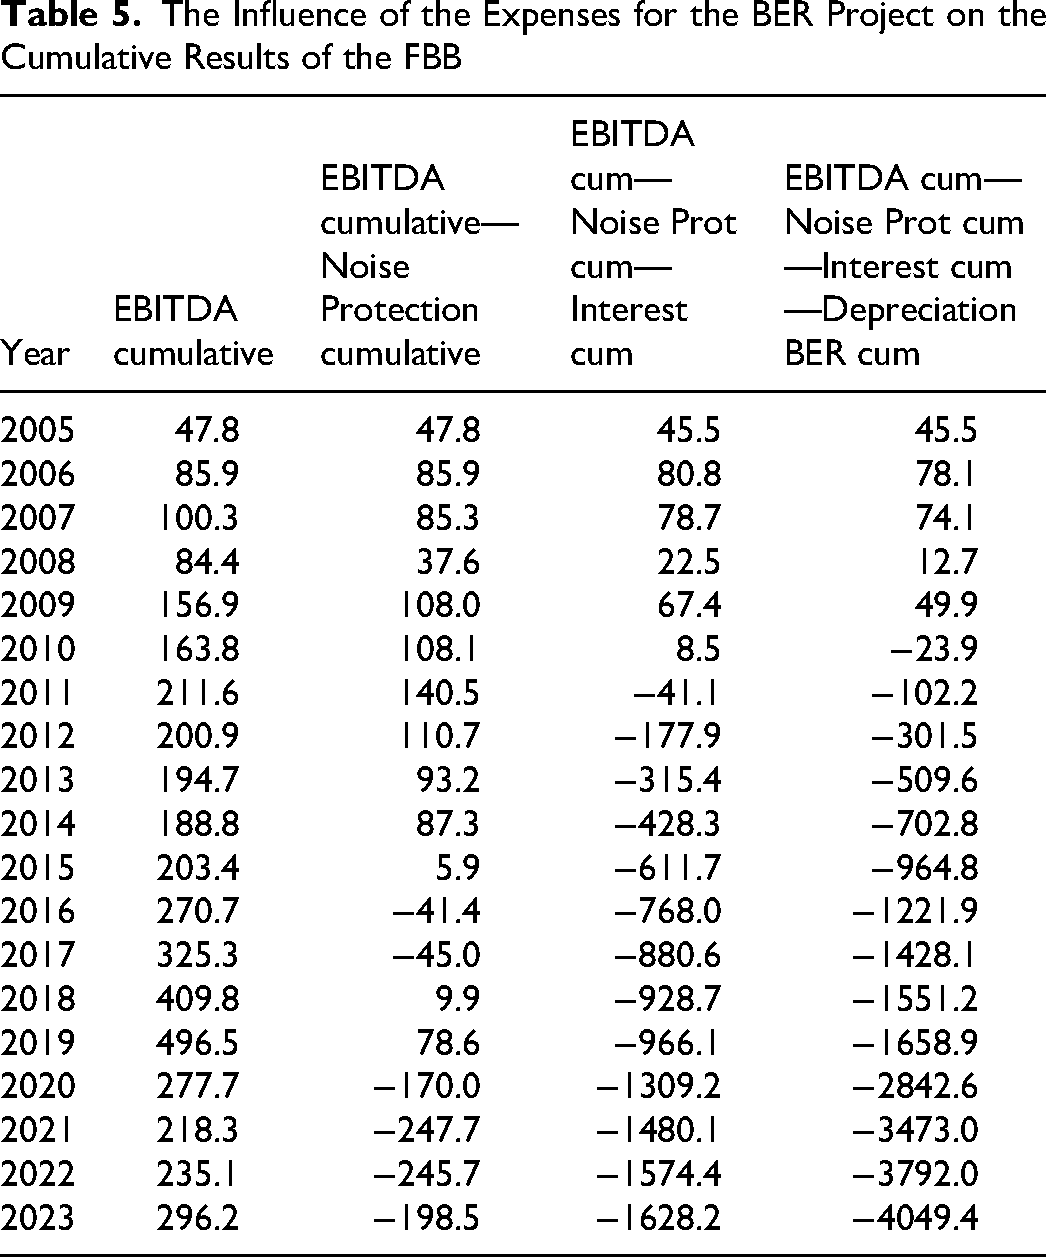
What happens if we adjust this metric to account for components directly caused by the BER project or significantly increased because of it? We first subtract the cumulative expenses for noise protection, then the cumulative expenses for interest, followed by the cumulative expenses for depreciation on the tangible assets of the BER. Noise protection expenses and depreciation on tangible assets have clearly been caused by the BER project. We only take the depreciation on tangible assets because the FBB activated the expenses for noise protection in the intangible assets and we wanted to avoid double counting. Investments also influenced the expenses for interest in the old airports, but the very strong increase in these expenses is mainly due to the high increase in liabilities. Table 5 documents the results of our analysis.
The cumulative EBITDA (earnings before interest, taxes, depreciation, and amortization) has already become negative by subtracting the expenses for noise protection, but these expenses have become smaller and have not had such a strong effect. The impact of the interest expenses is much stronger. This influence comes from the very high volume of liabilities. Capital injections from the owners and sales of real estate by the FBB helped reduce the liabilities but they remain very high. The rate of interest payments has also risen; therefore, this influence will not vanish in the future and is a major stress factor for the limited cash flows from operations. The biggest influence comes from depreciation, because a lot of money was invested in the BER assets. Given the limited ability to generate cash flow from these assets and the changed expectation for future growth by the COVID-19 pandemic, an extraordinary depreciation was needed to bring the value of the assets closer to their real value. One might argue that depreciation reflects a loss in value without directly affecting cash flow; however, expenses for real estate maintenance, technical equipment, and regulatory adaptations require continuous reinvestment. To estimate the necessary cash flow to sustain operations, at least 3% of the asset value should be subtracted from the EBITDA. The debt service must be repaid from current cash flow and therefore the amortization must be offset by a positive cash flow effect. Overall, the BER project has placed significant financial strain on FBB, and this pressure is likely to continue.
The Development of the Investment and Financing and Development Expenditures for the BER Airport
The expenditures for the BER project have been the subject of many publications in various media that have not disclosed the data sources. We used FBB’s published financial accounting data. From 2005 through 2021, the FBB reported an analysis of fixed asset movement. This has been shown for the whole company and the fixed assets of the new infrastructure “BER airport,” under the heading “thereof BER.” We use this specific information to assess the investment volume. Since 2022, there has been no separate reporting for the BER anymore. We assume the investments reported concern the BER airport because all other airports have been closed.
The Berlin House of Parliament approved the financing for the BER project as part of its 2006–2007 budget legislation (Senat von Berlin, 2005), with a maximum allocation of €1.85 billion. Of this amount, the federal state of Berlin was set to contribute up to €550 million. In October 2004, the FBB executives presented a planned investment budget of €2.41 billion to their supervisory board, creating a gap of €460 million. The €2.41 billion figure was a response to an offer from Hochtief to deliver the airport for €3 billion. Klaus Wowereit, the Mayor of Berlin and Chairman of the FBB supervisory board, refused this offer, expressing confidence that FBB could complete the project more economically under its own management.
The members of the parliaments of the Federal States of Berlin, Brandenburg, and the German State might have assumed that the gap between the financial means from the three owners and the total investment could have been financed by the FBB—either by a surplus of its cash flow or by additional debts that would have been financed by banks with the buildings of the new airport as security. However, the parliament decides about the maximum financial contribution from the household—without referring to the higher planned volume for the investment. The Federal State of Berlin owns 37% of the FBB, and its parliament members should at least be informed that leading politicians on FBB’s supervisory board had already approved an additional €460 million in investments. This number assumed that FBB could save approximately €600 million by managing the project internally. Flyvbjerg (2014) and Flyvbjerg et al. (2003, 2009, 2018, 2020) would have called this a typical case of delusion. According to Flyvbjerg and coauthors, we would compare the planned household contribution with the realized one. However, we already know that the total realized household contributions will be much higher than the finally accumulated household contribution. Aletta von Massenbach already claimed that the FBB would need another €600 million in 2026 (MAZ, 2024a) and, likely, even this will not be sufficient.
Table 6 documents the annual expenses for investments given as additions in the table of the movements of the fixed capital of the BER infrastructure, and the annual interest payables of the FBB to finance the infrastructure. We show how these expenditures accumulate from 2005 to 2023 and use the consumer price index to compound the accumulated total expenses.
Development of the BER 2005–2023 Expenditures in Million Euros
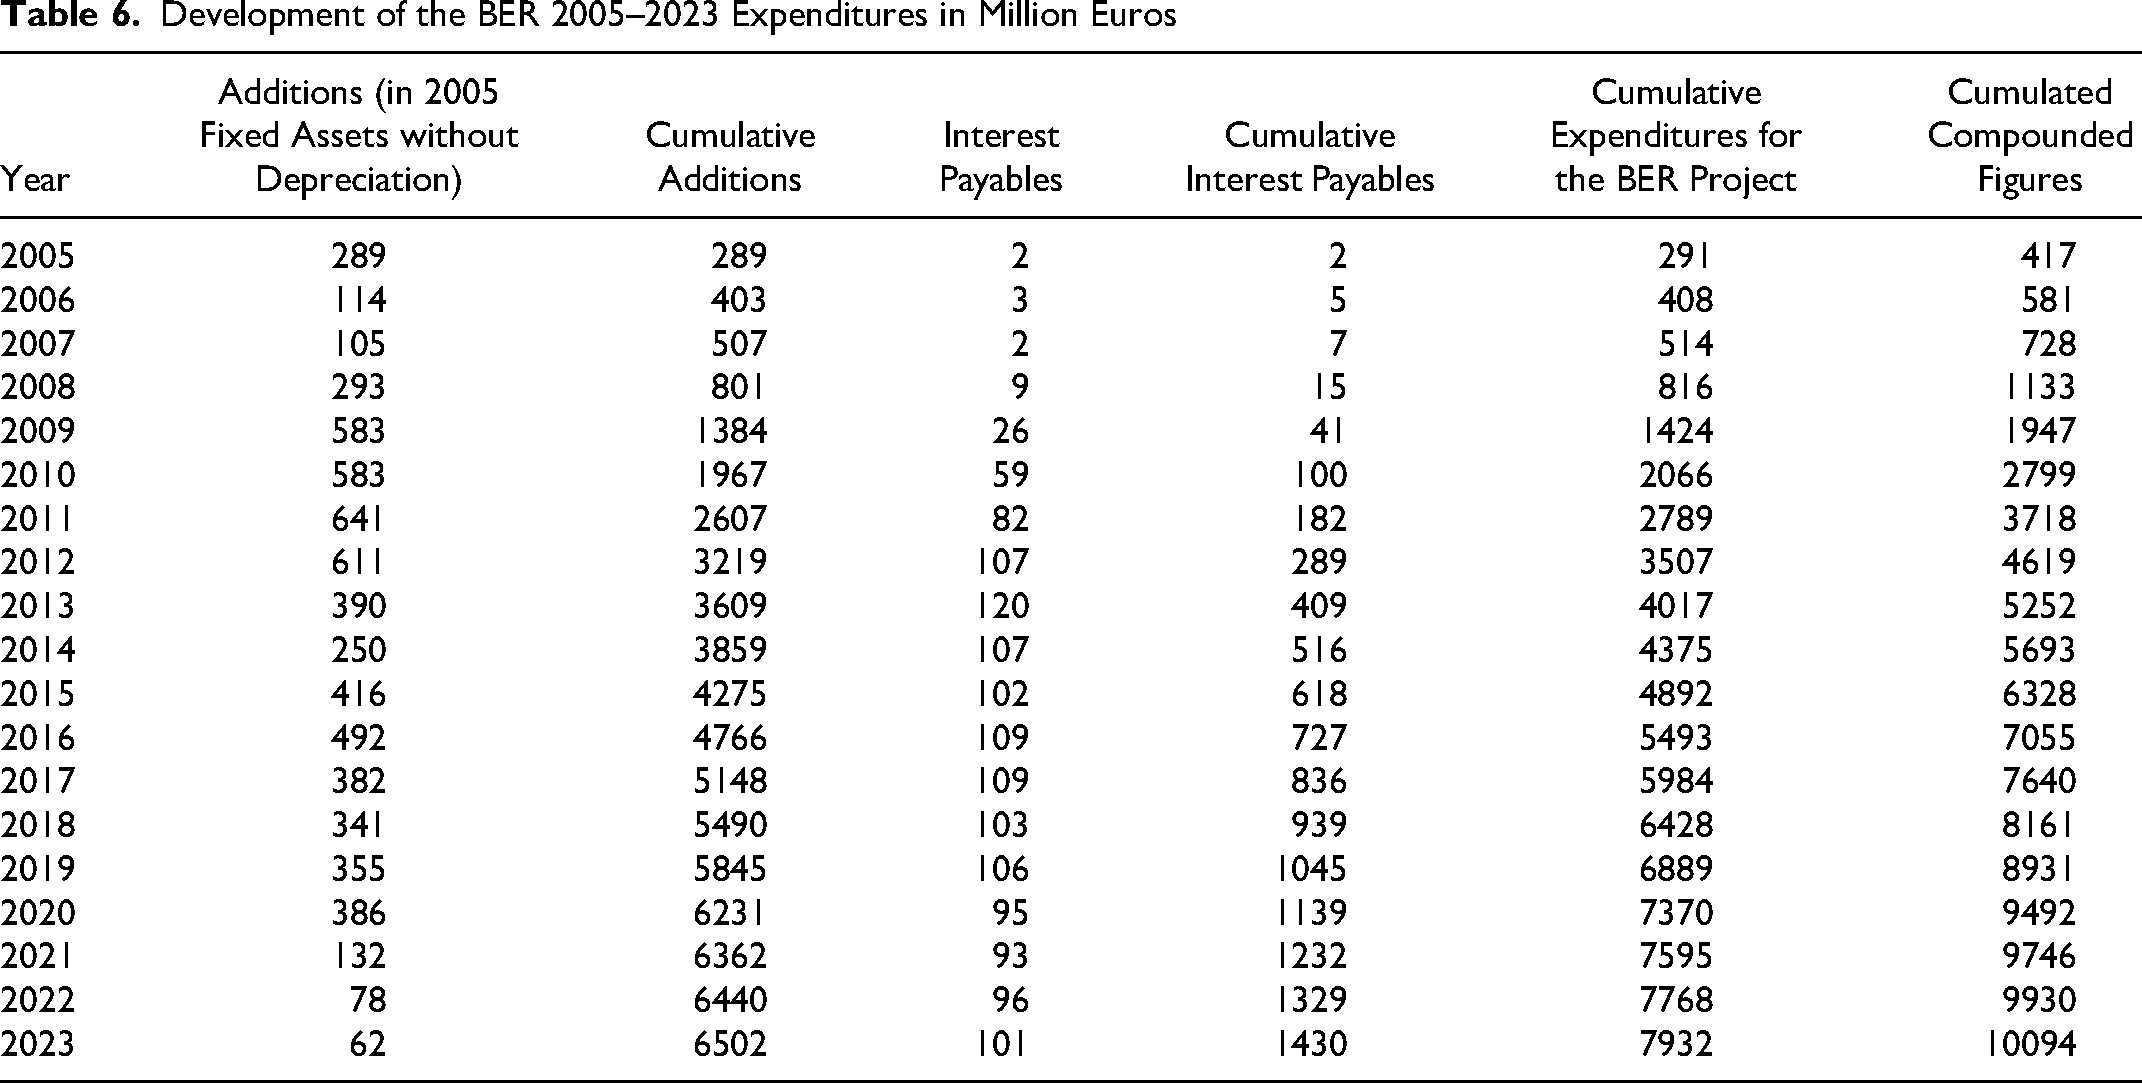
Interestingly, until the end of 2012, when the airport was announced to be definitively opened, €3.507 billion were spent. These were 190% of the expenditures planned when parliament had approved the project and 146% of the volume that FBB executives had planned; however, these cost overruns were not the end of the story. On the contrary, until the end of 2023, the expenditures increased to €7.932 billion, meaning 429% of the allowed debts and 329% of the initially planned investment. The compounded expenditure for the infrastructure and interest payments amounts to €10.094 billion.
The expenses made by the FBB in the BER project are incredibly high. How do these investments look compared with the other eight airport companies? We now analyze the development of the position “tangible assets” of the nine largest German airports. We use 2005 as the reference year and calculate the values of the tangible assets in percentage of the value reached in 2005. Table 7 shows the results of our analysis.
Development of Tangible Assets at FBB and Comparison Airport Companies, Index Values With 2005 = 100
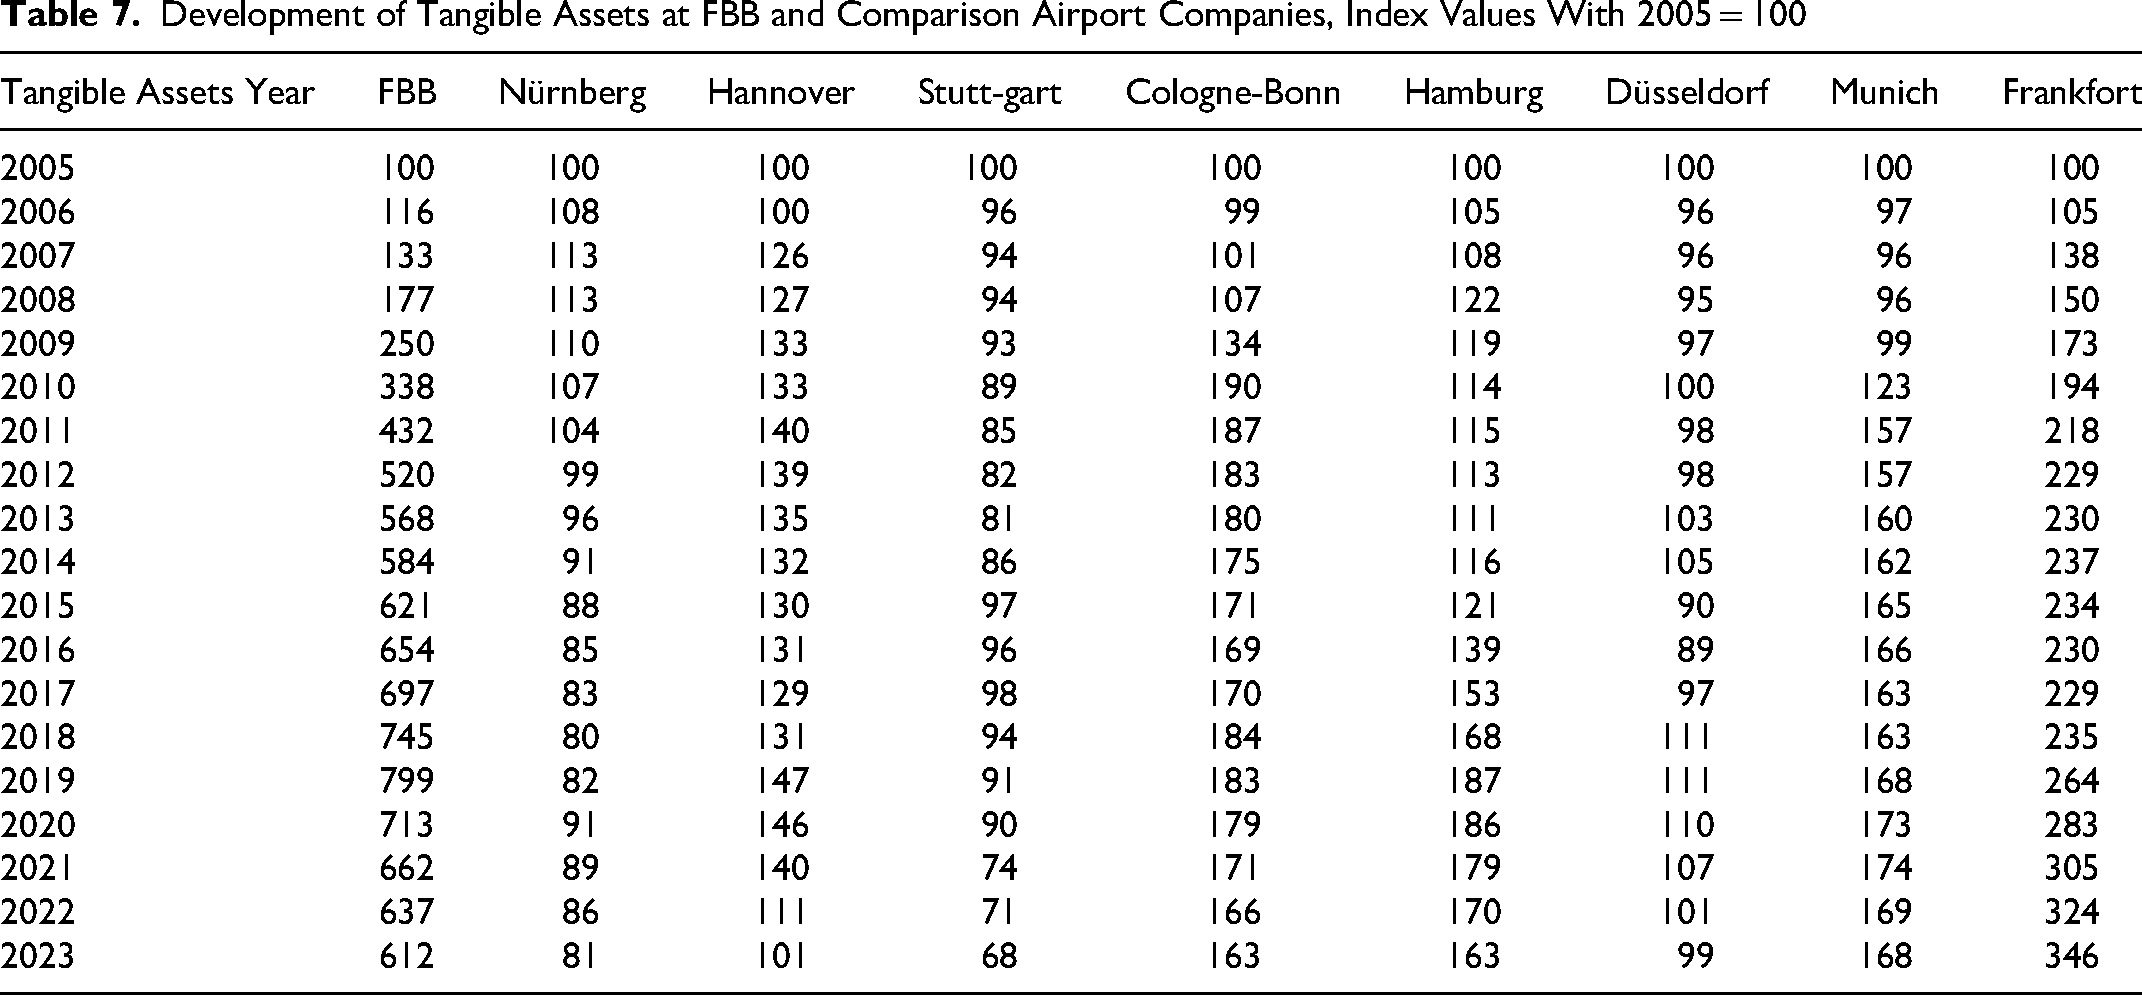
The development curve of the FBB stands out in this table. Compared to the base level in 2005, the FBB reached 799% of this base level in 2019, followed by Frankfort’s Fraport, which reached 264% in 2019. However, in 2023, the index value of Fraport increased to 346%, whereas the value of the FBB decreased to an index of 612. This can be explained by the high extraordinary depreciation in 2020 and by sales of tangible assets. The investment in the new Terminal 3 can explain the increased values for Frankfort. One can see that the larger comparison airports continuously invest and keep a high index value, except for Düsseldorf. In contrast, the smaller comparison airports have already reached index values below 100 or very close to 100 (Hannover with 101), meaning a disinvestment process is occurring.
Given FBB’s problematic situation regarding its high and enduring operational losses, the book values of the tangible assets do not reflect economic value. Further extraordinary depreciation is needed to assess tangible assets fairly. The arguments from Gemünden and Wolf (2020) and Gemünden et al. (2020a, 2020b) still apply.
The Development of the Capital Structure: Equity and Liabilities
Figure 2 shows the development of the equity of the FBB and control cases. We can see how FBB’s equity went down after 2008; it decreased from a value of 66.7% of total capital in 2008 to 20.2% in 2019 and reached -10% in 2021 and -4.8% in 2022. The positive change from 2021 to 2023 was caused by COVID-19 pandemic aids, by selling real estate, and by additional equity of €1.7 billion that was provided in cash by the owners of the FBB—and notified by the European Union (EU).
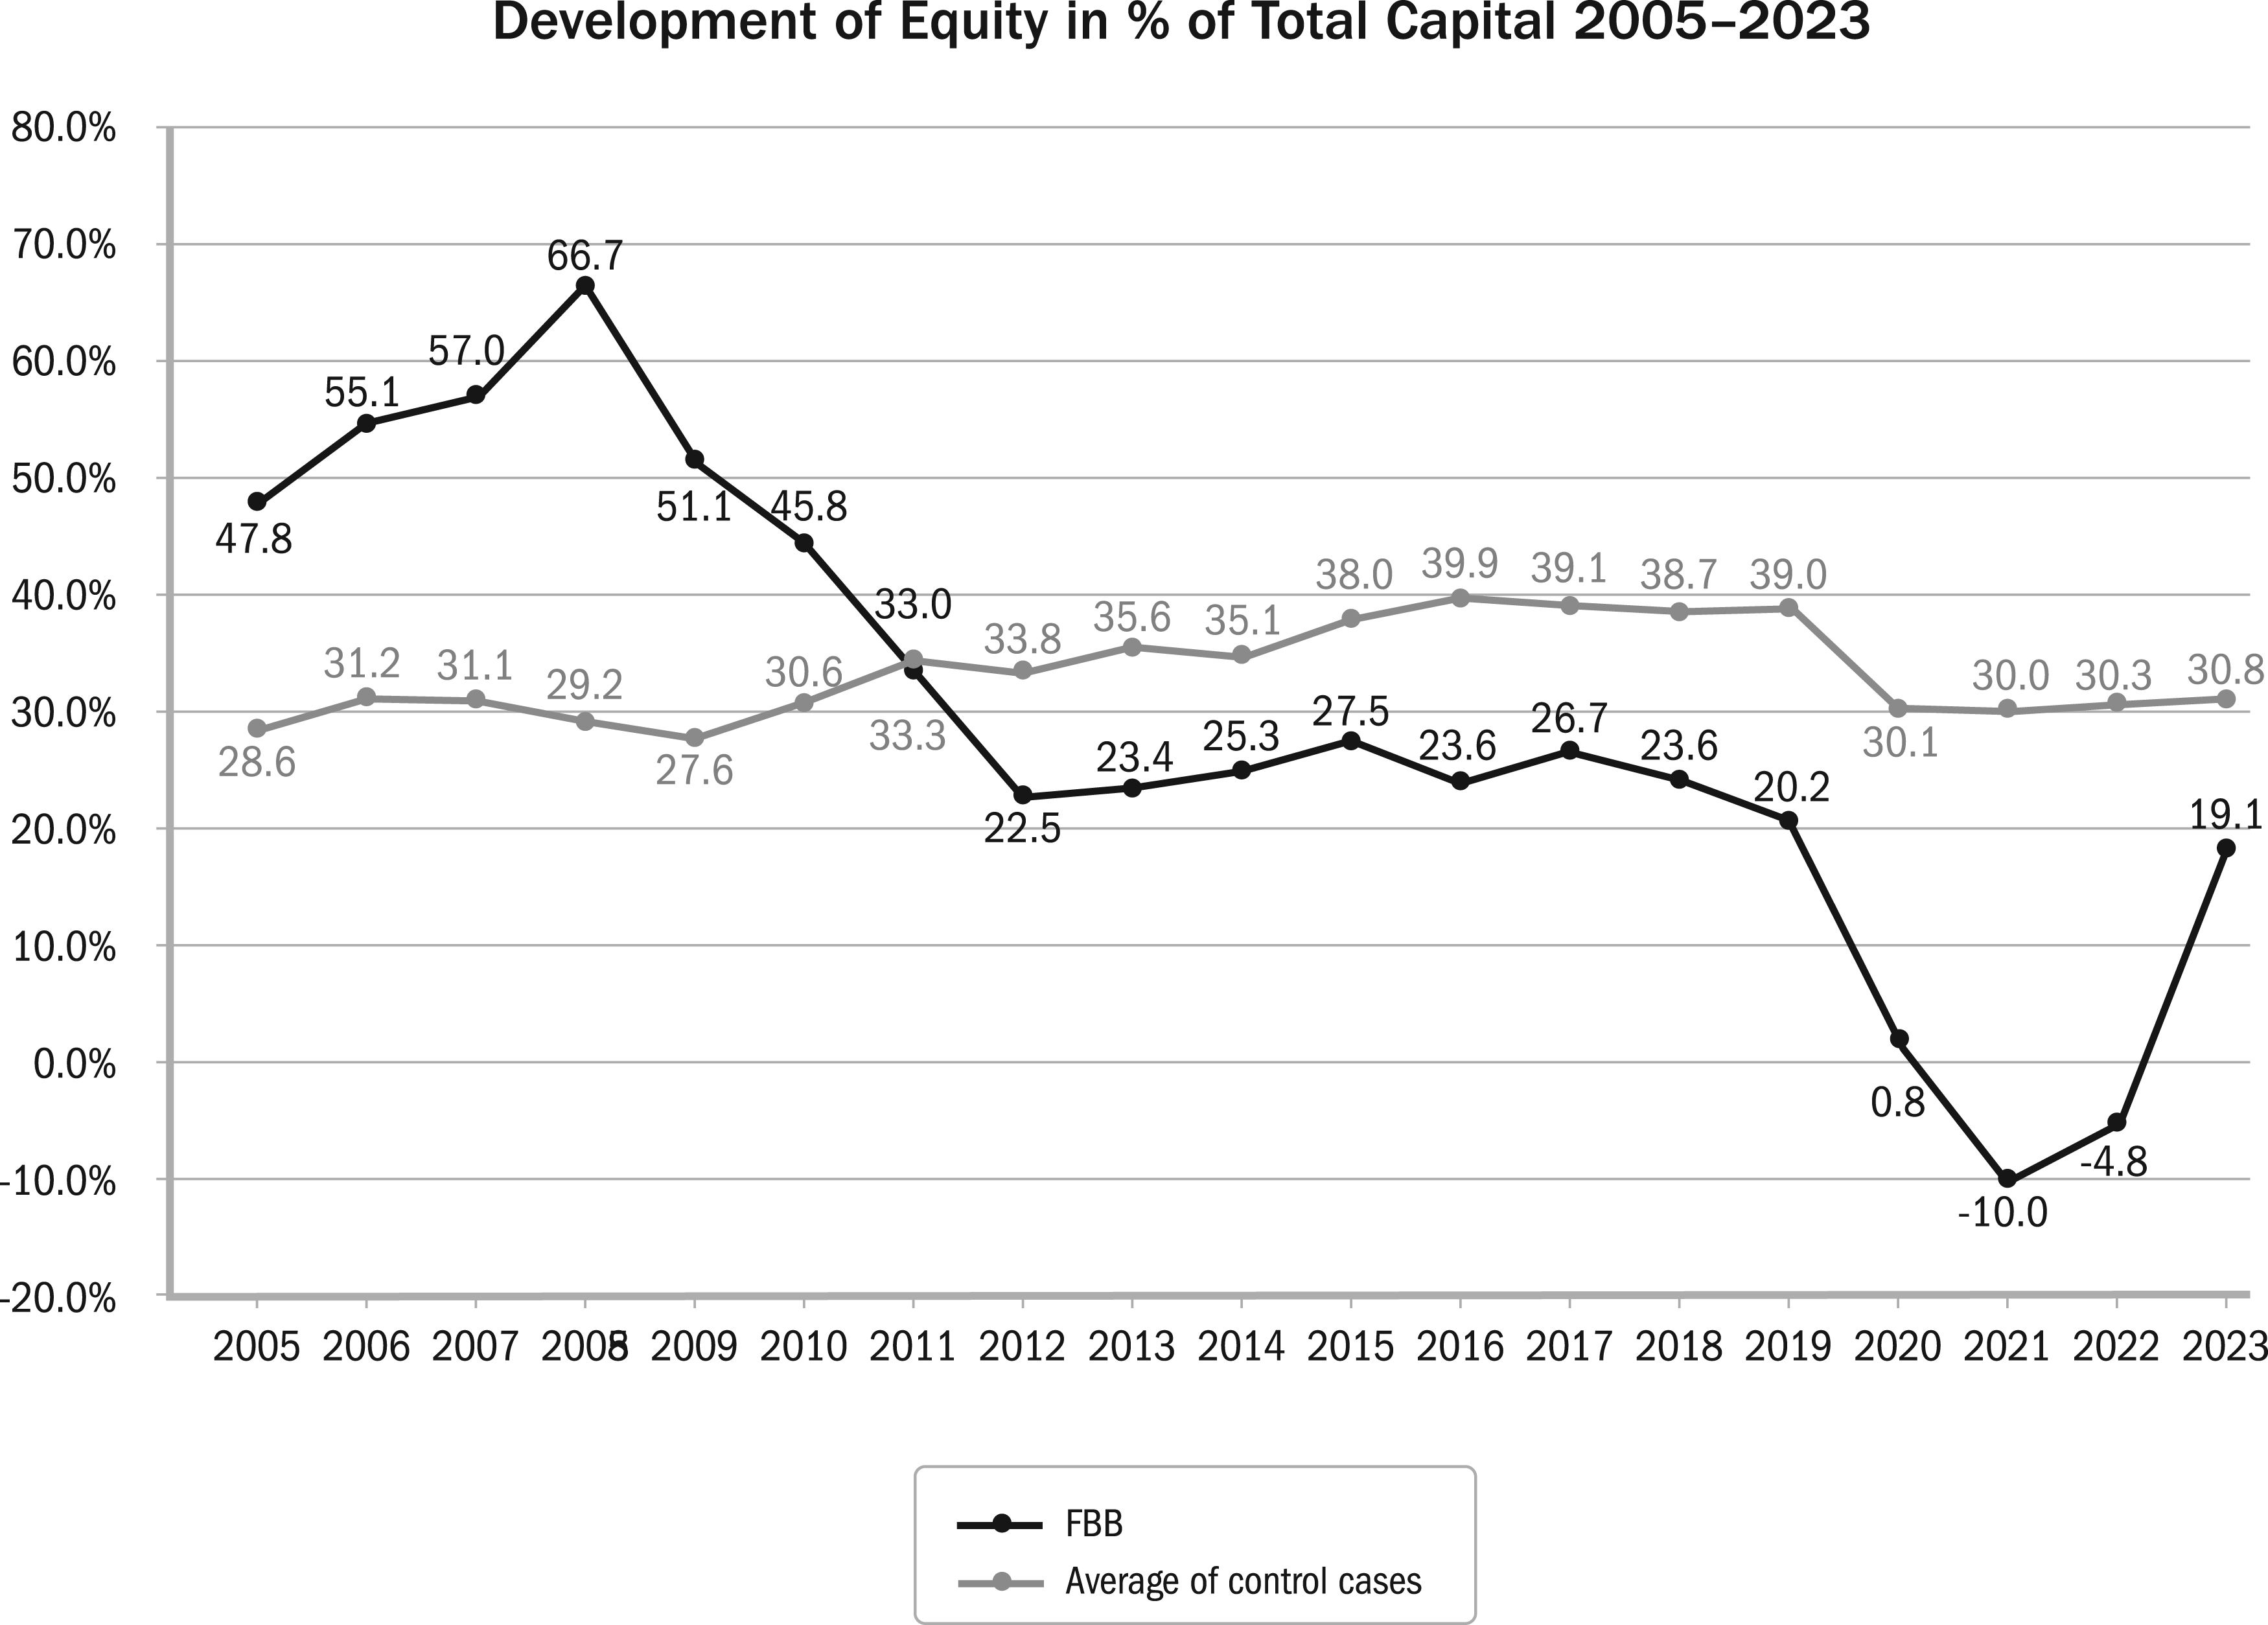
Development of equity at FBB and comparison airport companies
It is important to note that the equity breakdown at FBB was not primarily caused by the COVID-19 pandemic. If that had been the case, we would expect similar equity breakdowns in the control cases, which, on average, remained relatively robust. Instead, FBB’s equity breakdown can be attributed to high depreciation costs, comparatively higher expenses for interest and other operational expenses, and insufficient revenues that have not yet recovered to sustainable levels.
Figure 3 documents that for FBB, the liabilities in percentage of total capital increased suddenly during the COVID-19 pandemic. Two factors can explain the FBB-specific jump of this metric: (1) an increase in liabilities (the numerator) and (2) a sharp decrease in the value of BER’s assets (the denominator). However, the issue lies in the lack of disclosure of this trend before the BER airport’s delayed opening, despite clear indications of its likelihood. The value of the BER assets should have been corrected downwards, at the latest, in 2019. During the three years 2021 through 2023, all three groups of airport firms lowered their share of liabilities. However, compared with the €1.8 billion of financial aid the FBB got from its owners, the sale of real estate, and COVID-19 pandemic aid, the share of liability is still very high.
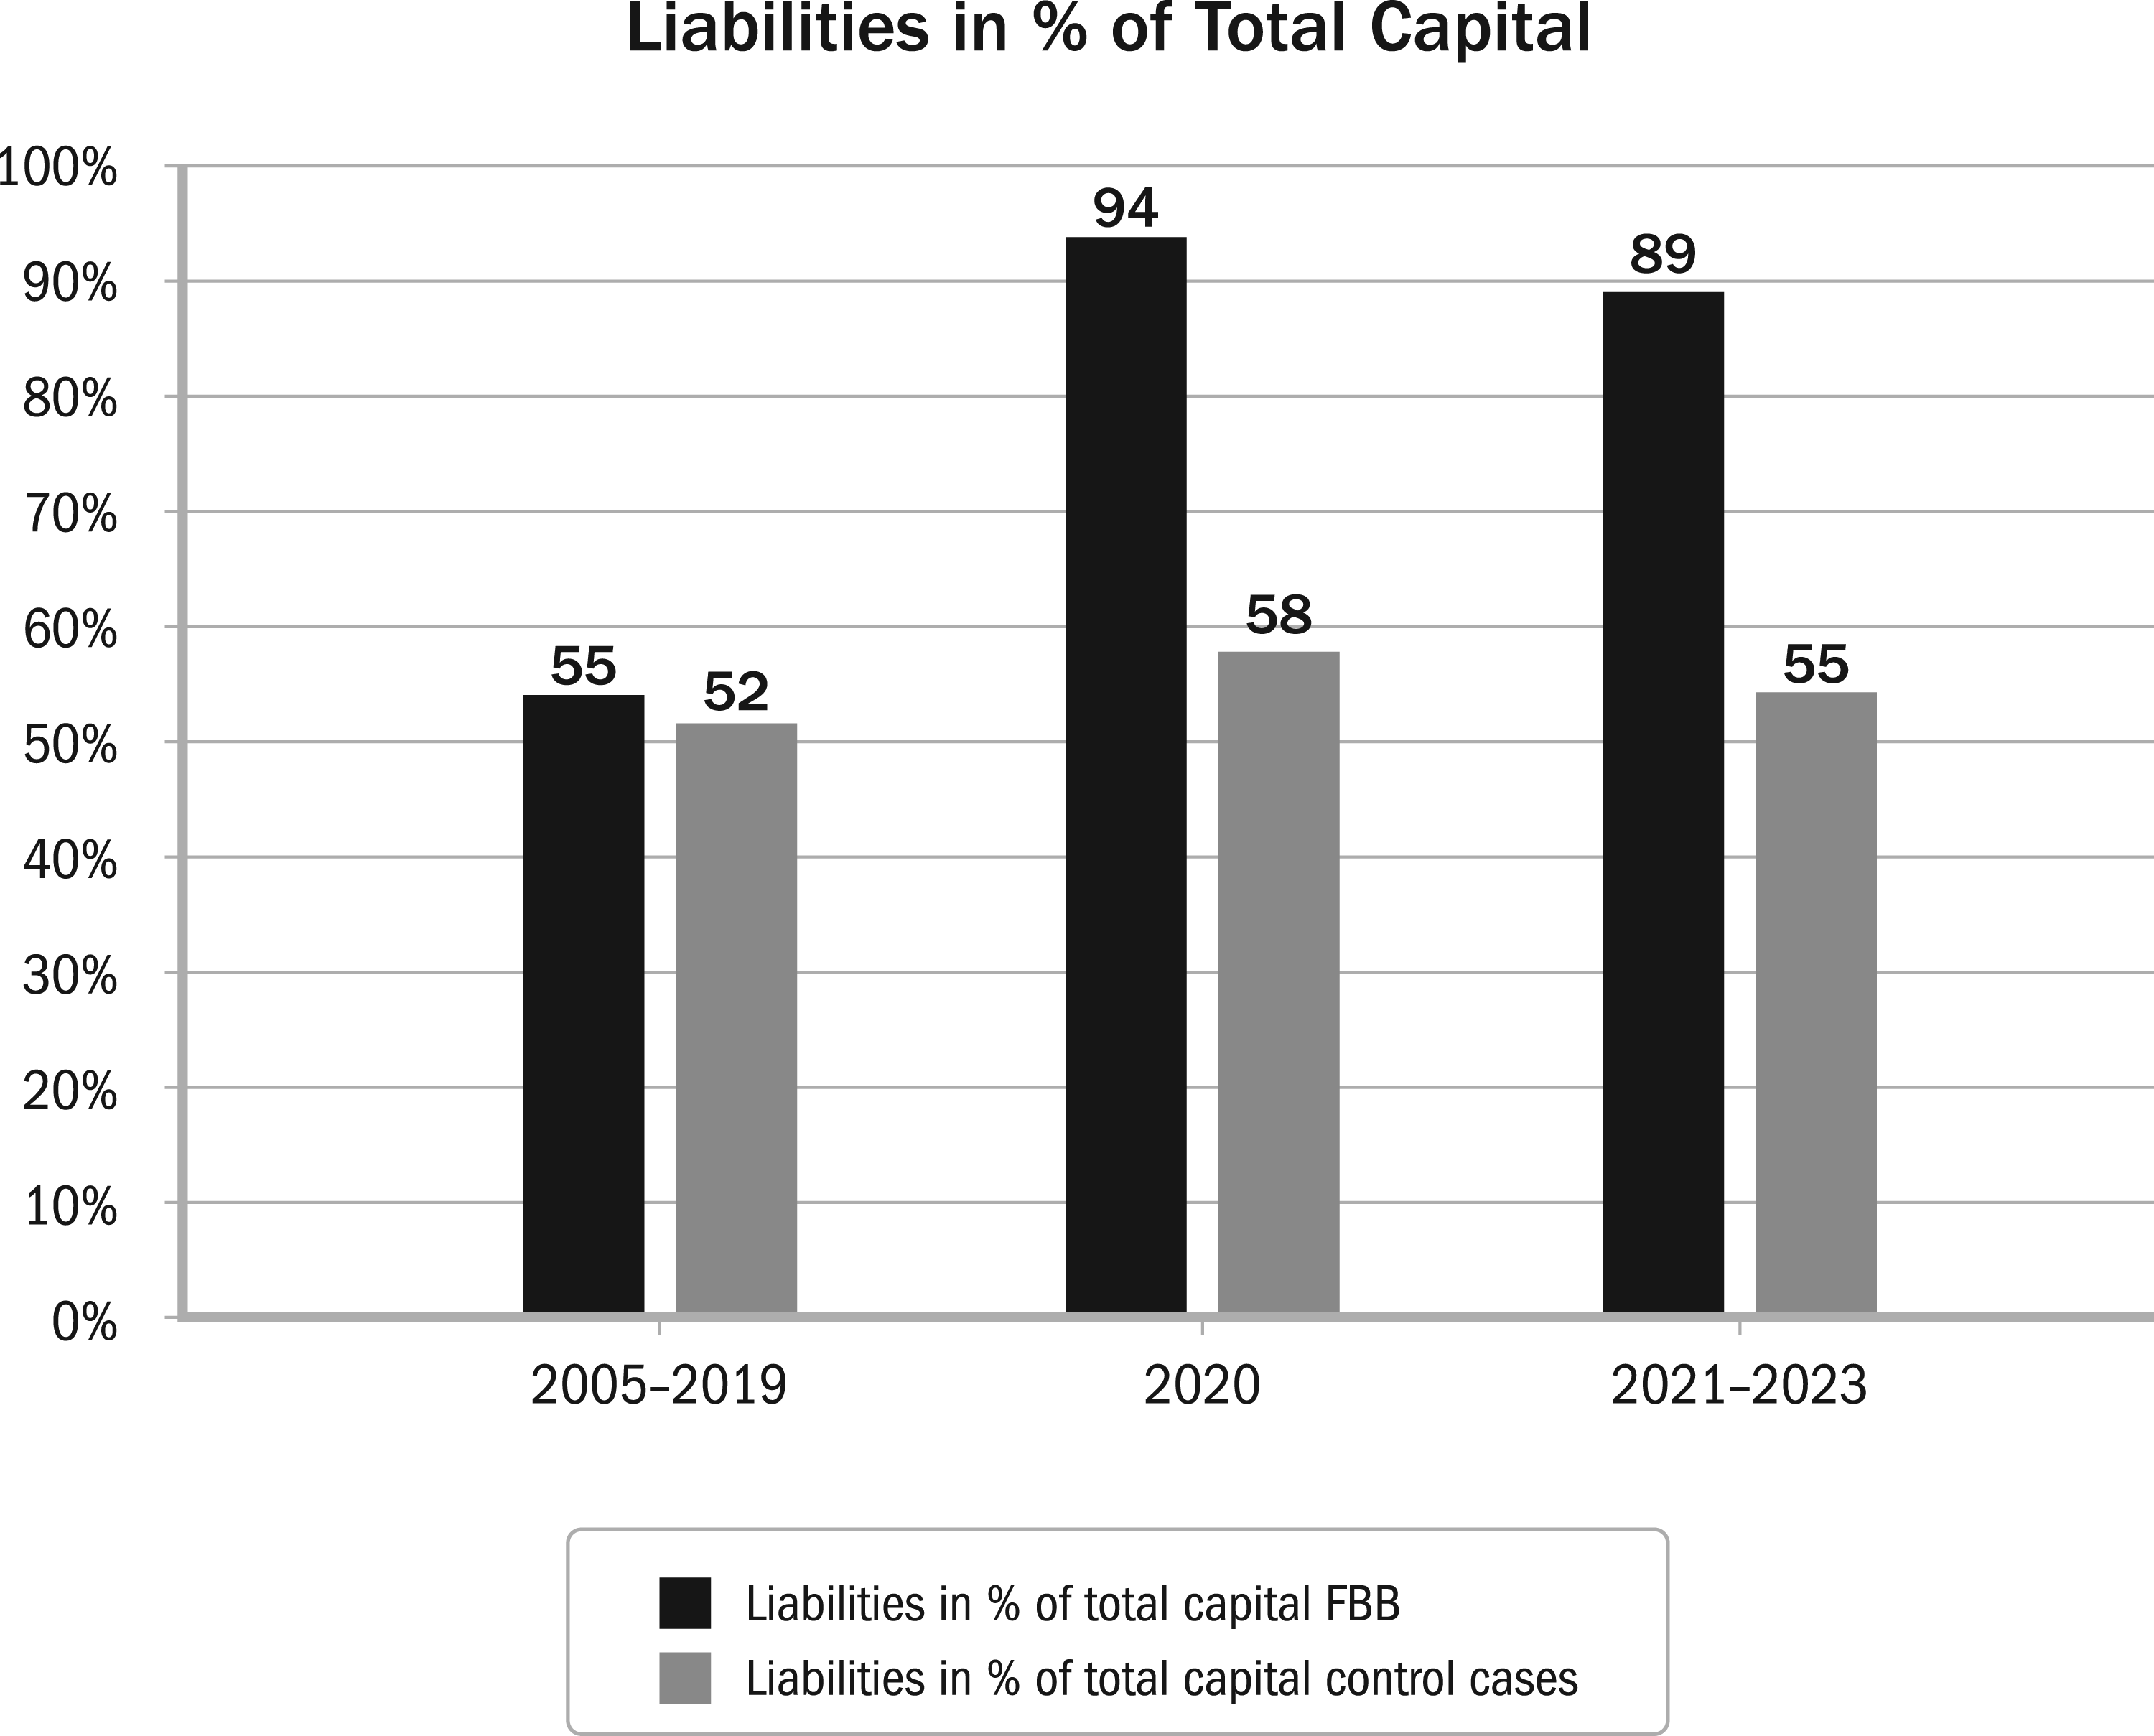
Development of liabilities in percentage of total capital for three periods.
The developments of equity and liabilities should be evaluated in combination with the development of the total assets. Compared to the level of the total assets in 2019, FBB is on a disinvestment path, and the value of its total assets was only 85% in 2023. In contrast, the other three largest German airports kept their value of total assets (Düsseldorf 103%, Munich 102%) or made additional huge investments. In 2023, the value of the total assets from Fraport was 150% of the value of the total assets of 2019. Thus, the nearly constant value of the percentage of equity of control cases represents a much higher value because the value of the total assets of the bigger airports has increased very much, particularly at Fraport.
Estimating the Lost Sales Revenues Because of the Delayed Opening of the BER
In 2004, when the planning authorities approved the plans for the new BER airport, the opening date was set for October 2010; however, the realized opening ceremony took place on 31 October 2020. Regarding benefits, this means that the FBB earned for 10 years only the lower sales revenues per passenger of the old Tegel and Schönefeld airports instead of the higher new sales revenues per passenger of the new BER airport.
From 2011 through 2020, 278,624 million passengers used the old Berlin airports. If they had used the new BER airport, these customers would have spent €9.34 more per passenger. Multiplying both numbers gives a volume of €2.601 billion of lost revenues due to the delayed opening of the BER airport. This estimate assumes that the number of passengers would have been constant if a higher price was demanded; however, it is more likely that many passengers would not fly. Assuming a loss of 30% of the passengers gives us an estimated volume of 1.821 billion in revenue losses due to the very late opening of the BER airport.
BER’s Limited Capacity
Another consequence of the decisions surrounding the BER project is its limited capacity. The BER project’s investment and finance expenditures escalated to €8 billion. The invested means could have allowed the construction of three airports, yet only one was built. Consequently, this single airport is now burdened with the financial responsibility of repaying investments equivalent to three airports. Moreover, the new airport does not supplement the old airports because they have all been closed. To accurately assess the net increase in capacity, the capacities of these three airports must be subtracted from that of the new airport.
But how much capacity has been added by the new airport? Bubalo (2020, p. 250) analyzed the document of the Ministry for Urban Development, Housing and Transport (MSWV) of the State of Brandenburg, commenting on the plan approval decision: “Official planning documents for the BER airport assume an ultimate capacity of 83 flights in the peak hour (MSWV, 2004, p. 222) (…). Other assessments in the documents reveal a capacity of 90 movements in the peak hour” (MSWV, 2004, p. 334). The old Tegel (TXL) and Schönefeld (SXF) airports had 52 and 26 slots, respectively. The BER airport would create only between five and 12 additional slots. Daduna and Bubalo (2012) use extensive simulations to find out which capacity can be served by the BER airport. Bubalo (2020a) sees a practical capacity limit of around 76 flights, nearly the same as the Tegel and Schönefeld airports had together. With the increasing development of the Berlin-Brandenburg region, the capacity limits of the BER airport may be reached, but it will take a very long time to get permission to build an additional runway. Considering the court decisions constraining the capacity of the BER, it is also possible that such an extension will not be allowed.
The so-called “master plan” for the BER was always assuming that the BER might become an international hub with many first-class customers that spend much more money in the airport than the passengers of the currently dominant low-cost carriers. This hope is as unrealistic as the time and budget plans of the BER project have always been. It takes more than offering some intercontinental direct flights to become a hub. Lufthansa (2023) explains why: “The reason: the capital has not become an international hub due to the division of Germany. Comprehensive long-haul services can usually only be organized profitably via hubs—at least at one end of the route. This is where passengers from all over the world arrive there to fly on to a destination. In this way, large long-haul aircraft are sufficiently full and thus operated in an ecologically and economically sustainable operation. Intercontinental flights beyond major hubs are rarely profitable. (…) German hubs thrive on transfer passengers. In Frankfort and Munich, around three-quarters of travelers on long-haul flights are transfer passengers. Without such feeder flights, intercontinental connections need a sufficiently large local market. For example, the London and Paris airports reach around 13 and 10 million people, respectively, within an hour. No region in Germany has such a strong ‘catchment.’ Even Munich and Frankfort together are significantly lower.”
Summary and Discussion
Realized Impacts of the BER Project on the Business Performance of the FBB
Our impact analysis revealed several key findings. First, despite the highest passenger growth rate between 2005 and 2019, FBB incurred a cumulative operational loss of €4.555 billion from 2005 through 2023, whereas the airport’s size should have led to profits. Second, the losses were driven by both revenue and cost issues. On the revenue side, FBB consistently earned the lowest revenue per passenger, with other major airports earning 63% more on average. The low passenger recovery rate post-COVID-19 further hindered revenue growth. On the cost side, FBB faced significantly higher depreciation, interest expenses, and operational costs, particularly due to the BER project’s high debts and noise protection measures. These factors strained cash flows and the ability to finance operations. Third, the BER project drastically impacted FBB’s equity, turning it negative, only to be restored by a €1.8 billion cash injection, real estate sales, and COVID-19 aid. However, future asset revaluations could push equity negative again. Fourth, loan repayments and interest payments pose liquidity risks, with auditors expressing concerns in 2020 about the company’s ability to continue as a going concern. Fifth, the new airport has not delivered substantial additional capacity compared to the combined capacity of the closed airports, leaving the net capacity close to zero. Sixth, the FBB suffers significant expenses for infrastructure and interest ballooning to a compounded value of €10.094 billion by 2023. Seventh, in addition to cost overruns, the 10-year delay in opening BER led to an additional compounded loss of €1.821 billion in unrealized revenue, resulting in an overall compounded value consumption of €11.915 billion by the BER project.
Future Impacts of the BER Project on the Business Performance of the FBB
Thus far, we have looked at the impacts of the BER project, which have already been realized. On the occasion of a notification procedure with the EU regarding an additional €1.7 billion in aid for FBB, auditing firm Deloitte was commissioned to determine the current value of the equity of FBB’s owners: “The aggregate value of the discounted cash flows is estimated to be EUR 2.733 million for the forecast period running from 2022 to 2050 and the terminal value of FBB is estimated at EUR 1.710 million. As a result, the Valuation Report sets FBB’s total Enterprise Value (“EV”) at EUR 4.442 million on 31 December 2021. (…) Considering that the net debt position on 31 December 2021 would amount to EUR 3.893 million, the Valuation Report established the equity value of FBB at EUR 550 million.” (European Commission, 2022)
How did Deloitte come to this result? Based on the 2021 business plans of the FBB, which Deloitte approved, the following key assumptions were made:
Passenger volume: “FBB will reach pre-COVID-19 level in 2025 and realize an average increase of 1.5% per year for the years 2026 to 2039” (European Commission, 2022). For 2023, Deloitte assumed 26.4 million passengers; in fact, FBB has only reached 23.1 million passengers. For 2029, Euro Control forecasts 27.4 million passengers and IATA 27.6, but Deloitte uses estimates of 37.8 million passengers. This is by far too optimistic. In addition, it is unlikely that the 43.9 million passengers forecasted for 2039 can be realized with the capacity of the BER—according to Bubalo (2020a), this would not be possible. The truth is that the 2020 business plan from FBB and Deloitte, who approved this plan, did not consider that the higher fees and the longer regional travel times for BER have led to a much lower passenger volume than expected. Revenues: “FBB assumes that charges to airlines will remain constant until 2024. In 2025, a 3% increase will be applied in order to compensate for previous years, and from 2027 onwards, a further 2% increase p.a. is expected” (European Commission, 2022). It is unlikely that the airline companies and approving administrations will accept increases that intend “to compensate for previous years.” Planning horizon: Deloitte extends its forecast to 2050—probably because it assumes that an assumed further growth of passengers will lead to a more favorable valuation. However, the capacity increase would require massive investments and current court decisions will not allow this. Deloitte does not explain how to cope with the legal constraints or give any information about the investments. In addition, Deloitte does not offer any scenario analysis that documents the uncertainties of its long-term forecast.
Overall, Deloitte’s assessment is very problematic, and we might ask why the EU approved the subsidies based on such an assessment.
We use the spring 2024 passenger volume forecast for Germany from Eurocontrol (Spring 2024) to provide a more realistic estimate of FBB’s business results from 2024 through 2030. We assume that revenues, expenses for material, personnel, and other operating expenses develop proportionately to the passenger volumes; that expenditures for noise protection go down linearly; and that depreciation and interest expenditures remain constant. The estimated costs for noise protection are comparatively low, in other words, €9 million in 2024 and then go down to €3 million in 2030. Table 8 shows the resulting business results.
Forecasts of Operational Results and EBITDA of the FBB for the Years 2024 Through 2030 Based on Eurocontrol Spring 2024
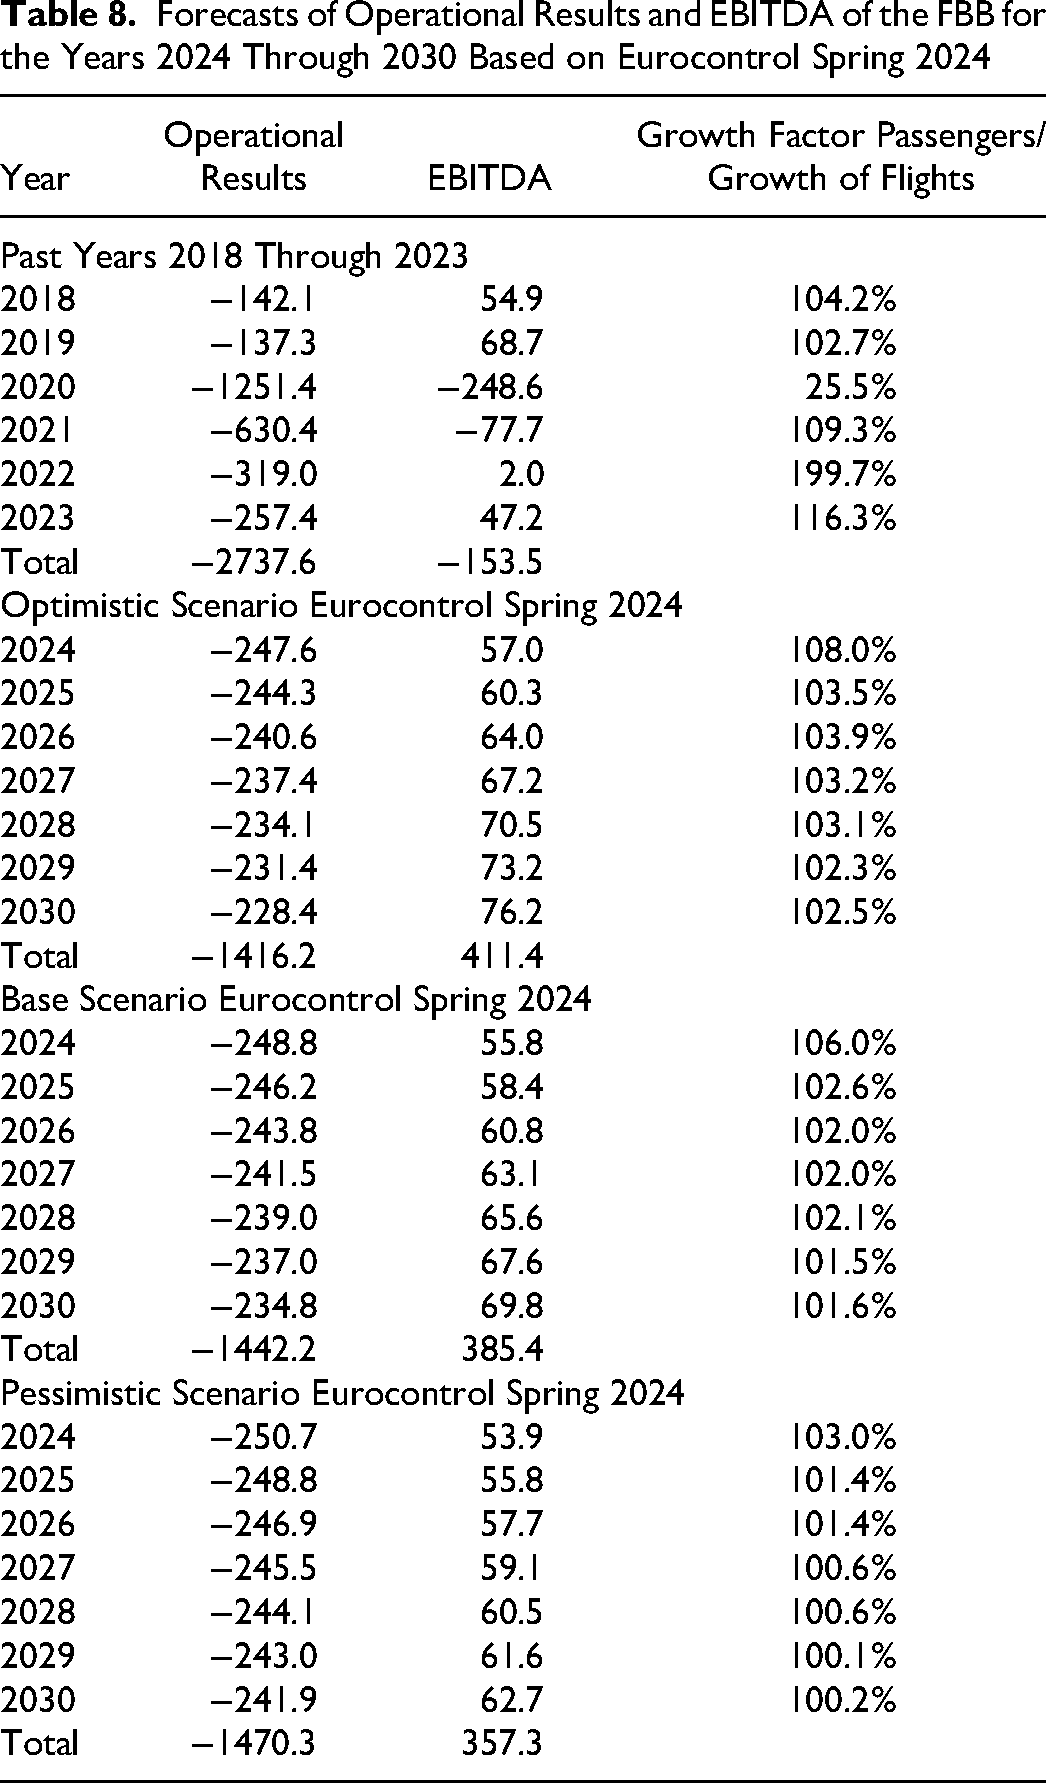
The results are very similar for all three scenarios. The EBITDA is small but positive, and the operating results are negative; the difference is mainly caused by the depreciations, which were assumed to stay at the level of €203.5 million, and interest expenses, which were assumed to remain at the level of €101.1 million. We have also used the forecasts from DFS Deutsche Flugsicherung. They show similar results and are therefore not shown.
We can see that FBB may run into a liquidity problem. FBB must pay around €700 million interest expenses in the next seven years, but its EBITDA is probably not over €400 million.
The EU notification has forbidden further subsidies for public owners, which means the FBB would likely need additional financial support from banks. Whether FBB will receive money from the banks without public guarantees, which are relevant under state aid law, is questionable. At least if you take the information provided by the CEO of FBB, Aletta von Massenbach, to the Berlin House of Parliament as a basis, which is demanding an additional €660 million in funds from the shareholders in 2026 to be able to then stand on its own two feet by 2027 (RBB, 2024).
Depreciations represent a value consumption but do not lead to lower cash flows. However, FBB needs investment expenses to maintain its assets and adapt to new regulatory demands. If these expenditures had a volume of €100 million annually, this would mean an additional financial gap of €700 million until 2030. Overall, the financial gap until 2030 appears to be larger than €1 billion. We must consider that FBB also needs cash to repay existing liabilities, and that new liabilities may require higher interest rates. This could cause an accelerated process of rising debts. These prospects are alarming—the €660 million demanded from the CEO of FBB may not be sufficient; ultimately, the BER project may drive FBB into insolvency with a considerable likelihood.
Implications
This study makes three major contributions to the field of project studies. First, it empirically quantifies the impact of poor governance and decision-making failures on project stakeholders. The report by Millstein et al. (1988) for the Organisation for Economic Co-operation and Development (OECD) outlined four principles of good governance: (1) transparency, (2) accountability, (3) responsibility, and (4) fairness (see Müller 2017, 14 pp., and G20/OECD, 2023). Using financial data, we aimed to enhance transparency regarding the true consequences of the BER project. Transparency is essential for evaluating the other three governance principles, particularly for publicly and government-owned companies and publicly managed projects, where disclosure of business plans and performance remains critical.
Eng et al. (2023, p. 103) assert: “Every project, regardless of its size, is expected to bring value to its constituents. To initiate a project, decision-makers need to determine that the business case includes sufficient details about its promise of delivering value. (…) This is only logical for good business practice and is viewed as a fundamental wisdom in managing projects.”
While we fully agree with this assertion, the reality in German parliaments is quite different. Parliamentarians typically receive insufficient details about the business case when deciding on large-scale projects. Furthermore, when projects fail to meet budget, time, or benefit goals, decision-makers are often denied access to this crucial information. This behavior is common in similar projects undertaken by publicly owned companies, underscoring the importance of transparency in evaluating the BER project’s trajectory and assessing the extent of its financial damage over time.
While publicly owned firms may withhold detailed business information from parliaments, parliamentarians still have tools to assess a project’s business impact, which they should use more consistently. From our experience with the inquiry committees into the BER project in Berlin and Brandenburg, parliamentarians often fail to fully utilize publicly available data.
Second, our study demonstrates the utility of publicly available financial data in analyzing megaprojects. The current practice of relying on selectively disclosed management accounting data or subjective judgments from key informants has limitations, as these approaches fail to fully reveal the scale of the impacts. Furthermore, informants may assess the situation with undue optimism or pessimism. When planned or expected figures are biased (Flyvbjerg, 2003, 2015; Flyvbjerg et al., 2003, 2009, 2018), comparing these figures to actual outcomes becomes an unreliable measure of project performance. Financial accounting data, however, represent objective facts that shape the company’s prospects. For instance, significant cost overruns and project delays lead to lost revenue, increased debt, higher interest payments, and greater amortization, all of which reduce profitability and limit future investment opportunities or the ability to seize concurrent competing opportunities. The initial expectations of decision-makers lose relevance once the project’s business realities take shape. In contrast to Flyvbjerg, we state that looking at the initial expectations is insufficient. It is crucial to also have a thorough understanding of the financial facts that realize cumulatively over time and how they influence our present and future.
Published financial reports are accessible to everyone and while expertise is required to interpret them, understanding financial data is not overly complex. Different experienced analysts can review and analyze the data, facilitating a diverse exchange of perspectives. To ensure objectivity, we compared the performance of the project owner company FBB with eight other airport operators in Germany that are of similar size and operate within the same industry.
Third, adverse developments in a project typically accumulate over time rather than appearing suddenly. This accumulation of losses, debt, and overvalued assets compounds the severity of the issue, exacerbating time pressures and widening the gap between the publicly communicated financial situation and the actual state of affairs. Our study documents this accumulation over nearly two decades (2005–2023) and provides insights into the potential future trajectory of the BER project.
A final remark: The role of biases in decision-making for megaprojects, which can lead to misguided judgments and even deception, has been a subject of extensive debate. While this phenomenon was present in the BER case, it was neither the sole nor the primary factor contributing to the project’s adverse outcomes. We need greater transparency regarding the impacts and decision-making processes involved to effectively evaluate the causes of success or failure in megaprojects. In the BER case, financial accounting data, key performance indicators, and detailed information concerning political processes and decisions were made publicly available. However, this level of transparency is not the norm, particularly in Germany. If the research community is to gain meaningful access to such data, a strong advocacy for enhanced transparency is essential. This advocacy often faces considerable political resistance, as increased transparency touches on issues of power and control. Despite this, it is crucial for uncovering and addressing potential decision-making errors, facilitating open discussions, and advancing the research field on megaprojects with deeper insights. As engaged scholars, we must continue to champion this cause. The valuable contributions of researchers, such as Ralf Müller on project governance, highlight the importance of persistently advocating for these principles within the academic community. We therefore dedicate this article to our colleague and friend, Ralf Müller.