
Abstract
Objective:
Echogenicity is a biomarker in facioscapulohumeral muscular dystrophy (FSHD). Currently, it is not possible to compare echogenicity values, derived using quantified muscle sonography capture, based on different equipment instrumentation settings. Image normalization, using histogram matching, could address this limitation. The aim of this study was to investigate the sensitivity of histogram matching, with trapezius muscle echogenicity values, in participants with and without FSHD.
Materials and Methods:
Sensitivity analysis of a single measurement timepoint case control study of participants with FSHD, using age- and gender-matched controls. Correlations between trapezius muscle echogenicity, muscle thickness, and shoulder range of movements were also completed.
Results:
Data were collected for 14 participants, seven with FSHD and seven controls. The cohort had a mean age of 41.6 years. The FSHD group echogenicity values (118.2) were higher than controls (42.3), respectively, as well as statistically significant (p = .002). An overall variance of 6.2 (range = −2.9 to 15.4) was identified between the reference images. Echogenicity explained 81% of the variance in muscle thickness and 74% of the variance in range of movement muscle thickness was explained by 61% of the variance for range of movement.
Conclusion:
Histogram matching for comparison of echogenicity was required. Different reference images affect echogenicity values, but the variability was less than between group differences. Further longitudinal evaluation based on a larger sample of participants is needed.
Keywords
Facioscapulohumeral muscular dystrophy (FSHD) is a common autosomal dominant muscular dystrophy with international prevalence estimates ranging from 0.8 to 12/100 000.1,2 There are two genetic subtypes (FSHD1 and FSHD2), which have a common pathophysiological mechanism of ectopic expression of the DUX4 gene in skeletal muscle stemming from hypomethylation of the D4Z4 array.3–5 Multiple signaling pathways and body systems are affected, resulting in an inflammatory immune response with a cascade of oxidative stress, altered muscle cell differentiation in myogenesis, and apoptosis. 5 Muscle tissue demonstrates edema and notable degeneration of the muscle fibers, which can be characterized by fatty and fibrotic muscle replacement, as well as increased fiber size variability.6–8
The natural history, presentation, and progressive speed of FSHD can be highly variable. A common misconception, possibly reinforced by this disease name, is that it solely affects the face, shoulders, and arm muscles. However, different phenotypes based on patient-reported symptoms and “atypical” presentations (i.e., facial sparing or early dorsiflexor weakness) have been reported.9,10 People with FSHD can also experience fatigue and respiratory complications. 5 Despite the heterogonous and asymmetric nature of FSHD, changes to the structure and function of the periscapular muscles, particularly the trapezius muscle, are a hallmark feature. At the shoulder girdle, this can affect the biomechanical properties of the joint (sulcus) and cause pain, progressive loss in range of movement (ROM), strength, function, and independence.9,11–13
Muscle ultrasonography is considered a valid diagnostic screening tool in FSHD and includes the use of visual, semi-quantitative clinical scales, and quantitative muscle ultrasonography (QMUS). 14 Information derived from these methods can be used to extract features or measurements that could help improve methods of surveillance, evaluation of treatments, and classification of subgroups for prognosis planning. QMUS is used as a biomarker, in FSHD studies, as it measures echogenicity, which can be an index outcome for inflammation, muscle structure changes (i.e., atrophy, fatty replacement, and fibrosis), which are relatively hyperechoic. QMUS correlates with changes on magnetic resonance imaging (MRI), FSHD clinical severity scales, and qualitative ultrasonography scores (e.g., Heckmatt scale), and precedes the development of impairments and functional loss.15–19 The sensitivity of QMUS for detecting changes to muscle structure, consistent with disease progression, is also higher when compared to visual or semi-quantitative ultrasonography methods.6,16,18–20
Current limitations of QMUS are that it requires large reference data sets17,21 and identical ultrasound equipment systems, equipment models, or image capture settings.18–20 This is because several factors affect the final sonographic display such as operator skill, machine hardware options, and software settings, such as spatial and temporal resolution. Image contrast is also dependent upon features of dynamic range, gray map/curve, brightness settings (e.g., manual gain and automated time/depth gain compensation), and speckle reduction. Furthermore, settings for image enhancement and artifact suppression may be included in equipment system presets and postprocessing algorithms that can be considered a company secret (aka “black box”). While techniques, such as backscatter, could theoretically be used to standardize images that were captured on different machines and varied settings. However, this would require knowledge of all the equipment system’s proprietary processes, which limits the practicality of this method. 14 Given the length of the disease course, variation in patients’ anthropometrics (adipose or muscle thickness), lifespan of equipment systems, and rate of ongoing technological developments, existing QMUS methods would not allow for measurements to be made across the lifespan of the patient. This could possibly exclude some patients and limit more widespread clinical application, outside of specialized medical practices.
While it is not possible to control for all variables associated with the generation of a sonogram, mathematical methods which help improve standardization of images, irrespective of capture settings, may contribute to the long-term goal of image standardization, regardless of ultrasound equipment systems and instrumentation. Histogram matching is one such method that has been developed and evaluated under controlled laboratory settings. 22 Histogram matching enables global dynamic range transformations and the normalization of images, as the histogram distribution of a target image is trasformed to match that of a reference image. 22 The process of normalization then allows for the quantified echogenicity scores to be compared and may help overcome existing challenges associated with conventional QMUS.21,22 This could theoretically be used in any condition in which muscle echogenicity, based on ultrasonography, could be used as a relevant biomarker for informing practice.
The aim of this paper was to investigate the sensitivity of the histogram matching method, based on echogenicity scores derived from sonograms of the trapezius muscle, as well as the ability to differentiate between participants with and without FSHD. This research also explored the association between trapezius echogenicity values and other measures of upper limb body structure and function. An understanding of the relationship between these factors may provide information for future work that can be used to inform clinical decision-making.
Materials and Methods
This was a single measurement, case-control study. Participants were recruited from two separate sampling frames. These were a group of people with FSHD and an age- and gender-matched control group (CG). FSHD participants were recruited from a single tertiary center and through advertising across regional specialized centers. Age- and gender-matched controls were recruited from within the hospital using mailing lists and hospital communication platforms. Recruitment was completed by convenience, over a 12-month period. Five of 19 participants who were approached for the study declined or were unable to take part (i.e., recruitment rate 74%). The study received ethical approval from the West Midlands—Black Country Research Ethics Committee (21/WM/0275).
Participants who provided informed consent attended a single measurement session during which demographic data, clinical measures, 2D sonography, and 3D movement analysis of their upper limb were done. The outcomes evaluated in this study were echogenicity scores, muscle thickness, and ROM, which was determined using the maximum thoracohumeral elevation angle.
Inclusion Criteria
Participants above the age of 18 were included for both groups. For the FSHD group, a genetically confirmed diagnosis of FSHD was required. As this was a proof-of-concept study, no formal sample size calculation was conducted; however, sample size was consistent with previous studies.16,20,23 Stratified sampling by arm function was used for subgrouping those able to lift their arm above shoulder height, those unable to lift their arm above shoulder height, and those with previous scapulothoracic arthrodesis. The participants in the CG were age- and gender-matched.
Exclusion Criteria
For the FSHD group, participants were excluded if there was any recent trauma to the shoulder within the last three months that had not resolved, surgery to the thorax or upper limb in the last six months, a previous history of fracture to the shoulder joint, any co-existing neurological pathologies, or additional musculoskeletal injuries to the upper limb, being assessed. For the CG, they were excluded if they had previously presented to a health care professional with a diagnosis of shoulder instability, a previous shoulder injury within the last three months that had not resolved, any co-existing neurological pathologies or deficits, any previous surgical interventions on the arm, were undergoing, or awaiting medical management, such as diagnostics of the arm.
Demographics and Clinical Assessments
The patient demographics, Beighton scores of hypermobility, and grip strength testing were recorded, in addition to a clinical assessment of the shoulder (See Supplemental Appendix 1).
2D Ultrasonography Measurement Protocol
Sonograms of additional upper limb muscles and structures were taken at the measurement session (See Supplemental Appendix 1), but only the trapezius muscle was selected for analysis, as it was possible to extract muscle thickness and echogenicity from all participants. The trapezius muscle supports control of the scapula, which is important for upper-limb function. 24 For muscle thickness measurements, a gel stand-off pad was used to minimize tissue compression.
Surface bony landmarks were used for determining the point of muscle thickness measurements. Measurement of the middle trapezius was taken at the midpoint of a line between the seventh cervical vertebrae and the acromioclavicular joint. A total of six measurements were taken (i.e., three longitudinal and three transverse views) using an MyLab-Gamma (Esaote, Genoa, Italy) ultrasound equipment system and linear transducer (3-13 MHz). Depth and focus were adjusted for individual participants to ensure sufficient depth and landmark identification. Muscle thickness measurements were taken prior to the 3D movement analysis measurements.
Postcapture muscle thickness measurements were carried out using ImageJ 1.53t. Given the overall duration of the movement analysis and ultrasonography session, muscle thickness measurements were completed afterwards, to minimize the measurement burden for participants. Only sections of the image unaffected by the artifact were used. Muscle thickness was determined by measuring from the most inferior aspect of the subcutaneous fat layer (demarcating the superior border of the trapezius muscle) to the most superior aspect of the fascial plane, separating the trapezius from the underlying supraspinatus muscle (e.g., demarcating the inferior border of the trapezius muscle). For longitudinal views, the trapezius muscle was uniform across the image, allowing for the image midpoint to be used for calculating muscle thickness. To determine the midpoint, a line, orientated to the muscle fibers, was drawn across the length of the available image and was then bisected by another orthogonal line, which was used to measure the thickness of the muscle at this point (See Figure 1).
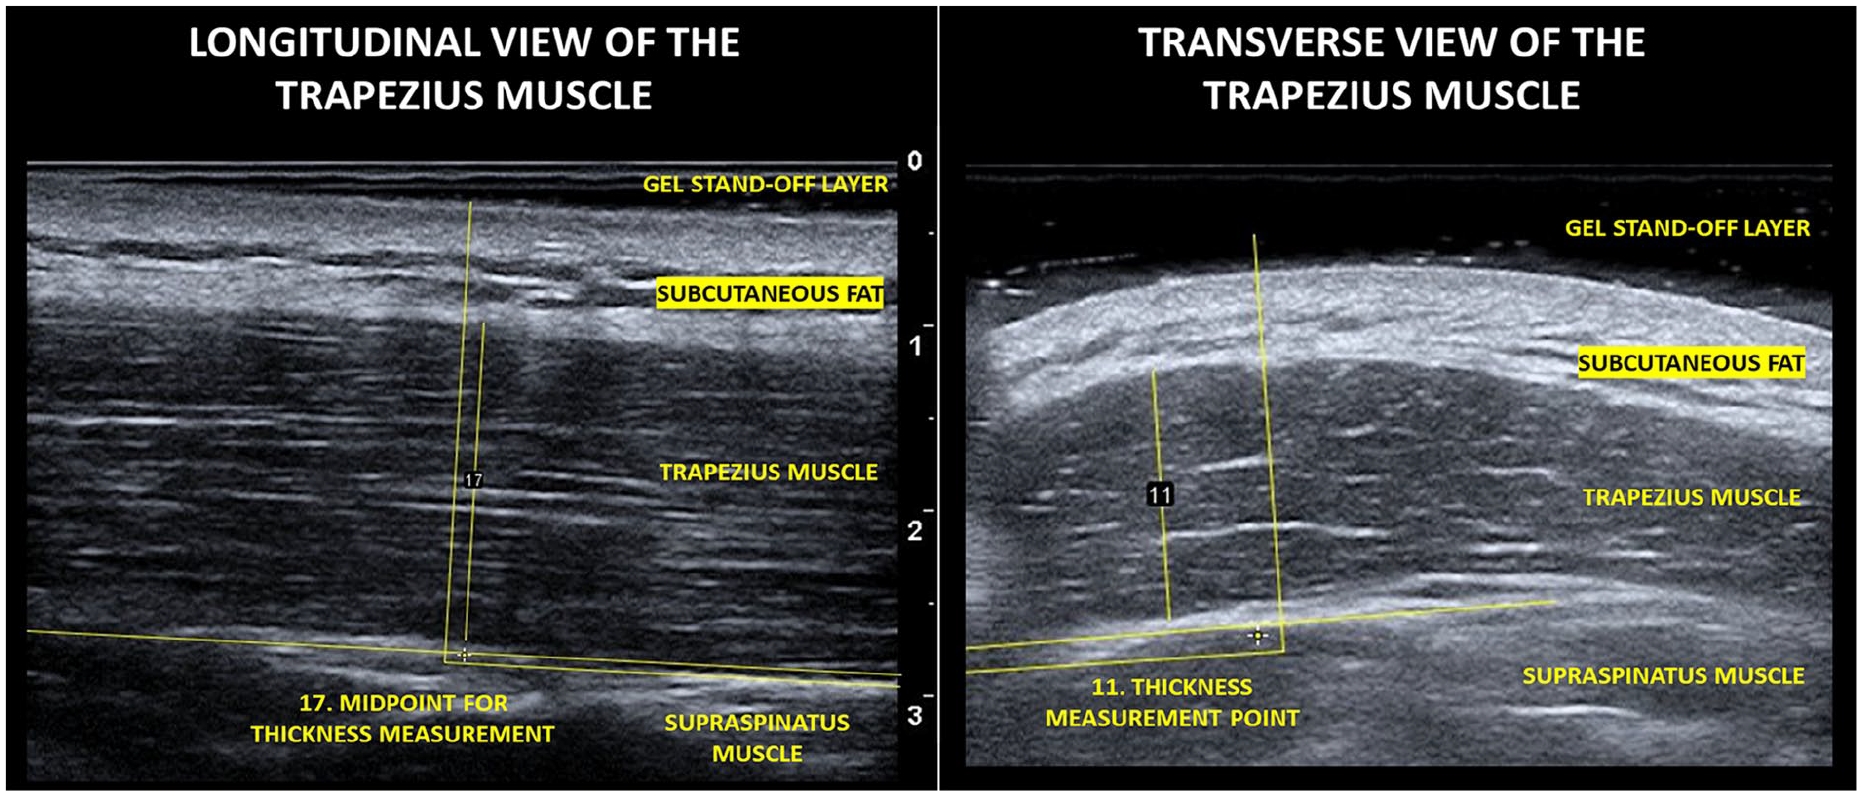
Selected sonographic images that demonstrate the measurement technique.
In the transverse view, the trapezius muscle was not uniform across the image for all participants (i.e., 9 of 15); therefore, the thickest part of the muscle was measured. For the transverse view, in six of the 14 participants, the midpoint was equivalent to the thickest part of the muscle. For measuring muscle thickness in the transverse view, a line orientated to the direction of the muscle fibers was drawn through the area of the image to be measured. An orthogonal line was then drawn at the thickest part to measure the thickness.
3D Motion Analysis Protocol
Marker cluster, surface electromyography placement, static calibration processes, gap filling/ and filtering of kinematic and surface electromyography waveforms have been reported previously. 25 Retroreflective marker clusters were placed on the thorax, acromion, humerus, forearm, and hand segments available at https://datacat.liverpool.ac.uk/2386/.26–28 Maximum thoracohumeral joint elevation angles were recorded.
All movements were conducted in sitting, and participants completed four unweighted upper limb tasks (i.e., flexion, abduction, abduction to 45° with axial rotation, and hand to back of head) and three weighted tasks (self-selected) of 0.5, 1.0, or 1.5 kg (i.e., flexion, abduction, abduction to 45° with axial rotation, in that order). A total of 12 repetitions (i.e., two sets × six repetitions) were carried out for unweighted tasks, and a total of six repetitions (i.e., two sets × three repetitions) were carried out for weighted tasks. Participants were initially shown the movements by the assessor and then asked to carry them out to a count of 3 seconds up, 3 seconds down, so as to mimic the researcher, positioned in front of them.
Data were collected using a Vicon motion capture system at 100 Hz. The motion capture system was comprised on 12 V5-Vantage motion analysis cameras, two synchronous coronal and sagittal video recordings, and Delsys Trigno electromyography system sampling at 2000 Hz.
Data Processing, Histogram Matching and Analysis
Group demographic data are presented as frequencies. Histogram matching was carried out as described by Bottenus et al. 22 All images were matched to a single reference image (i.e., transverse view of the trapezius muscle) retained from a CG participant. The reference participant was a younger male, who was selected due to participating in regular upper-limb physical activity, had healthy muscle tissue, and no evidence of echogenic changes, compared to those seen in older healthy muscle tissue.
In the first stage, manual segmentation of the subcutaneous fat layer was carried out and used as the region-of-interest (ROI), in histogram matching across all images (See Supplemental Appendix 2). The subcutaneous fat layer was selected for normalization on the assumption that the distribution would be homogeneous within and across participants. This was supported by preliminary analysis on a subset of the data. It was hypothesized that the tissue structure (i.e., subcutaneous fat layer) would likely be less affected by any underlying disease processes. From this, the histogram distribution in the subcutaneous fat layer ROI, in the reference image, was compared to the subcutaneous fat layer ROI in the target image, on an individual basis. A correction factor was then determined, and using full histogram matching, a monotonic transformation was applied across the entire target image, resulting in global dynamic range transformations and the normalization of the image. 22 After this step, the trapezius muscle was segmented by manually drawing an ROI, which was used to determine echogenicity by quantifying the mean grayscale values. All analysis was carried out in the software package MATLAB 2021a (MathWorks, Natick, Massachusetts) based on the code available at https://github.com/nbottenus/histogram_matching. 22
The International Society of Biomechanics (ISB) recommendations were followed for joint co-ordinate system definitions and joint angles were calculated using inverse kinematics in Opensim 4.4.29 –31 Scaling ratios were determined from marker pairs associated with individual bony segments, identified in the static calibration, and consistent with best practice guidelines.25,32,30
Sensitivity Analysis
To evaluate the effect of histogram matching on the sonograms, echogenicity values, within the images, with and without normalization, were compared. To explore the sensitivity of the histogram-matching method based on different reference images, analysis was carried out using a Bland-Altman plot. 33 The Bland-Altman plot allowed for comparison of two measurements derived using different methods. The overall agreement was derived by calculating the mean difference between the two measurements against their average, across a range of measurements. From this, the overall bias, upper and lower limits of agreement were determined. The originally selected reference image (i.e., transverse view) was compared against a longitudinal view of the same muscle for the same participant, ROI, and capture settings.
Comparison of Groups for Echogenicity Scores
A Student’s t-test was used to determine if between group echogenicity values (i.e., measured from sonograms normalized to the transverse reference image) were statistically significant with the p-value set at .05.
Relationship Between Muscle Structure and Function
The relationship between trapezius muscle thickness and echogenicity was explored by plotting the average muscle thickness, across all views, with the average echogenicity values, across all views. The relationship between trapezius muscle structure (i.e., echogenicity) and function (i.e., range of motion, ROM) was explored by plotting the average muscle thickness across all views against the maximum thoracohumeral angle of elevation, from the abduction with a weight movement. Abduction was selected after Spearman’s correlation was used to identify the movement and plane with the highest correlation with echogenicity (See Supplemental Appendix 3). The relationship between trapezius muscle structure (thickness) and function (ROM) was explored by plotting the average muscle thickness across all views and the maximum thoracohumeral angle of elevation, achieved during the movement of abduction with a self-selected weight.
Results
Participant Demographics
Data were collected for 14 participants, seven people with FSHD and seven age- and gender-matched controls. Demographic characteristics for all participants are reported in Table 1. For the FSHD group, three participants were able to lift their arm above shoulder height, two were unable to lift their arm above shoulder height, and two had previous scapulothoracic arthrodesis.
The Demographic Characteristics of the Participants Consented to a Research Study of Those With Facioscapulohumeral Muscular Dystrophy (FSHD).
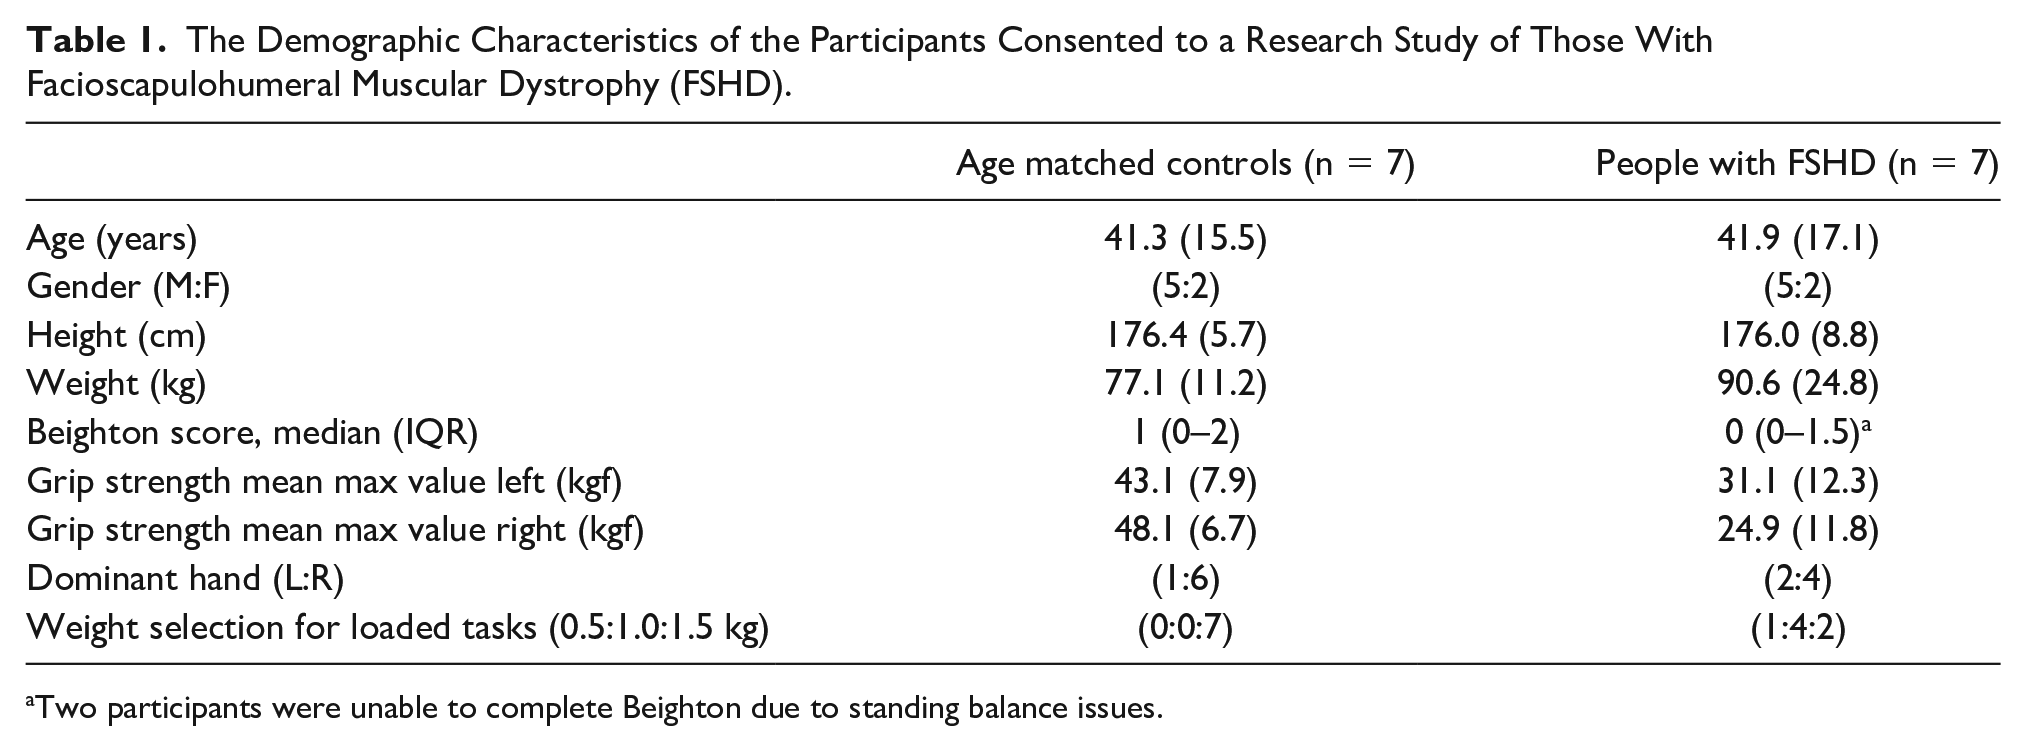
Two participants were unable to complete Beighton due to standing balance issues.
Results for maximum ROM, across all activities at the thoracohumeral joint, for the FSHD group and the CG are presented in Table 2. The CG achieved larger ROM values when compared to the FSHD group. This was anticipated, based on the use of stratified sampling, based on arm function.
The Study Data on Maximum Range of Movement Values for the Thoracohumeral Joint, Based on Participants With and Without Facioscapulohumeral Muscular Dystrophy (FSHD).
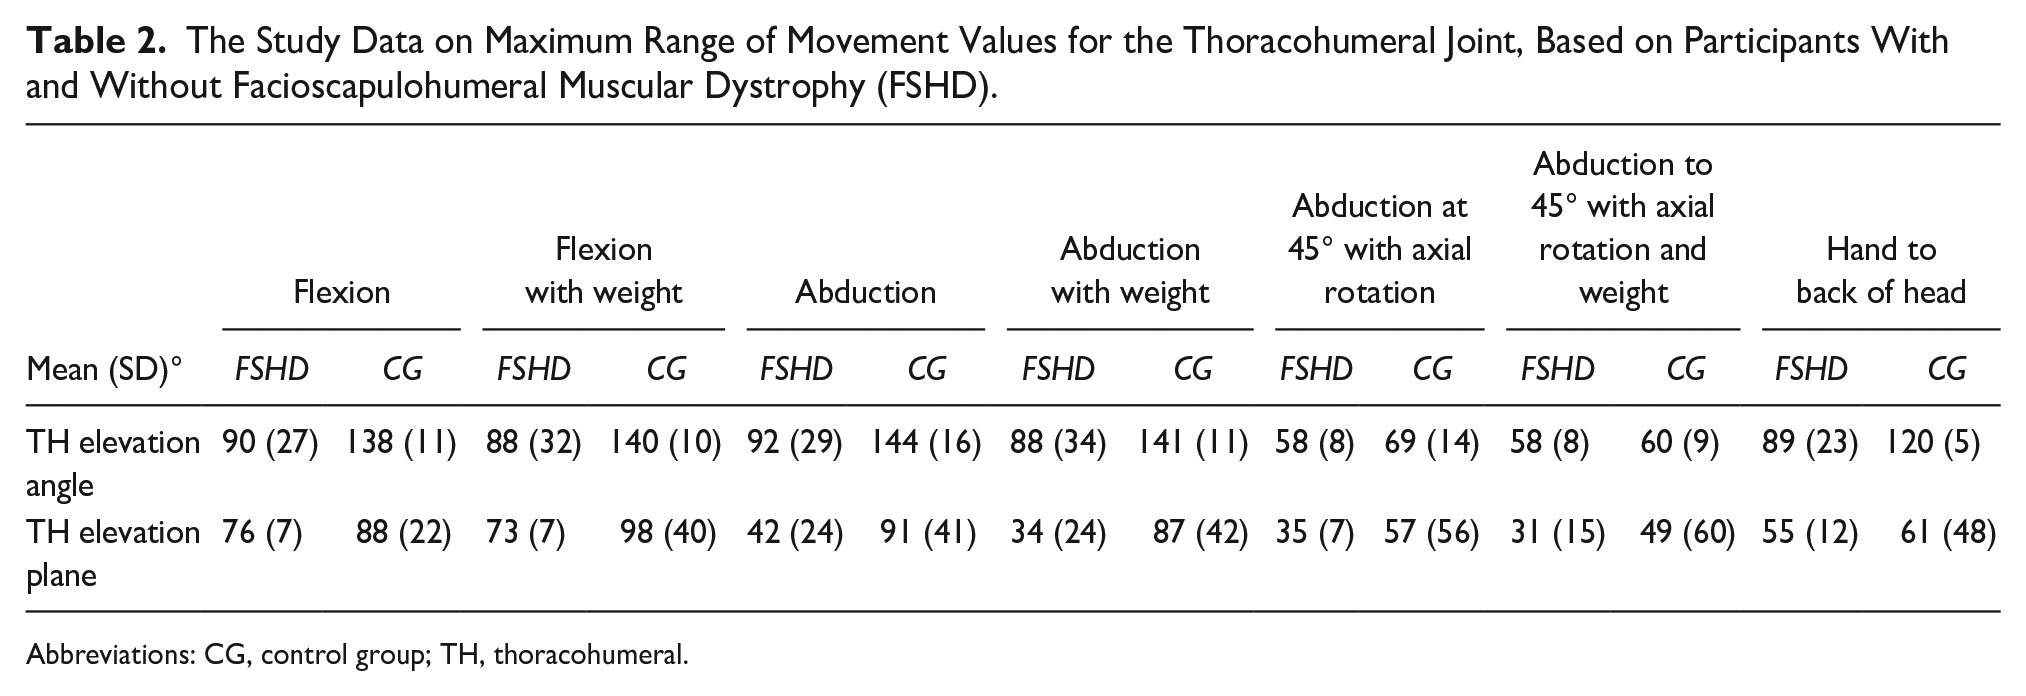
Abbreviations: CG, control group; TH, thoracohumeral.
The plane of elevation was similar between groups for most of the movements, apart from unweighted and weighted abduction. The FSHD group may likely be changing plane of elevation, as a compensation method for achieving more ROM in abduction.
Sensitivity Analysis
A box and whisker plot of echogenicity scores derived from images, with and without normalization for FSHD and CG, is provided (See Figure 2). Echogenicity scores derived from non-normalized images were generally higher and more variable, resulting in a lesser ability to distinguish between groups (See Figure 2). For the normalized images, the mean and standard deviation (SD) of echogenicity values, in the FSHD group, were higher than those in the CG (118.2 [SD, 34.0] compared to 42.3 [SD, 14.], respectively) with the statistically significant differences at p = .002. Results for the sensitivity analysis echogenicity scores based on different reference images are presented in Figure 3.
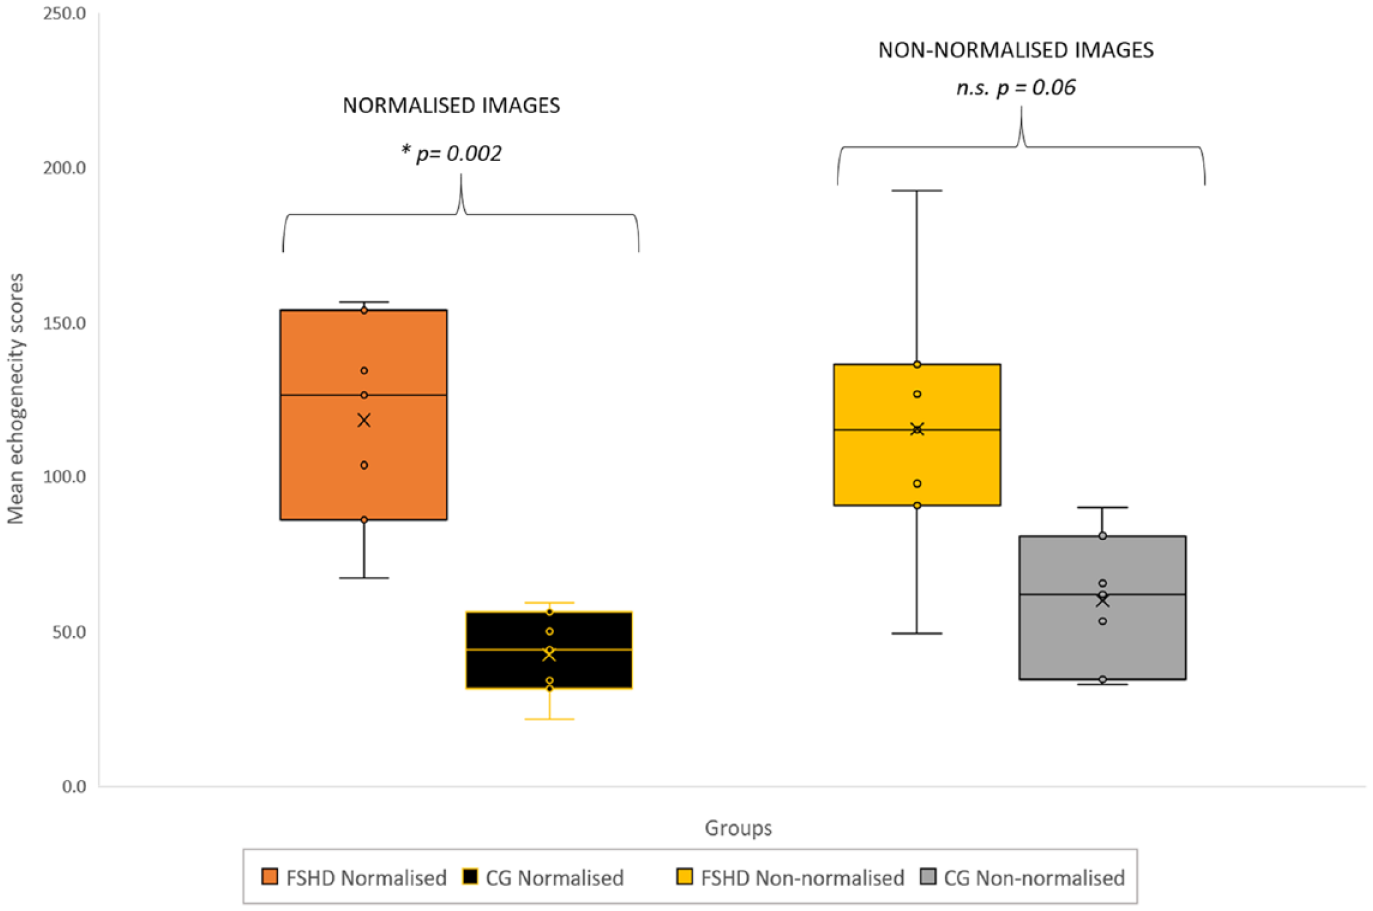
A box plot diagram that illustrates the spread of data based on mean echogenicity values that were recorded in the two participant groups. The image data were normalized by using a reference image for standard muscle echogenicity.
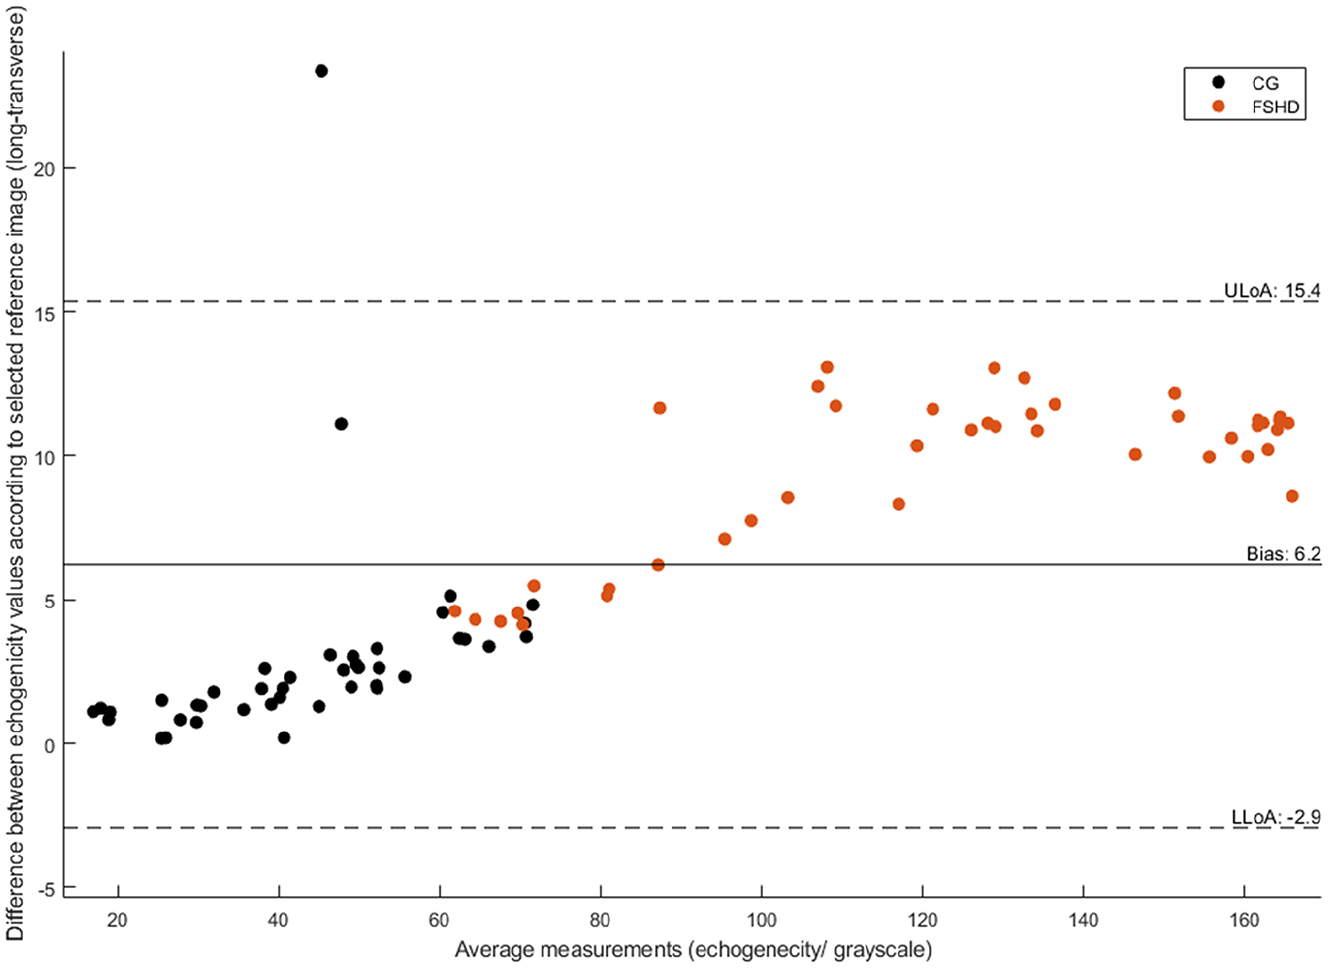
A Bland-Altman plot for comparing the participants longitudinal and transverse sonographic images, based on the echogenicity scores.
The Bland-Altman plot shows an overall variance of 6.2 between the longitudinal and transverse images, based on the echogenicity scores (i.e., lower level of agreement −2.9 and upper level of 15.4). The longitudinal reference image was associated with a higher echogenicity score offset relative to the transverse image. The largest differences were observed for the FSHD group and participants with FSHD, with those images having overall higher echogenicity scores. In cases where participants with FSHD had similar levels of arm function to their age- and gender-matched control, differences identified between reference images were similar. Overall, the variance between reference images was smaller for the CG.
Relationship Between Muscle Structure and Function
Results outlining the relationship between different measures of upper limb structure and function are presented in Figure 4. The largest explained variance was observed for muscle thickness and echogenicity (R2 = 0.81), followed by echogenicity and ROM (R2 = 0.74). Muscle thickness and ROM had the lowest explained variance (R2 = 0.61) possibly indicating that muscle thickness has limited capacity for explaining the variance in muscle function (maximum ROM). The results suggest echogenicity scores are better at accounting for the variance in muscle thickness values and maximum ROM. In most cases, a distinction between groups is evident based on the measurements evaluated, with the mean and SD of muscle thickness values being higher in the CG compared to the FSHD group (1.48 cm [SD 0.27] compared to 0.74 cm [SD 0.45], respectively) and the CG being able to achieve higher ROM for weighted abduction compared to the FSHD group (141° [SD 11] compared to 88° [SD, 34] respectively).
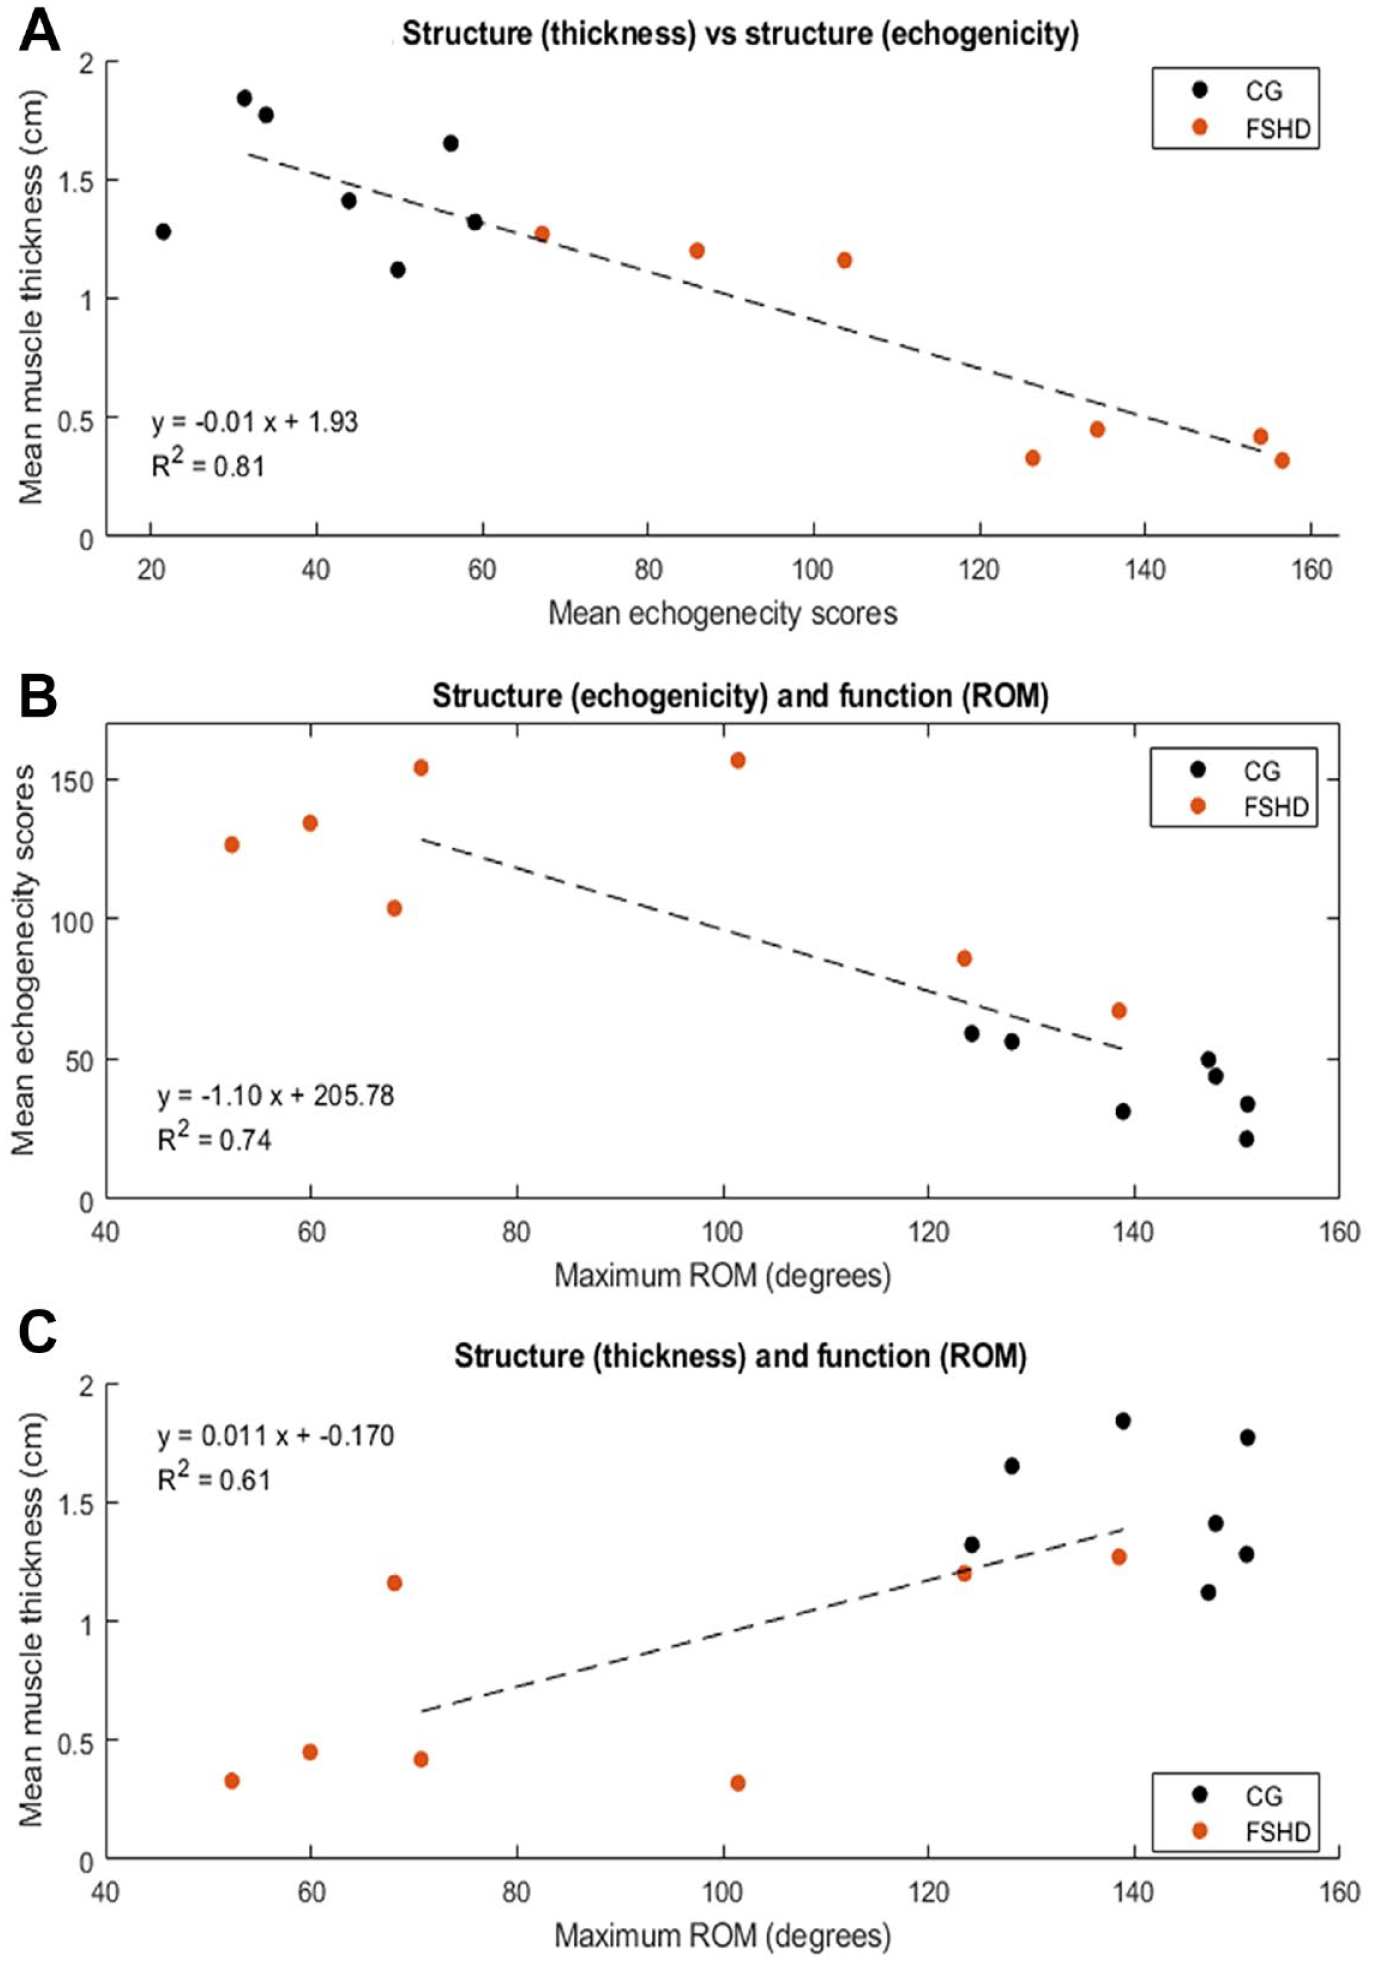
A series of scatter plots that demonstrate the following relationships: (A) Participants, with and without FSHD, muscle thickness compared to echogenicity. (B) Participants, with and without FSHD, range of motion (ROM) compared to echogenicity. (C) Participants, with and without FSHD, muscle thickness and ROM.
Discussion
The aim of this research was to investigate the sensitivity of the histogram-matching method on echogenicity scores derived from sonograms of the trapezius muscle and its ability to differentiate between participants with and without FSHD. The study also explored the association between trapezius echogenicity values and other measures of upper-limb body structure and function. Participants with FSHD demonstrated higher echogenicity values and smaller muscles consistent with degenerative muscle structure changes seen in FSHD, such as atrophy, fatty replacement, fibrosis, and edema. These results suggested that postcapture processing of sonograms, using histogram matching, is needed for comparison of echogenicity values, captured using different equipment instrumentation settings. This method can provide quantifiable differences in participants, with and without FSHD. An estimation of the error based on the use of different reference images was also identified, which may be used for informing comparison or interpretation of images for clinical decision-making.
Evaluation of the trapezius muscle identified that the FSHD group had higher echogenicity values and less ROM. The current study results were consistent with similar studies that identified the relationship between higher echogenicity scores for the trapezius muscle and increased disease severity and levels of impairment in people with FSHD.18,19 While these findings were similar, a direct comparison of echogenicity values is not possible given the difference in ultrasound equipment systems and instrumentation that was used to derive echogenicity scores. In the present study, histogram matching was used, and image capture settings for individual patients were varied. In other studies, ultrasound equipment systems and the image capture settings remained constant.18,19 An advantage of this study method was that it allowed for measurement settings to be optimized for individuals and comparisons across ultrasound equipment systems and models may be possible. Requirements for consistent ultrasound equipment systems, models, and normative reference data sets limit retrospective and cross-study comparison, and possibly more widespread use and translation to clinical practice. The use of a standard reference image and postprocessing, alongside an understanding of the margins of error, could address these factors.
The echogenicity values were subject to variation, dependent on the reference image used; however, these were small (i.e., bias of 6.2) and less than the between-group differences observed in the present study. Differences between the reference images used for calculating echogenicity scores were larger in the FSHD group. An offset for higher echogenicity values was identified when the longitudinal reference image was used. This offset possibly stemmed from the presence of more hyperechoic regions associated with the muscle fibers, potentially resulting in increased signal attenuation across the whole image and ROI (i.e., subcutaneous fat layer) used for histogram matching. An assumption made in the present study was that the distribution of the subcutaneous fat layer was homogeneous within and across participants. While this was supported by preliminary analysis, if differences in the distribution were present, within the subcutaneous fat layer ROI, this may affect results between participants, but not within the same participant. All muscle thickness measurements, manual segmentation of subcutaneous fat, and muscle ROIs were taken by a single assessor trained in ultrasonography and image segmentation. Application of the posthistogram matching (e.g., dependent on the reference image) was consistent across all ROIs and any variability likely stems from the chosen reference image. Variability in image segmentation ROI, for reference or target images, may affect echogenicity values, particularly if conducted by another researcher. Further work is needed to investigate the inter-rater reliability for image segmentation and evaluation of echogenicity scores.
Upper limb echogenicity values, derived from sonograms and histogram matching, could facilitate clinically feasible bedside methods for assessing and monitoring disease progression, in FSHD. Echogenicity has been used as a biomarker for screening and monitoring in studies investigating FSHD, other neuromuscular diseases,34,35 and settings such as intensive care medical units. 36 The present study identified differences in echogenicity scores between groups which were statistically significant. While other methods, such as the Heckmatt scale, are available for classifying changes to muscle structure, and correlate well with QMUS, it is an ordinal score which does not allow for quantification of echogenicity and has an inability to determine changes to muscle structure, within existing classification categories.18,19 While QMUS may be a valuable biomarker in the assessment and management of people with FSHD, it is important to note that it is a local measure, limited by beam width and variable performance in some patient types (i.e., those with higher adipose levels). Fatty replacement in muscle structure for FSHD is heterogonous, with a potential proximal to distal progression as determined by MRI. 16 Given that QMUS is often conducted on the mid-muscle belly, not scanning the entire muscle structure may result in the omission of some muscle structure changes.16,18,19,37 In some longitudinal studies, echogenicity scores in a limited number of people with FSHD have reduced, which may suggest improvement to muscle structure. However, variations in echogenicity values may stem from fluctuations in edema, as well as fibrosis, which QMUS may be unable to differentiate. 19 Interpretation of QMUS measures therefore needs to be undertaken with the understanding that measurement location, method of analysis, and fluctuations in immunochemical disease processes may affect echogenicity scores.
The trapezius muscle is one of the more commonly evaluated upper limb muscles in FSHD and demonstrates changes consistent with disease progression.18,19 Given the role of the trapezius muscle in controlling the scapula and relative ease of measurement, due to its size and morphology, compared to muscles such as serratus anterior, it may be a pragmatic choice for monitoring and prognosis planning in the upper limb of people with FSHD. 24 Within the present study, the trapezius muscle was selected as it allowed for evaluation of muscle thickness and echogenicity for all participants. In cases where participants had smaller body segments or muscles, particularly for people with FSHD, capturing images that sufficiently showed the entire thickness and did not compress the muscle was challenging. This was because in some cases the requirements to maintain sufficient surface contact with linear transducer and lesser convex surface of the underlying body segment resulted in loss of contact. Previous studies, including the current study, have used a limited subset of upper limb muscles for evaluation of echogenicity scores and changes to function or disease progression. Within the current study, echogenicity was able to explain 74% of the variance in ROM (R2 = 0.74) and further evaluation of other upper limb muscles involved with control of the shoulder girdle and arm may help explain the outstanding variance. Although determining consistent methods, including the location of structures and positions for patients, can be challenging to standardize. Sites for measurement, derived with reference to surface bony landmarks, were selected in this study, as a pragmatic method for standardizing measurements. These were selected in place of anatomical reference points, within a muscle measured by ultrasonography, as these may be subject to operator variability. Furthermore, while several studies have evaluated the trapezius muscle, it is possible that the site of measurement within the muscle may vary between studies, and methods for determining the measurement point were not explicit in all studies.18–20 Future work may be dedicated to develop standardized diagnostic protocols and muscles for QMUS that could be reproduced and possibly used to inform screening, prognosis, monitoring, and clinical decision-making.
Measurement of both muscle echogenicity and thickness values may be required for monitoring and prognosis planning in the upper limbs of people with FSHD. QMUS was able to account for a large proportion of the variance in muscle thickness (i.e., structure) and maximum ROM (i.e., function) with R2 values of 0.81 and 0.74, respectively. These findings may be anticipated given that (1) changes in one structural component of a muscle (e.g., fibrosis measured by echogenicity) will likely be reflected in another (e.g., thickness); (2) trapezius is known to be a significant contributor for ROM at the joint; (3) redundancy, stemming from the number and thickness of upper-limb muscles may account for the limited relationship between measures. 38 While muscle thickness was able to account for some of the variance in ROM (R2 = 0.61), based on the present cohort, this was limited when compared to other measures. The overall strength of the correlations observed is based on the current data set of a single disease population and age- and gender-matched controls. Further work is needed to evaluate the relationship between measures and their ability to potentially inform decision-making with a larger sample and potentially different populations. Additional measures such as force production, which is proportional to muscle thickness, may help increase the explained variability between structure and function. Dijkstra et al. 19 found a correlation between echogenecity and strength in children with FSHD of r = −0.74. Previous research has reported variable levels of correlation (approximately 0.5 to 0.6) with QMUS and the FSHD clinical severity scale.18,19 However, lower levels of agreement may be attributed to the limited measurement properties of the FSHD clinical severity scale, which is an ordinal score rather than QMUS. Use of muscle thickness measures in isolation for prognosis planning or categorization of function may therefore be of limited diagnostic value.
Limitations
The major limitation was the research design that has threats to internal and external validity, as well as the sampling method. In addition, This was a single measurement study and did not evaluate the longitudinal variability or changes of measures or methods used. Further research is needed to evaluate the longitudinal variability associated with this method on a larger sample of people with varying levels of arm function. This should also include variability in the echogenicity scores based on multiple images taken from different sites within a muscle and with analysis of image segmentation and histogram matching, carried out by multiple researchers. While theoretically histogram matching should allow for comparison between ultrasound equipment systems, models, and different muscles within and between people, further evaluation is needed. In the present study, it was not possible to compare the current study images against another imaging technique, such as MRI, which is considered a diagnostic gold standard. 18 QMUS has already been evaluated against MRI, using different echogenicity analysis methodology and demonstrated high levels of agreement, despite a lesser ability to differentiate swelling and fibrosis.15,16 Echogenicity scores are variable subject to the size and the region selected. While segmentation was possible for all participants, this was challenging in cases where participants either had very small subcutaneous fat layers (e.g., mainly CG), small muscles or edge artifact, present in some components of the muscle. In this study, segmentation was checked for spurious results and included only relevant tissue areas, devoid of artifact. It is acknowledged that these potentially could have affected results for individual people. The same is true for muscle thickness measurements. A comparison of two reference images was carried out, and it is unclear how the magnitude of the error varies across multiple images of the same or different muscle. The reference image selected was chosen on the basis that it came from one of the younger CG participants who engaged in regular upper limb exercise and would therefore be a suitable comparison for people who were older or had less function. Further work may look to compare multiple reference images and the effect on echogenicity scores, possibly in multiple neuromuscular diseases. While QMUS and the use of posthistogram matching have demonstrated an ability to differentiate between groups with and without FSHD, it should not be considered as a diagnostic tool given that the accuracy of this method has not been evaluated in real-world clinical settings.
Conclusion
Histogram matching for normalization of sonograms is better able to differentiate and quantify differences between people, with and without FSHD, compared to non-normalized images. Based on this study sample, overall echogenicity scores derived from the trapezius muscle were able to better account for the variance in muscle thickness values and function. Muscle thickness had limited ability in accounting for function when evaluated in isolation, but further work is needed to confirm the strength of correlation measures observed between measures of structure and function. The FSHD group had higher echogenicity values and smaller muscle thicknesses when compared to the CG, consistent with degenerative muscle structure changes associated with the disease. Ultrasonography of the trapezius and selection of measurement site based on surface bony landmarks allowed for pragmatic simultaneous capture of measurement and thickness in all participants. This could facilitate clinically feasible bedside methods for assessing and monitoring disease progression in people with FSHD. Further research is needed to recruit a larger sample of patients with FSHD and varying levels of arm function, carry out longitudinal measurements, and evaluate the sensitivity of these measures based on variable reference images.
Supplemental Material
sj-docx-1-jdm-10.1177_87564793241293782 – Supplemental material for Quantifying Morphological Changes in Middle Trapezius With Ultrasonography and Histogram Matching for Participants With and Without Facioscapulohumeral Dystrophy
Supplemental material, sj-docx-1-jdm-10.1177_87564793241293782 for Quantifying Morphological Changes in Middle Trapezius With Ultrasonography and Histogram Matching for Participants With and Without Facioscapulohumeral Dystrophy by Fraser Philp, Erik Meilak, Martin Seyres, Tracey Willis, Naomi Winn and Anand Pandyan in Journal of Diagnostic Medical Sonography
Supplemental Material
sj-tif-2-jdm-10.1177_87564793241293782 – Supplemental material for Quantifying Morphological Changes in Middle Trapezius With Ultrasonography and Histogram Matching for Participants With and Without Facioscapulohumeral Dystrophy
Supplemental material, sj-tif-2-jdm-10.1177_87564793241293782 for Quantifying Morphological Changes in Middle Trapezius With Ultrasonography and Histogram Matching for Participants With and Without Facioscapulohumeral Dystrophy by Fraser Philp, Erik Meilak, Martin Seyres, Tracey Willis, Naomi Winn and Anand Pandyan in Journal of Diagnostic Medical Sonography
Supplemental Material
sj-tif-3-jdm-10.1177_87564793241293782 – Supplemental material for Quantifying Morphological Changes in Middle Trapezius With Ultrasonography and Histogram Matching for Participants With and Without Facioscapulohumeral Dystrophy
Supplemental material, sj-tif-3-jdm-10.1177_87564793241293782 for Quantifying Morphological Changes in Middle Trapezius With Ultrasonography and Histogram Matching for Participants With and Without Facioscapulohumeral Dystrophy by Fraser Philp, Erik Meilak, Martin Seyres, Tracey Willis, Naomi Winn and Anand Pandyan in Journal of Diagnostic Medical Sonography
Footnotes
Ethics Approval
Ethical approval for this study was obtained from West Midlands —Black Country Research Ethics Committee (21/WM/0275).
Informed Consent
Written informed consent was obtained from all subjects before the study.
Animal Welfare
Guidelines for humane animal treatment did not apply to the present study because no animals were used during the study.
Trial Registration
Understanding Control and Mechanisms of Shoulder Instability in FSHD: NCT05239520.
Declaration of Conflicting Interests
The authors declared no potential conflicts of interest with respect to the research, authorship, and/or publication of this article.
Funding
The authors disclosed receipt of the following financial support for the research, authorship, and/or publication of this article: This work was funded by the Orthopedic Institute Limited: Award RPG185.
Supplemental Material
Supplemental material for this article is available online. Scan the QR code with your smart device to view the online supplemental materials.
References
Supplementary Material
Please find the following supplemental material available below.
For Open Access articles published under a Creative Commons License, all supplemental material carries the same license as the article it is associated with.
For non-Open Access articles published, all supplemental material carries a non-exclusive license, and permission requests for re-use of supplemental material or any part of supplemental material shall be sent directly to the copyright owner as specified in the copyright notice associated with the article.