
Abstract
Objective:
Burnout in sonographers is a prevalent and complex professional hazard associated with poorer quality of work life, productivity, and patient outcomes. This study aimed to understand the prevalence of and work systems factors associated with burnout among a large sample of sonographers.
Materials and Methods:
Research study registry participants (n = 3659) were invited to complete a follow-up survey about personal and work environment factors, including work hours, break time, coworker and supervisor support, and job satisfaction, overall health, and sleep quality. The Copenhagen Burnout Inventory assessed personal, work-related, and client burnout. Simple and multiple linear regressions were used to identify work systems factors associated with burnout.
Results:
Of 1389 respondents, over half reported moderate-to-severe personal and work-related burnout, while one-quarter reported moderate-to-severe client burnout. Higher work-related burnout was associated with younger age, working in the Western United States, working full-time, taking fewer weekly break hours, poorer overall health and sleep quality, and lower supervisor support and job satisfaction. Client burnout was associated with poorer sleep quality and lower job satisfaction.
Conclusion:
Burnout was prevalent in a large sample of sonographers. Multilevel work systems factors are associated with burnout, suggesting collaboration among sonographers, administrators, and organizations is needed to address burnout.
Keywords
Burnout is a prevalent occupational condition among workforces worldwide, and healthcare workers are at higher risk of experiencing burnout than the general working population.1 –4 Although burnout is not a diagnosable psychological disorder, 5 researchers and clinicians generally describe burnout as a persistent state of exhaustion resulting from excessive job demands and unmanaged chronic workplace stress.1,2,5 –7 Measurable facets of burnout reported in the research literature include experiences of depersonalization, diminished sense of personal accomplishment, emotional exhaustion, personal burnout, work-related burnout, and client burnout.2,8,9 Over time, persistent burnout in workers can detrimentally impact psychological and physical health, as well as social roles and relationships, especially among healthcare workers.10 –12 Moreover, burnout among healthcare workers is associated with other detrimental service-related outcomes, such as lower patient satisfaction, increased patient and worker safety challenges, and overall poorer quality of care.13,14
Sonographers, like their physician and nursing colleagues, are at high risk for burnout.11,14 Sonographers’ job demands typically entail managing many factors highly associated with burnout, including shift work, working with populations experiencing illness and trauma, and jobs with high exposure to hazardous working conditions.14,15 Moreover, the experiences of burnout in health care workforces throughout the world became a focus of public health efforts to alleviate challenged workers and health care infrastructure during the COVID-19 pandemic, including those among the sonography community.12,16 –18 Understanding and prioritizing factors associated with burnout among sonographers can help clinicians, researchers, and administrators better target individual- and system-level aspects that will most improve health, productivity, and safety in the sonography workforce.14,15
Recently, sonography professionals in Australia and New Zealand conducted comprehensive nationwide surveys of burnout in their professions and indicated that 87% to 100% of respondents reported high levels of burnout among facets of depersonalization, emotional exhaustion, and personal accomplishment.14,19 However, there is a paucity of large-scale studies with representative samples in the United States and Canada, despite emerging evidence of burnout’s association with musculoskeletal injuries and poor mental health in these sonography workforces.19,20 Moreover, Younan and colleagues 14 have also highlighted consistent associations between work-related demands in the sonography profession (e.g., completing high numbers of scans and tasks or managing stressful clinical encounters) and burnout. A longitudinal survey study has been established as part of the Work-Related Musculoskeletal Disorders (WRMSD) Grand Challenge to understand health-related challenges within the profession.21 –23 Organizations and stakeholders participating in the WRMSD Grand Challenge prioritized understanding not only WRMSD but also occupational hazards such as burnout and workplace harassment affecting the sonography workforce. A questionnaire was sent to the study registry to examine burnout in sonographers working in the United States and Canada. Given the lack of data in this area, the aim was not only to describe the prevalence of burnout among sonographers in the United States and Canada but also to identify worker, workplace, work, and health-related factors associated with burnout.
Materials and Methods
Data analyzed and reported in this article were obtained as part of a prospective survey research study to identify and track health, personal, and occupational factors over time in a cohort of US and Canadian sonographers. 21 The initial cohort of 3659 sonographers was recruited through an initial survey that went to approximately 100 000 sonographers in professional registries accessible to WRMSD Grand Challenge organizations and stakeholders in June 2021, 22 and follow-up data collection was obtained through Qualtrics (Qualtrics, Provo, Utah) from November 2 to November 30, 2021. The data included in this quantitative survey-based study came from respondents who had completed both the initial and follow-up questionnaire; respondents who were (1) not working, (2) students, or (3) working outside the United States or Canada, were excluded. All study components were approved by the university’s institutional review board (IRB#: 2021B0113). Participants provided informed consent for their data to be collected, received no compensation for participating, and contributed data on a voluntary basis. Roll and colleagues 22 reported sampling and survey design procedures in detail for this cohort of sonographers, and this study followed similar procedures.
Questionnaire Design
The Sonography Work Systems (SWS) 22 framework guided the identification of relevant features for examining relationships among work systems, work processes, and sonographer health and well-being. 24 Specifically, factors within the general categories of worker, workplace, work, and health were examined as predictors of sonographer burnout. “Predictor” is used in this article as a term for the variables statistically tested for an association with the target outcome measure (i.e., burnout), and its use is not meant to imply causation or temporal relationships. Variables extracted from the initial survey and detailed descriptions of new variables measured in the follow-up survey are described in the following sections.
Worker predictor variables
Sociodemographic factors of age, weight, height, gender, race, ethnicity, and handedness were included. Self-reported age in single years was scaled to 10-year increments, and respondents’ self-reported weight and height were used to calculate their body mass index (BMI, kg/m2). Respondents also self-reported their sonography credentials (e.g., Registered Diagnostic Medical Sonographer [RDMS], Registered Vascular Technologist [RVS]), and indicated whether they had completed any sonography-related ergonomics training.
Workplace predictor variables
The US respondents were categorized into four regions based on the US Census Bureau’s classifications: Midwest, Northeast, South, and West. 25 Respondents from Canada were aggregated into a single category, due to fewer responses. Respondents reported their workplace setting(s) as a hospital, outpatient clinic, physician’s office, educational, or other workplace, and indicated if their facility had any accreditations (i.e., American College of Radiology [ACR], American Institute of Ultrasound in Medicine (AIUM), Intersocietal Accreditation Commission (IAC), and others). Ratings of workplace culture and trust in management were pulled forward from the initial survey. 22 A supervisor and coworker support scale was used to generate summary scores for participants based on their average scores across Likert-type responses (i.e., 1 = Very little to 4 = Very much).26,27 Finally, respondents were asked five questions about overall job satisfaction, the likelihood of choosing another job, the likelihood of choosing a current job, the extent to which the current job measures up to expectations and desires, and the likelihood of recommending the job to a friend, which formed a facet free job satisfaction scale; each response was converted to a score from 1 to 5, with an average score representing perceived job satisfaction from low (1) to high (5). 28
Work predictor variables
Respondents reported their primary practice specialties (e.g., abdominal, vascular, echocardiography, obstetrics and gynecology [OB/Gyn]), their work schedule classifications (i.e., full-time, part-time, per diem), number of work locations, and total break hours, hours on call, and hours of call back in the prior week of work. Respondents who indicated working at one location provided the start and end time of their work shifts over the previous 7-day period, and those who worked at multiple locations or on a per diem basis provided the total daily hours worked over the previous 7-day period. All responses were converted to total hours worked within the previous week. To ensure the validity of work hour conversions, two researchers independently evaluated reported start and end times at work and then corroborated findings; a third researcher made a final decision on any cases of disagreement. Four index measures from the initial survey related to work tasks and processes were pulled forward: (1) using adjustable equipment, (2) taking breaks, (3) experiencing interruptions to workflow, and (4) experiencing work-related performance pressures.22,23 As in previous analyses, each variable was scaled by 10 to generate scores representing 10% increments of time from 0% to 100%.
Health predictor variables
Dichotomous predictors of the presence or absence of work-related musculoskeletal discomfort, visual strain, and headaches were generated, 22 and a dichotomous predictor of self-reported experience of a work-related musculoskeletal injury was generated, based on the response to the question: Beyond regular discomfort, have you experienced a work-related musculoskeletal disorder or injury, whether it was formally diagnosed or not? Finally, participants self-reported their overall health status and sleep quality on Likert-type scales (e.g., 1 = Poor and 5 = Excellent) and their average hours of daily sleep (i.e., 1 = < 5, 2 = 5-6, 3 = 6-7, 4 = 7-8, and 5 = > 8 hours) using questions from the authors’ previous work.27,29
Burnout outcome variable
The Copenhagen Burnout Inventory (CBI) 8 was used and has established validity across various healthcare workers, such as nurses and physicians.9,30 The CBI has 19 questions across personal, work-related, and client burnout subscales. In the sonography context, “client” refers to patients and other individuals associated with the patient for whom an imaging exam is being completed. Participants rated each question on a Likert-type scale ranging from “Strongly Agree” to “Strongly Disagree” (i.e., 1-5), which was converted to values in increments of 25, ranging from 0 (i.e., 1) to 100 (i.e., 5), per CBI scoring instructions. The item scores were averaged within each subscale to generate personal, work-related, and client burnout scores for each participant. The item and subscale scores were interpreted using the categories of No-to-Low Burnout (i.e., < 50), Moderate Burnout (i.e., ≥ 50 and < 75), and High-to-Severe Burnout (i.e., ≥ 75). 31
Data Management and Analysis
Ineligible and duplicate responses were removed from baseline and follow-up data sets. All included variables were inspected for normality, missing data, homoscedasticity, and outliers. A descriptive examination of all predictor variables was completed, including a detailed evaluation of new data from the follow-up questionnaire related to work and break hours, job satisfaction, and perceptions of supervisor and coworker support. The means and standard deviations were evaluated for each CBI item and subscale. In addition, Cronbach’s alpha coefficients were calculated to assure good reliability (i.e., Cronbach α > .80) of the personal, work-related, and client burnout scales. Last, histograms of personal, work-related, and client burnout were generated to visualize distributions of burnout among sonographers, and the strength of association among items and subscales was evaluated with the Pearson correlation coefficients. Work-related and personal burnout were highly correlated (r = .84); thus, regression modeling was only conducted to examine predictors of work-related and client burnout. In addition, to adequately examine all predictors of burnout, the regression models only included respondents who reported having both supervisors and coworkers.
Regression models using listwise deletion (i.e., removing a participant due to at least one variable with a missing response) led to the exclusion of up to 48.4% of all respondents. Variables with the highest rates of missingness included work pressure and performance (22.1%), taking work breaks (10.9%), Hispanic ethnicity (9.3%), work timing and pacing (8.3%), race (6.1%), and hours called back over the last 7 days (5.5%). Thus, a multiple imputation process was employed to generate full data sets to estimate inferential statistical parameters. An “imputation” is a set of plausible values for missing data, and multiple imputation generates multiple sets of plausible values for missing data. When using multiple imputations, a random sample of plausible values replaces all missing values and yields complete data sets. 32 Multiple imputation procedures remove sources of bias in parameter and standard error estimations resulting from non-responses.33,34 These procedures were completed with the multivariable imputation by chained equations package (mice) 35 in RStudio. A predictive mean matching method was applied, in which missing responses for individuals within a data set are imputed based on observed responses from individuals with similar patterns of responses across data set variables.36,37
There were 49 full data sets imputed based on the rule of thumb to impute a number of data sets equal to the percentage of incomplete cases, which included each of the predictors and outcome variables to reduce bias in models. 38 After 20 maximum iterations, 39 univariate and multivariable regression modeling were completed on each of the 49 full data sets to generate pooled estimates of model parameters using Rubin’s rules. 40 The strength and magnitude of univariate associations between each predictor variable and the work-related and client burnout scores were evaluated using the pooled estimates. Predictors below the significance threshold of P < .25 were carried forward into multiple linear regression models for work-related and client burnout using an enter method.41,42 In this step, estimates of model parameters pooled from the 49 imputed data sets were generated after running the same modeling procedures on each data set. The overall quality of multiple linear regression models was assessed by evaluating the proportion of explained variance in model R2 values. A significance threshold of P < .05 was applied to all final regression analyses. The stats and ggplot2 packages in R (RStudio, v2023.9.1.494) were used, as well as the psych package, 43 to calculate descriptive statistics, generate study figures, and complete regression modeling.
Results
Respondent and Work System Characteristics
After removing incomplete responses and excluded participants, 1389 survey responses were included in the analysis. Descriptive information for all predictor variables is included in Table 1. Being primarily white, non-Hispanic, and female, with an average age of 48.9 years, the respondents in this follow-up sample matched the demographics of the full-study registry. 22 The largest portion of sonographers in this data set came from the Southern and Midwestern United States (28.6% and 26.3%, respectively). Most respondents provided imaging services for outpatients or mixed inpatient and outpatient populations in hospitals, outpatient clinics, and physician’s offices, and the median number of work locations among respondents was two different sites. The most common types of exams conducted by respondents were vascular (53.3%), obstetrics and gynecology (52.1%), and abdominal (44.3%). The sample primarily constituted full-time employees who worked an average of 38.6 hours (standard deviation [SD] = 11.1) a week, including an average of 7.3 hours (SD = 20.0) of on-call time and 0.7 hours (SD = 2.7) of call-back time during the most recent work week. On average, respondents reported taking all their daily work breaks 65% of the time for a total of 2.8 hours (SD = 1.7) of break time per work week, equivalent to an average of 33.6 minutes per day during a 5-day work week.
Descriptive Characteristics of All Predictor Variables Within the Worker, Workplace, Work, and Health Categories Across the Participant Sample (N = 1389).
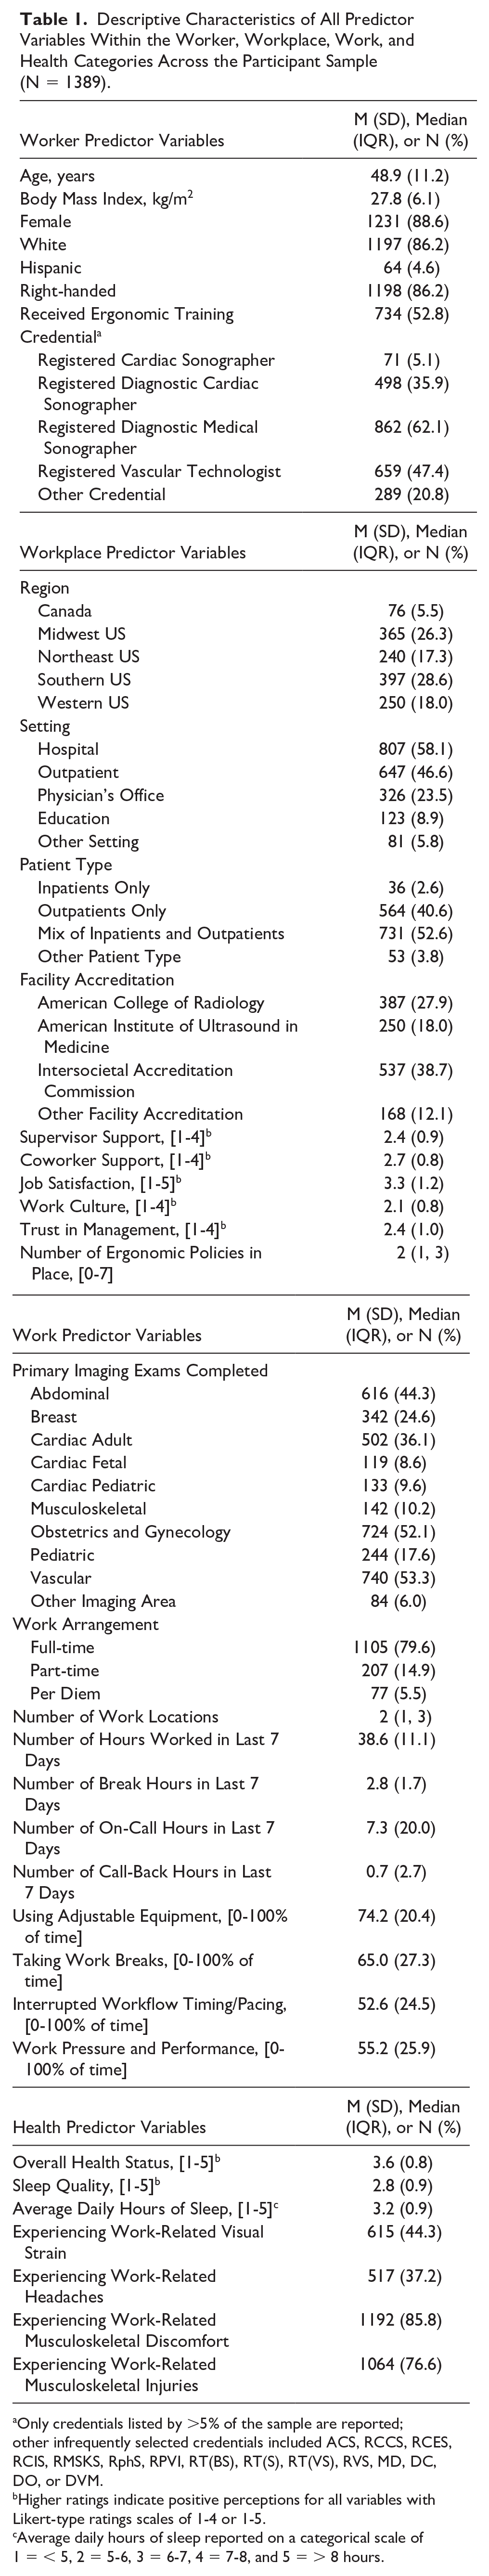
Only credentials listed by >5% of the sample are reported; other infrequently selected credentials included ACS, RCCS, RCES, RCIS, RMSKS, RphS, RPVI, RT(BS), RT(S), RT(VS), RVS, MD, DC, DO, or DVM.
Higher ratings indicate positive perceptions for all variables with Likert-type ratings scales of 1-4 or 1-5.
Average daily hours of sleep reported on a categorical scale of 1 = < 5, 2 = 5-6, 3 = 6-7, 4 = 7-8, and 5 = > 8 hours.
Average perceptions of the social and organizational structure within the workplace environment were normally distributed near the mid-points of each response scale. Ratings of work culture and trust in management fell slightly into the negative range of the scale (i.e., M = 2.1 and M = 2.4 out of 4, respectively), while average job satisfaction fell slightly into the positive half of the scale at 3.3 out of 5. Respondents indicated higher overall perceptions of coworker support than supervisor support (i.e., M = 2.7 vs. M = 2.4, respectively, out of 4). The density plot in Figure 1 displays an extrapolated and smoothed distribution of the within-respondent relationship of perceived coworker and supervisor support, showing the weak-to-moderate positive correlation between the two ratings (r = .35). This figure also illuminates a significant difference in the distributions of ratings between the two scales. Specifically, coworker support is proportionally distributed across the scale from low support (1) to high support (4), whereas supervisor support ratings are skewed more heavily to the low support end. For example, combinations of both low and high coworker support with low supervisor support are noted, but there are essentially no combinations of low coworker support with high supervisor support.
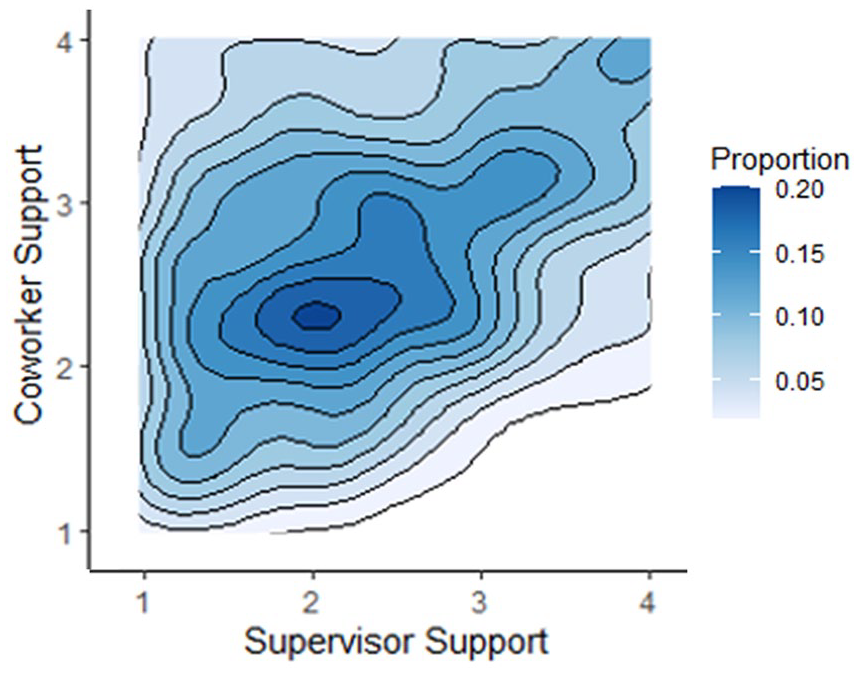
Proportional distribution of supervisor and coworker support (i.e., 1 low support to 4 high support) as rated by respondents who had both types of individuals in their primary workplace (n = 1243). Deeper shades of blue represent a higher proportion of respondents classified within a region of the density plot.
Respondent Health and Burnout
Sonographers in this follow-up sample had a prevalence of experiencing work-related musculoskeletal discomfort (85.8%), visual strain (44.3%), and headaches (37.2%) similar to all respondents in the study registry.22,23 The respondents’ overall health status was normally distributed around good to very good perceptions of health with an average rating of 3.6 (SD = 0.8, out of 5). Most participants indicated getting 6 to 7 hours of sleep per night, and the average rating of sleep quality fell between fair and good at an average of 2.8 (SD = 0.9, out of 5). All three burnout subscales had excellent internal reliability (Cronbach α > .90). The distribution of client burnout scores differed from the distribution of scores on the other two scales (Figure 2). On average, sonographers reported no-to-low levels of client burnout (M = 32.2, SD = 21.5), compared to moderate levels of personal (M = 54.4, SD = 20.6) and work-related burnout (M = 50.9, SD = 22.1), the latter two being highly correlated (i.e., r = .84). Descriptive statistics of the responses on each CBI item are provided in Table 2.
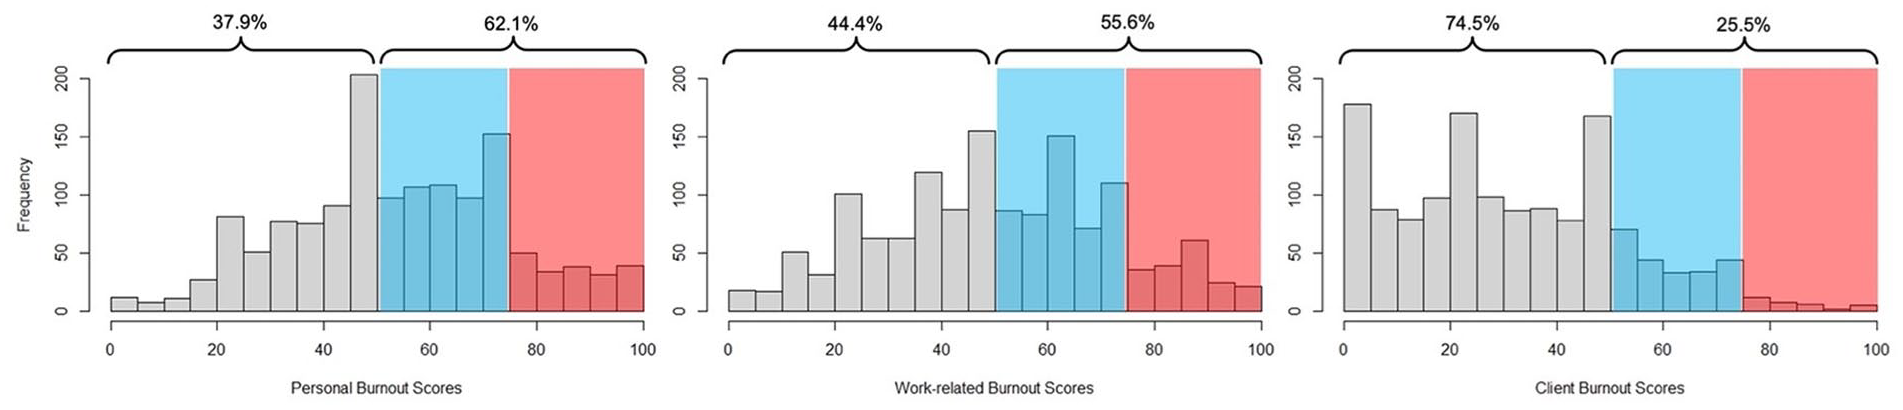
Distributions of personal, work-related, and client burnout scores grouped into bins per 5-point increments from 0 to 100 (n = 1389). The unshaded area (on the left side of each graph) indicates the proportion of scores interpreted as no-to-low burnout, and the blue and red shaded areas (on the right side of each graph) indicate the proportion of scores interpreted as moderate or high-to-severe burnout, respectively.
Sonographer Ratings of Personal, Work-Related, and Client Burnout on the Copenhagen Burnout Inventory, With Average Ratings on Individual Items Sorted From the Highest to Lowest Contributor to Overall Burnout Rating (N = 1389).
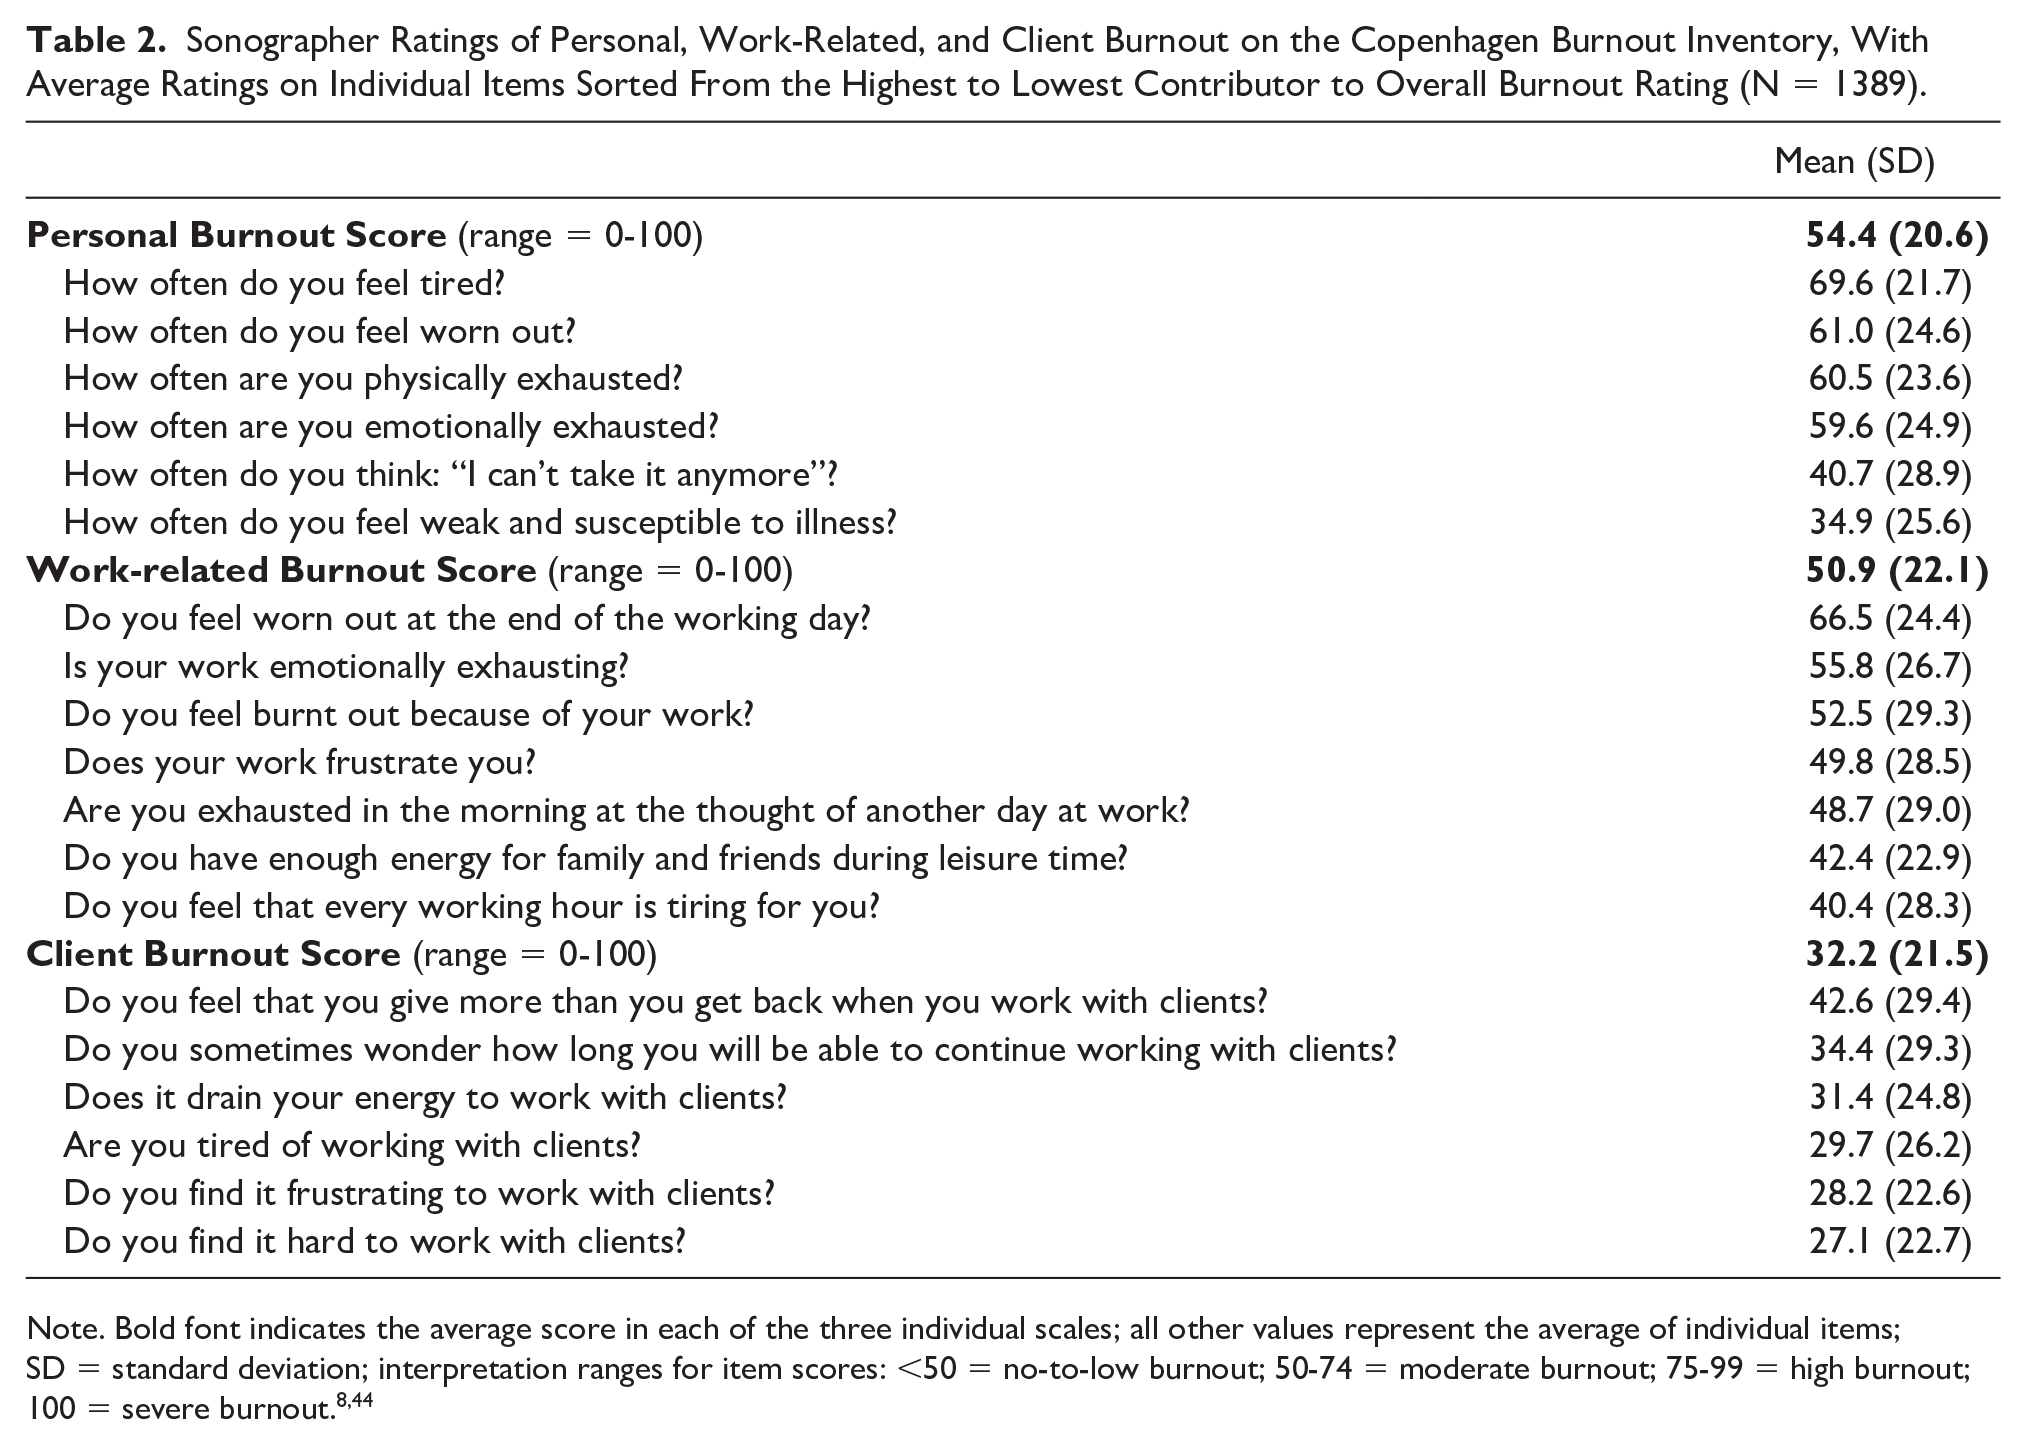
Note. Bold font indicates the average score in each of the three individual scales; all other values represent the average of individual items; SD = standard deviation; interpretation ranges for item scores: <50 = no-to-low burnout; 50-74 = moderate burnout; 75-99 = high burnout; 100 = severe burnout.8,44
Work System and Health Predictors Associated With Burnout
Work-related burnout
There were 34 variables included as predictors of work-related burnout in the multiple regression model that met inclusion criteria (P < .25) in the pooled univariable regression models (See Supplemental Appendix A). This set of predictors explained 51% of the variation in work-related burnout, and the unstandardized beta coefficients for each predictor variable are reported in Table 3. For every increase of 10 years in age, work-related burnout scores were likely to be lower by 3.1 points, and participants in the Western US were likely to have higher work-related burnout by 3.6 points than respondents from other regions. Work-related burnout was also 2.9 points higher among full-time workers, and scores decreased by 1.7 points for each additional hour of break time taken during a work week. For each improvement by one category in Likert-scale ratings of overall health, sleep quality, and supervisor support (e.g., fair to good, very good to excellent), the associated work-related burnout decreased by 3.9, 3.2, and 2.9, respectively. The largest relationship was noted with job satisfaction, where every 1-point improvement in the overall job satisfaction rating was associated with a reduced work-related burnout score by 8.8 points.
Work-Related Burnout: Pooled Multiple Regression Evaluating Associations Between Work System And Health Predictor Variables and Work-Related Burnout Across Imputed Data Sets (N = 1243).
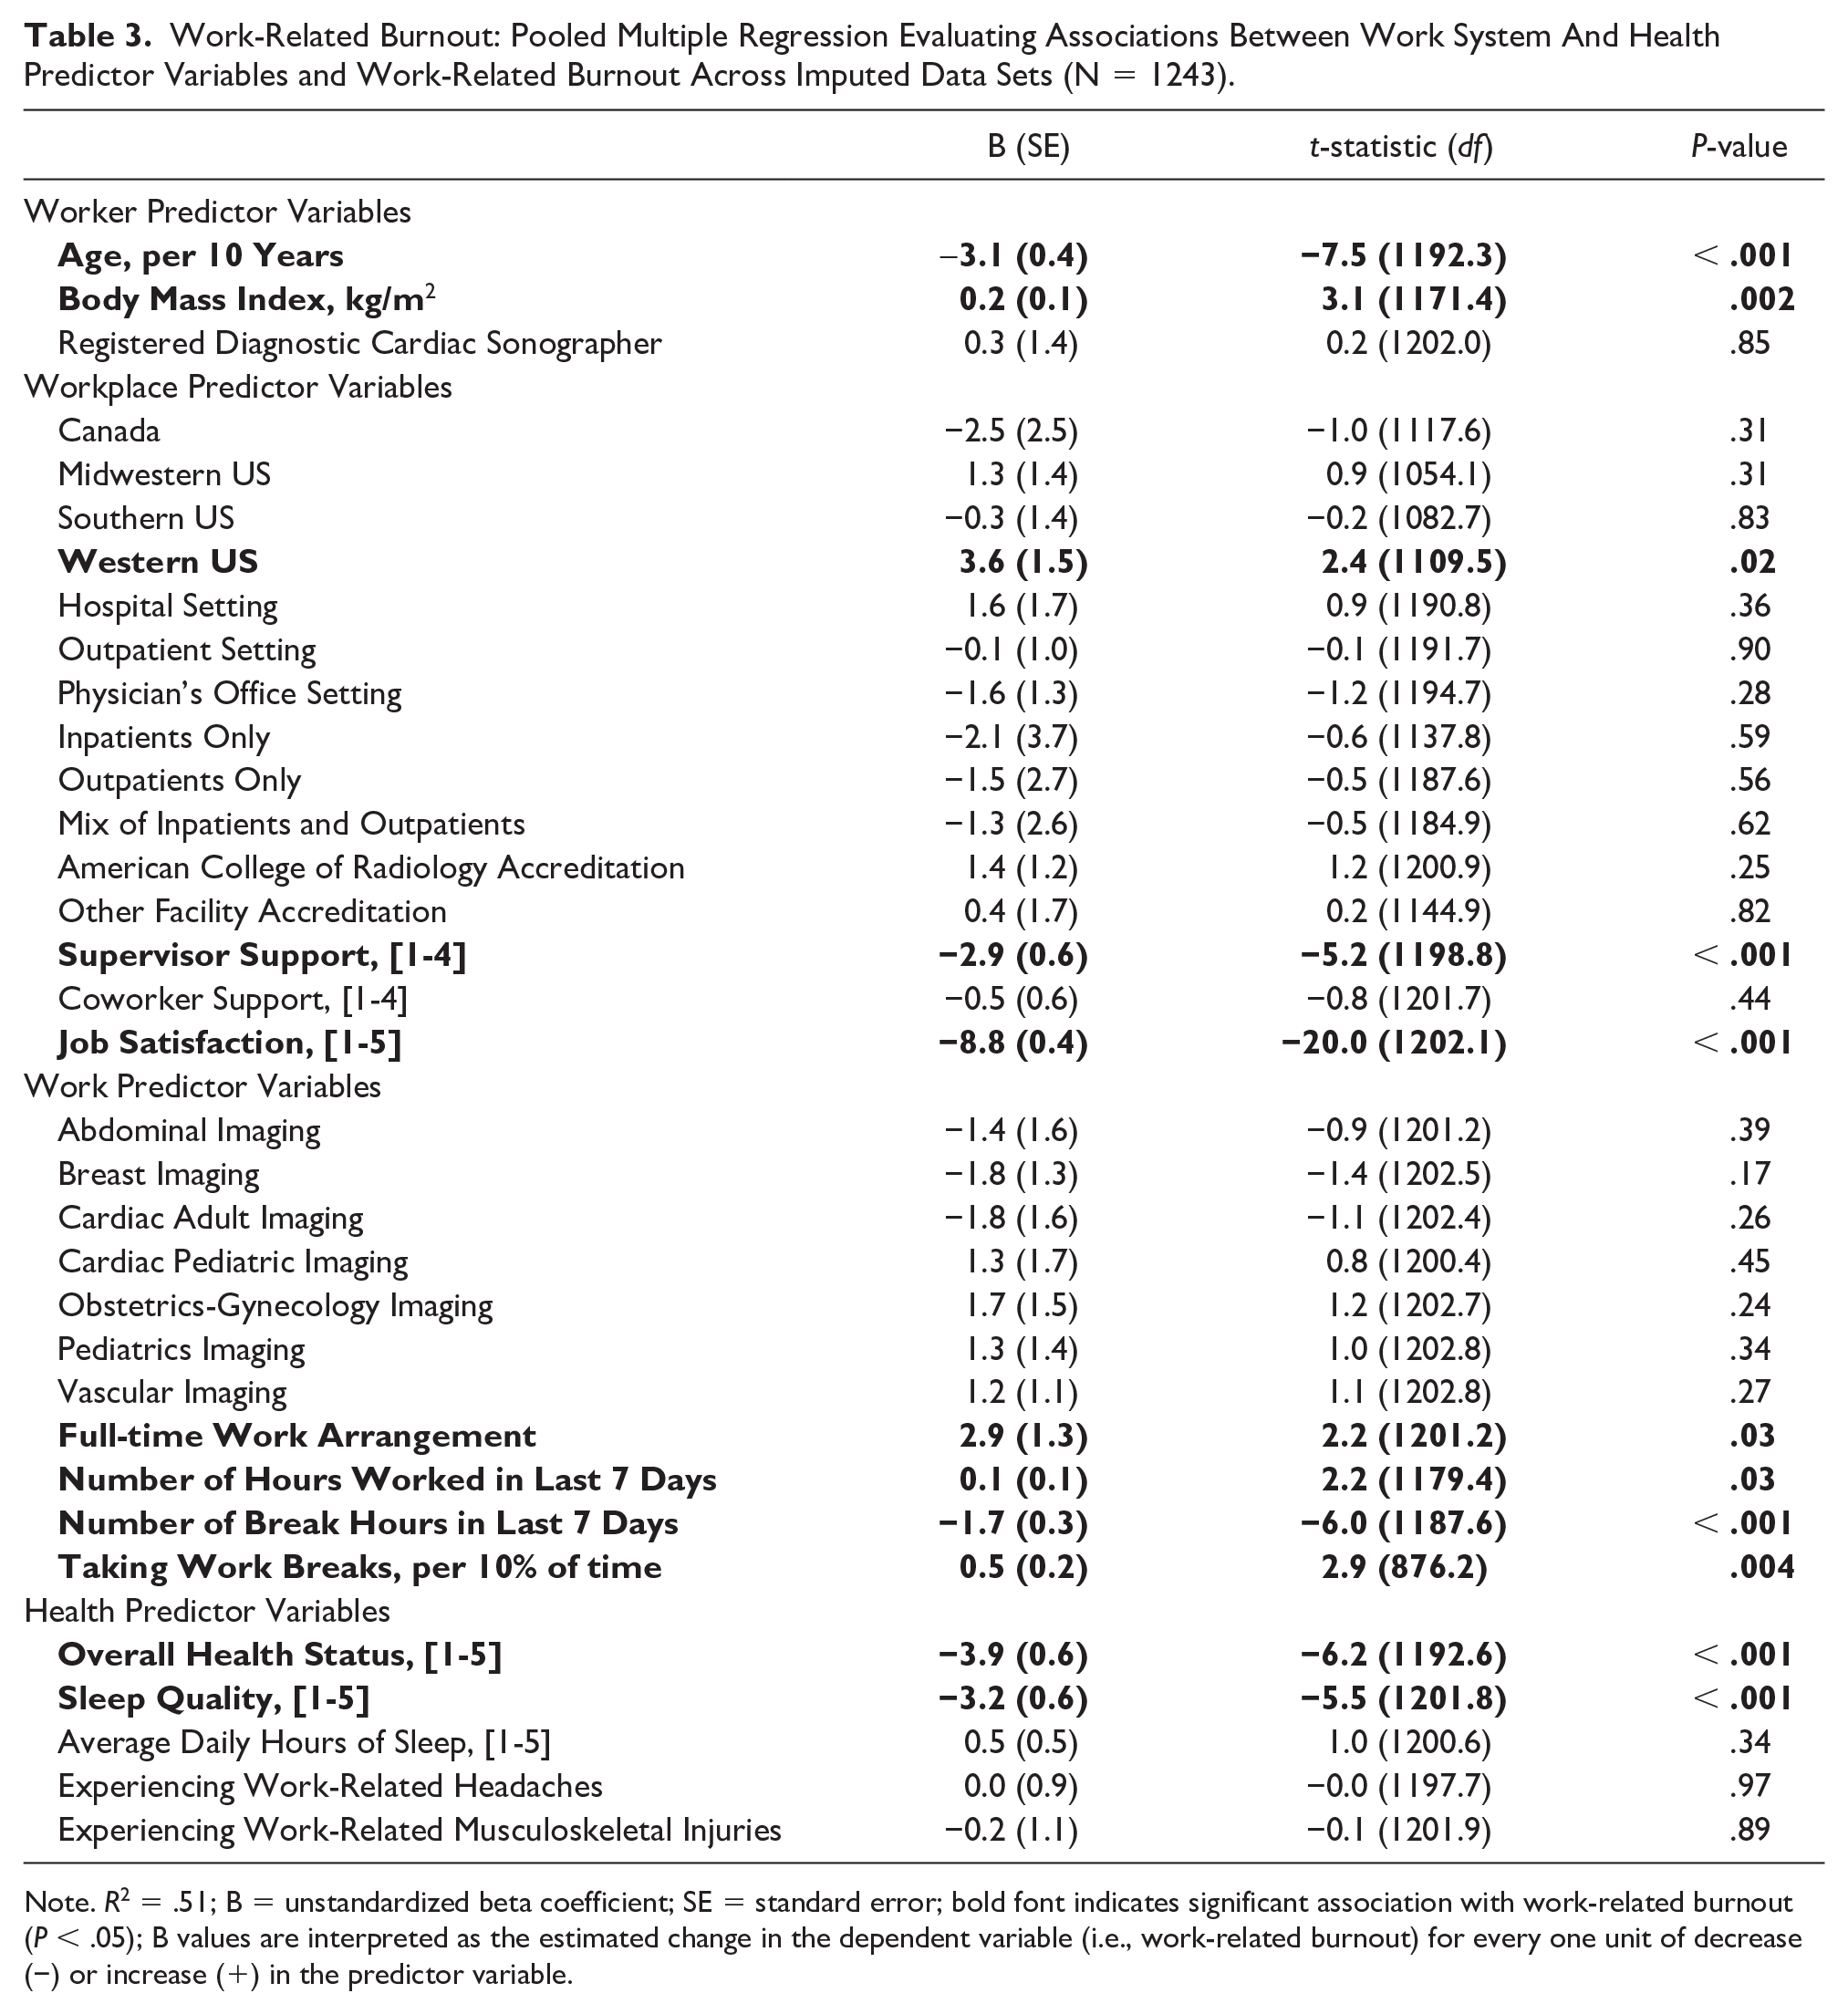
Note. R2 = .51; B = unstandardized beta coefficient; SE = standard error; bold font indicates significant association with work-related burnout (P < .05); B values are interpreted as the estimated change in the dependent variable (i.e., work-related burnout) for every one unit of decrease (−) or increase (+) in the predictor variable.
Client burnout
Although 32 variables met the univariable threshold for inclusion in the multiple regression model for client burnout, the final model only explained 25% of the variability in burnout scores. In this model, job satisfaction and sleep quality were the only predictors significantly associated with client burnout (Table 4). As with work-related burnout, higher job satisfaction and better sleep quality were associated with lower client burnout.
Client Burnout: Pooled Multiple Regression Evaluating Associations Between Work Systems and Health Predictor Variables and Client Burnout Across Imputed Data Sets (N = 1243).
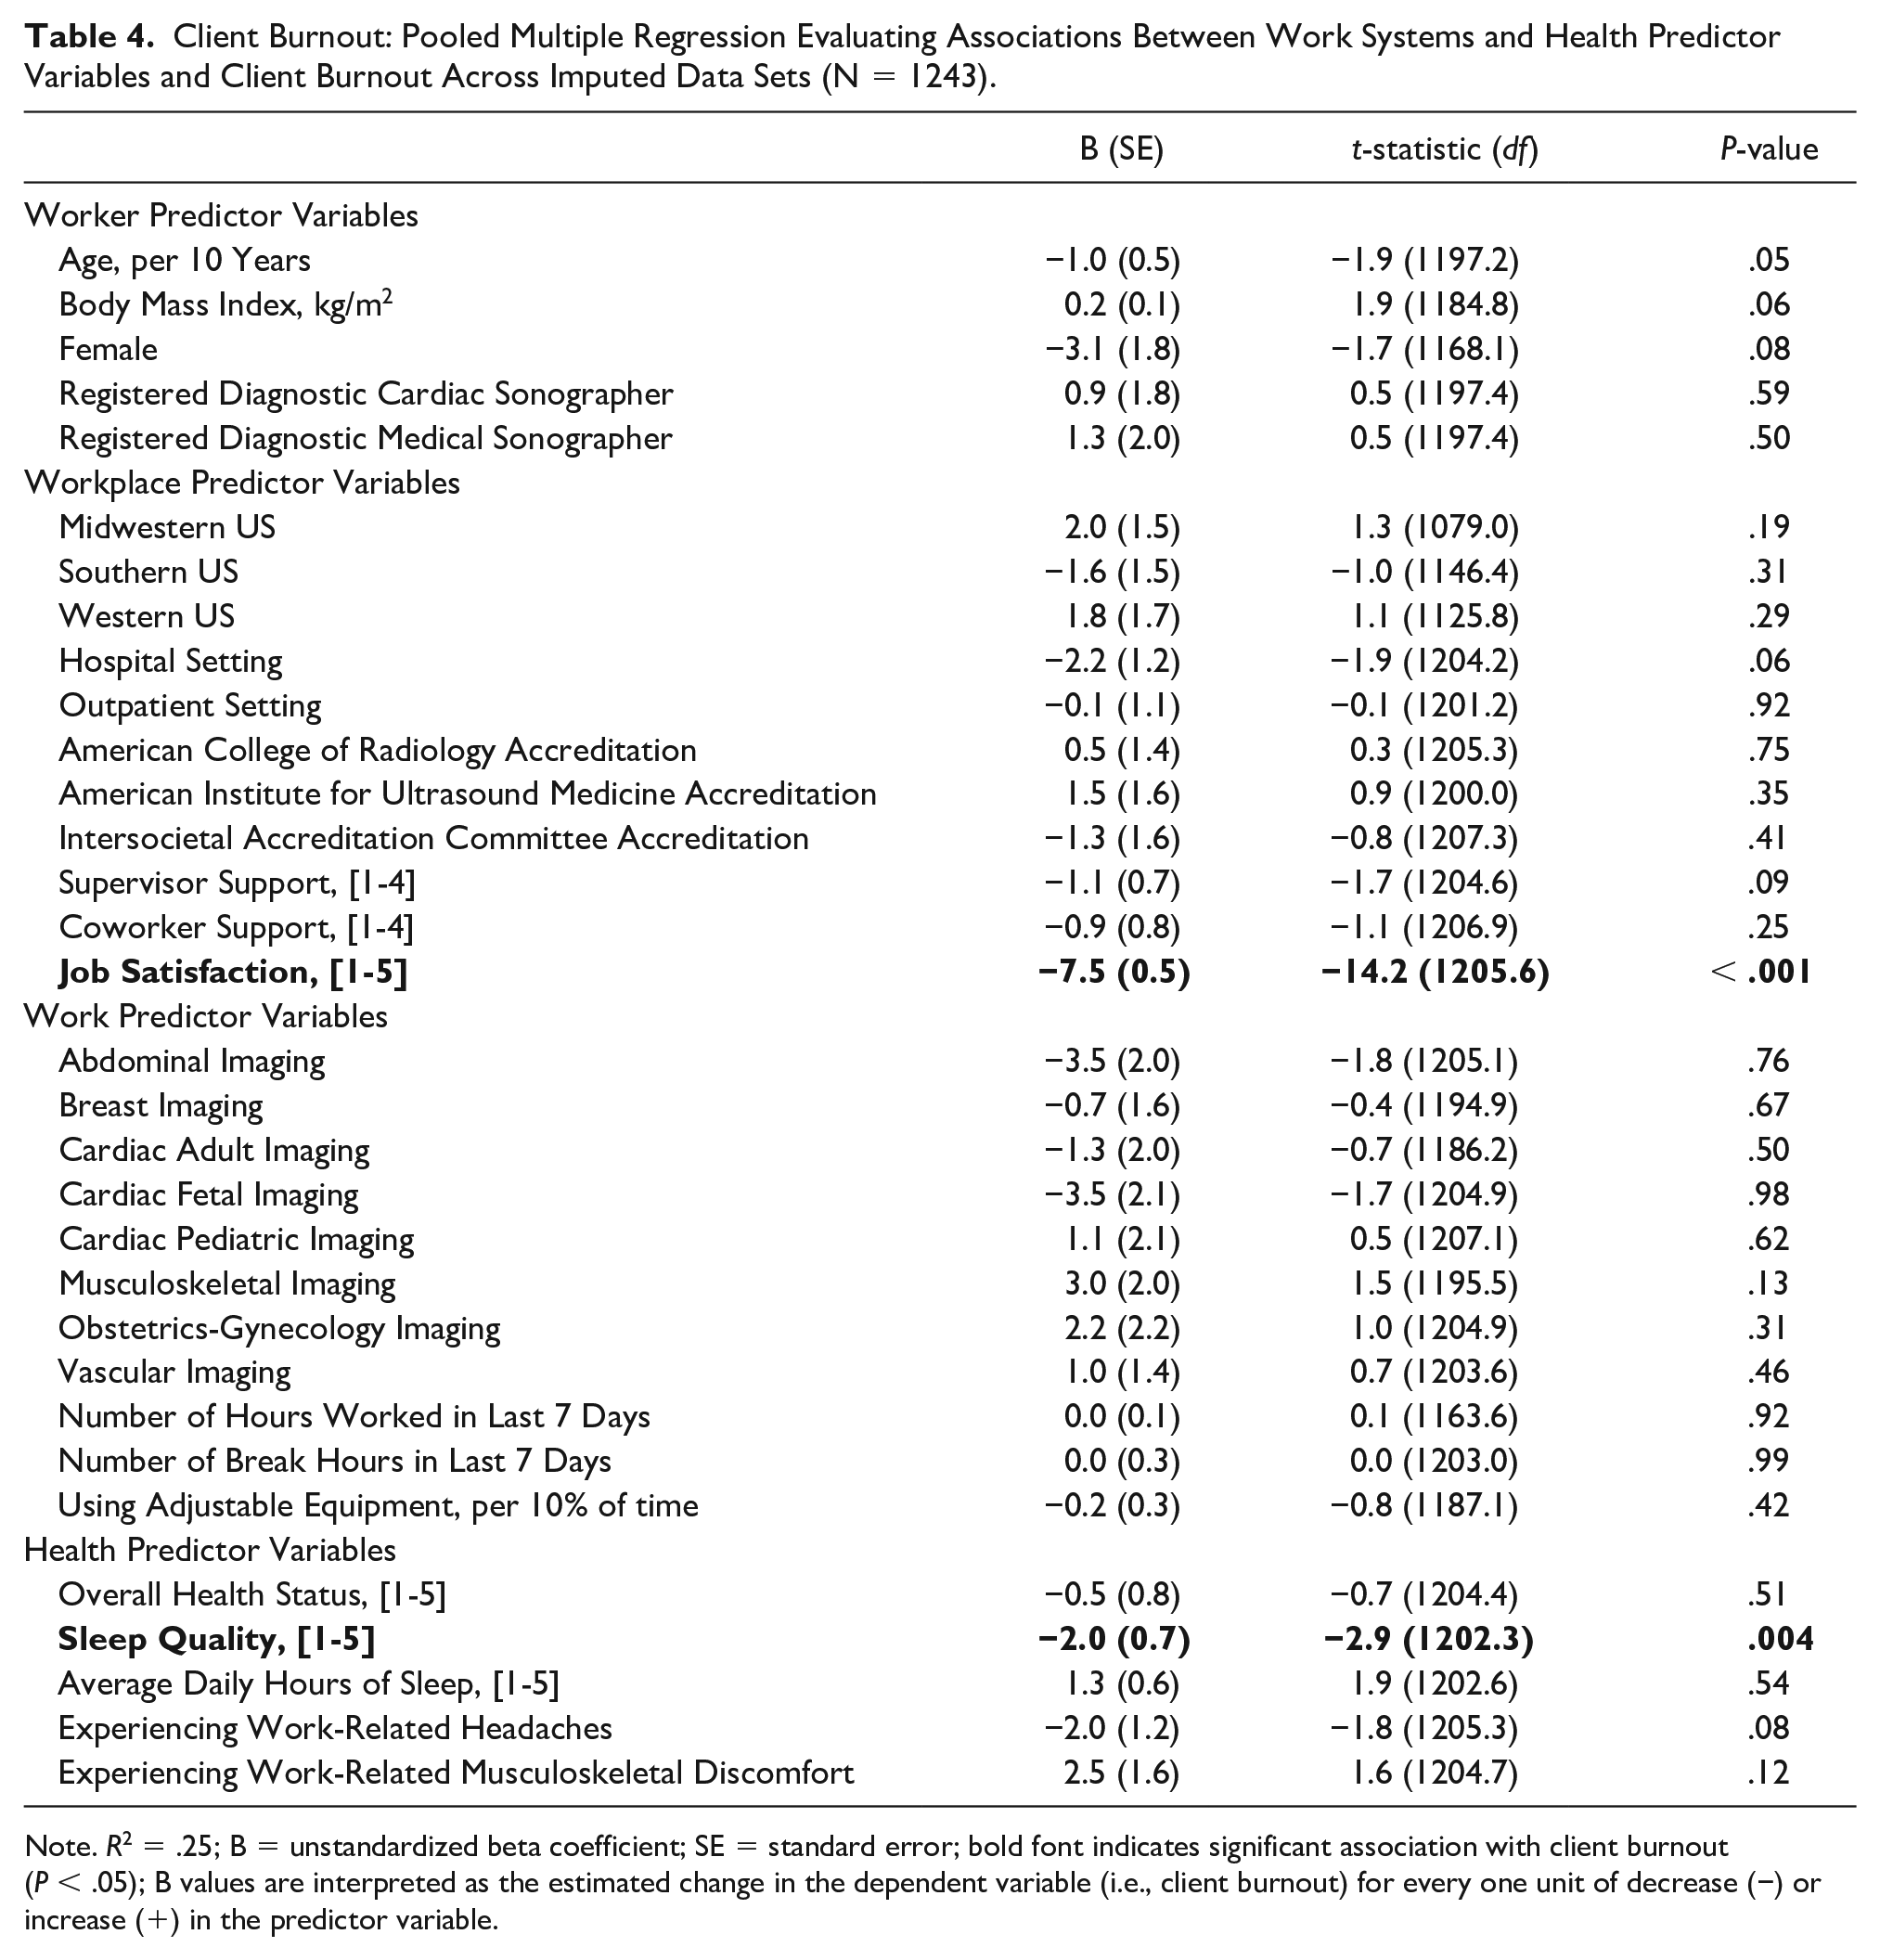
Note. R2 = .25; B = unstandardized beta coefficient; SE = standard error; bold font indicates significant association with client burnout (P < .05); B values are interpreted as the estimated change in the dependent variable (i.e., client burnout) for every one unit of decrease (−) or increase (+) in the predictor variable.
Discussion
The first aim was to describe the prevalence of burnout in a large sample of sonographers working in the United States and Canada. The second aim was to identify which Sonographer Work Systems factors were associated with burnout measured by the CBI, which focuses on fatigue and exhaustion in both a generic personal sense and those specifically related to work demands as core features of burnout. 8 The study results suggest addressing factors leading to work-related burnout as a higher priority than client burnout. Specific findings underscore intrapersonal and external factors (e.g., job satisfaction of individuals and supervisor support perceived within working units) most closely associated with work-related burnout and, thus, most proximal to reducing the prevalence and mitigating the impacts of burnout in the sonography workforce to improve health and care quality.
Personal burnout and work-related burnout were elevated in this sample of sonographers, with over half of the respondents reporting moderate-to-severe levels of burnout, while client burnout was elevated in only 26% of the sample. Personal burnout and work-related burnout were much higher than values reported from a 5-year study of workers in the human services sector. 8 Sonographers in this study were higher than all 15 human services sector work groups, including those in health care–related jobs, on personal and work-related burnout, and were similar to or higher on client burnout: home help (43.1, 41.8, 35.9), district nurse (38.4, 31.4, 25.3), associate nurses (37.9, 36.1, 31.4), nurses (36.9, 35.0, 29.7), and hospital doctors (36.6, 39.8, 26.7). Differences of five points or more are significant for the individual person, highlighting the notably higher scores for sonographers in personal burnout and work-related burnout in this study. 8 Sonographer burnout scores were similar to those reported in a study of senior-level doctors and dentists in New Zealand, where mean levels of personal burnout and work-related burnout also exceeded 50% in two medical specialties of pathology and emergency medicine. 45 Similar to this study, in the New Zealand study, researchers found a relationship between poorer health status and higher levels of personal and work-related burnout.
Numerous work systems factors were associated with work-related burnout in this cohort that were similar to other previous reports. In a pre-pandemic literature review among Australasian sonographers, burnout was attributed to increased workload (e.g., overtime, increasing numbers of scans per week, on-call duties). 45 Certainly, factors related to work demand increased globally as sonography workers grappled with caring for patients during the pandemic, and likely resulted in some leaving the workforce for respite. Given the consistent associations between workload and burnout, supervisors and managers should carefully review how work is assigned and completed. Improvements in work assignments, breaks, and scanning protocols are all within the supervisor and managers’ purview. Based on the cohort study by Bagley et al., 19 work-related musculoskeletal pain was a predictor of occupational burnout. Physical pain and discomfort are linked to the health of workers and the ability to execute their assigned work comfortably. This study also identified weekly break hours, poorer overall health, and sleep quality as associated with burnout.
In this study, the model of variables associated with client burnout accounted for a notably lower explanatory result than the work-related burnout model (i.e., R2 values of .25 vs .51, respectively). These findings suggest that researchers and practitioners may consider studying factors related to interpersonal aspects of burnout resulting from working with patients, such as persistent adverse experiences with harassment or bullying, as more salient predictors of client burnout. Moreover, there is a need for future research to consider the associations among various work systems factors, interpersonal sonographer-patient factors, and levels of work- and client-related burnout with performance outcomes, such as study completion, imaging quality, and misdiagnoses or missed diagnoses.
Regarding readily modifiable aspects of the sonographer work environment, this study generated strong evidence of associations between higher work-related burnout and more working hours, fewer work breaks, lower perceived supervisor support, and lower job satisfaction. Unraveling complex and longitudinal relationships among modifiable aspects of the sonographer work environment by studying and ultimately intervening in schedule, culture, climate, and employee wellness concerns could be a meaningful next step for administrators, sonographers, and researchers to reduce work-related burnout.20,21,46 In particular, Callpani and colleagues 46 identify a potential role for mindfulness programming to mitigate sonographer stress and burnout. This combined evidence underscores the importance of promoting Total Worker Health® within sonography departments. This goes beyond the individual worker and requires the supervisor and manager to be actively engaged in emphasizing the importance of physical and cognitive well-being to mitigate the deleterious effects of burnout. This also can mitigate important factors identified, such as lower perceived supervisor support and lower job satisfaction. Participatory approaches that engage each of these stakeholder groups in developing meaningful organizational and health solutions for sonographers may be desirable.
Limitations
This study has some limitations, including that the study participants self-selected into the study. In addition, the study is cross-sectional in design, meaning that associations between study variables can only be identified as existing, but causality cannot be determined. With regard to the analysis, multiple imputation methods were applied to generate final analytic models for the study. While it was possible to simulate and approximate full data sets of responses, this study’s data were missing at random, rather than missing completely at random. Thus, some unexplained non-random variance in the patterns of missingness may have influenced the quality of model parameters. Finally, the analysis depended on participants self-rating their levels of burnout and health, which may also be tied to having worked through the pandemic. The pandemic impacted burnout across the healthcare workforce, and these impacts have lingering effects on the post-pandemic health and well-being of the healthcare workforce.
Conclusion
This large cohort study provides new evidence of the detrimental effects of burnout among sonographers working in the United States and Canada. Specifically, this survey research provides specific work system factors across the worker, work, and workplace levels associated with this cohort’s levels of burnout. This work suggests that clients (patients) are not the primary source of occupational burnout in sonographers, but rather related to the work system elements within management’s control. To stabilize this vital health care workforce, mitigation strategies are needed, and collaboration among workers, administrators, and organizations is required to address this important worker health issue. Creating a workplace that allows for a participatory set of solutions that address worker health and well-being is vital to maintaining a highly skilled workforce.
Supplemental Material
sj-docx-1-jdm-10.1177_87564793241254843 – Supplemental material for Work Systems Factors Associated With Burnout in Sonographers Working in the United States and Canada
Supplemental material, sj-docx-1-jdm-10.1177_87564793241254843 for Work Systems Factors Associated With Burnout in Sonographers Working in the United States and Canada by Ryan J. Walsh, Kevin D. Evans, Carolyn M. Sommerich and Shawn C. Roll in Journal of Diagnostic Medical Sonography
Footnotes
Acknowledgements
The authors thank all participants who volunteered their time and energy to the study, and Yoko Ellie Fukumura and Tanmay Khese at the University of Southern California for their analytic feedback and help with managing project data.
Ethics Approval
Ethical approval for this study was obtained from The Ohio State University’s Institutional Review Board (IRB#: 2021B0113).
Informed Consent
Written informed consent was obtained from all subjects before the study.
Animal Welfare
Guidelines for humane animal treatment did not apply to the present study because no animals were used during the study.
Trial Registration
Not applicable.
Declaration of Conflicting Interests
The authors declared no potential conflicts of interest with respect to the research, authorship, and/or publication of this article.
Funding
The authors disclosed receipt of the following financial support for the research, authorship, and/or publication of this article: Financial support for this study has been provided by the following members of the WRMSD Grand Challenge Alliance with additional financial support from Biodex, part of Mirion Technologies: American Institute of Ultrasound in Medicine, American Registry for Diagnostic Medical Sonography and Inteleos, American Society of Echocardiography, Intersocietal Accreditation Commission, Joint Review Committee on Education in Cardiovascular Technology, Society for Vascular Ultrasound, Society of Diagnostic Medical Sonography, and Society of Diagnostic Medical Sonography Foundation. RJW received training and support from the National Institutes of Health NICHD/NCMRR ReproRehab program (R25 HD105583) to develop and implement the data analysis plan. The views presented in this study are the authors’ and do not necessarily represent those of the NIH or other supporting organizations.
Peer Reviewer Guarantee Statement
The Editor / Associate Editor of JDMS is an author of this article; therefore, the peer review process was managed by alternative members of the Board and the submitting Editor / Associate Editor had no involvement in the decision-making process.
References
Supplementary Material
Please find the following supplemental material available below.
For Open Access articles published under a Creative Commons License, all supplemental material carries the same license as the article it is associated with.
For non-Open Access articles published, all supplemental material carries a non-exclusive license, and permission requests for re-use of supplemental material or any part of supplemental material shall be sent directly to the copyright owner as specified in the copyright notice associated with the article.