
Abstract
Objective:
Diabetes mellitus (DM) and hypertension are among the most common causes of arteriosclerotic diseases. Intima-media thickness is usually increased with arterial diseases and an increase in carotid intima-media thickness (cIMT) is associated with the presence and extent of coronary artery disease (CAD). This study was designed to sonographically compare the cIMT in hypertensive and DM patient volunteers.
Materials and Methods:
A case-control stratified study was conducted at Lahore imaging center. Patients were invited to the study had to more than 30 years of age, DM, and hypertension. Individuals from the same age group without hypertension and DM were invited as study controls. Patients with an endarterectomy, or other arterial interventional procedure, as well as a previous history of cardiovascular disease and stroke, were excluded.
Results:
The mean cIMT, within the right carotid artery was 0.53 mm for the control group, 0.69 mm for the DM group, 0.67 mm for the hypertensive group, and 0.98 mm for the DM and hypertensive patients. The mean cIMT of the left carotid artery was 0.56 mm for the control group, 0.7 mm for DM group, 0.68 mm for hypertensive group, and 1.01 mm for the DM and hypertensive patients.
Conclusion:
There was a significant difference between the mean cIMT among DM and non-DM individuals. The control group and the DM or hypertension group also differed significantly. However, a more significant difference was found in the mean cIMT within the common carotid artery of control group as well as those with both DM and hypertension.
Globally, hypertension, and diabetes are the leading causes and important contributors to the development of cardiovascular disorders. Hypertension (high blood pressure readings) is connected to a higher likelihood of heart disease, kidney disease, and death. 1 According to a survey in Pakistan, hypertension affects 18% of individuals and 33% of persons over 45 years old. 2 Heart disease and stroke risk are directly connected with hypertension. Other than this, its consequences can include peripheral vascular disease, renal impairment, retinal hemorrhage, and visual impairment. 3 Some hypertensive patients report headaches, dizziness, vertigo, blurred vision, or fainting spells. 4
Diabetes is generally the third leading cause of mortality worldwide, after smoking and hypertension. Diabetes mellitus (DM) is a chronic disorder that is caused when the pancreas becomes incompetent to make sufficient insulin or the body is incompetent to use or absorb insulin properly. As a result, hyperglycemia, or high blood glucose levels, cause tissue damage in the long run. Diabetes mellitus falls into two main categories: type 1 and type 2. 5
Type 1 DM is characterized by the persistent autoimmune destruction of islet beta cells because of the intricate interplay between hereditary and environmental variables, culminating in insulin insufficiency; 5% to 10% of people with diabetes have this kind of diabetes. 6 Global diabetes prevalence was 9.3% (463 million people) in 2019. By 2030, that number is anticipated to rise to 578 million (10.2%), and by 2045, it will reach 700 million (10.9%). 7 In type 2 DM (T2DM), blood sugar levels are above the normal range as a result of improper insulin utilization by the body. T2DM is reportedly 11.77% prevalent in Pakistan. The frequency is 11.20% in men and 9.19% in women. 8 T2DM impacted roughly 462 million people in 2017, accounting for 6.28% of the world’s population. 9 Moreover, diabetes is associated with microvascular and macrovascular consequences which are extremely distressing for patients and caregivers alike and place a significant cost on medical systems. 10
Diabetes mellitus and hypertension, two chronic conditions, affect a substantial percentage of the population. The reciprocity of these two disorders occurs more frequently than each condition individually. 11 Those with T2DM have an up to three-fold greater incidence of hypertension than individuals without T2DM. In addition, individuals with hypertension seem to be more likely to experience insulin resistance and DM. 12 Both disorders are autonomous risk factors for cardiovascular disease (CVD), and when they exist together, the ailment and fatality rate from cardiovascular events are multiplied. 13 Even though their mechanism varies, they share risk variables, such as excessive alcohol use, inactivity, obesity, genetic predispositions, and above the age of 50 years. 14
The intima-media thickness serves as a sonographic measure for the assessment of subclinical atherosclerosis and vascular dysfunction. Increased intima-media thickness in the common carotid arteries is a validated significant prognostic marker for the early stages of endothelial dysfunction and is associated with cardiovascular events. In addition, it has a connection to the establishment of CVD. 15 Males appear to have larger intima-media thickness values than females do in the common carotid arteries. Furthermore, African Americans have greater values than Caucasians. In general, the mean carotid intima-media thickness (cIMT) was considered to have an upper limit of normal between 0.59 and 0.95 mm in males and 0.52 and 0.93 mm in females. 16 Age, race, possible risk intensity, segmentation, echogenicity, measuring methodology, and sonography are additional variables that affect values. 17 High-resolution grayscale sonography is a noninvasive, quick, secure, affordable, accurate, and consistent tool that can assess and quantify adaptable vascular changes, such as atherosclerosis development and arterial wall thickness. The cIMT may be accurately quantified with sonography. 18
Vascular diseases are usually generalized in nature. The most common vascular disease is atherosclerosis. Hypertension and DM are among the most common causes of arteriosclerotic diseases. Intima-media thickness is usually increased with arterial diseases and an increase in cIMT is associated with the presence and extent of coronary artery disease (CAD). Intima-media thickness could easily be evaluated in the common carotid arteries with grayscale sonography. However, the association of cIMT with hypertension and DM was the intended focus of this study.
Materials and Methods
A case-control stratified study was conducted at a Lahore imaging clinic. The study was conducted after gaining approval from the institutional review board (IRB# 962). The sample size was calculated at a 95 % level of confidence for four strata and a 5% margin of error. Stratum 1 for normal, stratum 2 for DM, stratum 3 was hypertension and stratum 4 was DM and hypertension. The proportions of each stratum were 19 :
Normal/control subjects = 0.50
DM subjects = 0.233
Hypertensive subjects = 0.488
DM and hypertensive subjects = 0.278
A total of 337 (96 control, 69 DM, 95 hypertensive, and 77 DM and hypertensive) subjects were randomly consented to this study.
Patients, who were more than 30 years of age were intentionally recruited for the study. Likewise, patients with certain DM and hypertension, and those from the same age group without hypertension and DM were selected. Patients were excluded that had undergone endarterectomy or other arterial interventional procedures. In addition, patients with a known history of CVD and stroke were also excluded from the study.
With the patient supine and their neck turned to the other side of the examination, intima-media thickness measures were taken. The cIMT examination was performed by a trained ultrasonographer, using a standardized protocol. The examination was conducting using a Xario ultrasound equipment system (Cannon Medical Systems, USA) and linear transducer with a frequency of 7 to 12 MHz This study used various transducer orientations to investigate the common carotid arteries in the long axis. An anterior, lateral, or posterolateral technique was used, based on which best displayed the vessels, to acquire the short-axis (transverse) image of the carotid artery. Sonographic images of the far wall of the common carotid artery were taken in the longitudinal direction at a spot 1 cm from the carotid bulb. In the thickest region of every vessel, the adjacent and far walls, at least three cIMT spots were recorded. To improve arterial wall structures and pixel density, optimal grayscale parameters for gain, depth, focus zone location, and compression were made for every vessel separately. Carotid intima-media thickness was quantified manually with the use of the ultrasound equipment system’s electronic calipers.
Statistical Analysis
The analysis of data depended on a descriptive analysis of the comparison of the right and left cIMT. A Kruskal-Wallis H test was also applied as the assumption of normality was not achieved. The Wilcoxon signed-rank test was applied to check the median difference in right and left cIMT, in all the groups.
Results
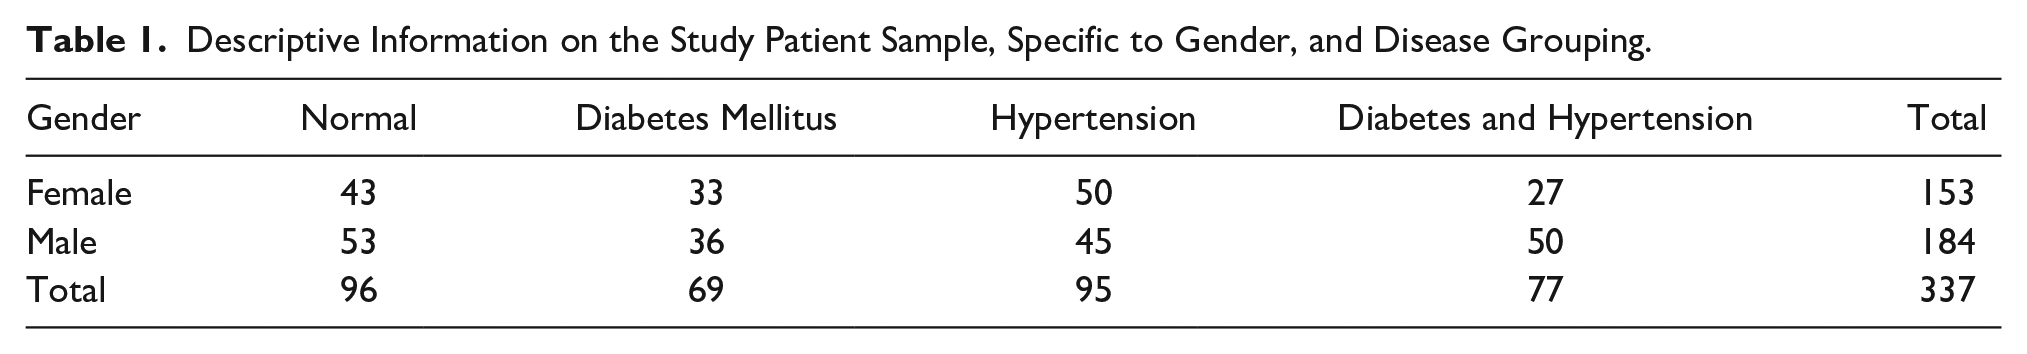
The sample size for this study was 337, of which 153 were females and 184 were males. There were four groups in this study and were labeled as follows: control (A group), DM (B group), hypertensive (C group), and DM and hypertensive (D group), with sample sizes 96, 69, 95, and 77, respectively. There were 43 females and 53 males in the A group. Of 69, 33 were females and 36 were males in the B group. In the C group, 95 patients were included of which 50 were females and 45 were males. The D group consists of a total of 77 patients with 27 females and 50 males (see Table 1).
Descriptive Information on the Study Patient Sample, Specific to Gender, and Disease Grouping.
This research was based on 337 patients who consented to the study. The patients’ average age was 49.89 ± 11.70 years. The minimum age of the patient was 31 years, and the maximal age of the patient was 80 years. In this investigation, 96 healthy control patients were enrolled. The ages of the patients in the A group varied from 31 to 68, with a mean age of 43.89 ± 10.01 years. The mean age of the patients in the B group was 49.08 ± 10.46 years. The youngest was 31 years old and the oldest was 70 years old. In the C group, the mean age of the patients was 50.81 ± 11.88years with the lowest age of 31 years and the highest age of 79 years. The D group patients ranged in age from 38 to 80 years old. The mean age of the patients in the group was 56.96 ± 10.46 (see Table 2).
Descriptive Information on the Study Patient Sample, Specific to Age, and Disease Grouping.
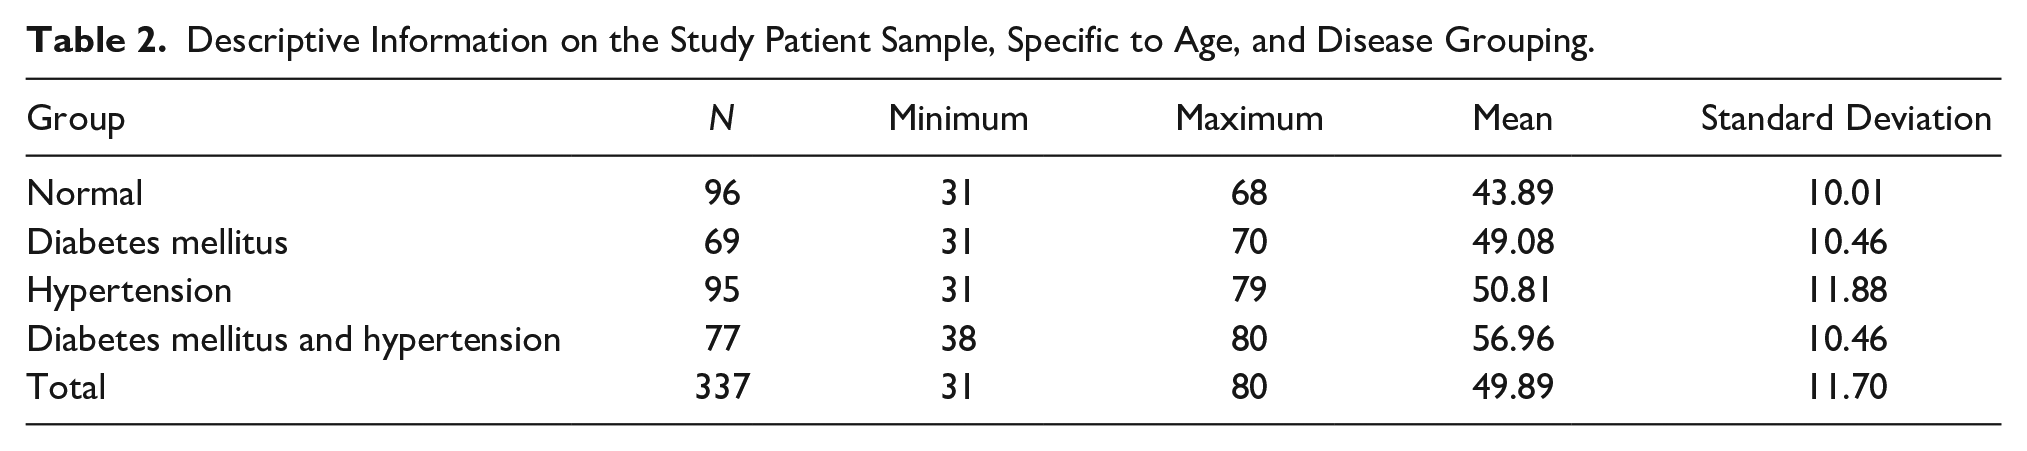
Table 3 indicates the comparison of cIMT of right and left carotid arteries between the A, B, C, and D groups. The mean cIMT of the carotid artery in the A group (see Figure 1) on the right side was 0.52 ± 0.08 mm with a minimum value of 0.4 mm and a maximum value of 0.69 mm. The mean cIMT of the left carotid artery in the A group was 0.55 ± 0.09 mm with the lowest value of 0.4 mm and the highest value of 0.75 mm. In the B group, the mean cIMT of the right carotid artery was 0.68 ± 0.08 mm with a minimum cIMT of 0.5 mm and maximum cIMT of 0.93 mm. The mean cIMT of the left carotid artery was 0.70 ± 0.08. The minimum and maximum values of the carotid artery on the left side were 0.55 and 0.98 mm, respectively. The mean cIMT of the right carotid artery in the C group was 0.67 ± 0.07 mm and the mean cIMT of the left carotid artery was 0.68 ± 0.09 mm. In the C group, the minimum and maximum cIMT of the right carotid artery were 0.51 and 0.84 mm, respectively, and in the left carotid arteries, the minimum cIMT was 0.5 mm, and the maximum cIMT was 1.15 mm. The mean cIMT of carotid arteries in the D group (see Figure 2) on the right side was 0.98 ± 19 mm and on the left side was 1.00 ± 0.21 mm. The minimum cIMT of the carotid artery on the right side was 0.77 mm and on the left side was 0.7 mm. The maximum value of cIMT of the carotid artery on the right side was 1.57 mm and on the left side was 1.6 mm.
The Descriptive Statistics of the Intimal Thickness (IMT) Measured Within the Right and Left Carotid Arteries.
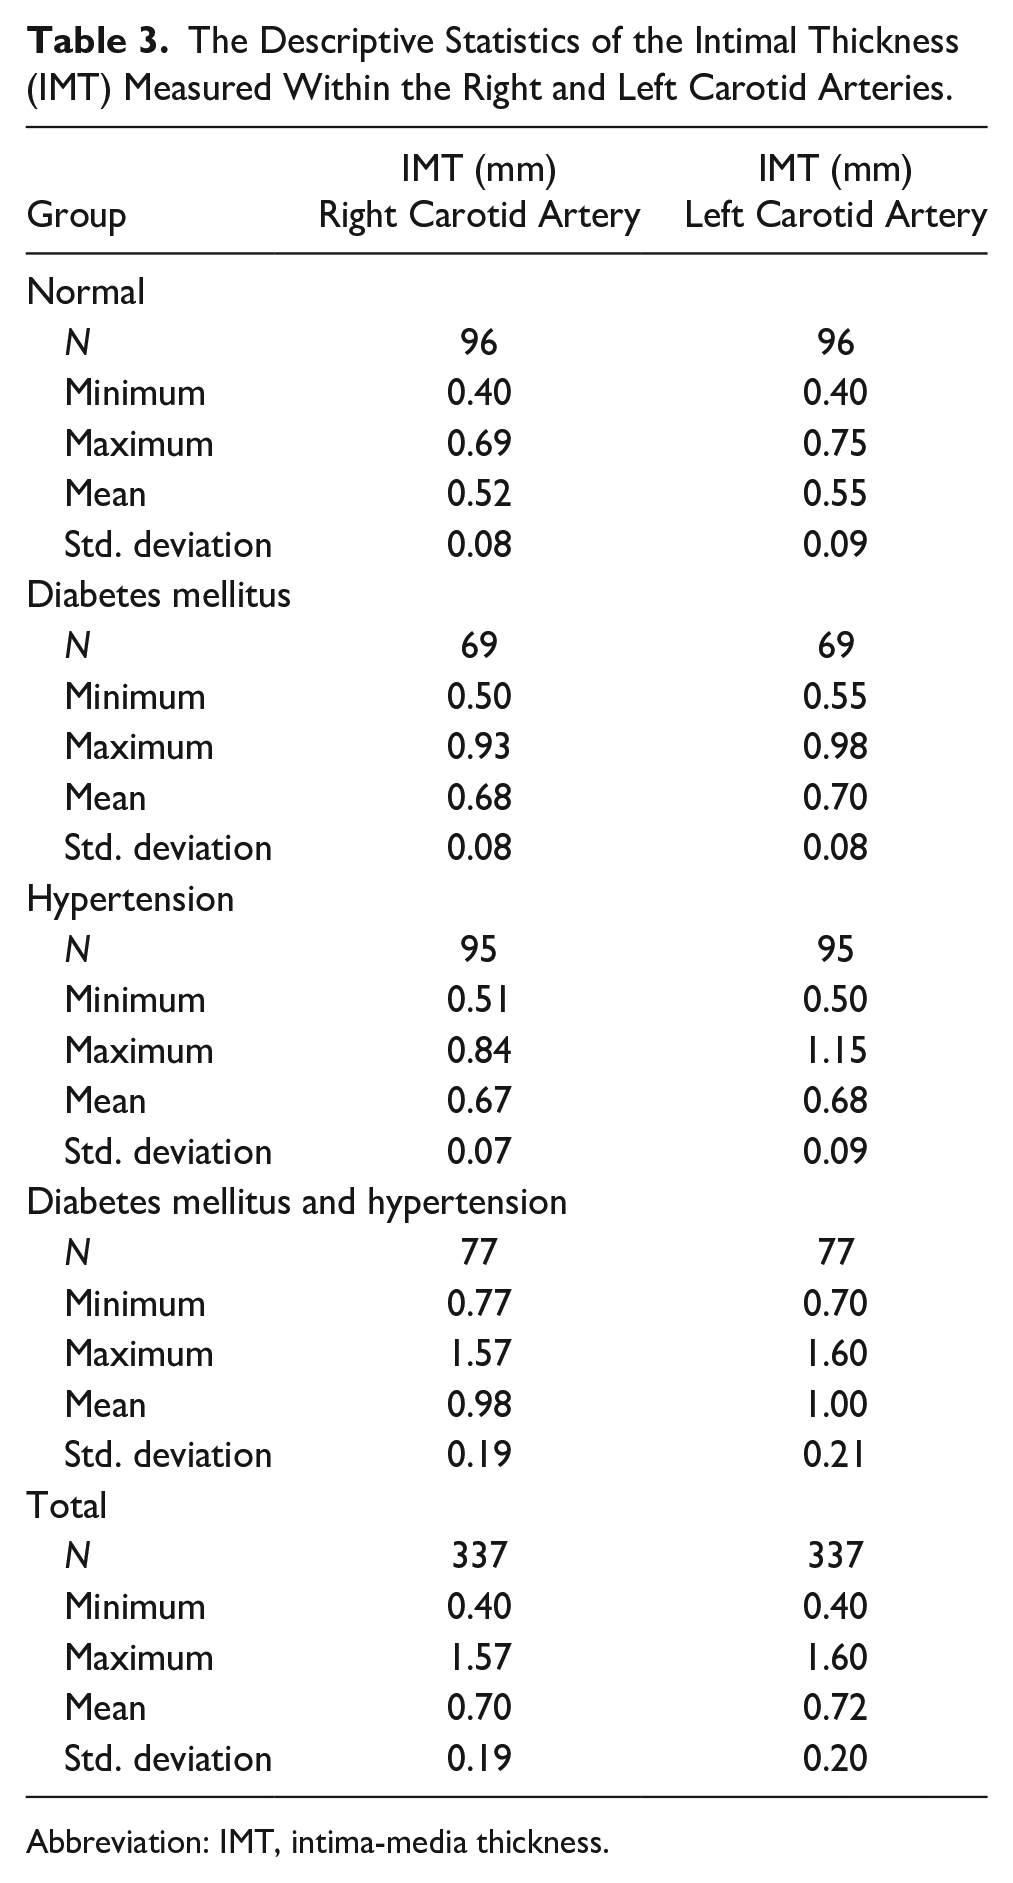
Abbreviation: IMT, intima-media thickness.
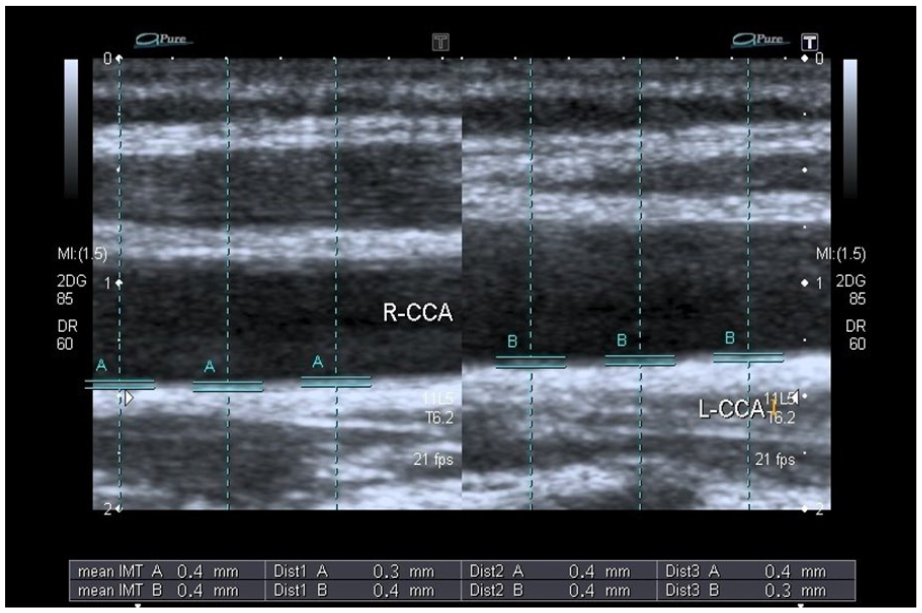
The right and left carotid intimal thickness measured in a normal patient.
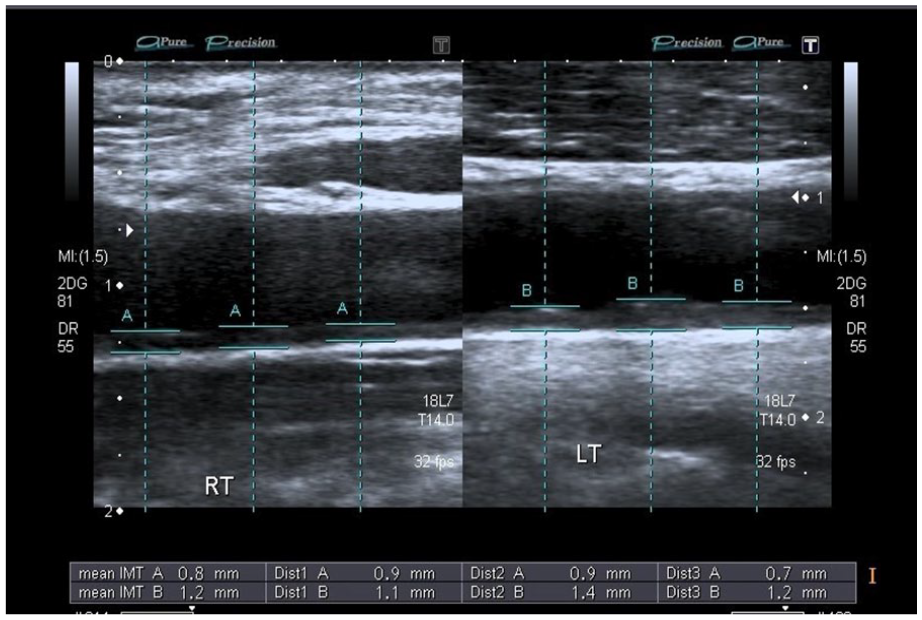
The right and left carotid intimal thickness measured in a hypertensive and diabetic patient.
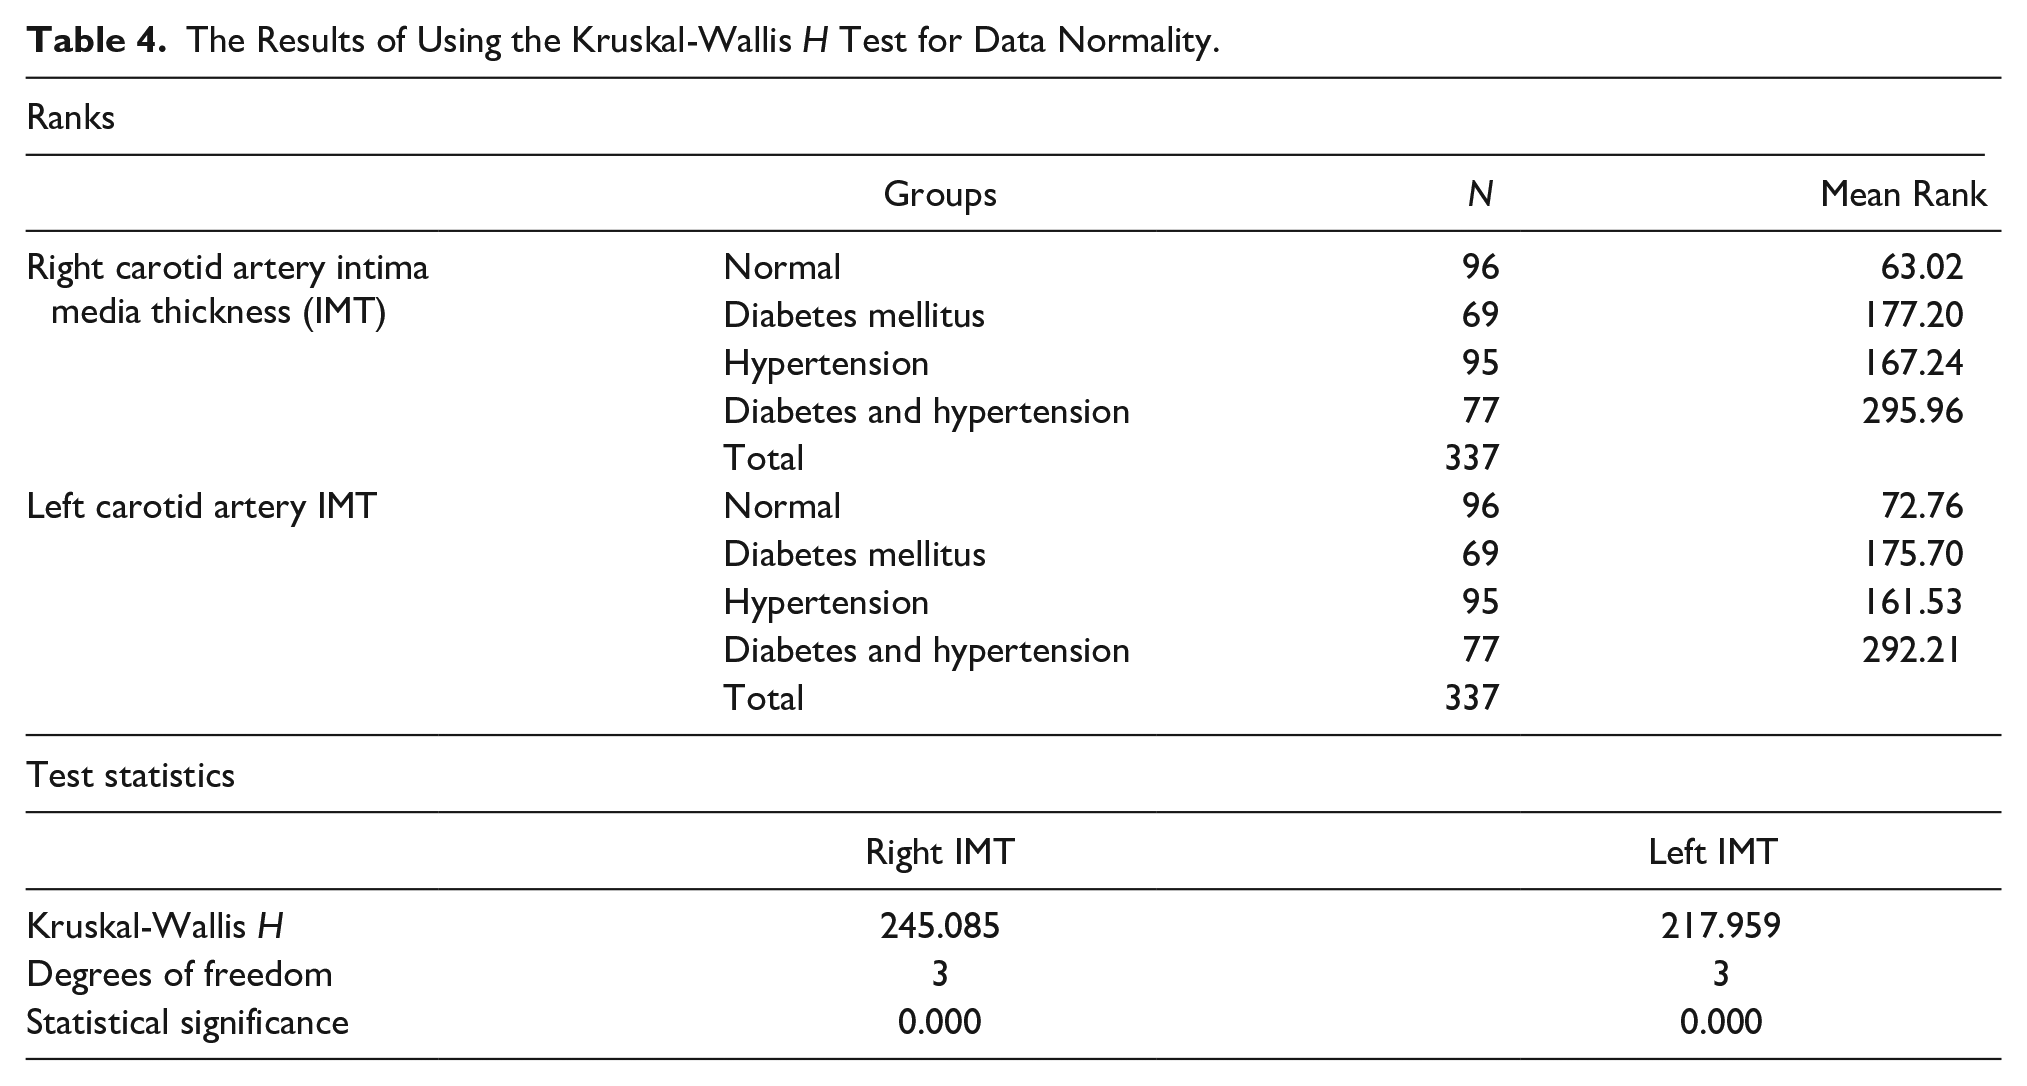
A Kruskal-Wallis H test was applied as the assumption of normality was not achieved. The result suggested that the mean rank of cIMT (right and left sides) in all four groups normal (A group), DM (B group), hypertensive (C group), and DM and hypertensive (D group) were significantly different as the P value = .000 < α = 0.05 (see Table 4).
The Results of Using the Kruskal-Wallis H Test for Data Normality.
Comparison of cIMT for the Right and Left Carotids in Four Patient Groups
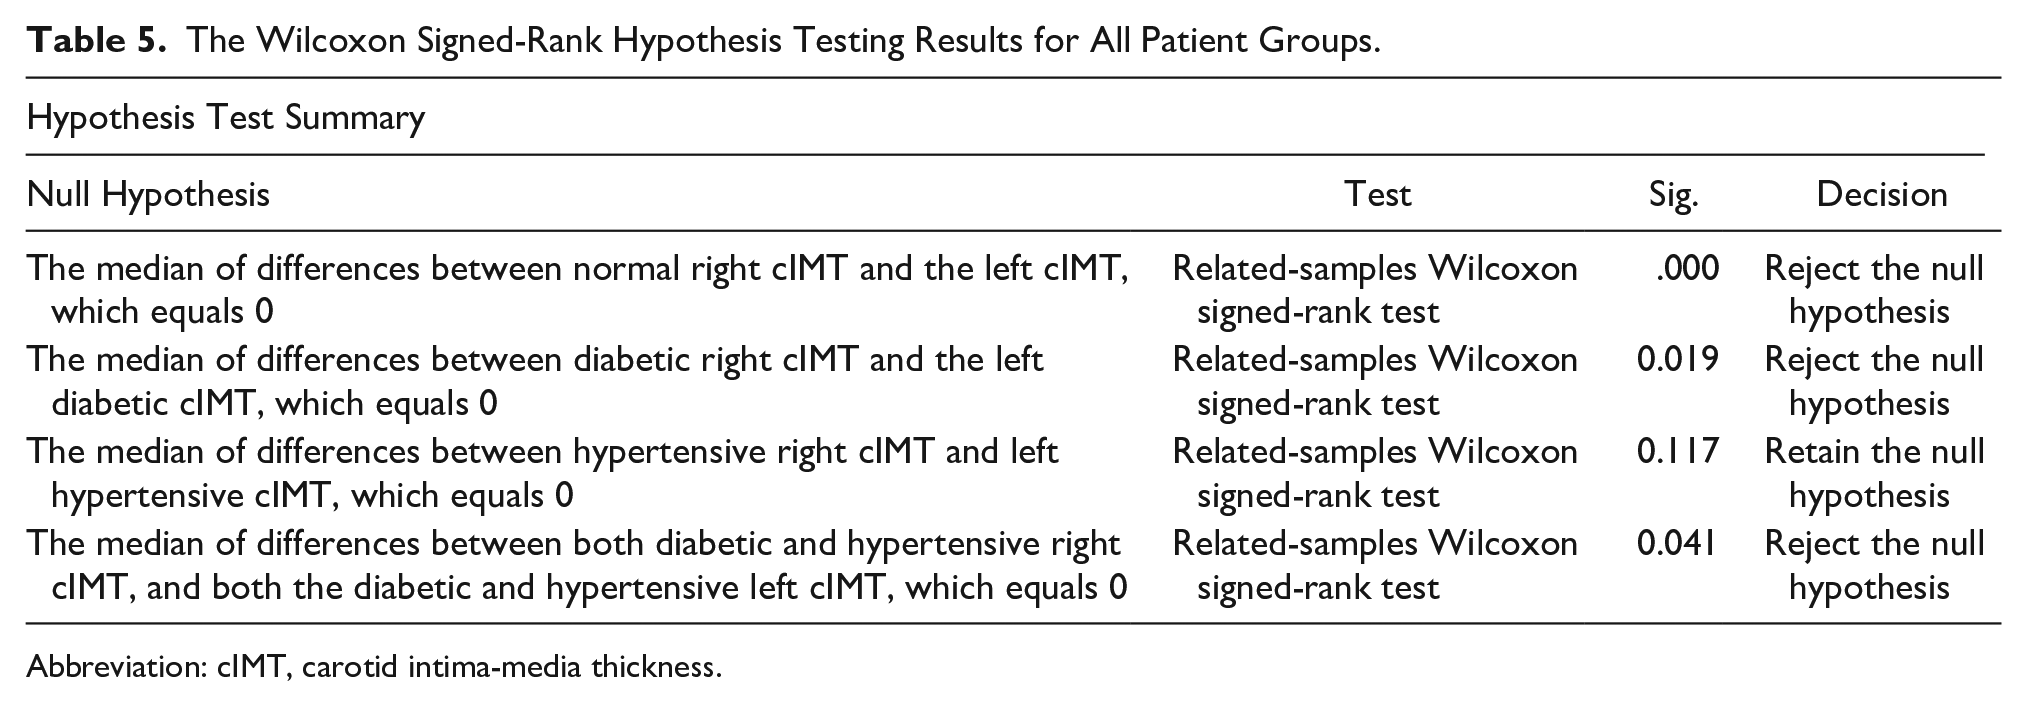
Wilcoxon signed-rank test was applied to check the median difference in right and left cIMT in all the groups. The P value for the group A was < .05, which demonstrated that there was statistical significance. The P value for the B group <.05 suggested that there was a significant difference. The P value for the C group > .05 suggested that there was no significant difference. The P value for the D group < .05 suggested that there was a significant difference (see Table 5).
The Wilcoxon Signed-Rank Hypothesis Testing Results for All Patient Groups.
Abbreviation: cIMT, carotid intima-media thickness.
Discussion
In this study, 337 people were included in the sample, 153 of them men and 184 women. In this investigation, four categories were included: a normal control (A group), DM patients (B group), hypertensive patients (C group), and DM and hypertensive patients (D group). The corresponding sample sizes were 96, 69, 95, and 77. The most effective diagnostic method for assessing cIMT is high-resolution sonography using grayscale to evaluate the common carotid arteries. Various reported investigations of baseline cIMT showed the diagnostic accuracy of common carotid sonography, using grayscale imaging, to measure cIMT. 18 Carotid intima-media thickness has also served as a marker of cardiovascular morbidity and death. 12
The prevalence of DM is on the rise worldwide and is thus regarded as an epidemic. Hypertension is nearly twice as likely in persons with DM, as in those without the disease. Some of the most prevalent causes of arteriosclerotic disorders are hypertension and DM.20,21
The published normal standard values for mean cIMT have fluctuated. Its normal cutoff value has not established in the region of this study, thus the normal patient’s mean cIMT was used as a standard. In the present study, it was noted that the cIMT in the control patients was 0.52 ± 0.08 mm for the right carotid artery and 0.55 ± 0.09 mm for the left carotid artery. This result was in accordance with Asaleye et al.’s 22 study, which found the mean cIMT was 0.52 ± 0.11 mm. In contrast, to the present study, Okeahialam et al. 23 stated in their study that the values of cIMT, for normal Nigerian patients, were 0.91 ± 0.17 and 0.91 ± 0.13 mm for the right and the left sides, respectively. Adaikkappan et al. 24 found in their study that the normal values of cIMT for the right and the left sides were 0.77 and 0.75 mm, respectively. Paul et al. 25 determined in their study, the value of cIMT in healthy individuals across all age groups was 0.75 mm. Based on the results of these studies, it may be assumed that Nigerian Africans patients have higher cIMT values within the carotid arteries. This emphasizes the requirement for normal values for each location when assessing risk factors for CVD.
Cardiovascular disease risk is exacerbated by hypertension in both genders of patients. It has been demonstrated that females with hypertension are more susceptible to developing extra risk factors. In this research, it was observed that the mean cIMT of the right carotid artery in the hypertensive patients was 0.67 ± 0.07 mm and the mean cIMT of the left carotid artery was 0.68 ± 0.09 mm. Umeh et al. 18 determined the hypertensive group’s mean cIMT readings as 0.756 and 0.751 mm. In contrast, Ibinaiye et al. 26 found higher cIMT values in their study. The mean cIMT in their study was 0.99 ± 0.13 mm. Soneye et al. 27 also found higher values of cIMT than as compared with the present study. They recorded the mean cIMT in hypertensive patients as 0.92 ± 0.22 mm.
The present study shows that hypertensive patients have higher cIMT than those of healthy controls. Compared with the present study, Naseh et al. found that all the mean cIMT among those with hypertension was higher compared with that of their normal subjects. In addition, in hypertension individuals, the period of hypertension might quicken atherosclerotic development. They also discovered that there was no correlation between the mean cIMT and the duration of hypertension. 28 Takase et al. 29 retrospective research revealed that participants had significantly higher cIMT with future hypertension. In contrast to this, Honzikova et al. stated that the influence of blood pressure on the development of cIMT in normal patients was not significant. Carotid intima-media thickness, blood pressure, or age did not significantly correlate in their hypertensive individuals. 30
Yu et al. stated that hypertension affected cIMT and major adverse cerebrovascular events were significantly associated with age. They also stated that in young adults, cIMT is significantly linked to CVD risk factors and the initial phases of vascular atherosclerosis. Even though they had only been exposed to hypertension for a short period and had few CVD risk factors, younger hypertensive participants exhibited considerably thicker carotid. 31
According to the current study, hypertension is a distinct risk factor for CVD. And it was also noted that hypertension altered cIMT. And in contrast to this, Shams et al. 32 revealed no discernible change in the cIMT between the two patient groups (with and without hypertension). Their findings suggested that hypertension does not alter cIMT on its own.
Diabetes mellitus is a familiar risk factor for CVD. Carotid intima-media thickness levels were elevated in persons with T2DM. Carotid intima-media thickness elevation is an indication of subclinical atherosclerosis and can be used to anticipate the incidence of early atherosclerosis in people with T2DM and those who have pre-DM. In the current study, it was noted that in the DM group, the mean cIMT of the right carotid artery was 0.68 ± 0.08 mm and the mean IMT of the left carotid artery was 0.70 ± 0.08. In contrast to this, Lundby-Christensen et al. found that the mean cIMT in DM patients was 0.800 ± 0.13, which is higher than the present study. 33
Lower values were reported in the Mirza et al. study, which reported the mean cIMT of the right carotid artery as 0.56 ± 0.16 mm and the mean IMT of the left carotid artery as 0.546 ± 1.48 mm. 19
Kowall et al. stated that after being matched for age, gender, and other factors, there was no correlation between blood glucose (hemoglobin A1c [HbA1c]) and cIMT. 34 Snehalatha et al. also determined that even though insulin resistance was greater in impaired glucose tolerance (IGT), it has nothing to do with an increase in cIMT. 35
In the current investigation, it was found that the patients with DM and hypertension had a higher cIMT. These findings showed that cIMT may be drastically altered by both DM and hypertension. In the present study, the mean cIMT in the DM and hypertensive group on the right side was 0.98 ± 19 mm and on the left side was 1.00 ± 0.21 mm. Like the present study, Tawfeeq et al. found that both DM and hypertension raise cIMT. The cIMT is impacted more significantly by concurrent hypertension and diabetes. In their study, the value of cIMT was 0.92 mm in both left and right carotid arteries. 36 On contrary, Mirza et al. recorded a lower value of cIMT in patients with both DM and hypertension. The mean cIMT in the DM and hypertensive group on the right side was 0.613 mm and on the left side was 0.609 mm. 19
Mean cIMT and the risk of stroke have a strong positive relationship. 23 Kota et al. 37 stated that a value larger than 0.8 mm was discovered to be linked to the development of stroke. Furthermore, several investigations revealed that increased risk for CAD is strongly correlated with higher cIMT.38 –40
Limitations
The major limitation of this study is the research design and due to the convenient sample of patients, there is a threat to internal and external validity. The overall sample size was relatively small due to the short duration of time to conduct the work. There were also some limitations due to the duration of DM and hypertension. This was not considered in the current study because most of the patients do not know about the onset of their DM as well as hypertension. So, it is recommended that if cIMT is compared with the duration of DM and hypertension that it would be important to know the length of exposure attributed to DM or hypertension. Most cIMT studies are conducted with an electrocardiogram (ECG) gated information, however, in this study, it was not possible due to the short period of examination and a general lack of ECG in the department.
Conclusion
There was a significant difference between the mean cIMT among DM and non-DM in these study patients. The normal control group of patients and isolated DM or hypertension patient groups also differed significantly. But, a more significant difference was found in the mean cIMT for normal control patients and those with both DM and hypertension.
Footnotes
Ethics Approval
The study was conducted after gaining approval from the institutional review board (IRB# 962).
Informed Consent
Informed consent was not sought for the present study because all case data were deidentified and/or aggregated and followed ethics committee or IRB guidelines (also referred to as the Honest Broker System).
Animal Welfare
Guidelines for humane animal treatment did not apply to the present study because animals were not used in the study.
Trial Registration
Not applicable.
Declaration of Conflicting Interests
The authors declared no potential conflicts of interest with respect to the research, authorship, and/or publication of this article.
Funding
The authors received no financial support for the research, authorship, and/or publication of this article.