
Abstract
Objective:
The aim of this study was to determine whether the number and thickness of ligament bands of lateral ankle ligaments are symmetrical between contralateral uninjured ankles of the same healthy person, using sonography.
Materials and Methods:
The ligaments investigated include the anterior talofibular ligament (ATFL), calcaneofibular ligament (CFL), and the anterior inferior tibiofibular ligament (AITFL). The influence of age, sex, height, weight, body mass index, and hours of physical exercise on uninjured ankle ligament band thickness was also explored. The lateral ankle ligaments of both limbs of 27 physically active adults (18–50 years of age) were sonographically imaged in short and long-axis planes to determine the number of bands and measure each band thickness. The ligament banding and ankle ligament band thickness was compared between contralateral uninjured limbs.
Results:
Bilateral symmetry of the number of ATFL, CFL, and AITFL bands was consistently identified between right and left uninjured limbs using short-axis sonographic imaging. No significant difference (P > .05) in ankle ligament band thickness (acquired from long-axis images of ligament bands) between uninjured contralateral limbs was identified.
Conclusion:
The current sonographic practice of comparison of ankle ligament morphology and thickness between uninjured and injured limbs of the same person following an acute ankle injury to aid diagnosis of injury would appear justified.
Keywords
Ankle sprains are one of the most common musculoskeletal injuries. Up to 85% of ankle sprains involve injury to the lateral ligaments of the ankle and most commonly involve the anterior talofibular ligament (ATFL) and, to a lesser degree, the calcaneofibular ligament (CFL) of the lateral collateral ligament complex (LCLC). 1 Injury to the anterior inferior tibiofibular ligament (AITFL) of the inferior tibiofibular syndesmosis can occur concurrently with LCLC injuries, with variably reported frequency. 2 High-resolution sonography is increasingly used to determine the extent of acute ligament injury following an ankle sprain to guide patient management. Sonography can be performed as a “targeted” examination following an acute ankle sprain and is completed with a less structured protocol than magnetic resonance imaging (MRI), hence considered more operator dependent.
Sonographic reporting of ligament integrity following an acute sprain includes defining whether a ligament appears uninjured or injured when compared to the contralateral limb. Ligaments, when injured, are classified sonographically as partially or completely torn, possibly in association with an avulsion fracture.3,4 Complete ankle ligament tears result in ligament discontinuity and are identified sonographically by a gap between ligament ends. 4 Acute partial ankle ligament tears can appear more sonographically varied with sonographic findings including preservation of some continuous ligament fibers across a joint, ligament hypoechogenicity, a heterogeneous fibrillar ligament echotexture, and nonuniformity of ligament thickness.3 –5 In addition, disruption to peri-ligamentous tissues, irregularity of ligament borders, and osseous irregularity at the enthesis, which can include avulsed fragments, may be encountered in various combinations. 6
The most consistent sonographic finding of an acute partial ligament tear is “ligament thickening”. 7 This is due to increased cellularity and fluid within the ligament tissue and disorganized remodeling. 8 Ligament “thickening” is sonographically determined by visual and qualitative assessment of the thickness of the ligament of interest via long-axis imaging and comparison with the contralateral uninjured ankle. Ligament thickening is also one of several criteria used to diagnose partial ankle ligament tears from MRI. Quantitative sonographic measures of ligament thickness may be incorporated into sonography protocols for the assessment of ankle ligaments following an acute sprain. Such measures, when comparing the thickness of ankle ligaments between contralateral uninjured and injured limbs, may improve sonographic identification of injured ankle ligaments.
Ankle ligaments are multibanded structures; however, their multiband form is often underappreciated with sonography. This may be due to the routine use of long-axis sonographic imaging of ankle ligaments without the additional use of imaging ligaments in an alternate plane such as short-axis imaging which allows ankle ligament banding to be appreciated. There is an assumption that ankle ligament thickness and banding are symmetrical between uninjured contralateral limbs in musculoskeletal sonography. Determination of the symmetry of the number of ankle ligament bands between contralateral limbs has not been sufficiently investigated. The use of short-axis sonographic imaging to identify banding for the ATFL, CFL, and AITFL needs to be further explored.
The sonographic qualitative interpretation, by different observers, of ligament “thickening,” echogenicity, and echotexture is quite subjective. Variation in the interpretation and reporting of findings may lead to underdiagnosis of the extent and severity of ankle ligamentous injury sonographically. Inadequate management and treatment may result. An earlier return to everyday or sporting activities following a sprain may increase the risk of recurrent ankle sprain, impact short- and long-term repair and recovery, and lead to lifestyle and occupational limiting factors. 9 The aim of this study was to use sonography to determine whether the number and thickness of ligament bands of the ATFL, CFL, and AITFL between contralateral uninjured ankles of the same healthy person are symmetrical.
As ankle ligament thickness is sonographically assessed to aid in the determination of ligament normalcy or injury, factors that may influence their thickness, such as age, sex, height, weight, body mass index (BMI), and physical activity, needs to be explored. Although studies have been conducted investigating the influences of these factors on ligament components such as collagen, studies investigating the influence of these factors on ankle ligament thickness are limited.10,11 No significant difference in ankle ligament thickness has been demonstrated between males and females, despite mean ATFL and CFL thickness in males being slightly greater than that in females on MRI. 12 Studies reporting the influence of age, height, weight, and BMI on ankle ligament thickness are required.
Materials and Methods
Ethical approval was gained for this study from the local human research ethics committee (Approval # 1700001161). Informed consent was obtained from all participants. Sonography of ankle ligaments, to identify ligament banding and acquire ankle ligament band thickness measures of both limbs, in 27 physically active, healthy adults was performed.
A Philips iu22 ultrasound system (Philips Healthcare, Andover, MA, USA) and an L12-5 MHz linear array transducer were used to obtain short and long-axis sonographic imaging of the ATFL, CFL, and AITFL of the lateral ankle. Participants were positioned lying on an examination bed with their foot and ankle hanging over the end of the bed. The foot and ankle position for imaging of each ligament was adjusted to ensure each ligament was taut when being imaged and consistent with how it would be imaged in a clinical environment. Short-axis sonographic imaging of each ligament was used to document the number of ligamentous bands present. Individual bands of each ligament were then systematically imaged in the long-axis plane from superior to inferior, and measures of individual band thicknesses were obtained. Long-axis images of ligaments demonstrated the bony insertions at each end of a ligament. For thickness measures, calipers were placed on the outer aspect of the superficial and deep echogenic epiligament borders, consistent with an outer-to-outer (OTO) caliper placement method. When multiple ligament bands were present and identified, the numbers 1 to 4 were used to note individual bands from superior (1) through to inferior (4). The sonographic imaging and measurements were completed on the right limb first, followed by a 15-minute time interval before being completed on the left limb. Sonography and measurements were acquired by a single observer, a sonographer with 18 years of experience in musculoskeletal sonography.
ATFL Imaging
The ATFL was imaged with the foot internally rotated and plantarflexed 45°. For short-axis imaging, the transducer was placed in a coronal oblique plane, mid-way between the talus and the lateral malleolus, to determine the number and position of ATFL bands present. For long-axis imaging, the transducer was rotated 90° to be placed parallel with the plantar aspect of the foot, between the lateral malleolus and the talus. Thickness measures of ATFL bands identified were acquired at the midpoint of each band between ligament insertions onto the fibula and talus (see Figure 1).
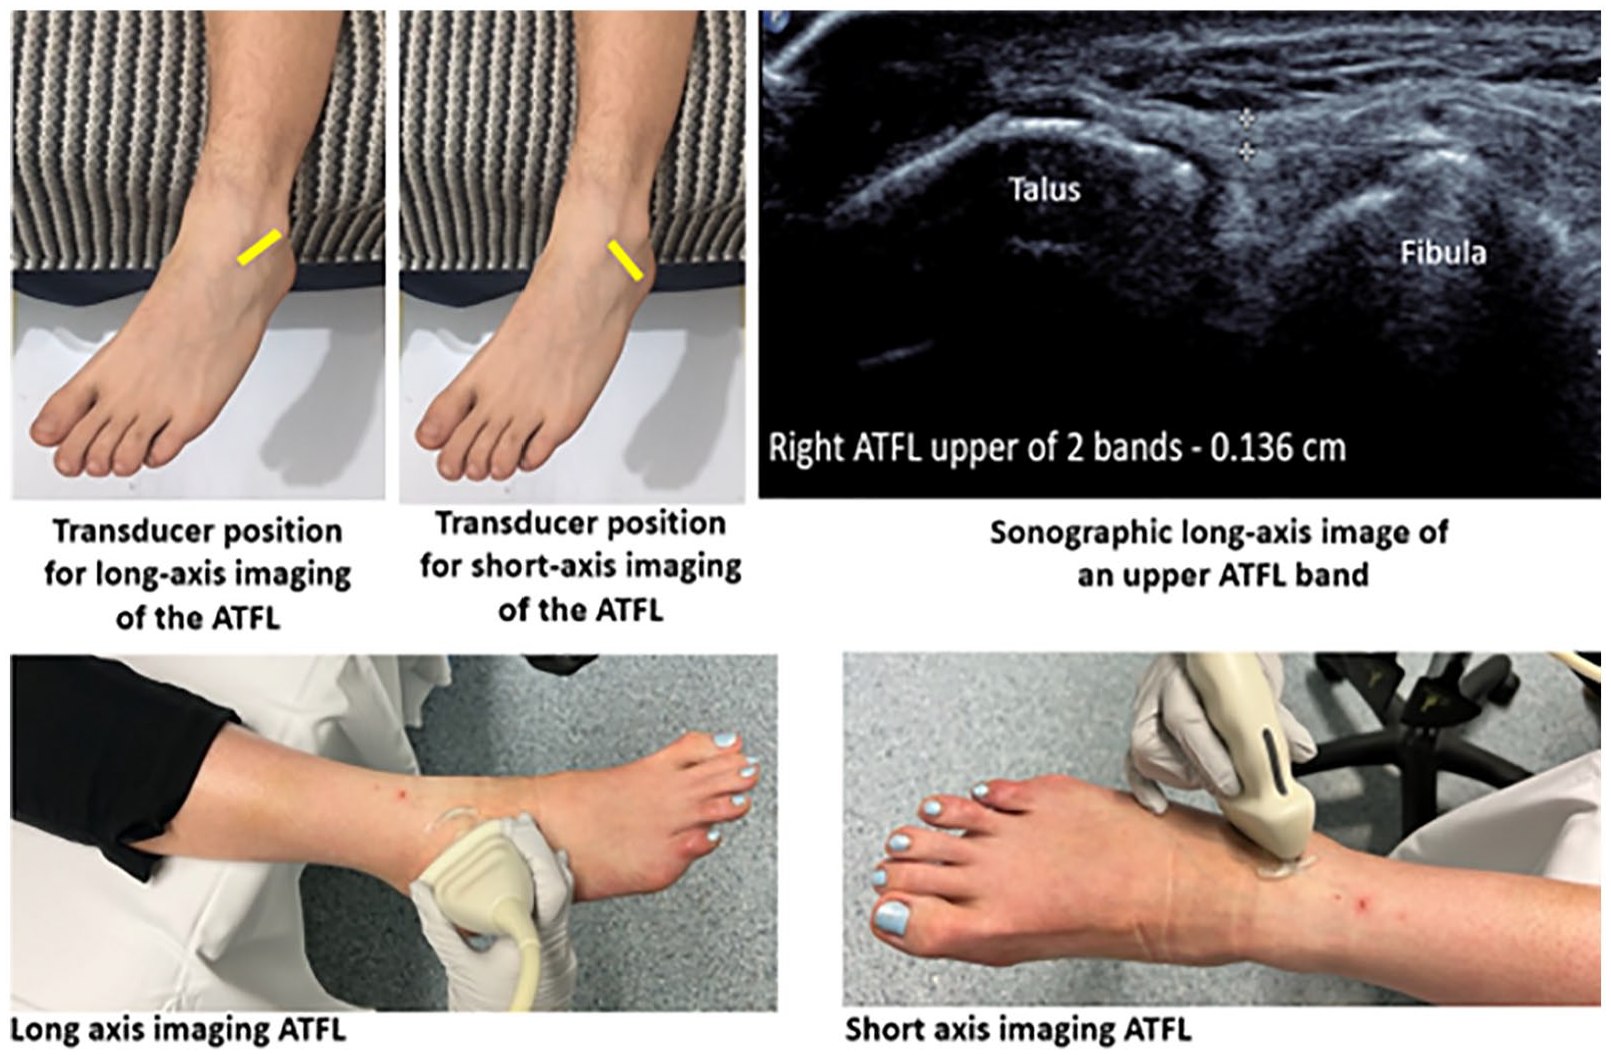
The foot position and transducer placement for sonography of ATFL. The ankle and foot are placed in a hanging position over the end of the bed. The foot is plantarflexed (45°) and inverted. The transducer position for short-axis and long-axis imaging is demonstrated in yellow. A long-axis sonogram of the ATFL with an OTO thickness measure of an individual (upper) band of the ATFL at the midpoint between two osseous insertions is shown. ATFL, anterior talofibular ligament; OTO, outer-to-outer.
CFL Imaging
For imaging the CFL and its bands, the foot was positioned in a dorsiflexed and internally rotated position. Short-axis imaging, to identify banding, was obtained by placing the transducer between the lateral malleolus and the posterior, inferior aspect of the heel, parallel to the plantar aspect of the foot. For long-axis imaging, the transducer was rotated 90° and placed in a coronal oblique plane between the lateral malleolus and the posterior aspect of the heel. Thickness measures of CFL bands were obtained from the midpoint of the ligament between the calcaneal and fibular insertions, overlying the calcaneus (see Figure 2).
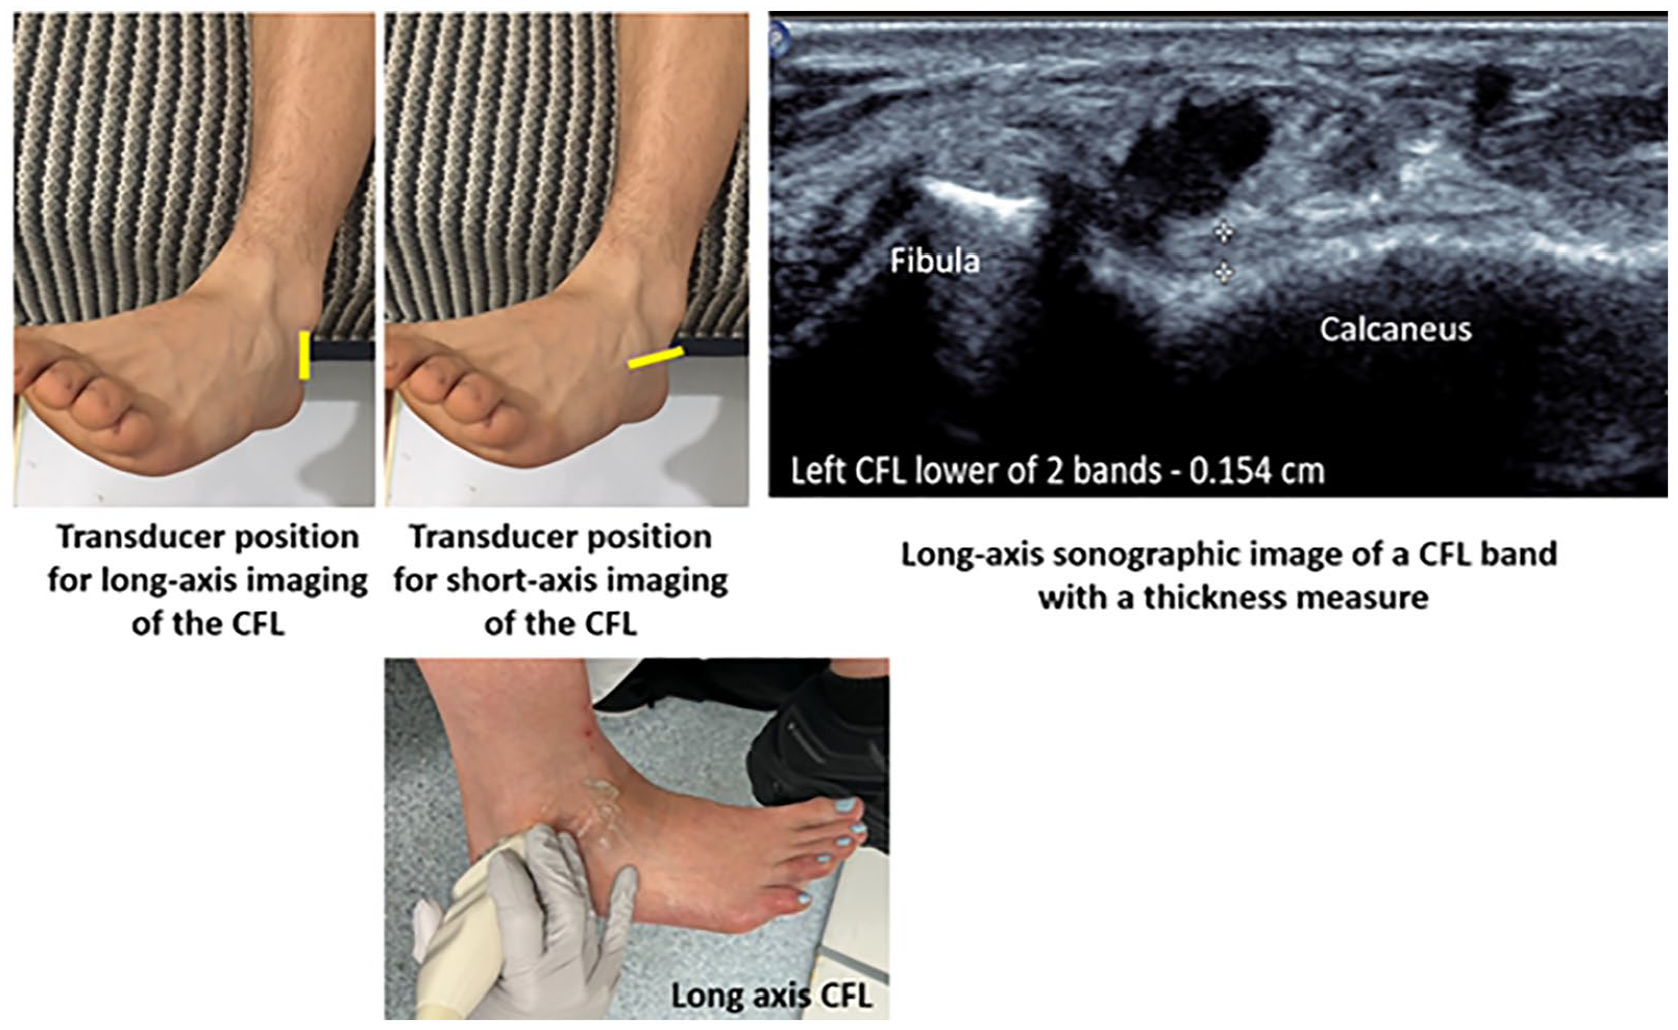
The foot position and transducer placement for sonography of CFL. The ankle and foot are placed in a hanging position over the end of the bed. The foot is dorsiflexed. The transducer position for short-axis and long-axis imaging is demonstrated in yellow. A long-axis sonogram of the CFL with an OTO thickness measure of an individual (lower) band of the CFL at the midpoint between two osseous insertions is shown. CFL, calcaneofibular ligament; OTO, outer-to-outer.
AITFL Imaging
The AITFL was sonographically imaged in a dorsiflexed position, with the toes moved laterally so the foot was slightly externally rotated. For short-axis imaging, to identify AITFL bands, the transducer was placed in an oblique plane between the distal tibia and fibula, superior to the ankle joint, and perpendicular to the long axis of the AITFL. Long-axis imaging was achieved with the transducer oriented in a vertical, oblique position between the lateral malleolus of the fibula and the anterolateral aspect of the tibia. Thickness measures of ATFL bands were acquired at the midpoint between the tibia and fibula insertions (see Figure 3).
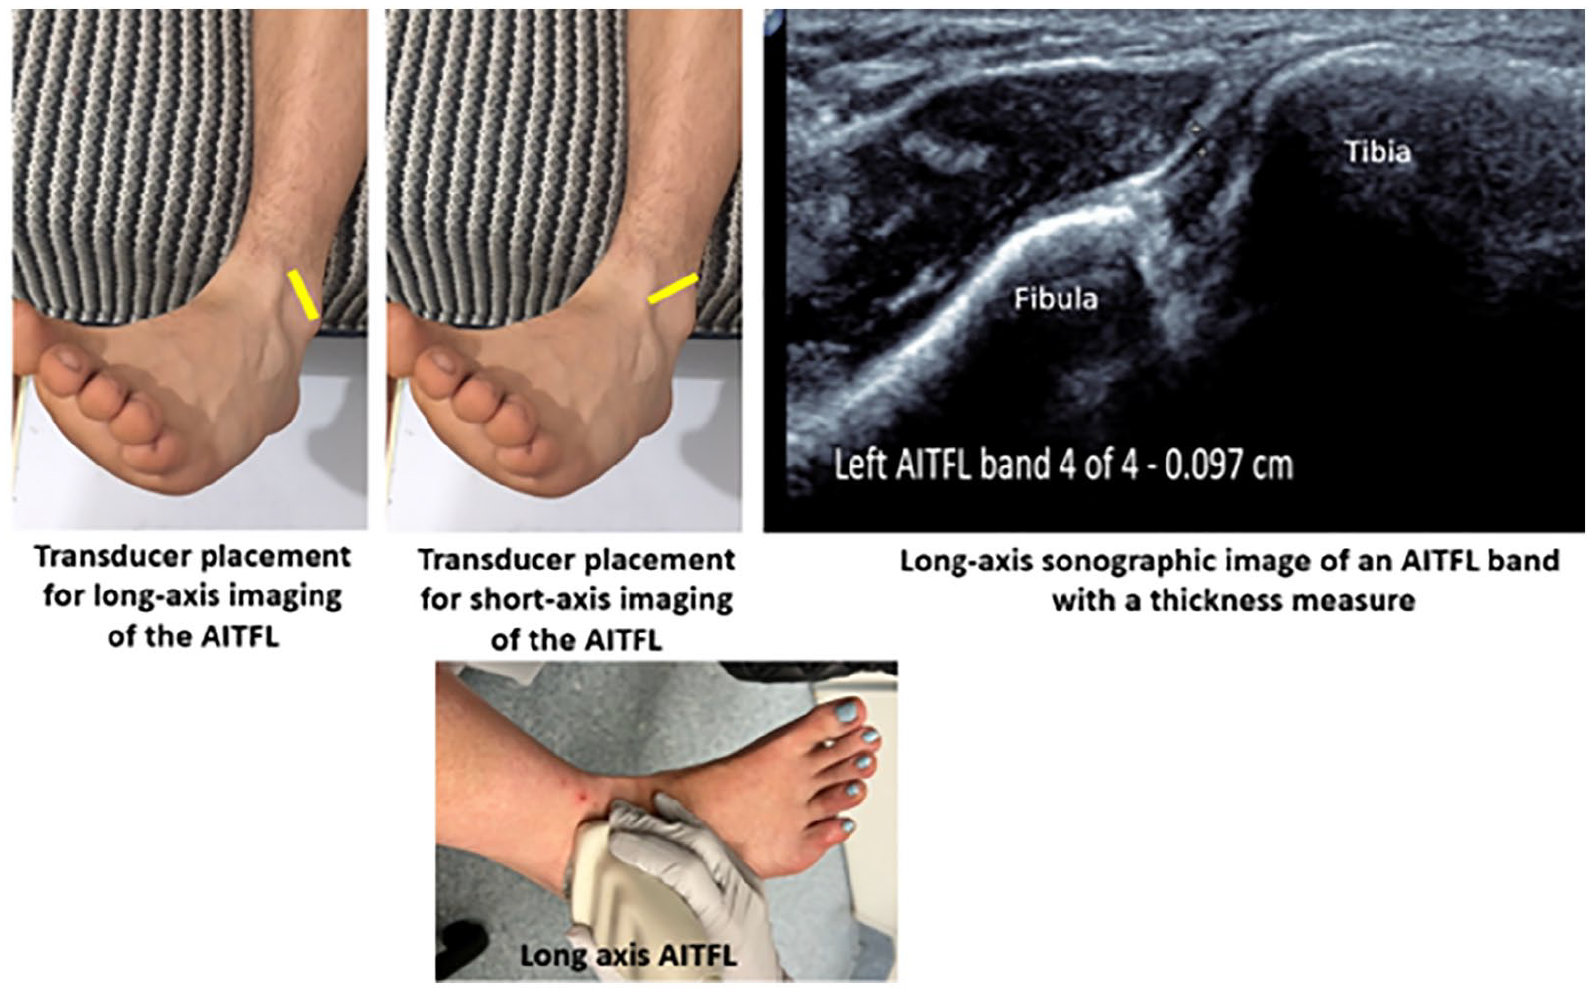
The foot position and transducer placement for sonography of AITFL. The ankle and foot are placed in a hanging position over the end of the bed. The foot is dorsiflexed and externally rotated (toes moved laterally). The transducer position for short-axis and long-axis imaging is demonstrated in yellow. A long-axis sonogram of the lowest AITFL band (Bassett ligament) with an OTO thickness measure at the midpoint between two osseous insertions is shown. AITFL, anterior inferior tibiofibular ligament; OTO, outer-to-outer.
Statistical Analysis
Data analysis was performed using SPSS (IBM Corp, Armonk, NY) version 24.0. Data were assessed for normality using the Shapiro–Wilk’s test. Paired samples t-tests were conducted to compare the thickness of the ATFL, CFL, and AITFL and their bands in the contralateral limbs of healthy, uninjured participants to determine if there was a significant difference. Bivariate correlation analysis was conducted to determine if there was a linear relationship between age, sex, height, weight, BMI, and hours of physical exercise per week with ankle ligament band thickness in healthy control participant limbs. Correlations were interpreted as small (r = .10–.29), medium (r = .30–.49), and large (r = .50–1.0). 13 The P value was set, a priori at .05.
Results
Participants were aged between 18 and 50 years of age (28 ± 8 years) and included 16 females and 11 males without a history of an ankle injury or surgery. Participants undertook an average of 5.1 ± 2.7 hours of active physical exercise per week and had a mean weight: 69.5 ± 14.9 kg, height: 1.70 ± 0.09 m, and BMI: 23.8 ± 4.4 kg/m2.
Ligament Banding
The number of bands of the ATFL, CFL, and AITFL using short-axis sonographic imaging was consistently demonstrated to be symmetrical between uninjured contralateral limbs. The ATFL exhibited one, two, or three bands, with two ATFL bands being the most common presentation (see Table 1).
The Number of Constituent Ankle Ligamentous Bands Identified Sonographically for the ATFL, CFL, and AITFL.
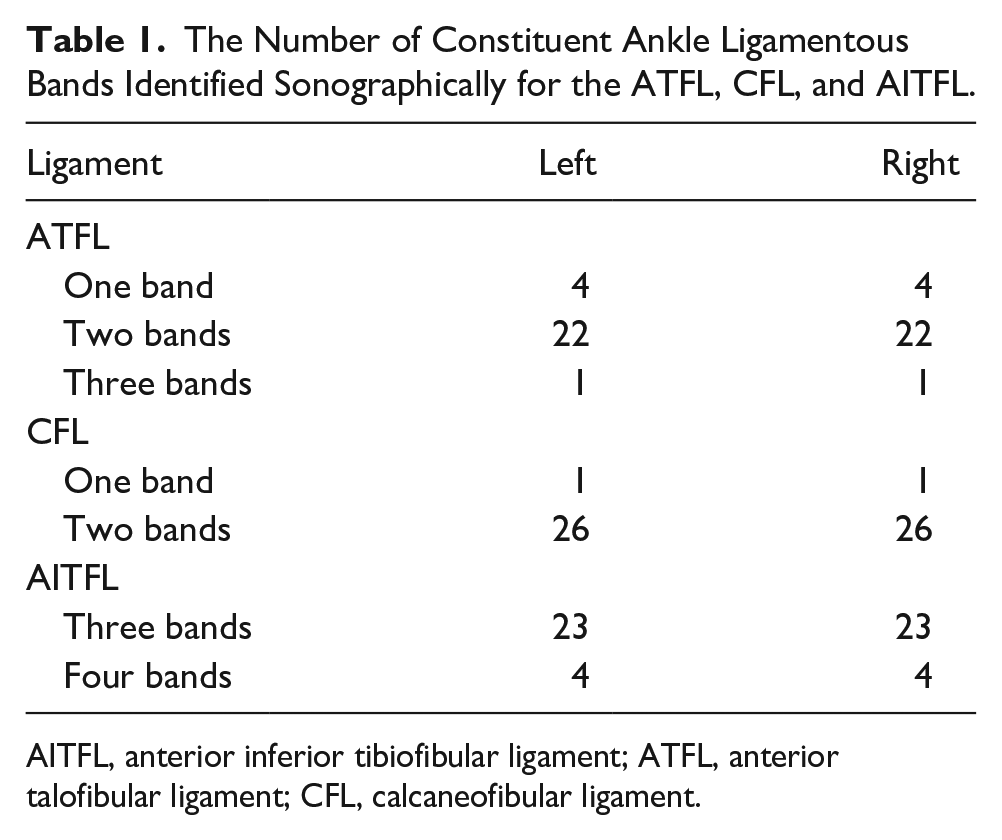
AITFL, anterior inferior tibiofibular ligament; ATFL, anterior talofibular ligament; CFL, calcaneofibular ligament.
Two CFL bands were the most common configuration sonographically identified (96%). Three to four bands were identified in the AITFL, with three bands being the most common (see Figure 4).
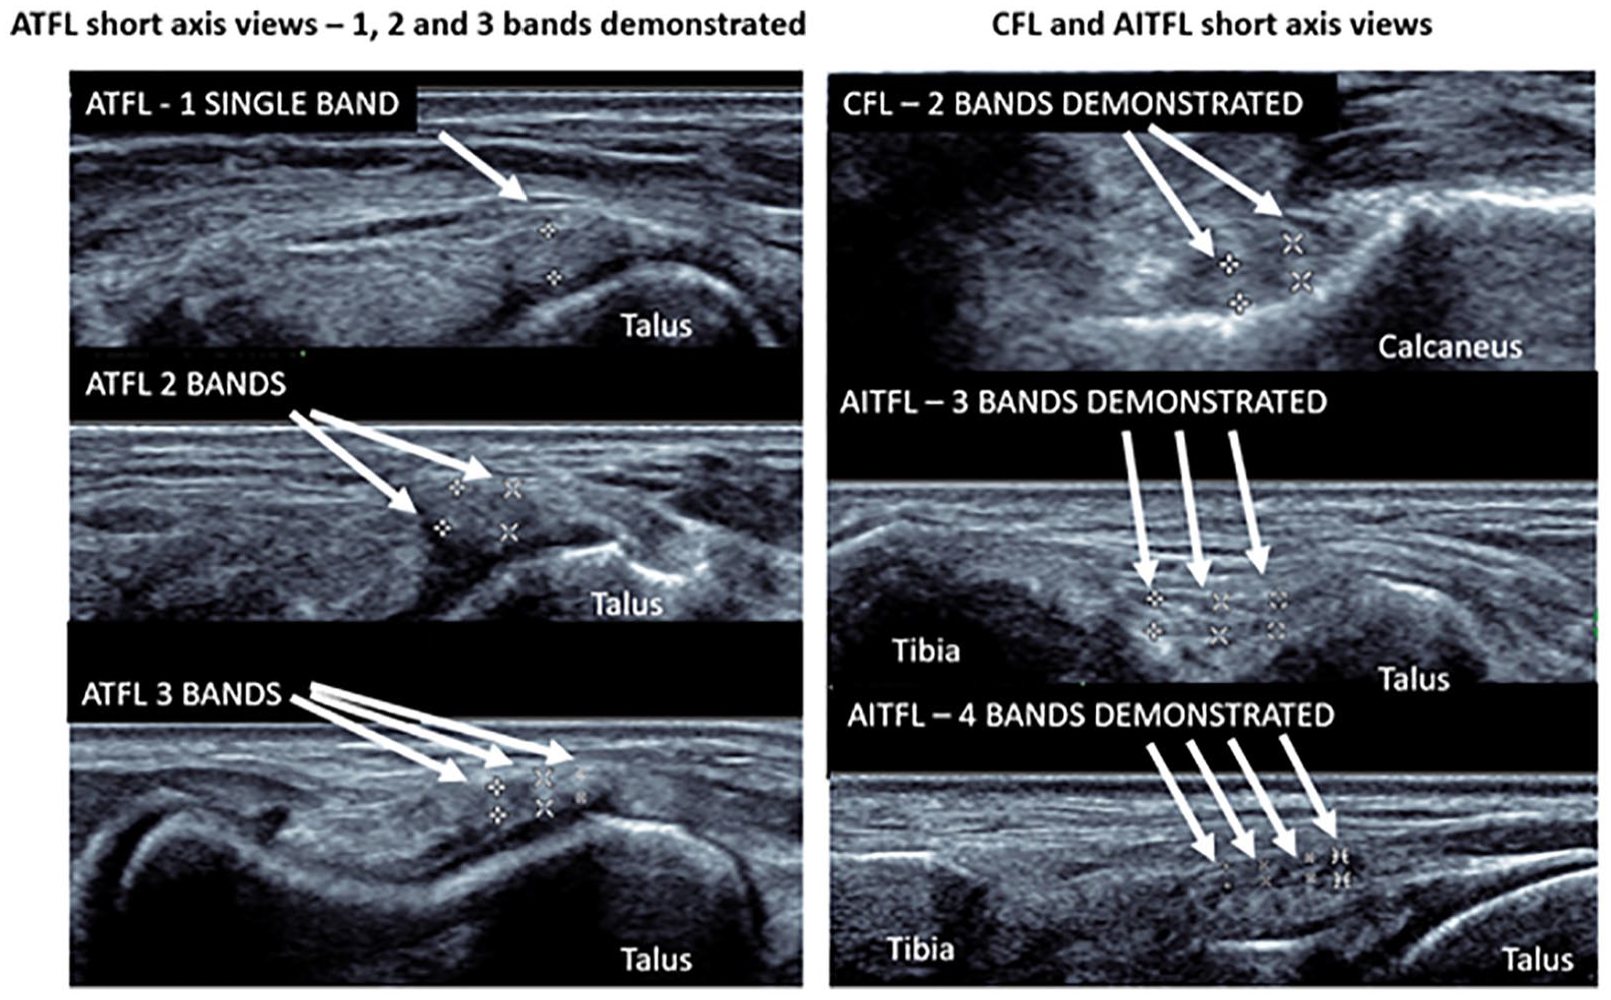
Sonographic short-axis imaging used to allow the identification of the number of bands of ankle ligaments. One to three ATFL bands, one to two CFL bands, and three to four AITFL bands were identified in uninjured limbs of people without a history of an ankle sprain. The number of bands was symmetrical between uninjured limbs. Calipers (+, x, x, and *) are placed on the outer aspect of the ligament. AITFL, anterior inferior tibiofibular ligament; ATFL, anterior talofibular ligament; CFL, calcaneofibular ligament.
Contralateral Uninjured Ankle Ligament Band Thickness
Differences in uninjured ATFL, CFL, and AITFL band thickness of ±0.02, ±0.07, and ±0.05 mm were, respectively, measured between contralateral limbs. No significant difference in band thickness between contralateral limbs was identified for any of the ligaments investigated (P > .05) (see Table 2).
Sonographic Ankle Ligamentous Thickness Measures in Contralateral Healthy, Uninjured Limbs of the Same Person (n = 27).
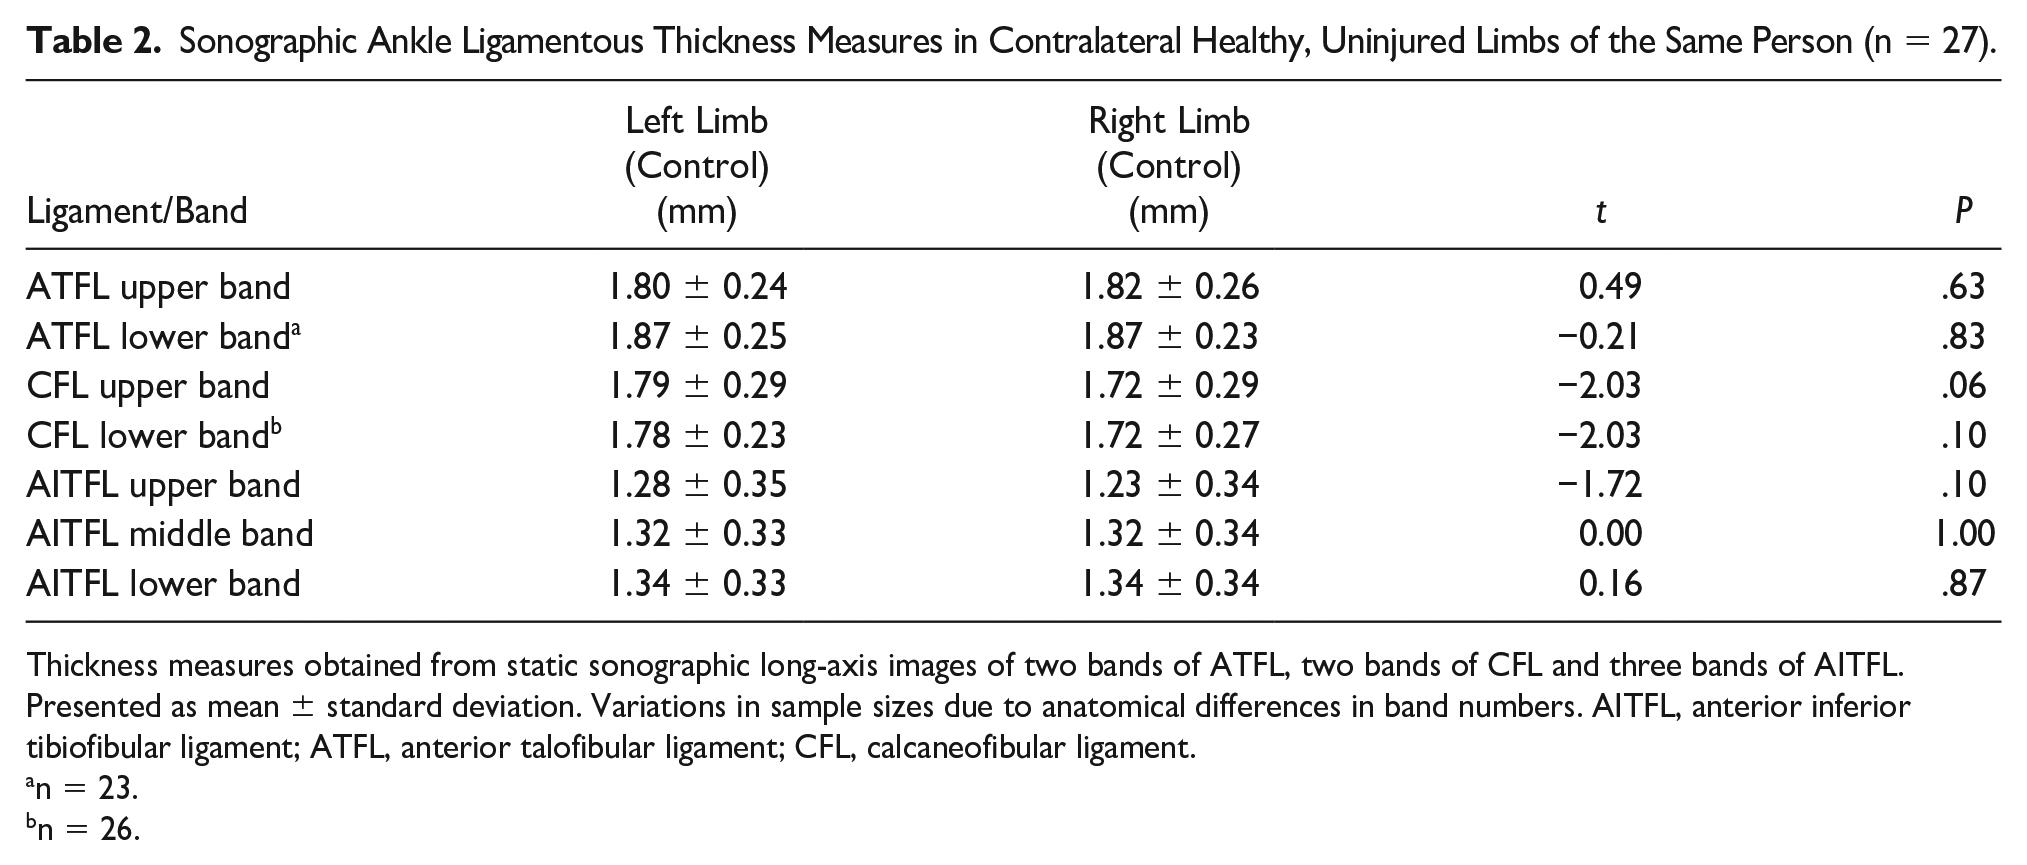
Thickness measures obtained from static sonographic long-axis images of two bands of ATFL, two bands of CFL and three bands of AITFL. Presented as mean ± standard deviation. Variations in sample sizes due to anatomical differences in band numbers. AITFL, anterior inferior tibiofibular ligament; ATFL, anterior talofibular ligament; CFL, calcaneofibular ligament.
n = 23.
n = 26.
Factors That May Influence the Band Thickness of Uninjured Ankle Ligaments
No significant correlations between the factors of age, height, weight, BMI, and hours of exercise per week with mean ligament thickness of all bands of the CFL and AITFL were identified in healthy, uninjured limbs (P > .05) (see Table 3). Measures of thickness of constituent bands of the ATFL, CFL, and AITFL were grouped together for analysis. A significant correlation between ATFL thickness and height (r = .28), BMI (r = .28), and weight (r = .38) was observed (P < .05).
Correlation of Age, Height, Weight, BMI, and Hours of Exercise Per Week With Healthy Ankle Ligament Thickness Using Bivariate Analysis.
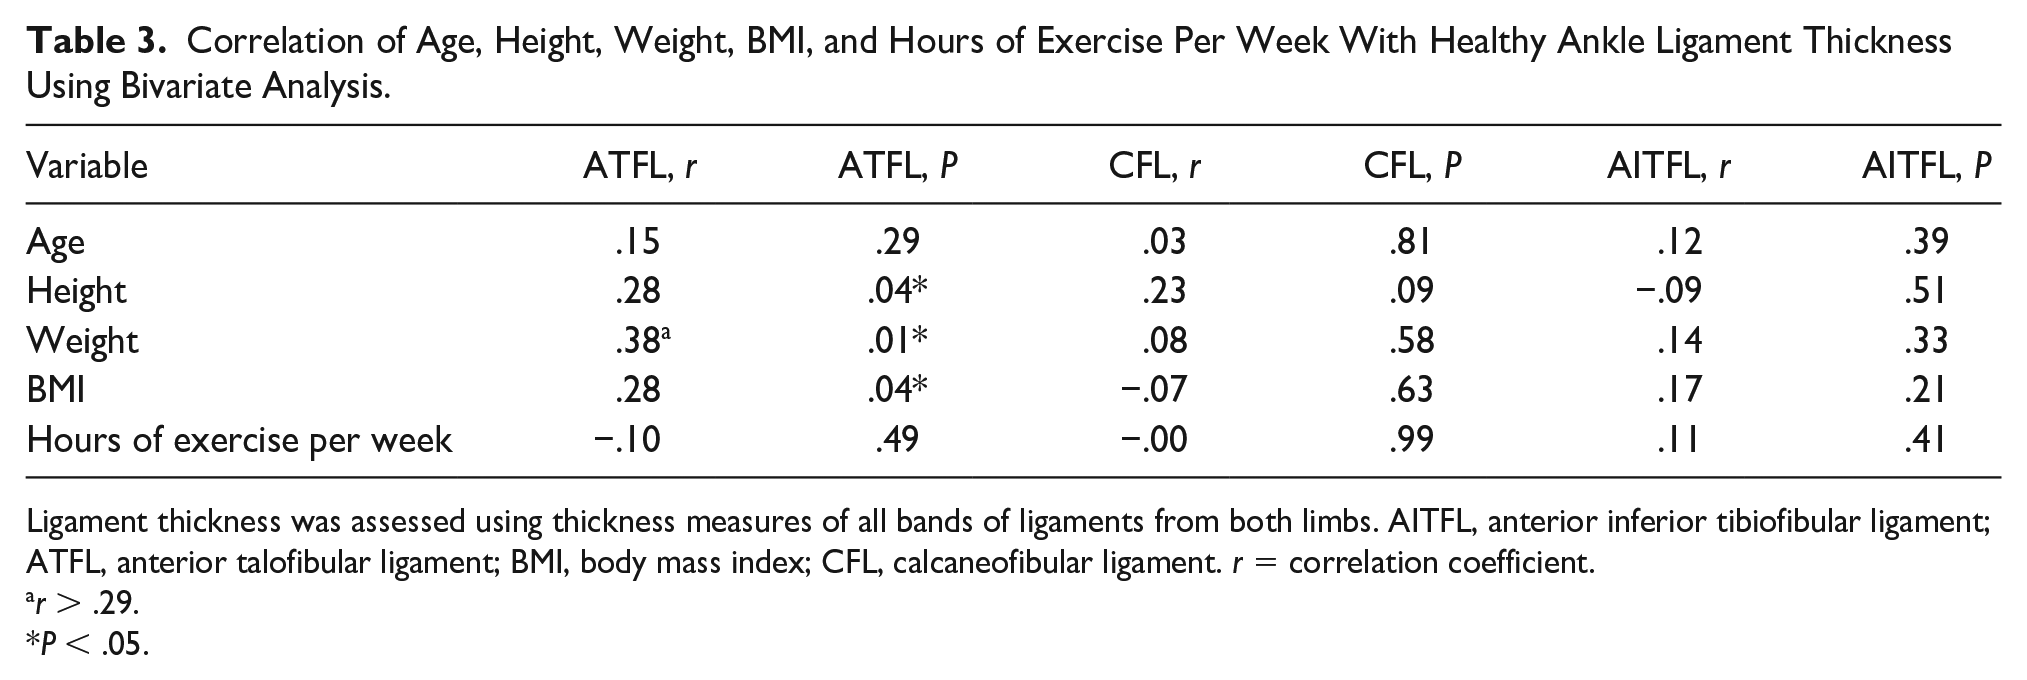
Ligament thickness was assessed using thickness measures of all bands of ligaments from both limbs. AITFL, anterior inferior tibiofibular ligament; ATFL, anterior talofibular ligament; BMI, body mass index; CFL, calcaneofibular ligament. r = correlation coefficient.
r > .29.
P < .05.
No significant difference in ankle ligament thickness between male and female uninjured ankle ligaments was demonstrated (P > .05) (see Table 4). The thickness measures of all bands of ankle ligaments from both limbs of participants were used for analysis.
Comparison of Sonographic Ankle Ligament Thickness Measures Between Males (n = 11) and Female (n = 16) Participants (All Bands of Each Ankle Ligament Included in Analysis).
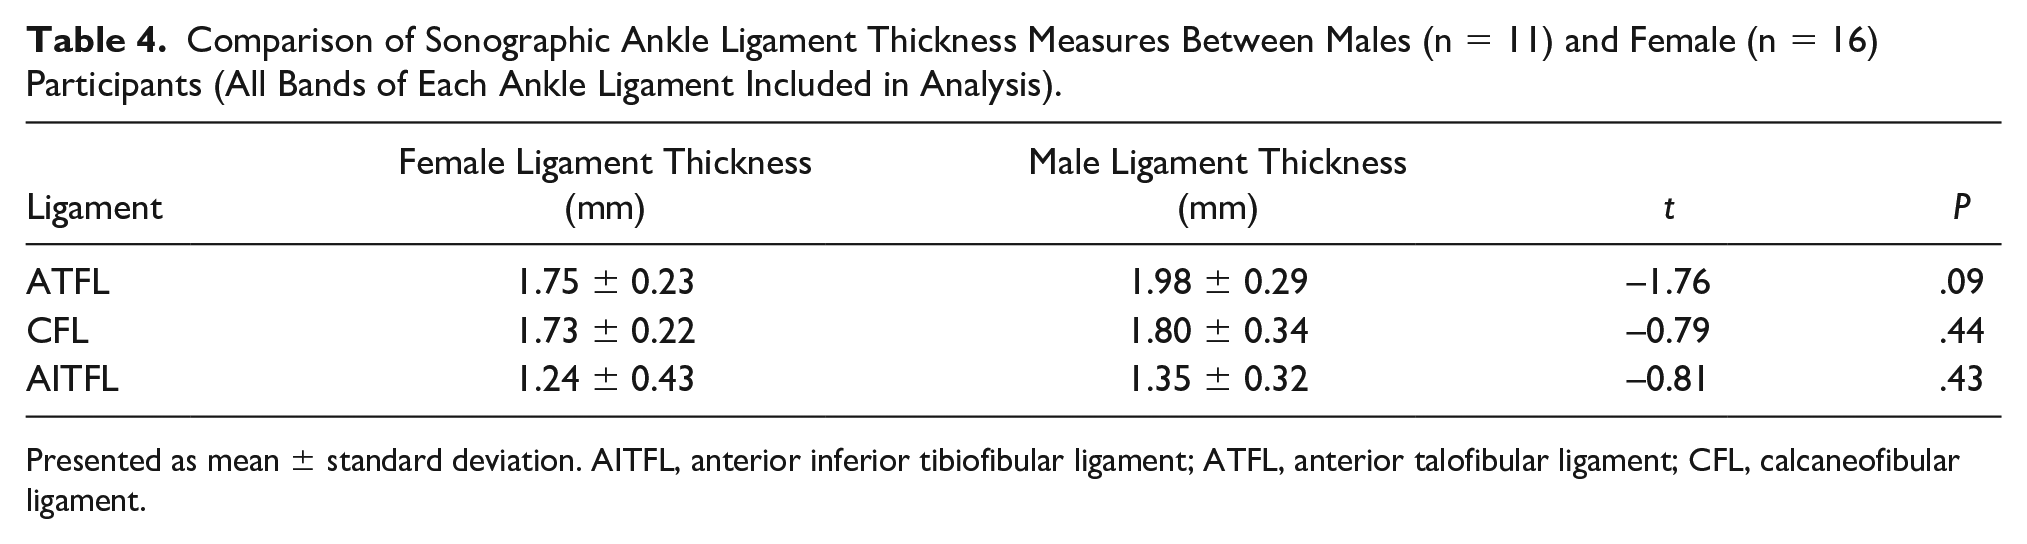
Presented as mean ± standard deviation. AITFL, anterior inferior tibiofibular ligament; ATFL, anterior talofibular ligament; CFL, calcaneofibular ligament.
Discussion
Ligament Banding
To date, the multibanded nature of ankle ligaments has been underappreciated in short-axis sonographic imaging. A knowledge of ankle ligament anatomy, particularly banding, is required to allow these structures to be appreciated and demonstrated well on sonographic imaging. The LCLC is composed of three ligaments that assume a primary stabilizing role, depending on the foot position; they include the ATFL, CFL, and posterior talofibular ligament (PTFL). The ATFL and the PTFL cross the talofibular portion of the talocrural joint, and the CFL crosses both the talofibular portion of the talocrural joint as well as the subtalar joint (Figure 5). 14
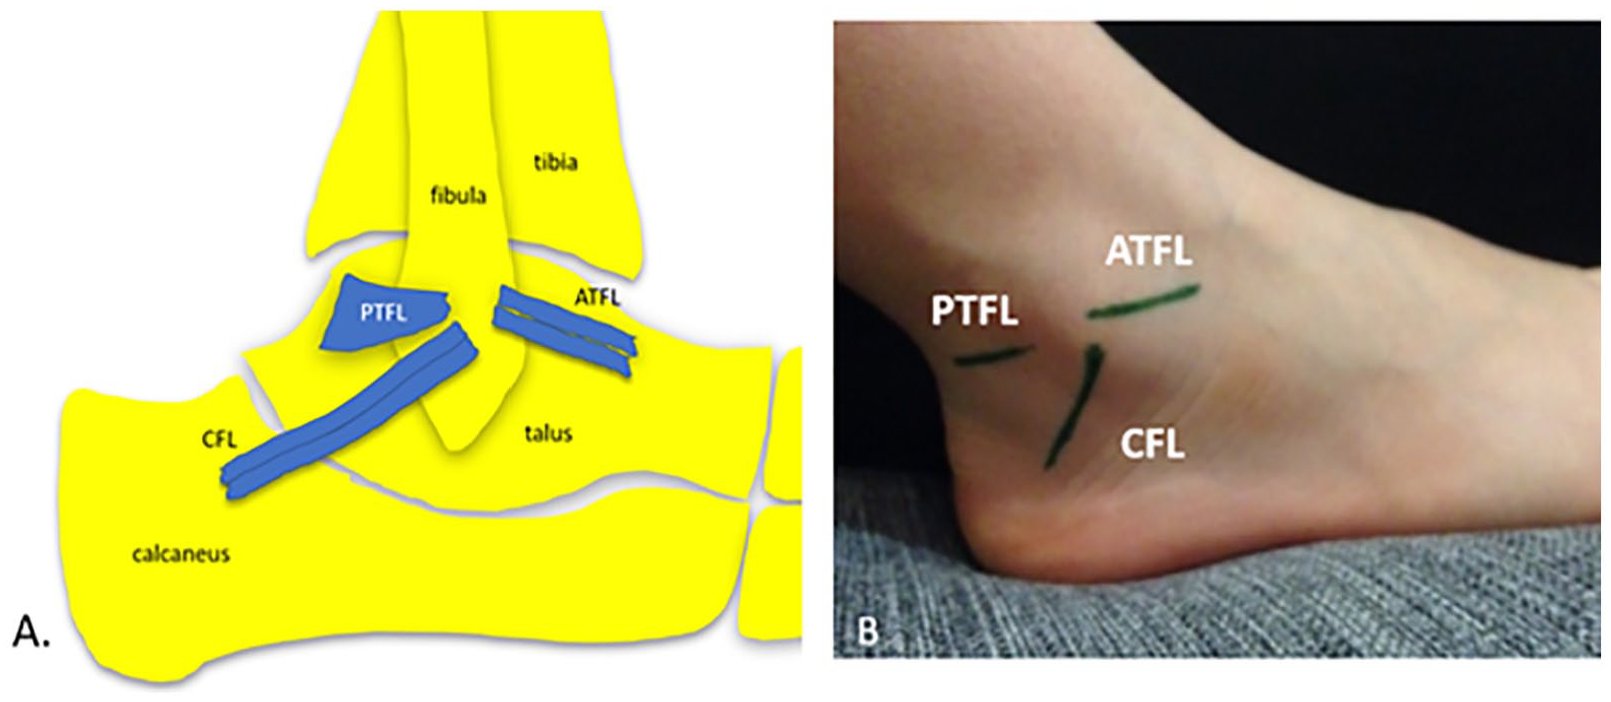
Ligaments of the lateral collateral ligament complex. (A) The anatomy of the ATFL, CFL, and PTFL are demonstrated. (B) The surface anatomy of these ligaments is shown. ATFL, anterior talofibular ligament; CFL, calcaneofibular ligament; PTFL, posterior talofibular ligament.
The ATFL of the Lateral Collateral Ligament Complex
The ATFL extends from the fibula anteriorly to the talus. When the foot is at rest, the ATFL runs in a horizontal orientation and, when plantarflexed, becomes more parallel to the long-axis of the leg, allowing it to act as a collateral ligament of the ankle along with the medial collateral ligament (MCL) complex. 15 It stabilizes the talus, prevents anterior displacement of the talus with respect to the fibula, and limits plantarflexion and inversion. 16 As a result, it becomes vulnerable when the foot is plantarflexed and inverted, the common position during an ankle inversion injury, making it most susceptible to damage. This is also the position of the foot and ankle when the ATFL is taut and should be positioned for sonographic imaging (see Figure 6).
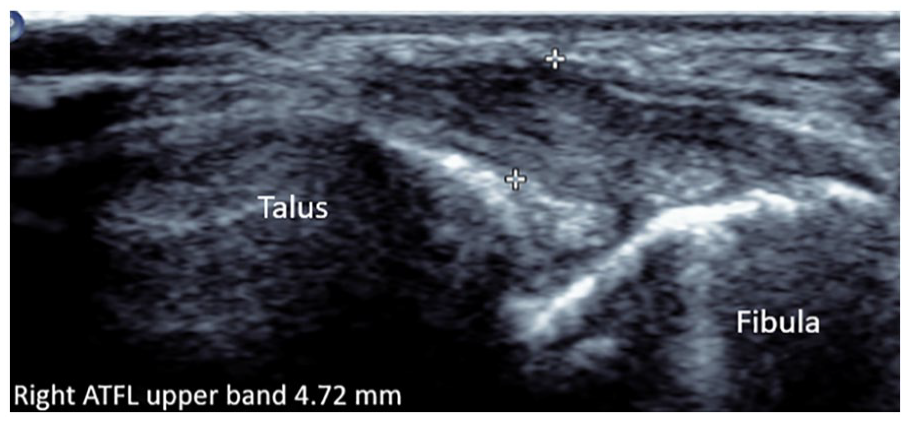
Partially torn upper ATFL band. It appears to have irregular epiligament borders, nonhomogenous fibrillar echotexture, hypoechoic, and thickened at 4.72 mm. ATFL, anterior talofibular ligament.
The ATFL has a multibanded (multifasciculated) morphology. 17 Single, double (bifurcate), or triple (trifurcate) configurations of ATFL banding are variably reported.18,19 Anterior talofibular ligament bands are separated by an interval of fat, allowing for the variable penetration of vessels. 20 When more than one ATFL band is present, additional bands are positioned superior or inferior to other bands (see Figure 7).
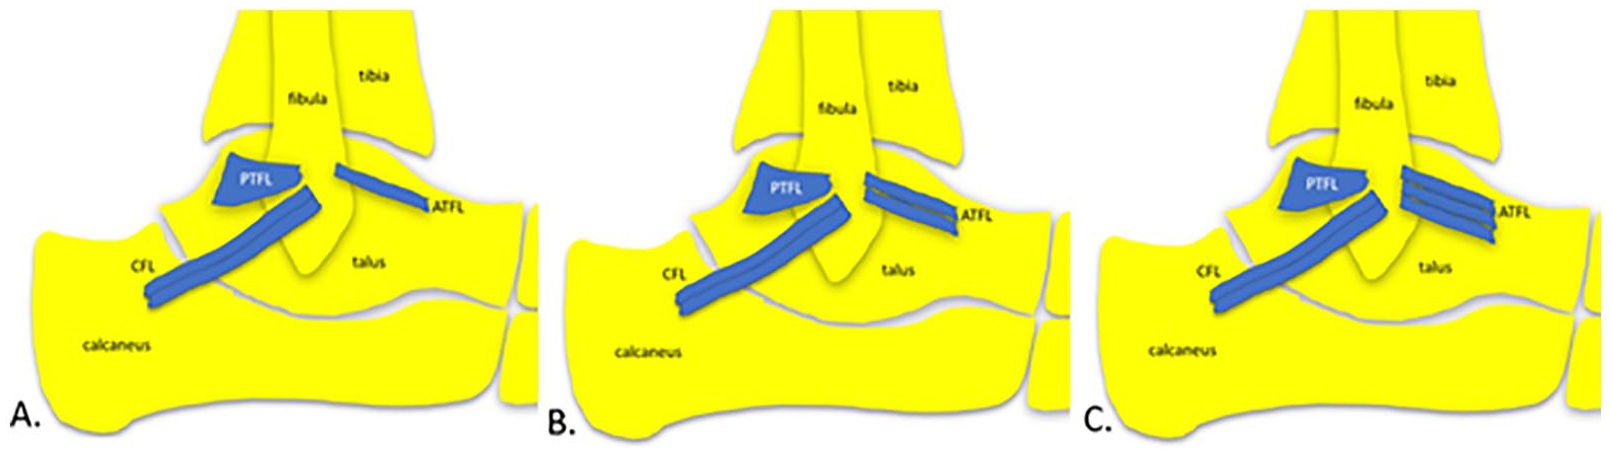
Banding configuration of the ATFL. (A) single, (B) double, and (C) triple ATFL bands. AITFL, anterior inferior tibiofibular ligament; ATFL, anterior talofibular ligament; CFL, calcaneofibular ligament; PTFL, posterior talofibular ligament.
Symmetry of ATFL bands between contralateral limbs is variably reported in cadaveric studies, and there is a paucity of imaging studies investigating ATFL band symmetry between asymptomatic uninjured contralateral limbs.21,22 One to three ATFL bands were identified in this study, and a double-banded ATFL morphology was the most common configuration seen (81%), followed by a singular ATFL band (15%). These findings describing a double-banded ATFL as the most common form, are consistent with previously published cadaveric studies where one to three ATFL bands were identified.23,24 In this study, the average ATFL band thickness was 1.84 ± 0.25 mm.
The CFL of the Lateral Collateral Ligament Complex
The CFL extends from the fibula to the calcaneus and spans both the talofibular portion of the talocrural joint and the subtalar joint. It provides stability to inversion and torsional stresses to both joints and restrains inversion of the calcaneus with respect to the fibula. 19 When the foot is progressively dorsiflexed, the CFL becomes tauter and plays a greater role in restricting inversion.25,26 During inversion injuries, the ATFL (primary restraint of inversion), is most often the first ligament of the LCLC to tear. 2 Severe inversion force, however, can cause further widening of the lateral joint space, resulting in a tear to the CFL. In acute ankle sprains, concurrent ATFL and CFL tears reportedly range in occurrence from 20% to 41% with isolated CFL tears being rarely reported.27,28
The anatomy of the CFL is more variably described than that of the ATFL, notably in its size, shape, orientation, attachments, capsular relation, and banding configuration. 26 It is located deep to the peroneal tendons and their sheath, and unlike the ATFL and PTFL, which are intra-capsular, the CFL is extracapsular and separated from the fibrous capsule of the ankle. 29 When the CFL is torn, fluid can extend through the ligament gap and fill the peroneal tendon sheath, which can be demonstrated sonographically. 3
The presence of multiple bands of the CFL is variably reported in anatomic studies, with many studies describing the CFL as having a single-banded morphology.30,31 Where a multibanded morphology of the CFL is reported, a single CFL band is predominantly identified (72%) followed by two (24%) and, lastly, three bands (4%). 31 The presence of multiple CFL bands can have clinical implications in cases of inversion injury, where individual CFL bands may be injured. In the current study, a double-banded CFL was the most common configuration identified sonographically (96%) which was followed by a single CFL band. In this study, the average sonographic thickness measure of a CFL band was 1.76 ± 0.27 mm.
The CFL sits very close to the lateral talocalcaneal ligament of the subtalar joint complex which runs parallel to the CFL and extends from the talus to the calcaneus. 32 The role, presence, and position of the lateral talocalcaneal ligament relative to the CFL are variably reported.33,34 The close proximity of these two ligaments may cause confusion on imaging following an ankle sprain, where, the lateral talocalcaneal ligament may be mistaken for an intact CFL. 3 The confusion can arise due to variability of the positioning of the lateral talocalcaneal ligament, which is described as either continuous with the CFL, or sitting anterior or posterior to the CFL (see Figure 8). 35
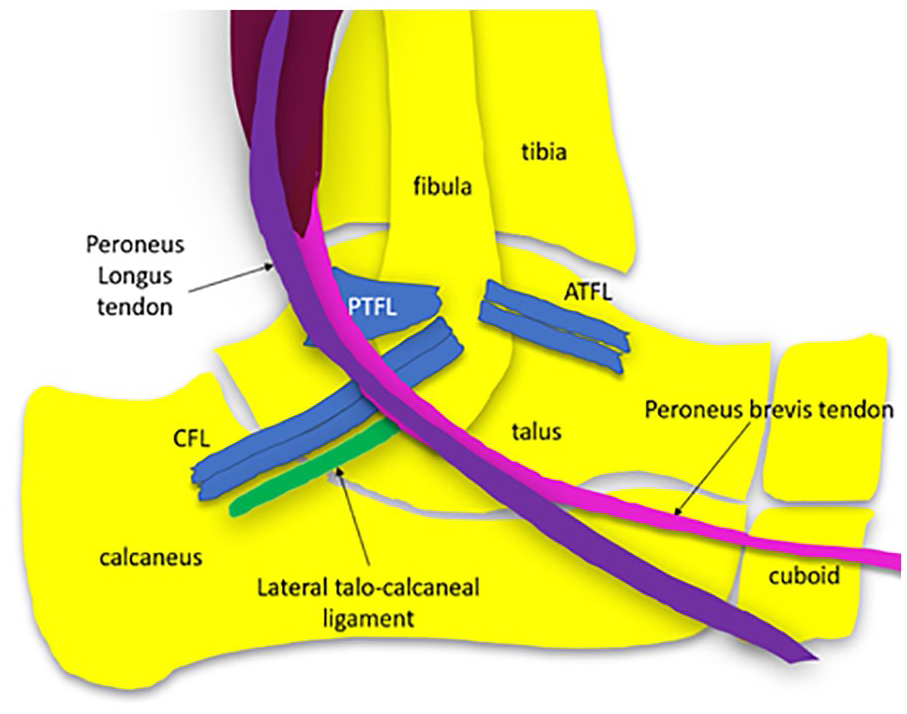
Anatomy of the CFL and relative position of the talocalcaneal ligament of the lateral subtalar joint complex. Multiple bands of the CFL may be present. The CFL sits deep to the peroneal tendons (longus and brevis) and their common sheath at that point. ATFL, anterior talofibular ligament; CFL, calcaneofibular ligament; PTFL, posterior talofibular ligament.
The AITFL of the Inferior Tibiofibular Syndesmosis
The distal tibia and fibula are stabilized by ligaments to form the inferior tibiofibular syndesmosis (ITFS). ITFS ligaments ensure the joint space between the distal tibia and fibula only widens by 1 mm during normal gait. 36 Sprains of the ITFS, commonly called a “high ankle sprain” or “syndesmotic ankle sprain,” usually occur when the ankle is externally rotated, with the foot in a dorsiflexed and pronated position. 37 The prevalence of syndesmotic ligament injury ranges from 1% to 18% in the general population, increasing to 12%–32% in an athletic population, and as high as 70% in professional hockey players. 38 The commonly accepted description of ligament components of the ITFS include the AITFL, posterior inferior tibiofibular ligament (PITFL), inter-osseous tibiofibular ligament and the inferior transverse ligament (see Figure 9). 39
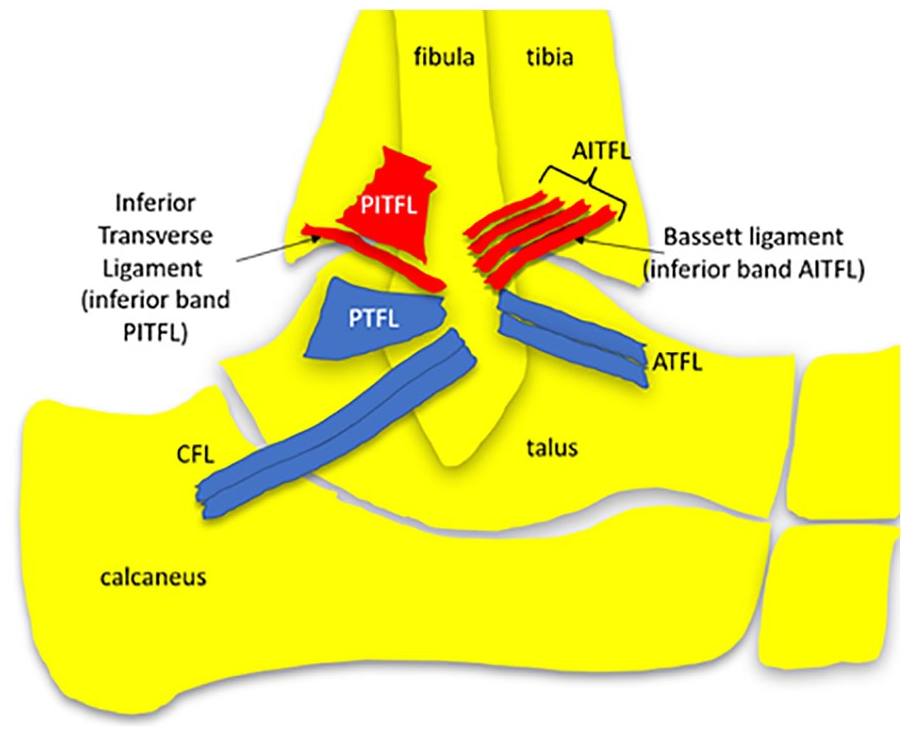
The ligamentous components of the ITFS. The AITFL, PITFL, and inferior transverse ligament (inferior band of the PITFL) are demonstrated in red. Multiple bands of the AITFL run in an oblique orientation between the distal tibia and fibula. The Bassett ligament is the most inferiorly located AITFL band. AITFL, anterior inferior tibiofibular ligament; ITFS, inferior tibiofibular syndesmosis; PITFL, posterior inferior tibiofibular ligament; PTFL, posterior talofibular ligament.
The multibanded AITFL is located on the anterior aspect of the ITFS and the main structure to prevent excessive movement of the fibula and external rotation of the talus. 40 It is the most vulnerable syndesmotic ligament to be injured. 40 When torn, it can cause the greatest amount of joint diastasis. 41 It is also given the most attention in terms of imaging, as it may require surgical treatment. The number of bands comprising the AITFL, attachment points, length, width, and thickness is variably reported.39,42 It extends from the anterolateral tibia (Chaput tubercle) to the anterior border of the lateral malleolus of the fibula. Multiple AITFL bands are separated by small gaps of varying amounts of fat and perforating vessels. 43
The AITFL bands are also termed fascicles, and a lack of consistent nomenclature causes confusion to clinicians and diagnosticians. 3 Collectively, the shape of the overall ligament is trapezoidal, with distal AITFL bands being longer and more dense. 43 The bands run from the tibia to the fibula in an oblique inferolateral direction, approximately 30°–50° to the horizontal. The most distal AITFL band, named the Bassett ligament, is independent of the other AITFL bands. It runs parallel to superiorly located AITFL bands and courses across the anterolateral aspect of the tibiotalar joint. It is longer and sits slightly deeper than the other AITFL bands. 32 The Bassett ligament is important to appreciate, as it is more prone to injury than other AITFL bands. 44 It can sit close to the lateral talar trochlear during dorsiflexion and become impinged.
In this study, three to four AITFL bands were identified using short-axis sonographic imaging. Three AITFL bands were the common configuration (85%), followed by four (15%), with findings consistent with previously published studies. 43 The average AITFL band thickness, when measured sonographically, is thinner than ATFL and CFL bands and measures 1.31 ± 0.34 mm. As the AITFL is very superficially located, it is possible that further bands were not able to be detected sonographically in this study with a 12 MHz transmission frequency transducer. Higher frequency hockey-stick transducers may sonographically detect further bands due to increased spatial resolution. 3
Contralateral Uninjured Ankle Ligament Band Thickness
No significant difference in sonographic measures of ankle ligament band thickness between contralateral uninjured limbs (P < .01) was demonstrated. Differences in ankle ligament band thickness were in the order of ±0.02 mm for the ATFL, ±0.05 mm for the AITFL, and the largest (±0.07 mm) for the CFL. Ankle ligament thickness is the dimension to be assessed and identified radiologically to alter with injury. This current study is the first, to the best of the authors’ knowledge, to sonographically investigate individual band thickness of the ATFL, CFL, and AITFL between contralateral uninjured limbs of the same person. Liu et al. investigated sonographic thickness measures of the ATFL between contralateral uninjured limbs (n = 10), identifying a 1% (0.02 mm) difference. 45 The thicknesses of individual ATFL bands, however, was not evaluated. 45 A difference in ATFL band thickness (±0.02 mm), identified in the current study is consistent with previous findings reported by Liu et al. 45
The differences in thickness between contralateral inferior bands of the ATFL and CFL did approach significance (CFL, P = .06, AITFL, P = .10). These differences in thickness between bands of contralateral limbs, however, are less than the resolution of the ultrasound image (±0.13 mm). Therefore, differences in ankle ligament band thickness between uninjured limbs of ±0.07 mm can be considered symmetrical between limbs of the same person without a history of an ankle sprain.
These findings would suggest that the current clinical use of the contralateral limb as an intra-subject control for sonographic assessment of ligament thickness is a reasonable practice. Using the contralateral limb as an internal control rather than comparing an injured ankle ligament thickness measure to a threshold value of uninjured ankle ligament thickness may avoid underestimation of ligament thickness differences associated with injury.
Factors that May Influence the Band Thickness of Uninjured Ankle Ligaments
It is important to consider factors, other than injury, that may affect ankle ligament band thickness in healthy, uninjured limbs such as age, level of physical exercise, height, weight, BMI, and sex. No significant correlation between age (in participants between the ages of 18 and 50 years of age) and healthy ankle ligament thickness was identified (P > .05). In skeletally mature adults, molecular age-related changes can cause structural changes in bone shape and geometry and can induce loss of skeletal muscle mass, reduced cartilage thickness, and degenerative changes in tendons, ligaments, and joint capsules. 46 The rate of muscle mass loss is reported to range from 3% to 8% per decade from age 30. 46 Furthermore, the tibial insertion of the anterior cruciate ligament of the knee has been shown to significantly differ in width and length with increasing age. 47 Differences in uninjured ankle ligament band thickness with increasing age, however, have not been previously investigated. In addition, hours of physical activity per week were not significantly correlated to ankle ligament band thickness (P > .05). Although tendon thickness may be increased in those with increased sporting activities due to the deposition of newly formed collagen fibers, no relationship between self-reported hours of physical activity per week and ankle ligament thickness was identified.
Furthermore, when comparing height, weight, and BMI with uninjured CFL and AITFL thickness, no significant correlation was identified (P > .05). However, some significant correlations of uninjured ATFL thickness with height, weight, and BMI were demonstrated (P < .05). The resultant r value from the bivariate analysis indicated a small correlation between height and BMI (r = .28) with ATFL band thickness and a medium correlation between weight and ATFL thickness (r = .38). 13 As r is strongly influenced by sample size, particularly sample sizes under 30, the sample size in this present study (n = 27) may have affected these results. In addition, the correlations of CFL thickness and height (P = .09) approached significance.
Numerous studies have shown that individuals with BMI indicative of being overweight, or obese, are at increased risk of ankle sprains48,49 and recurrent sprains, 50 but previous studies investigating an association between obesity and increased thickness of uninjured ankle ligament bands are lacking. It is possible that early degeneration of ligaments may be present in people with greater weight. Disorganization of collagen fibril bundles and subsequent thickening of lower limb tendons has been identified in obese rats. 10 Such changes are not yet appreciable on sonographic imaging but may result in an increase in ligament thickness. Hence, further investigation regarding the influence of weight on ankle ligament thickness using a larger sample size is warranted.
Mean sonographic ankle ligament band thickness measures were identified to be consistently greater in males than females, with differences in the order of ±0.23 mm for the ATFL and less for other ligaments (CFL: ±0.07 mm, AITFL: ±0.11 mm). However, no significant difference was demonstrated (P > .05) using independent samples t-tests. These findings are consistent with a previous study reporting a nonsignificant difference in ATFL thickness measures obtained via MRI (n = 21) between males and females, but the thickness of the ATFL in males was identified to be ±0.28 mm greater than that in females. 12 When considering the difference in ATFL thickness between sexes is approaching significance (P = .09), further investigation, using a larger sample size (n > 27) to investigate the difference in uninjured ATFL thickness between males and females, is warranted.
Limitations
The major limitation of this study was the research design and the sample size, which limits the interpretation of results, particularly in relation to the influence of sex, age, height, weight, and BMI on ankle ligament band thickness. The sample size was a convenience sample, and as ankle injuries are common, and participants were required not to have experienced an injury to either ankle in the past, several potential participants were excluded due to previous ankle injuries. Further imaging studies with greater sample sizes could be conducted to confirm the findings of bilateral symmetry of ligament banding and band thickness. In addition, the effect of age was only investigated in participants over the age of 18 years and up to 50 years of age. It is assumed that when children grow and their height changes, that ligament thickness would increase with height changes, but this has not been investigated in any studies to date and was not investigated in this current study and could be further investigated. The influence of aging over 50 years on ankle ligament thickness was also not investigated. Furthermore, there was no correlation between hours of physical activity per week and ankle ligament thickness, but the measurement of physical activity was via self-reported hours of physical activity per week. This, however, did not take into consideration the intensity and type of exercise, which may play a role in ligament thickness. Further investigation is warranted regarding physical activity levels and ligament thickness. The study also only evaluated three lateral ankle ligaments. These ligaments are more commonly sonographically assessed following an ankle sprain; however, other ligaments of the foot and ankle including those of the subtalar ligament complex and midfoot and medial collateral ligament complex can also be injured during an ankle sprain and can be sonographically imaged. Further studies to investigate the symmetry of banding and the size of these ligaments are required. In addition, further studies are recommended to investigate the relationship of CFL bands to the lateral talocalcaneal ligament of the subtalar ligament complex.
Conclusion
A structured sonogram and measurement protocol was used to identify the number of ankle ligament bands and measure their thickness in uninjured contralateral limbs of the same person without a history of ankle injury or surgery. Bilateral symmetry of the number of ATFL, CFL, and AITFL bands was consistently identified between right and left uninjured limbs using short-axis sonography. No significant difference between age and hours of physical exercise undertaken per week and uninjured healthy ankle ligament thickness was observed (P > .05). Weak significant correlations between height, weight, and BMI with ATFL band thickness were identified and required further investigation. The knowledge of ankle ligament band symmetry between uninjured limbs may be used to raise suspicion and/or inform the sonographic diagnosis of a complete ankle ligament band tear. When fewer bands are identified in an injured limb than in an uninjured contralateral limb, the suspicion of a complete band tear may be raised. This study demonstrated there was no significant difference (P > .05) in ankle ligament band thickness between uninjured contralateral limbs. This work would suggest that the current sonographic practice of comparison of ankle ligament thickness between limbs of the same person.
Footnotes
Declaration of Conflicting Interests
The author declared no potential conflicts of interest with respect to the research, authorship, and/or publication of this article.
Funding
The author received no financial support for the research, authorship, and/or publication of this article.
Ethics Approval
Ethical approval was gained for this study from the local human research ethics committee (Approval # 1700001161).
Informed Consent
Informed consent was obtained from all participants.
Animal Welfare
Guidelines for humane animal treatment did not apply to the present study because no animals were used.
Trial Registration
Not applicable.