
Abstract
Objective:
The aim of this study was to determine the efficiency of a fat-lesion histographic analysis (FLHA) to make a benign-malignant differentiation, for patients with a breast mass. In addition, it was important to examine the relationship between FLHA rates and Breast Imaging–Reporting and Data System (BI-RADS) scoring.
Materials and Methods:
This was a retrospective study conducted by examining the breast ultrasonograms (BUS) and histopathologic data of 76 women, having at least one solid breast mass. The patients were grouped according to their histopathologic diagnoses and BUS BI-RADS scores. The recorded digital gray-scale images were transferred to a workstation to quantitatively measure tissue echogenicity. The breast masses and adjacent adipose tissue were evaluated using the ImageJ analysis program, and gray-scale histographic analysis values were generated. The FLHA rate was determined by dividing the fat tissue histographic value by the mass-lesion histographic value. Statistical analysis was performed using this value as well as the patients’ histopathologic data and BUS BI-RADS score.
Results:
A complementary effect was noted using FLHA rates with the BUS BI-RADS criteria, and a statistically significant difference was detected between benign and malignant histopathology groups (P < .001). Similarly, the malignant histopathologic diagnosis with BI-RADS 4 and benign histopathologic diagnosis with BI-RADS 4 groups were related (P < .001). The correlation between BI-RADS criteria and FLHA rates demonstrated a significant difference between BI-RADS 3 and BI-RADS 5 (P < .001), and BI-RADS 4 and BI-RADS 5 for FLHA rates (P = .002).
Conclusion:
It was determined that using the FLHA rate was a complement to the BUS BI-RADS criteria. In this cohort, there was a statistically significant difference in predicting possible malignancy in all BI-RADS classes.
Histopathologic examination is the gold standard for diagnosis of breast pathologies and provides determination of pathogenesis, clinicopathologic correlation, and prognosis. 1 The Breast Imaging–Reporting and Data System (BI-RADS) is a classification system for reporting breast pathology encountered in radiologic imaging. This structured system provides standardization in mammography, breast ultrasonography (BUS), and magnetic resonance imaging reporting and facilitates a clear communication between the radiologist and other physicians. 2
The BI-RADS classification system includes 0 to 6 assessment categories. 3 BI-RADS 0 indicates an “incomplete assessment” that requires additional imaging evaluation and/or prior images for comparison. BI-RADS 1 refers to a “negative assessment,” that is a normal examination. BI-RADS 2 indicates “benign findings” that include secretory calcifications, simple cysts, fat-containing lesions, calcified fibroadenomas, implants, and intramammary lymph nodes. BI-RADS 3 refers to “probable benign findings” with a malignancy risk of less than 2%. This group includes probable benign masses such as circumscribed, oval-shaped, parallel oriented solid masses, and isolated complicated cysts. A BI-RADS 4 means a “suspicious abnormality” and covers a broad probability of malignancy, in the range of 2% to 95%. This category does not have the classic appearance of malignancy, but has enough suspicion for biopsy. BI-RADS 5 is “highly suggestive of malignancy,” which carries a greater than 95% probability of malignancy. Current management of BI-RADS 5 masses almost always involves tissue diagnosis of malignancy via percutaneous tissue sampling. BI-RADS 6 is used for “known proven malignancy.” This category is for examinations that provide post-biopsy evidence of malignancy.
BI-RADS categorization shows a high degree of agreement in describing breast lesions. However, there can still be significant inter-observer variability in practice.4,5 Although a short-interval (6 months) follow-up is required to determine stability in the BI-RADS 3 category, a biopsy may be performed due to risk factors such as advanced age and family history of breast cancer, which may increase unnecessary biopsy and patient stress. Subcategorizing BI-RADS 4 lesions is useful in determining the risk of malignancy, but studies have reported poor agreement between observers in the evaluation of particularly small masses in the BI-RADS subcategorization.4,6
Gray-scale histographic analysis quantitatively measures the echogenicity of the lesion to more objectively reflect the tissue heterogeneity, within the lesion. Histographic analysis is performed with a special medical software program after the BUS images are obtained and transferred to a workstation. This can analyze image information more objectively and provide a more reliable basis for the identification, classification, and prognosis assessment of benign and malignant tumors. It is believed that in addition to the findings that define the BIRADS category, gray-scale histographic analysis may also be used to determine whether or not a mass is benign.
In this study, the aim was to determine the efficiency of a fat-lesion histographic analysis (FLHA) to make a benign-malignant differentiation, for patients with a breast mass. In addition, it was important to examine the relationship between FLHA rates and the BUS BI-RADS classifications in deciding whether to perform tru-cut biopsy of a solid breast mass.
Materials and Methods
This was a retrospective study of 76 women, who were admitted and evaluated for a diagnosed breast mass, between January and October 2015. This cohort of patients had at least one solid mass in their breast. Any patients with a lesion that had a subcutaneous lipoma pathology report and lesions with insufficient gray-scale images (e.g., the sampling frame did not fully cover the adjacent adipose tissue, or images with motion artifacts) were excluded from this study. The patients’ demographic data, as well as age, were recorded. The patients’ gray-scale BUS images were recorded using a Hitachi Preirus (Tokyo, Japan) ultrasound equipment system and a 13-MHz linear transducer. The study cohort’s histopathologic data, for the same mass, were reviewed in the computer archive system.
The gray-scale BUS images were transferred from the ultrasound equipment system to a computer workstation. Gray-scale histographic analysis was performed using the ImageJ image processing program (National Institutes of Health, Bethesda, MD, USA) to quantitatively measure the echogenicity of the lesion. The BUS, biopsies, and histographic analyses were performed by the same expert radiologist, who had 5 years of breast imaging experience.
The measurement of the size of each breast mass was made during the BUS. Histographic analysis performed in ImageJ was obtained only for those BUS images that contained pathology. The histographic analysis was performed from only one BUS image, for each mass, which was of high quality and free of sonographic artifacts. The lowest histographic value was taken as 0 (black), and the highest histographic value was taken as 256 (white). The measurement was applied to the area of the mass and the surrounding fat tissue. In the area of the mass, no measurements were made that could damage the sensitivity or overall image quality (such as microcalcification, macrocalcification, and cystic areas). Measurements were made from a total of three different locations, and this required a distance of between 3 to 7 mm, from the mass, to meet the criteria (see Figure 1). A similar measurement was then repeated in the same dimension for the surrounding fat tissue that was associated with the lesion. The FLHA rate was found by dividing the fat tissue’s histographic value by the mass lesion’s histographic value. All measurements were repeated at least three times, and the average of these values were recorded, as the FLHA rate. With this value, statistical comparisons were made between the histopathologic data and US BI-RADS score. In addition, receiver operating characteristic (ROC) analysis was also done to evaluate the effect of FLHA rates for benign-malignant differentiation. Therefore, the findings obtained were evaluated in terms of the complementary effect of FLHA rates for BI-RADS criteria and the correlation between the BI-RADS classification and the FLHA rates.
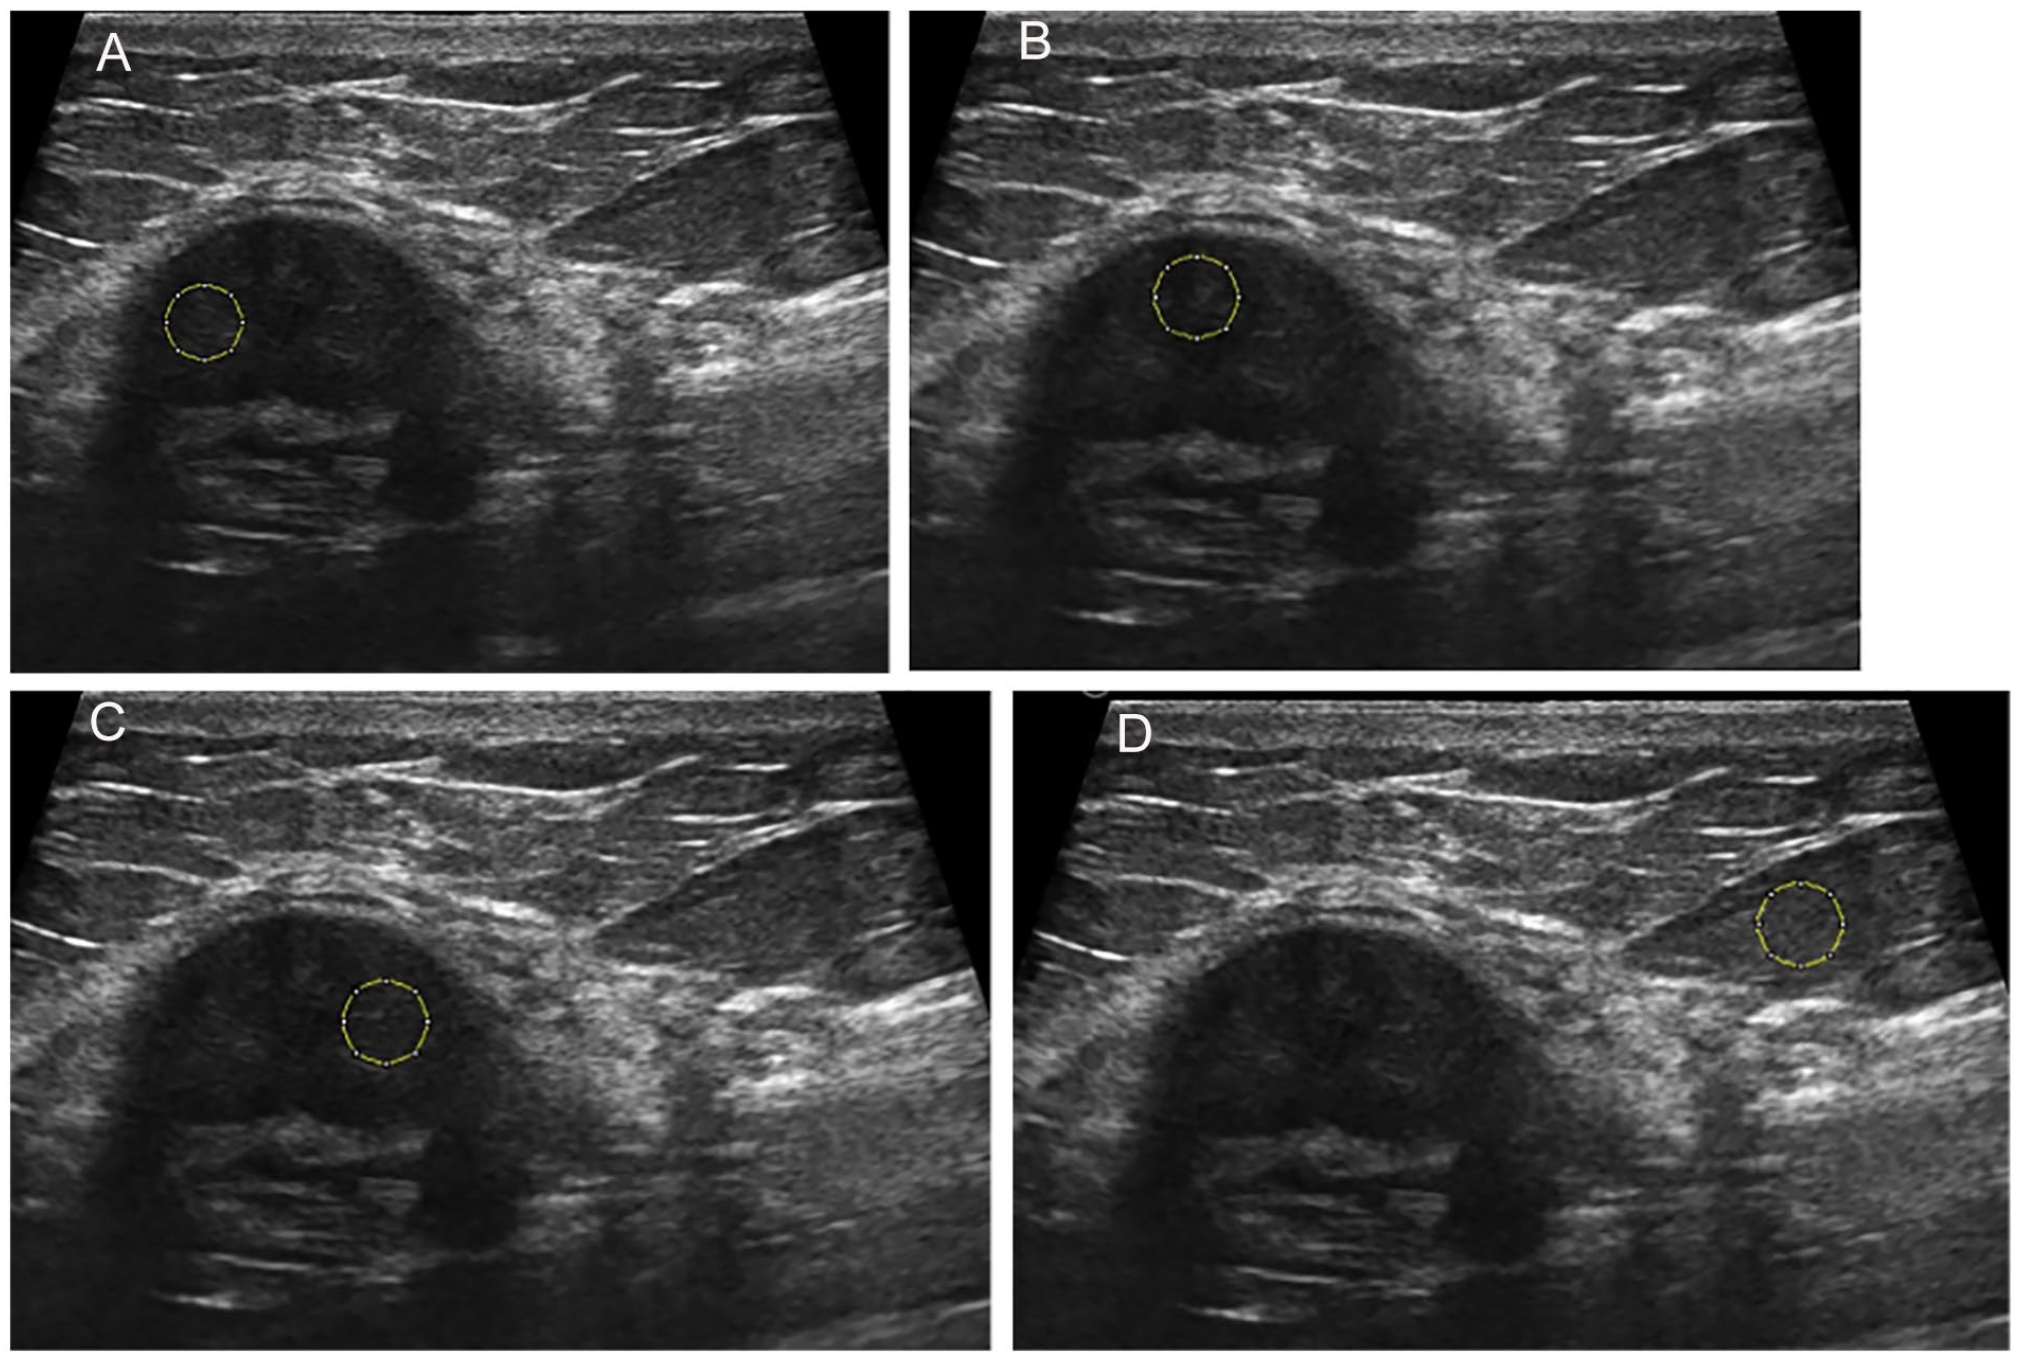
A measurement sample of a breast mass using ImageJ program. (A) demonstrates the placement of the first region of interest box, within the breast mass. (B) demonstrates the placement of the second region of interest box, within the breast mass. (C) demonstrates the placement of the third region of interest box, within the breast mass. (D) demonstrates the placement of the region of interest box, within the fatty tissue of the breast.
The BUS BI-RADS score was defined using five basic morphologic characteristics and orientation views. They were determined as shape, margin, orientation, echo pattern, and posterior features. Solid lesions that did not have any irregular shape, anti-parallel settlement on the skin, apparent acoustic shadow, indistinct, microlobulated boundary, or echogenic halo were evaluated as a BI-RADS 2. Solid lesions with circumscribed margins, oval shape, and parallel orientation were classified as a BI-RADS 3. Solid lesions with partially circumscribed margins were classified as a BI-RADS 4a. Those lesions with indistinct margins were classified as a BI-RADS 4b. Those with both indistinct margins and irregular shape were classified as a BI-RADS 4c. Solid lesions with spiculated, irregular shape were classified as a BI-RADS 5. Lesions, evaluated in terms of the BUS BI-RADS criteria, were classified according to the most malignant imaging feature.
Patients were grouped according to the histopathologic diagnoses and the BUS BI-RADS scores. Those who had a malignant histopathologic diagnosis were classified as group I and those with a benign histopathologic diagnosis were classified as group II.
In addition, a separate grouping was made among the patients with a BUS BI-RADS category 4. The patients with a BI-RADS 4, on BUS and malignant histopathologic diagnosis, as a biopsy result, were classified as group III. Patients with BI-RADS 4 on BUS and benign histopathologic diagnosis, as a biopsy result, were classified as group IV.
Statistical Analysis
Statistical analysis was made with the SPSS 20.0 Statistical Package Program. A chi-square test was used to compare categorical variables (e.g., comparing the BI-RADS groups with histopathology). A Mann-Whitney U test was used to compare the data that fell into two categories. The statistical significant was set for this analysis as P < .05, a priori.
In addition, the ROC curve was used to determine the diagnostic reliability of FLHA rates. The accuracy of FLHA ratios was determined by calculating the area under the curve. To differentiate benign and malignant lesions, a ROC analysis was performed and the cut-off FLHA rates were determined.
Results
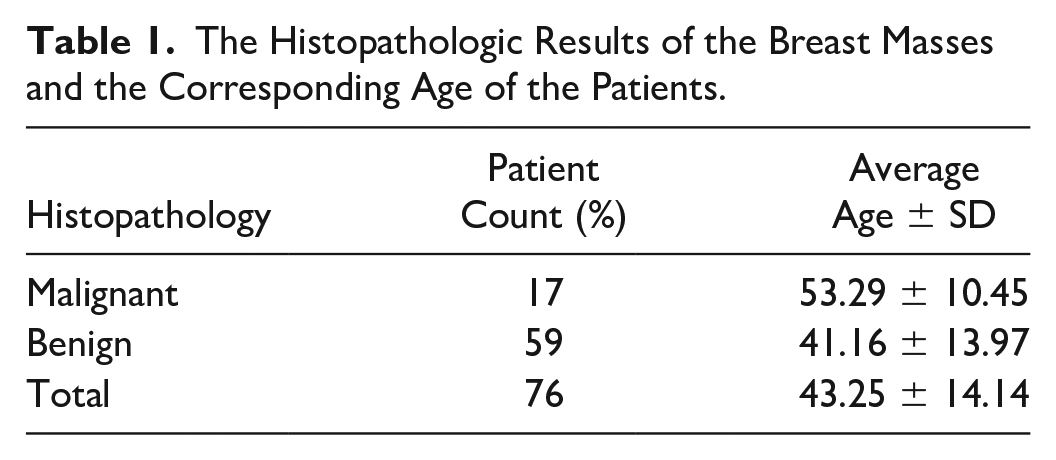
In this retrospective cohort study, the BUS from 76 patients were evaluated and the patients were between the ages of 18 and 71, with a mean age of 43 years. Age and the histopathologic distribution of the patients are provided (see Table 1). The internal echogenicity of the breast lesions was determined as hypoechogenic for all those lesions reviewed.
The Histopathologic Results of the Breast Masses and the Corresponding Age of the Patients.
The measurements of the cohort were grouped according to their histopathologic diagnoses, and it was determined that the average FLHA value for group I was 2.88 ± 0.65 (between 2.04 and 4.10). Similarly, in group II, the FLHA value was 1.55 ± 0.40 (between 0.86 and 2.36). The average FLHA value of group III was 2.94 ± 0.68 (between 2.06 and 4.10) and that of group IV was 1.51 ± 0.41 (between 0.86 and 2.35).
A statistically significant difference was detected between the FLHA rates in groups I and II. Also, there was a statistically significant difference detected between the FLHA rates of groups III and IV. Therefore, in this cohort, across all lesions, there was a statistically significant difference between the benign and malignant groups, in terms of FLHA rates (P < .001).
There were differences between the BI-RADS in the benign and malignant groups in terms of FLHA rates (see Table 2). When a correlation was run between BI-RADS classification and FLHA rates, no significant differences were detected between the patients with BI-RADS 3 and those with BI-RADS 4 (P = .981). However, there were significant differences between patients with BI-RADS 5 and those with BI-RADS 3 (P < .001) and 4 (P < .002).
The FLHA Rates in the Malignant and Benign Group in All BI-RADS Groups.
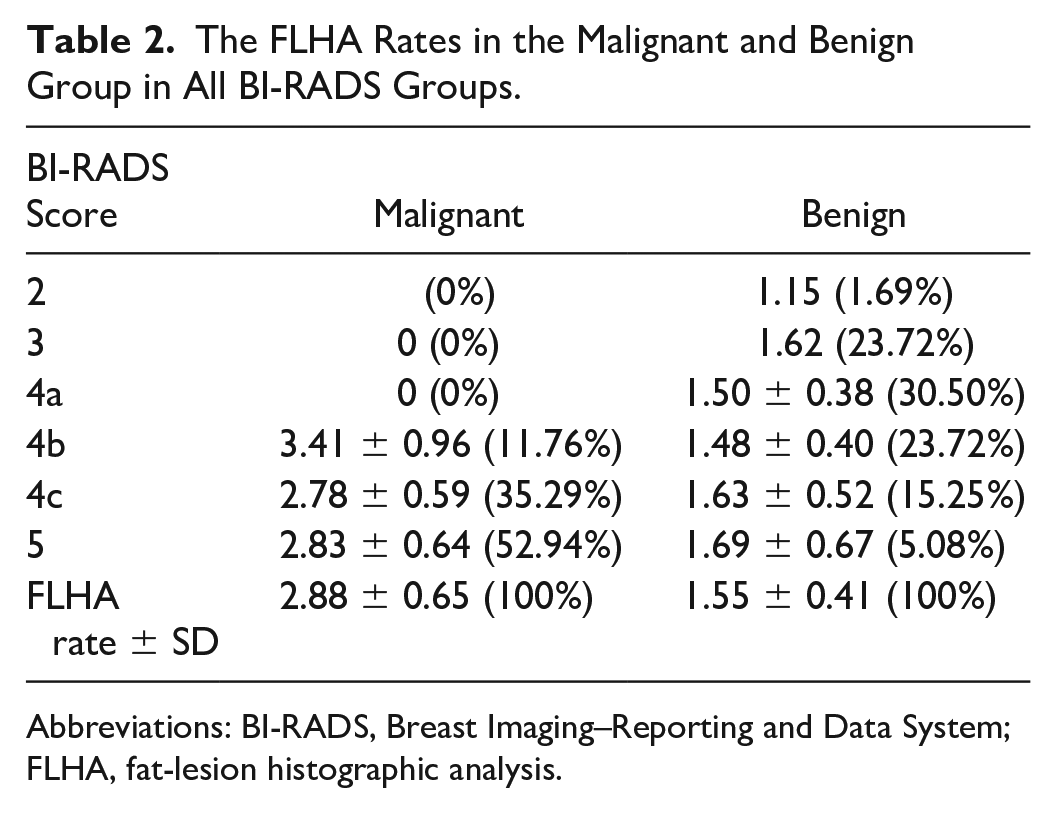
Abbreviations: BI-RADS, Breast Imaging–Reporting and Data System; FLHA, fat-lesion histographic analysis.
When ROC analysis was completed for those in the benign and malignant groups, the statistically significant cut-off value was 2.03. At this level, the sensitivity was 1, and the specificity was 0.864. Therefore, there were no lesions that were under this value in the malignant group. In the benign group, however, there were only seven lesions over this value (11.86%). Among these seven lesions, there were lesions in BI-RADS 3, 4a, 4b, 4c, and 5 categories.
When the ROC analysis was completed only for BI-RADS 4 lesions, the area under the curve was found to be 0.982, and the significant cut-off value was determined as 2.02. At this level, the sensitivity was determined as 1, and the specificity was determined as 0.857. In other words, there were no BI-RADS 4 lesions that were under this value in the malignant group. In the benign group, however, there were only six lesions (12.24%) at or above this level. Among these six lesions, there were lesions in the BI-RADS 4a, 4b, and 4c categories.
In all BI-RADS categories, there were only 11.86% of all benign lesions over the 2.03 cut-off value. In BI-RADS 4 category, there were only 12.24% of all benign BI-RADS 4 lesions over the 2.02 cut-off value. These rates demonstrated that FLHA rates, in this cohort, were successful in determining malignant lesions, when the appropriate cut-off value was used.
When the BI-RADS 4 subgroups were compared, it was determined that although there were significant differences between the benign and malignant groups, there were significant differences in terms of the FLHA rates when only the malignant or the benign group were compared (BI-RADS 4 subgroup) (see Table 3). Importantly, although the rate of all BI-RADS 4 lesions, in the malignant group, was 16.32% (positive predictive value) without using the cut-off value, the result was 57.1% when 2.02 cut-off value and above were used. There were four lesions in the malignant group that were found to be 57%. If the cut-off value was below 2.02, the rate of the BI-RADS 4 lesions in the benign group to all BI-RADS 4 lesions was found to be 100%.
The Percentages, FLHA Rates, and Positive Predictive Values Between All BI-RADS 4 Lesions, Within the BI-RADS 4 Subgroups.
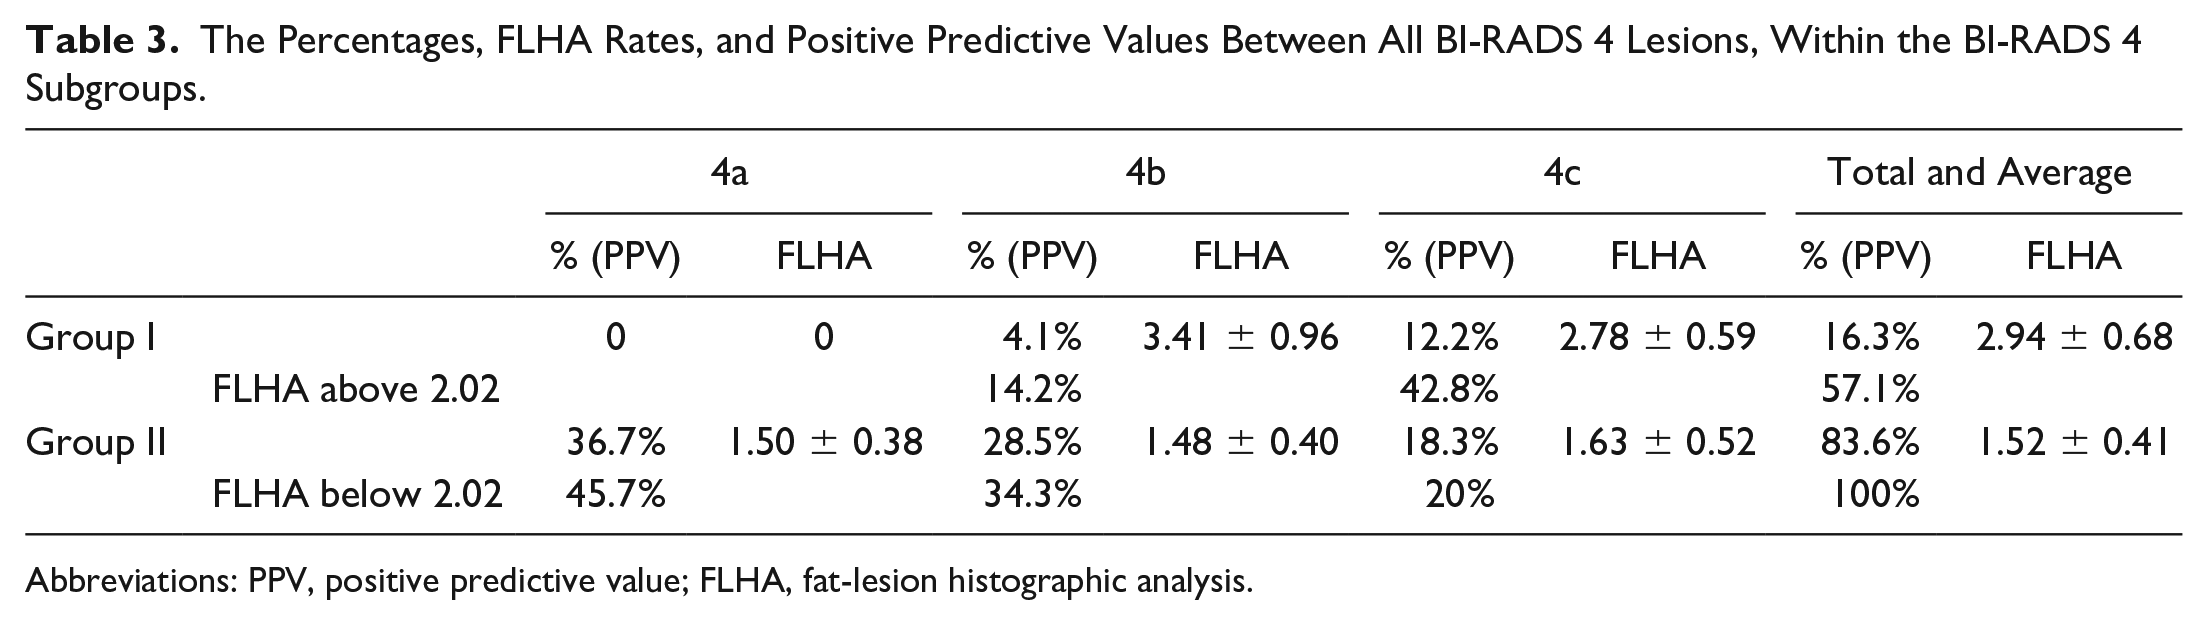
Abbreviations: PPV, positive predictive value; FLHA, fat-lesion histographic analysis.
Discussion
Some international guidelines recommend BUS as an additional examination, after mammography for screening, but it is not recommended as a primary modality for breast cancer screening.7–10 The main limitations in BUS screening are multiple false positives, causing additional examinations and biopsy, user dependency, device quality, procedure time, and cost problems. 7
Reducing the rates of unnecessary biopsies may be achieved by additional techniques that are used with US equipment systems. Among these are color Doppler, power Doppler, and sonoelastography, which can be used for solid breast lesions. 11 New studies such as the BUS BI-RADS score and the FLHA rate could contribute significantly to the distinction between benign and malignant and may provide optimum benefit in preventing unnecessary biopsies. 12 Where elastography is unavailable, FLHA rates may facilitate the process of deciding on the benign-malignant features of the mass, as well as performing a biopsy thereby contributing to the BUS BI-RADS system. 12
The echo pattern of a solid breast mass is an important finding according to sonographic and BUS BI-RADS criteria; based on a study conducted by Hong et al, 403 patients demonstrated no hyper-echogenicity in those malignant lesions. 13 However, hypoechogenic lesions may be in the malignant or benign group. Quantitative determination of the echogenicity rates of the lesions is important because echogenicity is a subjective finding in terms of sonography, which can vary by the interpreting physician. Instead, sonographic images could be analyzed with a computer program. Histographic values taken from the lesion and the adipose tissue, adjacent to the lesion, can be compared to obtain a more reliable and quantitative value.
If the relationship between the quantitative data obtained in the present study and the US BI-RADS criteria defined in the lesion is determined, histographic data analysis might be used as an auxiliary value in the definition of the US BI-RADS scores.
Erol et al 12 conducted a study with 55 female patients in 2012 and compared the sonographic features of 59 solid breast masses and gray-scale FLHA rates, between malignant and benign groups. The best cut-off value for a benign-malignat distinction was found to be 2.26, for FLHA rates (sensitivity = 0.933, specificity = 0.932). Below this value, it was determined that one (6.7%) lesion was found in the malignant group. Above this value, three (6.8%) lesions were found in the benign group.
In our study, the obtained results were similar compared with these values. In addition, when the ROC analysis was made for malignant and benign groups for all lesions without considering the BI-RADS scores, the statistically significant cut-off value was found to be 2.03, as well as a sensitivity of 1, and a specificity of 0.864. Therefore, there were no lesions below this value in the malignant group. In the benign group, conversely, there were only seven lesions (11.86%) that were above this value. Among these seven lesions, there were lesions that were in the BI-RADS 3, 4a, 4b, 4c, and 5 categories.
In the present study, although the average histographic values of the lesions were higher in the malignant and benign groups (benign = 61.76, malignant = 35.52), when the FLHA rates were evaluated, both of them were slightly lower in our study (benign = 1.55, malignant = 2.88). The fact that there were higher histographic values might be due to the device, or might be related to subjective causes; however, when the FLHA ratios were considered, the FLHA rates were found to be statistically significant but were slightly lower. This proves how important the measurement of surrounding fat tissue is in increasing the objectivity and reliability of the FLHA rate measurement. It also demonstrates that examining the FLHA rate is a logical and meaningful method to differentiate benign from malignant lesions.
In comparison with the present study, Erol et al 12 demonstrated that lesion FLHA rates were also determined and compared according to the US BI-RADS category. They found these to be effective, especially in differentiating benign-malignant with the help of US BI-RADS criteria. 12 However, in the present study, no malignant lesions were detected below 2.02, which was the cut-off value found in the statistical analysis, specifically made for the BI-RADS 4 group.
According to a limited review, there appears to be no other studies in which the US BI-RADS scoring and FLHA rates are correlated. Occasionally, diagnostic confusion might occur when using the US BI-RADS scoring. 14 In such a situation, it may be beneficial to consider the additional use of FLHA rates, as it could aid in the diagnosis and decision-making processes.
Limitations
This study has significant limitations due to the research design and a convienent sample of patients. The cohort was a rather limited sample size; therefore, larger studies are needed to increase confidence in these results. The cohort and design are limited; therefore, these results cannot be generalized beyond this sample. Another limitation was the histographic analysis being made over one single image, given the limited number of patients. Future studies evaluating larger patient groups and multiple images are needed to further strengthen the study results. Another limitation is that histographic analysis is completed retrospectively, and thus may be difficult in certain imaging facilities where staffing and time resources may not be available to perform an in-depth quantitative analysis, in addition to BI-RADS scoring. Also, future studies that evaluate the additional training and time to perform histographic analysis would be beneficial.
Conclusion
In a patient who presents with a suspected breast mass, together with a mammogram a, breast sonogram is very important in the decision as to whether or not the lesion is classified and biopsied. It is well-known that acting in line with the US BI-RADS criteria, a breast sonogram provides significant improvements and standardization in the follow-up and treatment processes. However, the BI-RADS criteria have some limitations, as is the case with any other diagnostic method. Therefore, biopsy is recommended especially for all BI-RADS 4 lesions, so as not to underestimate any potential malignancy. Although early diagnosis is very important in breast cancer, unnecessary biopsies may also have some patient risk. For this reason, using the FLHA rate as a support and complement to the US BI-RADS criteria may be important. In this limited study, it was found to be statistically significant in predicting possible malignancy in BI-RADS 4 lesions when proper cut-off values were used.
Footnotes
Declaration of Conflicting Interests
The authors declared no potential conflicts of interest with respect to the research, authorship, and/or publication of this article.
Funding
The authors received no financial support for the research, authorship, and/or publication of this article.
Ethics approval
This study was approved by the Scientific Research Ethical Committee of Afyon Kocatepe University, Afyon, Turkey.