
Abstract
Accurate, reliable, and easily obtainable quantification of peripheral arterial hemodynamic states has long been a holy grail of vascular ultrasound. While conventional Doppler modalities have been relied upon for decades to provide velocity, directionality, and flow volume data for integration into patient management schema, they carry limitations in accurately and reproducibly quantifying complex arterial hemodynamic patterns. Advances in ultrasound imaging architecture, such as virtual beamforming, integration of “big data” capabilities, and the use of enhanced digital signal processing methods have opened the door for a novel approach to arterial hemodynamic mapping and quantification—ultrasound vector flow imaging (VFI). This article presents an overview of the technological underpinnings of VFI, compares it with conventional pulsed wave and color Doppler methods, and describes the potential clinical benefits of this emerging vascular ultrasound modality.
Rationale for a New Technology
Accurate, reliable, noninvasive, and easily obtainable quantification of peripheral arterial hemodynamic states has long been a goal of vascular imaging. The role of ultrasound evaluation, ultimately, is to provide clinically relevant information about blood flow through an arterial conduit and outflow into a distal vascular bed. Two quantifiable values are required if these two objectives are to be met: measurement of discrete velocity values over the cardiac cycle at specified locations within an interrogated vessel and estimation of blood flow volume through an arterial conduit. The former values and associated ratios are most commonly used for grading stenoses; the latter are necessary in assessing adequacy of the conduit to deliver a measureable quantity of blood to the distal vascular bed or outflow vessel, that is, venous limb of an arteriovenous fistula (AVF) or lower extremity perfusion via an arterial bypass graft. Both values are dependent on accurate ultrasound-generated measurement parameters obtained from the vessel under interrogation.
While conventional Doppler modalities have long been relied upon to provide velocity, directionality, and flow volume data for integration into patient management schema, they carry limitations in accurately and reproducibly reflecting and quantifying complex arterial hemodynamic patterns. Because of technical constraints, associated primarily with the angle dependency and depth limitations of Doppler methods, quantitative measurements are prone to interoperator and interfacility value and reproducibility variations. In addition, constraints inherent with conventional beamforming methods and the 2D nature of acoustic data acquisition impact the accurate quantification of complex, 3D nonlaminar flow states. 1 Contrary to generally accepted hemodynamic theorems included in most sonographic educational curricula, flow patterns in cylindrical arteries, particularly at bifurcations and in poststenotic and tortuous regions, are not simply laminar in nature. Rather, under varying circumstances, they can assume complex 3D flow states that have been well documented in medical and scientific literature.2,3
Capturing and quantifying complex hemodynamic states that more accurately represent in vivo arterial blood flow profiles is paramount in evaluating and managing patients who present for vascular ultrasound examinations. Advances in ultrasound imaging architecture, such as virtual beamforming, integration of “big data” capabilities, and the use of enhanced digital signal processing methods, have opened the door for a novel approach to arterial hemodynamic mapping and quantification—ultrasound vector flow imaging (VFI). 4 This article presents an overview of the technological underpinnings of VFI, compares it with conventional pulsed wave (PW) and color Doppler imaging (CDI) applications, and describes the potential clinical benefits of this emerging vascular ultrasound modality.
Constraints of Conventional Doppler Methods
There are two primary underlying technological constraints inherent in current Doppler ultrasound methods that affect accuracy and reproducibility in attempts to quantify arterial hemodynamic states: Doppler angle dependency and complex arterial flow states.
Doppler Angle Dependency
As an integral variable in the Doppler formula, angle of insonation (cosθ) is a prime determinant of received Doppler frequency (fDop) (Figure 1A). Doppler frequency, after mathematical restatement of the Doppler formula, is the data point used in calculating blood flow velocity (v) (Figure 1B). Operator-related angle variables, particularly transducer position on the patient surface relative to the spatial course of the interrogated vessel and console control of angle correction, can introduce significant errors and variations in estimating blood flow velocity. This is particularly important in estimating absolute velocity values with pulse wave Doppler applications. In a seminal study published in 2002, investigators concluded that error estimates of maximum velocity typically range from 20% to 30% over in vitro controls even in the best of circumstances; these errors approach 100% as Doppler angle (cosθ) approaches 90°. 5 This actuality introduces generally acknowledged reliability and reproducibility concerns in vascular ultrasound protocols that rely on absolute velocities in their diagnostic schema. It also argues for development of an ultrasound-based modality that yields more accurate, reliable, and reproducible discrete PW Doppler-derived velocity values.
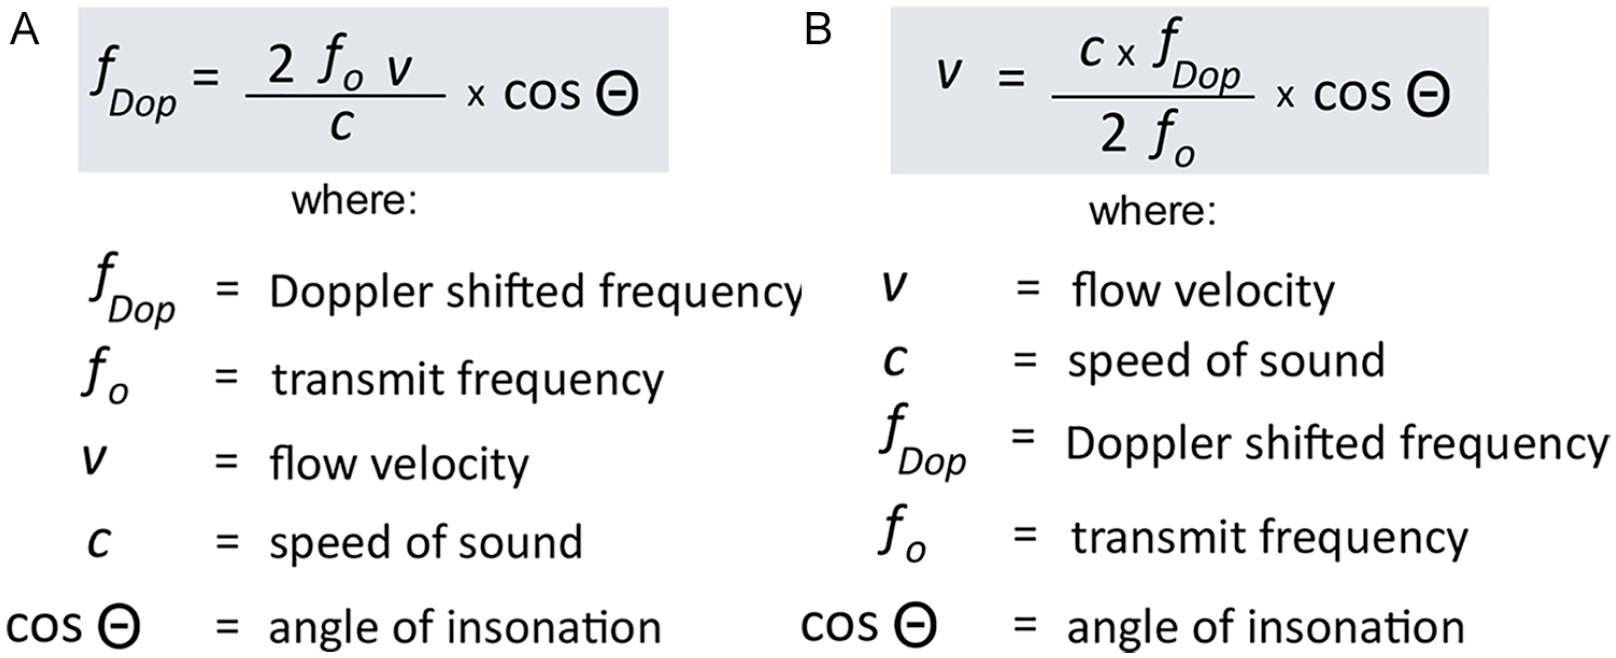
(A) Doppler frequency formula. (B) Mathematical restatement of Doppler equation to calculate velocity.
Doppler angle is also a known variable in accurately estimating blood flow volume (Vflow) values. Most contemporary ultrasound platforms estimate flow volume using the raw back-end data that are also used to display color Doppler images (CDI) on screen. Wide variations in received Doppler frequencies, part and parcel of the spectral broadening that occurs because of spatial and temporal velocity variations within the region of interest (ROI, “color box”), require a strategy for selection of an appropriate Doppler metric to be used in calculating Vflow values. 6 The industry standard, for the most part, uses time-average velocities, typically mean (TAMV) or maximum (TAMaxV) values, to do this (Figure 2). While CDI does not require front-end user input for “angle-correction,” frequencies comprising the received Doppler data set will still vary based on spatial position and relationship of the transducer to the interrogated vessel. Clearly, then, variations in operator methods and facility protocols can impact cosθ which, ultimately, impacts accurate and reproducible estimation of blood flow volume.
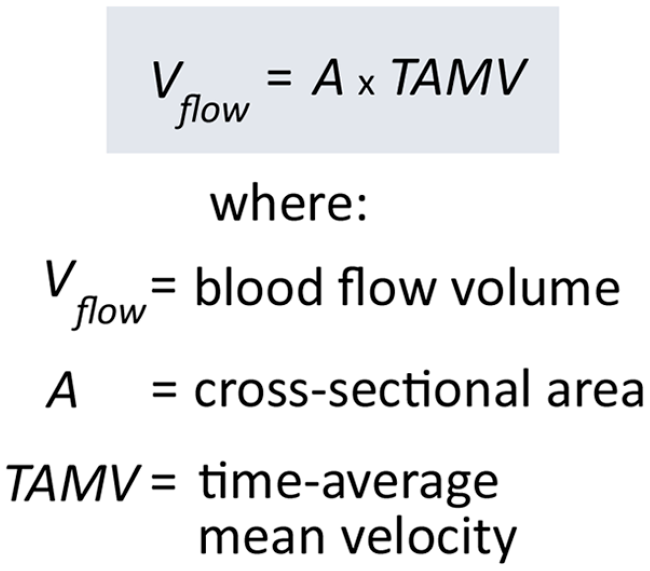
Flow volume formula.
Complex Arterial Flow States
Contrary to the generally accepted idea that normal peripheral arterial blood flow is simply laminar in nature, it is clear from extensive studies, both in vitro and in vivo, that blood flow in cylindrical arterial conduits is a complex 3D phenomenon. Vessel geometry and pulsatile flow conditions are the predominant factors that contribute to nonlaminar patterns which can include helical (spiral) flow, areas of flow separation, and turbulence. This is particularly true at bifurcations and in areas of vessel tortuosity. 7 As a study of carotid, iliac, and femoral arteries has shown, helical flow was the predominant pattern identified at bifurcations in a cohort of normal volunteers. 8 It is also recognized that arterial disease impacts hemodynamic patterns secondary to architectural remodeling and alterations in the physical and geometric properties of a vessel. 5
Helical flow consists of multiple rotational microstreams, or “helical ribbons,” present within a blood column as it courses through an arterial lumen. When geometric and pressure variations are present, for example, in the carotid bulb, flow reversal can be induced in some of these microstreams (Figure 3). Each of these “ribbons” possesses unique velocity and directionality characteristics which, when sampled as a unified whole, determine the Doppler signature presented when using conventional PW and color Doppler (CDI) methods. However, velocity (v) variations that occur over the cardiac cycle and directionality changes (cosθ) as microstreams “corkscrew” off-axis affect Doppler variables that cannot be captured using conventional diagnostic modalities. Current vascular ultrasound platforms are limited to detecting and displaying blood flow in two dimensions (x- and y-axes). The inability to capture hemodynamic activity in the third dimension (z-axis) is an inherent constraint of both PW and CDI quantification methods. Ultrasound VFI, using the methods described below, mitigates these constraints by capturing and processing a 3D data set that more accurately reflects complex local hemodynamic conditions.
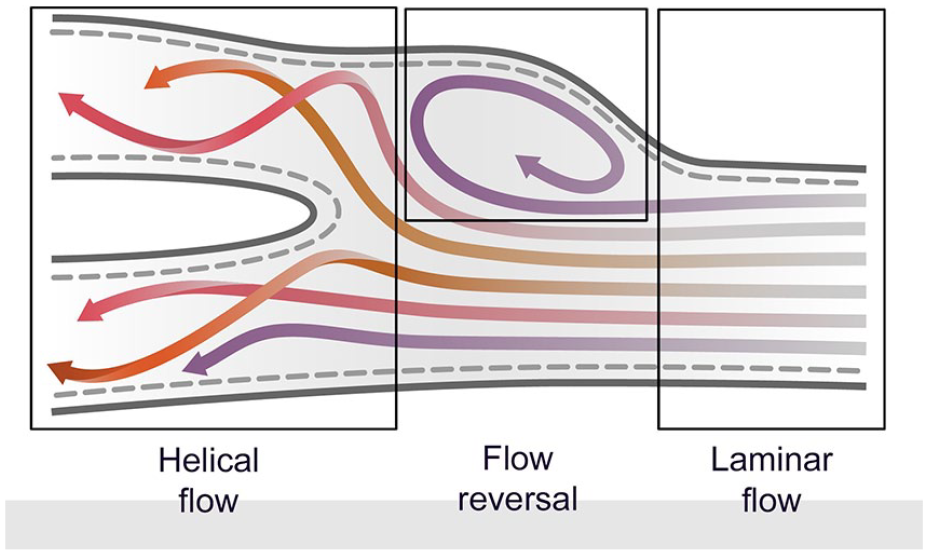
As relatively laminar flow approaches a bifurcation, individual rotational microstreams create a helical flow pattern (“helical ribbons”) each of which possesses unique velocity and directional characteristics. Geometric variations and pressure changes can induce a reversal of flow in some microstreams.
Ultrasound VFI
Definition
Ultrasound VFI is a novel noninvasive method of displaying global hemodynamic states within a defined ROI. Each vector, displayed in real-time as a small color-coded arrow, represents velocity, magnitude, and directionality associated with individual microstreams coursing within an arterial flow column. In contradistinction to CDI which displays a global image of hemodynamic states limited to 2D flow directionality and relative velocities within the ROI, VFI provides representation of 3D flow geometry and absolute velocity values present within the interrogated region. As such, VFI permits real-time assessment and quantification of complex arterial flow patterns and parameters absent the encumbrance and inaccuracies associated with conventional Doppler-generated data sets.
VFI Physics and Instrumentation
Over the past two decades, several engineering methods have been employed to generate vector flow images in attempts to create a modality useful in clinical vascular ultrasound practice. These include a multibeam method, transverse oscillation, color Doppler VFI, several pulsed Doppler spectral-based methods, and speckle tracking/particle velocity. 9 This article presents one approach to VFI instrumentation currently available on a commercially available ultrasound platform (Mindray, Resona 7) that integrates several of these methods into a single application: speckle tracking, multibeam, and transverse oscillation.
Speckle tracking
Ultrasound speckle refers to the interference patterns created when an acoustic wavefront interacts with many, tiny (subresolution) scatterers within an insonated area. In vascular ultrasound applications, these scatterers are red blood cells (RBCs) suspended within hemodynamic microstreams coursing through an artery. Widely used in echocardiographic studies to assess myocardial deformation and left ventricular dynamics, speckle tracking provides information about changes in position, location, and concentration of scatterers present within a sampled area over time. 10 Speckle data are a function of wavelength and amplitude of the transmit beam, and concentration of scatterers within the sampled region. Unlike Doppler data, speckle is not reliant on an insonation angle to yield a usable acoustic data set, thereby eliminating one of the error-producing variables inherent in quantifying arterial hemodynamics.
The ability to track the movement of speckle-generating RBCs is based on the hypothesis that the echogenicity of stationary soft tissue surrounding the RBCs (arterial walls and extravascular structures) remains essentially constant from one image frame to the next. Alterations in data patterns within the ROI, then, represent speckle activity. Using cross-correlation and other temporal domain comparison algorithms, change in location of the scatterers within the vessel can be mapped over time. 11 Accurate speckle tracking requires a very high back-end frame rate, one not achievable with conventional line-by-line channel-based data acquisition and processing methods. These extremely high frame rates (≥1200 fps) can be achieved using advanced ultrasound imaging methods and the multibeam method described below.
Multibeam VFI
Multibeam VFI relies on the use of multiple acoustic wavefronts transmitted at different angles to derive and quantify hemodynamic information. Using several temporally noncoherent plane waves, the exact location of individual speckle signatures can be determined at different points in time. The received speckle data are stored in channel domain memory and analyzed using a variety of proprietary software algorithms to plot flow variables at defined points within individual microstreams. Simplistically, change in speckle position along the horizontal (x) axis permits determination of flow directionality, while application of the range equation (velocity = distance/time) and other data compounding methods permits estimation of velocity of individual flow “ribbons.” 12 These hemodynamic variables are then displayed visually as individual flow vectors (Figure 4).
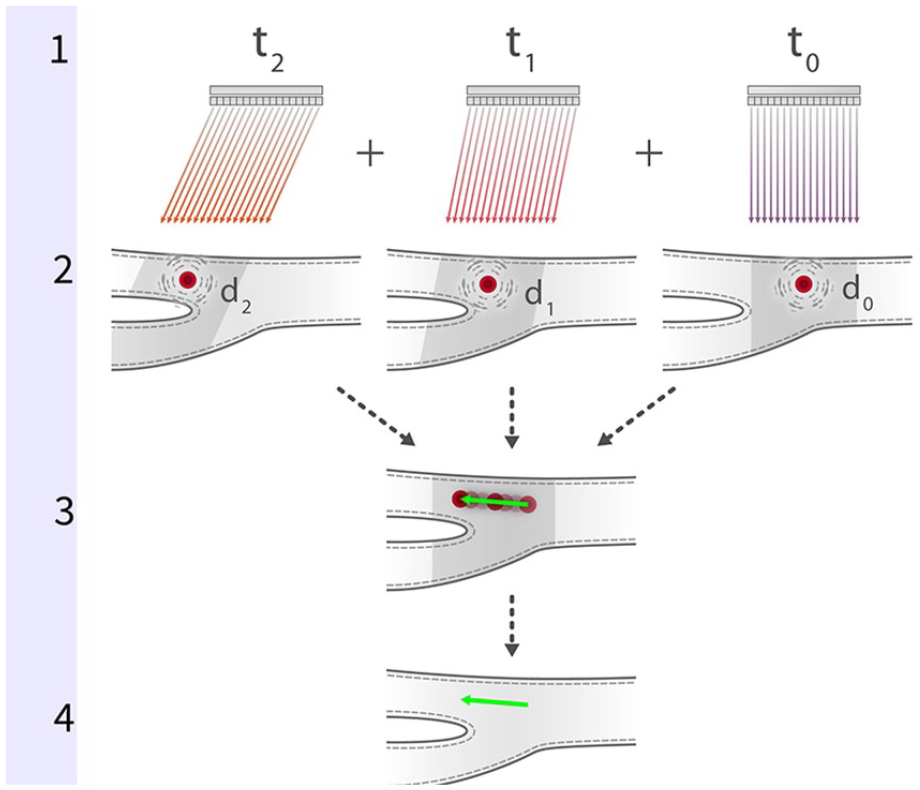
Several temporally noncoherent plane waves (t0–t2) are transmitted at different angles into the flow column (1). Changes in location (d0–d2) of speckle-generating scatterers are captured and stored in channel domain memory (2). On-board software algorithms are used to analyze and correlate the received speckle data; change in speckle position relative to transmit angle over time permits determination of flow directionality and velocity (3). Data are displayed visually as individual flow vectors (4).
As mentioned above, extremely high frame rates are required for accurate speckle tracking of arterial hemodynamic states. This capability has been precluded by inherent limitations of conventional ultrasound imaging architecture, most notably, line-by-line channel-based data acquisition, Doppler-associated angle dependence, and depth (Nyquist limit) constraints. 13 These limitations can be overcome by using plane waves and virtual beamforming methods described elsewhere. 14 In plane wave imaging (PWE), all elements in the transducer array are excited at the same time. The resulting unfocused transmit wave insonates the entire imaging field simultaneously generating a received acoustic set that contains the speckle data used in the creation of multiple back-end frames. As they are not constrained by channel-related architectural considerations and focusing delays, plane wave–based methods can generate a frame rate equal to the pulse repetition frequency of the ultrasound system, which, even when interrogating deep anatomical structures (up to 30 cm), can be as high as 25 000 fps (25 kHz). 15
Transverse oscillation
To overcome limitations in displaying and quantifying complex hemodynamic patterns present in 3D in vivo arterial blood flow, a method known as transverse oscillation is integrated into the VFI method described in this article. 16 Introducing an acoustic oscillation transverse to the axial beam direction makes it possible to estimate velocity in off-axis, nonlaminar microstreams. Sampling fields placed orthogonally (90°) to the incident beam are used to capture speckle data generated in these regions. Various data processing algorithms, such as timing delays, apodization, and in-phase quadrature detection methods, are then applied to this data set which yields directional and velocity values within the lateral components of each microstream. 17 This acquisition of a 3D data set permits a more realistic display and more accurate quantification of complex flow states (Figure 5).
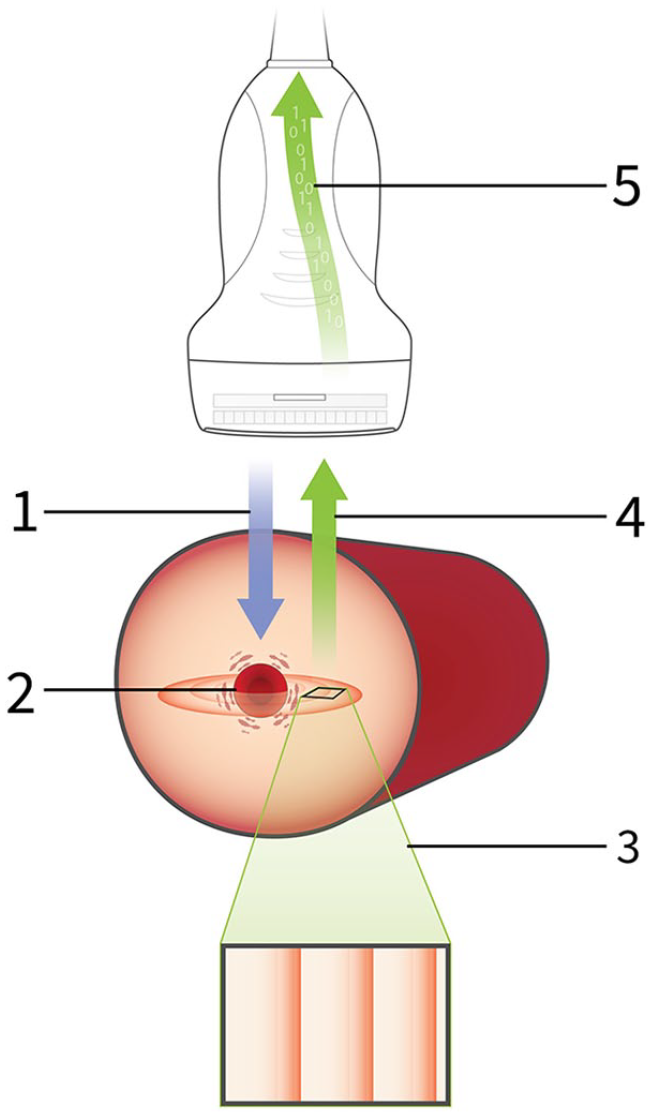
Transmitted acoustic energy (1) impinges upon a red blood cell (2) causing it to oscillate at 90° to incident. Speckle data are acquired by sampling fields placed orthogonally to these oscillations (3). The returning data (4) are received by the transducer (5) and, using various enhanced data processing methods, are used to determine directional and velocity values within the lateral components of each microstream.
Vector interpretation
Each individual vector in a VFI frame represents directionality, magnitude, and absolute velocity values present at a specific location at a given point in time when the data were captured. Interpretation of a VFI image, then, requires an understanding of the flow variables presented and a rethinking of the meaning of a color-coded ultrasound hemodynamic display. The variables encoded on each flow vector are described here and demonstrated in the accompanying illustration (Figure 6). The key difference to keep in mind when interpreting a VFI image, in contradistinction to a CDI image, is in the meaning of the color attached to the vectors. In a CDI image, base colors (i.e., red, blue) indicated direction of flow relative to the transducer, while gradations and saturation within each base color (i.e., light red to dark red, light blue to dark blue, etc.) indicate relative velocity.
Velocity: In VFI images, color hue (as shown on the color bar) represents velocity at a specific point within the microstream. It is not related to flow direction at all. As the velocity value for each vector is determined by the speckle tracking methods described above, it represents an independent absolute value, not a relative value as is displayed in a CDI image.
Directionality: Flow direction, toward or away from the transducer, is represented by the arrowhead at either end of the vector line. A left positioned arrowhead indicates flow toward the left margin of the ROI; a right arrowhead indicates flow toward the right margin.
Magnitude: Magnitude (amplitude) of flow represents the concentration of speckle scatterers present at each discrete vector point. As described above, VFI speckle scatterers are RBCs. Therefore, magnitude is the volume of blood coursing along each sampled location within the microstream. It is represented by the length of the arrow tail.
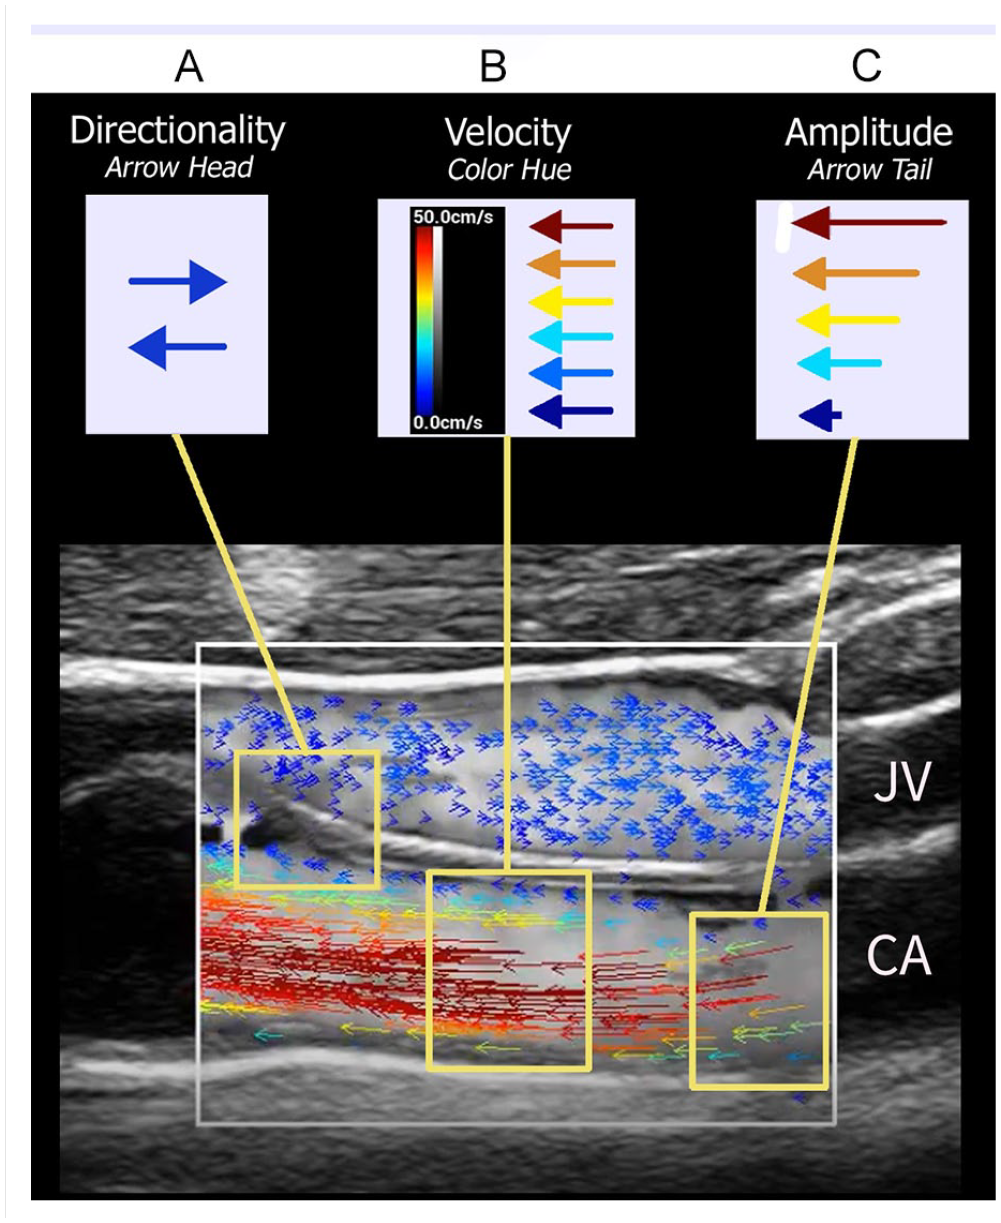
Vector interpretation. Longitudinal image through the carotid artery (CA) and jugular vein (JV) captured during systole demonstrating hemodynamic variables represented by ultrasound vector flow imaging. (A) Flow directionality: Direction of arrowhead indicates direction of flow relative to transducer placement. Note blue arrowheads in JV are pointing to the right indicating flow toward the patient’s feet, while blue arrowhead in the CA are pointing to the left indicating flow toward the patient’s head. (B) Flow velocity: Color hue of each vector indicates absolute flow velocity determined by speckle tracking methods. In this example, slower arterial flow (blue) is observed adjacent to the intimal surface with increasing velocities (dark red) mapped toward the center of the bloodstream during systole. Note all arrowheads are directed to the left consistent with the carotid arterial flow toward the head. There is relatively constant slow flow (blue) in the adjacent JV. (C) Amplitude: Concentration (volume) of scatterers at each vector location is indicated by arrow tail length. As one would expect, a greater volume of blood is coursing through the center of the stream during systole. Compare tail lengths of red vectors with blue vectors; longer tail lengths in center of stream versus shorter tail lengths near vessel wall.
VFI examples
As discrete vector arrows provide precise information about microstreaming events within a flow column, VFI permits confident identification and description of complex arterial hemodynamic patterns. As described above, helical flow consists of multiple rotational microstreams, or “helical ribbons,” present within a blood column. The presence and exact directionality of each of these “ribbons” are displayed by vector arrowheads, a flow pattern that cannot be displayed with CDI methods (Figure 7).
V Flow image—helical flow. Vector arrowheads demonstrate rotational microstreaming associated with helical flow patterns in the internal carotid artery.
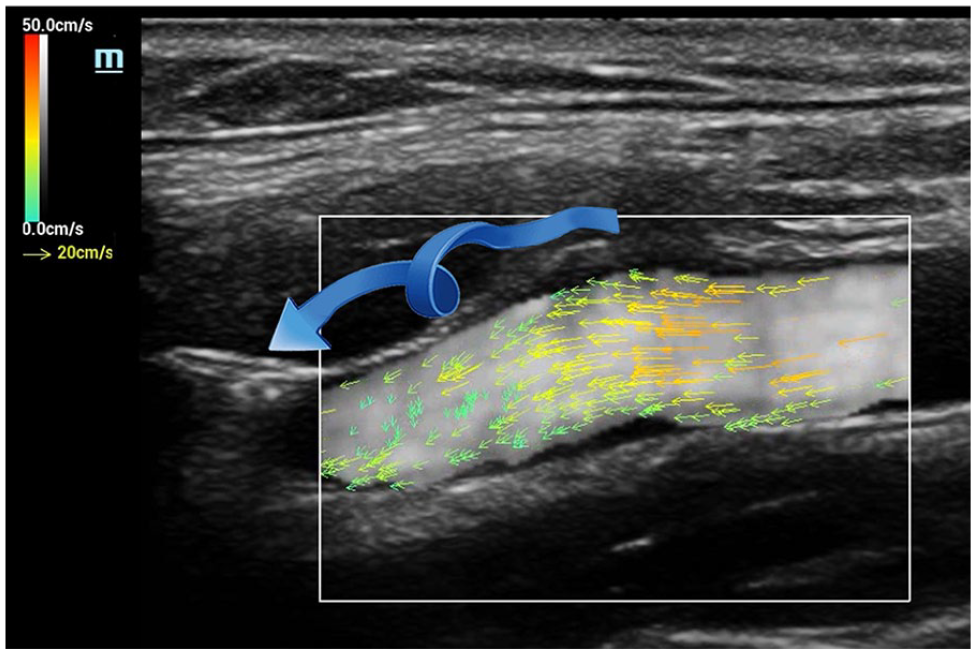
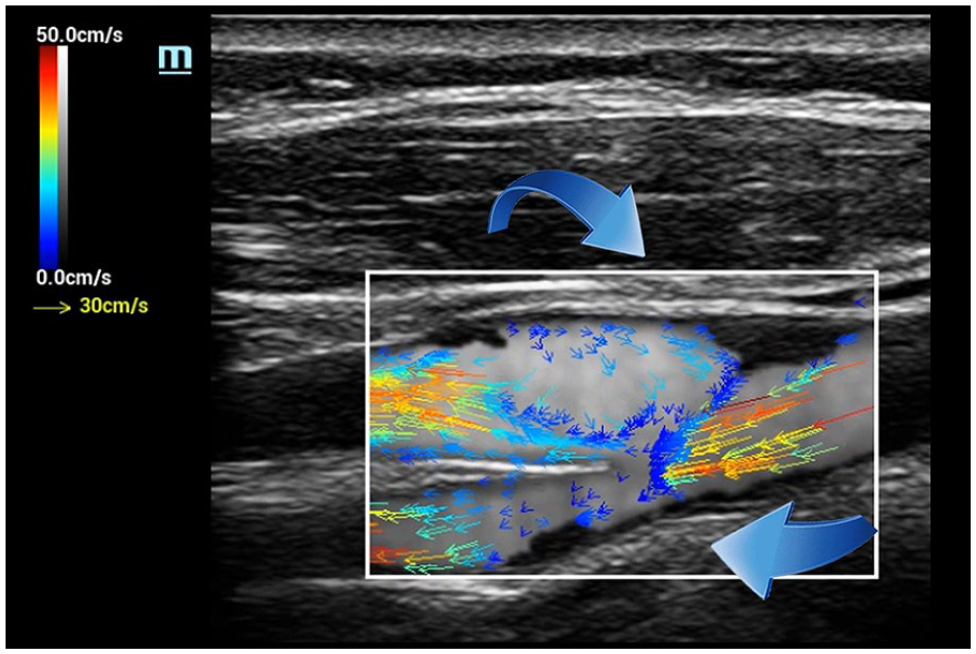
Flow separation, the result of architectural and pressure changes associated with areas of arterial expansion, such as is seen at bifurcations, is routinely demonstrated with CDI. However, reversal of individual microstreams within the area of separation is more distinctly defined with VFI (Figure 8). Turbulent flow, the chaotic breakdown of predictable flow patterns into randomly directed microstreams jetting about within a vessel, is also nicely demonstrated with CDI. Again, however, VFI provides a more exact delineation of individual hemodynamic events occurring within the turbulent pool (Figure 9). In each of these examples, as individual vectors are encoded with absolute velocity values, quantification of flow parameters within the ROI is an achievable possibility.
V Flow image—flow separation. Architectural and pressure changes in the carotid bifurcation result in an area of flow separation (reversal) in the bulb presented as lower velocity (blue) vectors with arrow heads pointed to the right, while main flow column arrowheads are directed to the left (toward the patient’s head).
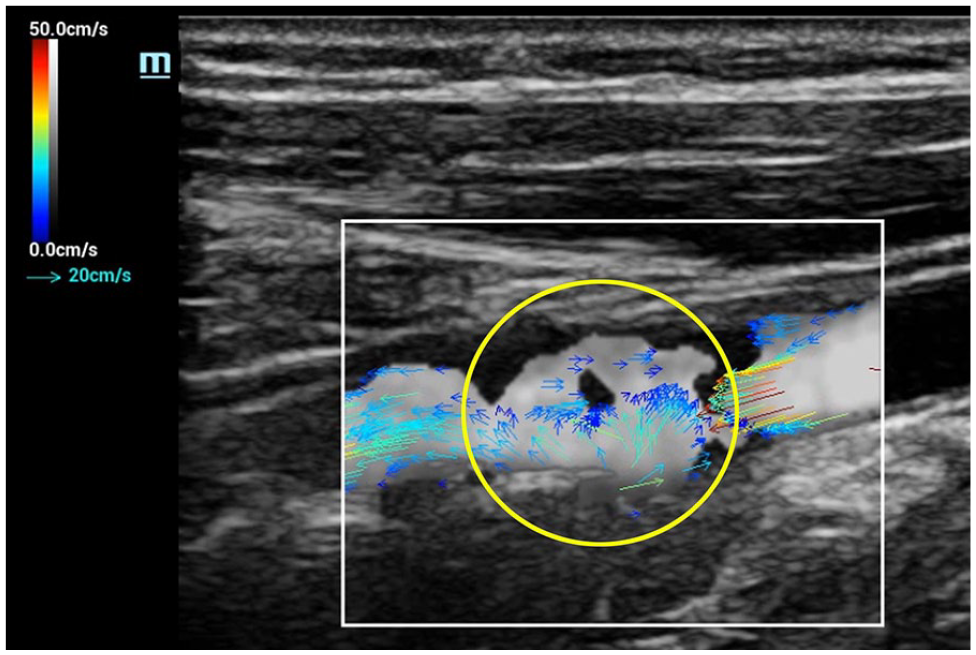
V Flow image—turbulence. Randomly directed microstreams, displayed as multidirectional vector arrowheads, identified within an area of poststenotic turbulence in the proximal internal carotid artery (yellow circle).
Data and application validity
While ultrasound VFI offers the potential for a quicker, more user-friendly, and accurate method of obtaining and quantifying peripheral arterial hemodynamic states, several caveats must be entertained. First, as an emerging technology, the accuracy and clinical utility of the quantitative data obtained must be ascertained. Until larger studies, both in vitro and in vivo, can be conducted to validate discrete velocity values, these numbers cannot be used interchangeably with long-standing and well-established values obtained using spectral pulsed Doppler methods. For instance, VFI velocity values cannot, as of this writing, be used to replace spectral Doppler values used in grading a carotid stenosis. Nor can VFI flow volume estimations be used to replace those currently used in scenarios where these values are integral to patient management decisions. Second, while potential applications in routine clinical practice do include quicker and more reliable identification of highest velocity jets in areas of focal arterial stenoses; estimation of arterial wall shear stress; and improved evaluation and surveillance of arteriovenous fistulae, VFI protocols and data output must undergo rigorous, large, multicenter trials to establish the efficacy and validity of this emerging sonographic modality.18,19
Conclusion
Simple, accurate, and reliable quantification of arterial blood flow has long been a desired output of clinical vascular ultrasound evaluation. Inherent constraints imposed by the physical principles of Doppler ultrasound and conventional sonographic imaging architecture have precluded full realization of this goal. VFI, which utilizes several advanced ultrasound instrumentation methods, is an emerging technology that offers the potential for overcoming conventional reliability, accuracy, and reproducibility limitations. Clinical utility and efficacy of VFI in specific vascular applications has yet to be demonstrated. As it currently stands, VFI can complement CDI and spectral Doppler measurements in certain clinical scenarios. However, additional multicenter clinical studies on large and diverse patient populations must be conducted before VFI can be accepted as a diagnostic standard.