
Abstract
Objective
The index of maximal systolic acceleration ([AImax]: maximal systolic acceleration of the Doppler waveform divided by peak systolic velocity) shows diagnostic accuracy in screening of renal artery stenosis. This study aimed to determine whether an upstream factor of resistance, such as aortic valve stenosis (AVS), can affect Doppler parameters detected in the peripheral arteries.
Methods
In this prospective study, we measured the AImax in non-stenotic renal interlobar arteries of 62 patients with AVS. Patients were divided into three groups on the basis of severity of valvulopathy as follows: mild-to-moderate AVS (M-AVS; n = 24), intermediate AVS (I-AVS; n = 15), and severe AVS (S-AVS; n = 23) based on Nishimura’s criteria.
Results
The AImax in the renal parenchymal arteries was significantly lower in the S-AVS group (8.9 ± 3.6 s−1) than in the M-AVS (15.3 ± 3.8 s−1) and I-AVS groups (16.7 ± 5.2 s−1). The AImax was positively correlated with the aortic valve area and inversely correlated with the tranvalvular aortic pressure gradient. After aortic valve replacement, the AImax significantly increased from 10.7 ± 4.0 s−1 at baseline to 19.3 ± 4.4 s−1.
Conclusions
Proximal resistance can lead to diagnostic bias of Doppler parameters that are applied in the diagnosis of peripheral vasculopathies, particularly in renal artery stenosis.
Introduction
In ultrasonographic study of peripheral hemodynamics, in addition to measurement of blood velocity at the systolic peak and end-diastole, semi-quantitative parameters for examining the morphology of the flow wave have diagnostic importance. These parameters include pulsatility and systolic acceleration indices. These parameters are useful for hemodynamic study of high-resistance musculoskeletal areas and low resistance, self-regulated areas, such as cerebral and renal areas.
Renal artery stenosis (RAS) locally dampens the flowmetric parameters that are used to examine pulsatility and systolic acceleration of the Doppler curve in the renal vascular bed. A reduction in the index of maximal systolic acceleration (AImax) of blood in the renal interlobar arteries, which is caused by local dampening of the pulse wave, shows diagnostic accuracy for significant RAS in terms of a negative predictive value. The AImax is useful for screening, but has a relatively low specificity.1–3 However, at every level of the arterial tree, the cycle flow shape is determined by interaction of the hemodynamic profile upstream and downstream, and at a distance from the observation point.4,5
Proximal hemodynamic resistance, such as aortic stenosis, can affect the aortic stiffness, the aortic pulse wave, and vascular impedance. 6 In turn, aortic stiffness affects both systemic and local peripheral vascular impedance, and consequently, affects the profile of the flow cycle of peripheral vessels. Therefore, we hypothesize that an upstream focal resistance, such as aortic valve stenosis (AVS), acts on peripheral flow in a similar way as local stenosis. Consequently, in the renal circulation, AVS could cause diagnostic inaccuracies during ultrasonographic screening for RAS, generating false positive results in non-stenotic kidneys.
Previous evidence on systemic hemodynamic and peripheral flow disturbances caused by the presence of a factor of resistance even more proximal to the peripheral area under investigation, such as AVS, is modest.7–9 These previous studies only focused on evaluation of changes induced by AVS on stiffness, vascular remodeling, and endothelial function of the aorta, without providing a contribution to the effects on peripheral hemodynamics. In a retrospective pilot study, we evaluated the implications of AVS per se in determining attenuation of renal parenchymal flowmetric indices, while being applied in ultrasonographic screening for RAS. 3 We observed that the presence of AVS was the only predictor for the unexpected reduction in the AImax in non-stenotic kidneys. Therefore, the current study aimed to confirm this observation in an ad hoc prospective study. Specifically, we aimed to determine whether, and to what relative degree, the presence of AVS is able to modify the profile of the peripheral flow cycle, with attenuation of the systolic acceleration phase in renal parenchymal arteries (RPA). We also aimed to examine whether correction of an aortic valve defect determines hemodynamic re-coupling of pulse wave transmission to the peripheral circulation.
Materials and methods
Patients and cardiological stratification
Patients who received a new diagnosis of AVS in our Cardiological Unit and met the inclusion/exclusion criteria (see below) were enrolled between January 2016 and January 2018. All patients underwent routine diagnostic and clinical work-up required for the valvulopathy process until their addition to the operating list for aortic valve replacement, if such was indicated.
The degree of valvulopathy was stratified by echocardiographic scan according to Nishimura’s Cardiological Guidelines. 10 Nishimura’s D3 group was defined as having a low valve area, but without a severe increase in the transvalvular pressure gradient. This represents a prognostic gray area in terms of the intention-to-treat function. Therefore, the D3 group has been categorized as a distinct cluster of an intermediate degree of aortic stenosis. Nishimura’s C2 and D2 groups (AVS associated with a reduced left ventricular ejection fraction) were excluded from the study to avoid a possible bias effect on peripheral hemodynamics determined by decreased left ventricular contractility. Combining clinical, echocardiographic, and exclusion/inclusion criteria (see below), we identified three groups of patients on the basis of the overall severity of the valvular defect as follows: mild to moderate AVS (M-AVS), intermediate AVS (I-AVS), and severe AVS (S-AVS) (Table 1).
Stratification of the degree of AVS into three groups of severity based on Nishimura’s criteria 10 and after meeting the exclusion/inclusion criteria.
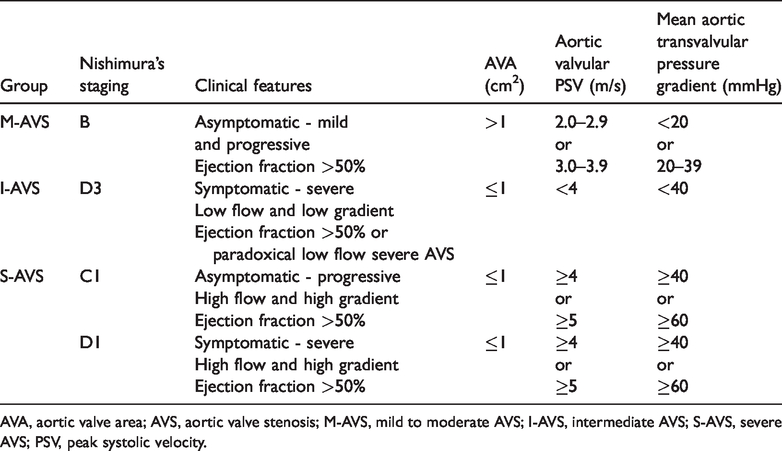
AVA, aortic valve area; AVS, aortic valve stenosis; M-AVS, mild to moderate AVS; I-AVS, intermediate AVS; S-AVS, severe AVS; PSV, peak systolic velocity.
For each patient, details of age, any history of previous or current smoking, and body mass index were recorded. Comorbidities with a potential effect on the cardiovascular system and pharmacological history were identified. Blood tests were performed to evaluate the following: hemoglobin levels, serum creatinine levels, relative GFR (Modification of Diet in Renal Disease), cholesterolemia, uricemia, and glycated hemoglobin levels.
Hemodynamic study
Within 2 weeks immediately following cardiological work-up, the enrolled patients underwent hemodynamic studies of the peripheral circulation using color Doppler ultrasound and tonometric techniques. Sonographers were blind with regard to cardiologic stratification of the aortic valvulopathy. All peripheral hemodynamic evaluations were performed with patients in the supine position at a constant room temperature of 24°C. Because critical systemic atherosclerosis was among the exclusion criteria, the ankle/brachial index (ABI) and carotid sonography were preliminary investigations. Patients who underwent aortic valve replacement were re-evaluated at 3 months and 1 year after the intervention.
Doppler examination
In the enrolled patients, flow velocity curves were successively recorded in the following regions: RPA at the level of the superior, inferior, and mesorenal pole in each kidney (data are expressed as the average of three measurements in both kidneys); the renal artery at the ostium and trunk for excluding local stenosis; and the perirenal abdominal aorta. Flowmetric curves were acquired by an expert sonographer using the color Doppler technique (Toshiba XG; Toshiba, Osaka, Japan), with a multi-frequency linear probe for superficial vessels and multi-frequency convex for splanchnic vessels. Steering was suitable for a scan angle of <60°, the sample volume in the center of the vessel was equal to two thirds of the vessel size, and the spectral Doppler trace speed was set to two cycles/video frame. The resident beamformer software traced the sequence of the peak frequencies on the Doppler spectra and depicted the velocity curve cycle in which the Doppler parameters were calculated as previously described.1,2 The AImax was calculated as maximal acceleration of the flow waveform in early systole divided by peak systolic velocity.1,2
Tonometric examination
The carotid intima–media thickness was also recorded at the far wall of the distal common carotid artery in the last 10 mm before the bulb. Measurement was performed by the resident beamformer software on the basis of tracking of pixels of the echo interface.
In the same hemodynamic setting, arterial tonometry was performed with a PulsePen device (code WPP001-ET/WPP001-ETT; DiaTecne, Milan, Italy). Pulse wave velocity (PWV), the augmentation index (AIx), central arterial and peripheral pressure (from which the values of mean central arterial and peripheral pressure were derived), the central and peripheral pulse pressure indices 11 , and heart rate were calculated. A tonometric pulse wave was detected using the two-stroke method, as triggered by electrocardiographic derivation, at the level of the common carotid, humeral, and femoral arteries.
Exclusion criteria
To eliminate potential sources of bias concerning the relationship between valvular dysfunction and changes in peripheral hemodynamics, patients were excluded on the basis of having the following: pre-existing valvular or vascular aortic prostheses; associated cardiac valvulopathies with a greater degree than mild (aortic insufficiency, mitral insufficiency, or stenosis); atrial fibrillation; significant left systolic ventricular dysfunction (left ventricle ejection fraction <50%); post-infarct ischemic heart disease with changes in ventricular kinetics; carotid artery stenosis >50%; stenosis of the renal arteries; renal transplantation; renal failure stage >III of the 2002 National Kidney Foundation Kidney Disease Outcome Quality Initiative Staging or hemodialysis; stenosis or aneurysm of the aorta at every level; and obstructive lower limb arterial disease of Fontaine degrees III to IV and/or an ABI ≤0.80 or ≥1.30.
Ethical statement
This study was approved by the local ethical committee (Comitato Etico Regionale Unico della Regione Friuli Venezia Giulia – Italy; approval no. 8, 12 January 2016). Informed written consent was obtained from all patients included in the study.
Statistical analysis
Among patients who were stratified by the severity of AVS on the basis of the revised Nishimura classification, the distribution of peripheral hemodynamic parameters was computed by analysis of variance. Peripheral hemodynamic parameters were correlated with echocardiographic parameters by using simple and multiple linear regression using the respective continuous distributions. Using logistic regression, we tested the associations of a reduced AImax in the RPA with the degree of aortic stenosis, systemic hemodynamic, tonometric, anthropological, and organ function parameters, and comorbidities. The cut-off value for low or high levels of the AImax in the RPA was defined as the intermediate point between the value of the nadir (mean minus 1 standard deviation) of the aggregated M-AVS plus I-AVS groups and the zenith (mean plus 1 standard deviation) of the S-AVS group. The behavior of peripheral hemodynamic parameters in patients undergoing correction of valvular disease was analyzed using the Student’s t test for paired two-tailed data. Statistical analysis was performed using Stat View for Windows 5 (SAS Institute Inc., Cary, NC, USA).
Results
Of the 86 patients who were newly diagnosed with AVS during the study period, 62 met the inclusion/exclusion criteria and were enrolled in the study. Twenty-four patients had M-AVS, 15 had I-AVS, and 23 had S-AVS (Table 1). There were no significant differences in sex, the prevalence of arterial hypertension, dyslipidemia, diabetes mellitus, and smoking, and the distribution of vasoactive drug therapy among the three groups of AVS (Table 2). There were also no significant differences in age, body mass index, the ABI, glycemic control (glycated hemoglobin levels), lipids, hemoglobin, cholesterolemia, the glomerular filtration rate, carotid–femoral PWV, central mean arterial pressure, and central and peripheral pulse pressure indices among the three groups of AVS (Table 3).
Distribution of discrete variables among the groups of the degree of AVS.

AVS, aortic valve stenosis; M-AVS, mild to moderate AVS; I-AVS, intermediate AVS; S-AVS, severe AVS; ACEIs, angiotensin-converting enzyme inhibitors; ARBs, angiotensin II receptor blockers.
Distribution of continuous variables among the groups of the degree of AVS.

SD, standard deviation; AVS, aortic valve stenosis; M-AVS, mild to moderate AVS; I-AVS, intermediate AVS; S-AVS, severe AVS; BMI, body mass index; Hb, hemoglobin; HbA1c, glycated hemoglobin; GFR, glomerular filtration rate; LDL, low-density lipoprotein; HDL, high-density lipoprotein; CCA IMT, carotid intima–media thickness, PAMc, central mean arterial pressure; PPIc, central pulse pressure index; PPIp, peripheral pulse pressure index; PWV, pulse wave velocity; AIx, augmentation index.
Patients in the M-AVS group showed a significantly higher mean carotid intima–media thickness than those in the S-AVS group (p = 0.005, Table 3). The mean AIx tended to be lower in the I-AVS group than in
The mean transvalvular aortic pressure gradient and aortic valve area showed significant covariation with the AImax in the RPA and the perirenal abdominal aorta (Figure 1). The AImax was significantly lower in the S-AVS group than in the M-AVS and I-AVS groups in the RPA and the perirenal abdominal aorta (all p < 0.05). However, there was no significant difference in the AImax between the M-AVS and I-AVS groups in either of these areas (Table 4).

Correlation matrix and simple regression graphs of the AImax measured at the renal parenchymal arteries (full circles) and perirenal aorta (open circles) versus the echocardiographic parameters that define the degree of aortic valve stenosis. AImax, index of maximal systolic acceleration; RPA, renal parenchymal arteries.
Distribution of the AImax in the renal parenchymal arteries and in the perirenal aorta in the three groups of the degree of AVS.

AImax, index of maximum systolic acceleration; SD, standard deviation; AVS, aortic valve stenosis; M-AVS, mild to moderate AVS; I-AVS, intermediate AVS; S-AVS, severe AVS.

Variations in the AImax in the perirenal aorta and renal parenchymal arteries in 19 patients with severe aortic valvular stenosis at 3 (T3m) and 12 (T12m) months from correction of the valvular defect versus the pre-intervention values (T0). Graphs on the left show mean ± standard values (see also Table 6). Diagrams on the right show variation after 3 months for individual patients. AImax, index of maximal systolic acceleration.
The intermediate RPA-AImax value of the range between the nadir of the M-AVS + I-AVS groups and the zenith of the S-AVS group was 11.3 s−1. In logistic regression (Table 5) of the various anthropometric, clinical, and hemodynamic parameters that might be pathophysiologically associated with renal hemodynamics, only the presence of aortic stenosis in the S-AVS group was predictive for the AImax of the RPA below the cut-off of 11.3 s−1 (p = 0.005).
Logistic regression for predictors of an AImax ≤11.3 s−1 in the RPA.
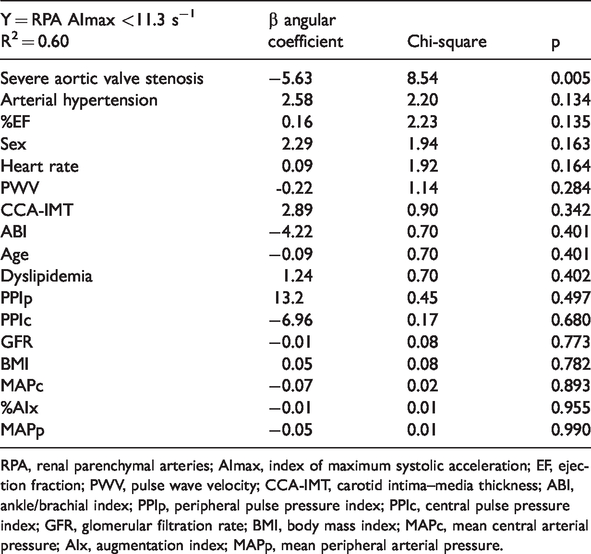
RPA, renal parenchymal arteries; AImax, index of maximum systolic acceleration; EF, ejection fraction; PWV, pulse wave velocity; CCA-IMT, carotid intima–media thickness; ABI, ankle/brachial index; PPIp, peripheral pulse pressure index; PPIc, central pulse pressure index; GFR, glomerular filtration rate; BMI, body mass index; MAPc, mean central arterial pressure; AIx, augmentation index; MAPp, mean peripheral arterial pressure.
Of the 23 patients with severe aortic stenosis, 19 underwent effective surgical or percutaneous aortic valve replacement. This replacement was defined as clinically effective if echocardiographic follow-up at 3 and 12 months post-surgery showed the combination of an aortic valve area >1 cm2, a mean transvalvular aortic pressure gradient <20 mmHg, and aortic peak systolic velocity <2 m/s. The AImax was re-evaluated at 3 and 12 months. Compared with baseline, the AImax was significantly increased at 3 months, before remaining constant at 12 months in renal and aortic vessels (all p = 0.005, Table 6, Figure 2).
Variation of the AImax of the renal parenchymal arteries and the perirenal aorta in 19 patients with severe aortic valve stenosis who were subjected to prosthetic surgery to correct the valve defect.

Values are mean ± standard deviation. AImax, index of maximum systolic acceleration; T0, evaluation at baseline; T3m, evaluation at 3 months; T12m, evaluation at 12 months. The Student’s two-tailed t test for paired data was used.
The average magnitude of variation in the AImax after correction of the valvular defect in individual patients was greater in the renal vessels than in the aorta (Figure 2).
Discussion
The profile of the peripheral flow cycle is a mirror that reflects the numerous mechanical, hemodynamic, and rheological determinants that act in synergy in the region under examination, as well as at a distance from this region.2,5 Arterial vessels of resistance have a polyphasic hemodynamic profile and are strongly conditioned by local vascular impedance, of which vascular resistance is the major determinant. However, in regional vascular conductance, the viscoelastic properties of large arteries, along with transmission and reflection of the pulse wave, are the main determinants of vascular impedance. If local vascular resistance mainly determines the diastolic component of the flow profile, the systolic acceleration phase is more affected by transmission of the anterograde pulse wave.
For more than a decade, the AImax has successfully been used for ultrasonographic screening of RAS.1,2 Recently, the diagnostic role of the AImax in detecting resistors (i.e. what determines local resistance) in a high resistance vascular bed was found. This finding was reported in an in vitro model 12 and in the diagnosis of lower limb obstructive arterial disease, with a higher accuracy than the ABI. 13 Nevertheless, there is a lack of data on how aortic hemodynamics can interfere with ultrasonographic diagnosis of peripheral vasculopathies. Therefore, we evaluated the hemodynamic interactions induced by AVS in the peripheral flow profile at the level of the RPA. We hypothesized that a proximal resistor is able to mimic the behavior of a local resistor on tributary flow, such as that induced by a stenosis of the renal artery.
A recent retrospective study suggested that the presence of aortic stenosis is the major determinant in generating false positives in ultrasonographic diagnosis of RAS. 3 This was based on measurement of systolic acceleration indices at the level of the renal parenchymal vessels, resulting in compromise in diagnostic accuracy. Our data support this previous finding because we found that patients with severe AVS had a significantly lower AImax value compared with those with a mild to intermediate degree of AVS in the RPA and perirenal aorta (Table 4). In our study, logistic regression analysis showed that none of the systemic hemodynamic and clinical parameters or comorbidities that could affect peripheral hemodynamics were associated with a reduced AImax in the RPA. Only severe aortic stenosis, but not that of a mild to moderate degree, was associated with a reduction in the AImax.
Our study showed a relationship between AVS and attenuation of the systolic acceleration phase of the peripheral flow curve, which is proportional to the severity of valvular disease (Table 4). The role of the aortic transvalvular pressure gradient appeared to prevail over that represented by a reduction in the aortic valve area (Figure 1).
The I-AVS group (i.e., paradoxical low flow severe AVS) did not show a decrease in the systolic ascent phase of the flow wave profile found in the S-AVS group. The I-AVS group showed a profile that was more similar to that of the M-AVS group, but had an aortic valve area value of ≤1 cm2. This finding suggests a role of the transvalvular pressure gradient as a major determinant in generating attenuation of the pulse wave in the peripheral circulation. Therefore, our data suggest that measurement of the aortic valve area, which is a technically complex measure, might play only a complementary role in instrumental stratification of aortic stenosis compared with that represented by the mean transvalvular pressure gradient.
Using arterial tonometry and vascular ultrasound, we evaluated the elastic function and plastic remodeling of the vessel wall as a possible independent factor of interference in measuring the peripheral flow profile. We found that CCA-IMT was significantly higher in patients in the M-AVS group than in the S-AVS group (Table 3). This finding suggested a paradoxical protective effect induced by stenosis on remodeling of the vascular wall. The hemodynamic effects induced by AVS on the phase of systolic acceleration of peripheral flow could be partially modulated by systemic hemodynamics in terms of the average and pulsatory components of arterial pressure and aortic stiffness. However, in our study, mean and pulsatory arterial pressure was comparable among the three groups of severity of AVS. Aortic stiffness, which was evaluated using tonometric measurement of PWV, was similar in the three groups. This finding suggests that aortic stiffness is independent from valvulopathy because it represents a parameter for examining the elastic properties of the aortic wall (Table 3). By contrast, the AIx, which is used to examine the effect of aortic stiffness on central arterial blood pressure, tended to be lower in the I-AVS group than in the other two groups, although this was not significant (Table 3). The discrepancy in behavior in the three groups between PWV and the AIx was partially expected. 14 In widely studied populations, such as in patients with arterial hypertension, these two parameters are closely related. However, the presence of a resistance factor at the level of pulse wave generation and interposed in the retrograde reflected wave could uncouple them. Indeed, we found a paradoxical lack of correlation between PWV and the AIx (Figure 3).

Correlation between carotid–femoral PWV and the AIx% in the overall population of patients with aortic valve stenosis of any degree. AIx, augmentation index; PWV, pulse wave velocity.
Our data suggest that, while attenuation of systolic acceleration of flow in a peripheral region occurs, indirect ultrasonographic diagnosis of stenosis of a local artery that perfuses a specific vascular bed downstream can be confirmed only after exclusion of major stenosis upstream, especially severe AVS. Therefore, we re-analyzed the database related to our previous retrospective study on a population of patients who underwent diagnostic work-up for suspected RAS. 3 . After excluding all patients with severe aortic stenosis from the database, the diagnostic accuracy of the AImax in the first stage of ultrasonographic screening for stenosis of the renal arteries improved by increasing the positive predictive power from 54.7% to 87.9%, while the excellent negative predictive power was unchanged.
In patients who underwent correction for AVS, there was a significant increase in the AImax after 3 months, and this increased value remained constant at 1 year of follow-up (Table 6, Figure 2). Therefore, after removal of central resistance, the consequent mechanical–hemodynamic re-coupling between generation and transmission of the pulse wave confirmed the role of AVS in attenuation of the systolic acceleration phase of the peripheral flow profile. The magnitude of the increase in the AImax following correction of the valve defect was greater and more significant in the RPA (area of low resistance/conductance) compared with the perirenal aorta (site of a mixed hemodynamic regimen of conductance/resistance) (Figure 2). This behavior was expected on the basis of theoretical premises and modeling of the characteristics of sphygmograms in peripheral vessels in the presence of AVS. 15 In fact, in such a model, attenuation of the acceleration slope and a delayed peak during systole are more evident in conductance vessels than in resistance vessels.
Limitations
This study has some limitations. We excluded patients with aortic stenosis and a reduced ventricular ejection fraction. Such a decision was made because of the need to avoid overlapping of confounding factors, which independently of aortic stenosis, can also act synergistically in interfering with the peripheral flow profile. This choice resulted in non-inclusion of two of Nishimura’s stratification classes of AVS (C2 and D2) in which the contractile function of the left ventricle is reduced. Further studies focusing on the possible interference between altered left ventricular pump function and ultrasonographic Doppler indices in the peripheral arterial regions are required.
Conclusion
Severe high-gradient AVS is able to induce attenuation of the systolic acceleration phase of the flow profile in the perirenal aorta and in the RPA, with resolution after correction of the valve defect. The AImax is inversely correlated with the mean transvalvular aortic pressure gradient and positively correlated with the aortic valve area. Attenuation of systolic acceleration of peripheral flow caused by different degrees of AVS is not associated with aortic stiffness. Modification of the velocimetric profile induced by AVS on the peripheral circulation can generate a diagnostic bias on semi-quantitative Doppler parameters that are used in diagnosing peripheral vasculopathies, with particular regard to the study of RAS. During routine examinations of peripheral vascular ultrasonography on conductance vessels, the unexpected finding of attenuation of the systolic acceleration phase of the Doppler velocity curve suggests the presence of unrecognized AVS. In this situation, further cardiological evaluation is required.