
Abstract
Objective:
Renal volume (RV) assessment during obstetric sonography is rarely considered in our locality. Understanding the changes in RV in both normotensive pregnant (NP) and pregnancy-induced hypertensive (PIH) women is important in making correct diagnosis regarding pregnancy outcome. This study is aimed at determining the RV in NP and PIH women and correlating RV with fetal gestational age (FGA), body mass index (BMI), and parity in NP women.
Materials and Methods:
This cross-sectional study involved 450 patients recruited at a Tertiary Hospital. A pilot study was done to determine the interobserver variability in RV measurement. RV was calculated using the following formula: L × W × AP × 0.523. Parity, BMI, and blood pressure were documented, while FGA was calculated as an average of FGAs obtained from the measurements of fetal biometric parameters.
Results:
Mean RV of PIH women was significantly higher than that of NP women (P < .05). RV shows a positive significant relationship with BMI and FGA, while it shows a negative relationship with parity in NP (P < .05).
Conclusion:
Reference range values of RV were generated for clinical use in our locality, while there is statistically significant difference between RV in NP and PIH women.
Pregnancy comes with changes in musculoskeletal, endocrine, respiratory, cardiovascular, gastrointestinal, reproductive, and renal systems. 1 These changes occur as a result of hormonal changes, increase in total blood volume, and weight gain which is needed to provide an enabling environment for the adequate supply of nutrients to the mother and developing fetus and to achieve a healthy pregnancy. 2
In sustaining a healthy pregnancy, the kidney plays an important role through the secretion of hormones and an increase in renal hemodynamics. The kidney achieves this by increasing the glomerular filtration rate by 50%–80%, while renal plasma flows increase by 40%–65 % during pregnancy. 2 These renal physiologic changes, during normal pregnancy, result in an enlarging kidney volume due to increased vasculature of the kidney, interstitial volume, and urinary dead space. 3 This is compared to the study by Christensen et al 4 which found that the volume of the kidney increases by a maximum of 30% during pregnancy.
It is important to note that not all pregnancies are uneventful as about 800 women die due to pregnancy or related complications, on a daily basis. 5 Of the many maternal complications, pregnancy-induced hypertension (PIH) is the most common and affects 5.8% of all pregnant women.6,7 PIH is typically considered to encompass gestational hypertension, preeclampsia, and eclampsia, but for the present research, patients with only the PIH component of preeclampsia were recruited. PIH is characterized by the development of hypertension (systolic blood pressure >140 mmHg or diastolic blood pressure >90 mmHg) after 20 weeks of gestation in a previously normotensive woman, with the presence of proteinuria or, in its absence, of signs or symptoms indicative of target organ injury. 8 According to studies,9–11 the kidney is the organ most affected by preeclampsia, which can result in endothelial injury. It has been documented that severe preeclampsia contributes to about 40% of acute renal injury, during pregnancy, based on data from women living in developed countries. 12 This was corroborated by Julka et al 13 who found that preeclampsia affects renal function by decreasing organ hemodynamics while increasing urine protein excretion. At the morphologic level, it can destroy glomerular tissue, which results in glomerular endothelial swelling, loss of endothelial fenestrae, and occlusion of the capillary lumen. These processes result in hypertrophy of the intracapillary cells, which manifests as an increase in overall renal volume.
It is important to state that both renal functionality and morphology can be assessed by measuring the dimensions of the organ, determining renal volume, as an excellent predictor of function. 14 Measurement of renal volume can be done using conventional radiography, computed tomography (CT), magnetic resonance imaging (MRI), and sonography; however, the effect of ionizing radiation, on developing fetus, makes using conventional radiography and CT unlikely. The use of nonionizing imaging modalities such as MRI and sonography is the preferred means of measuring renal volume during pregnancy. 15 A substantial drawback to screening patient with MRI is the expense, which makes sonography the more suitable imaging modality for the measurement of renal volume, during pregnancy, due to its low cost, accessibility, and noninvasive approach. 16
Detecting changes in renal volume, in both normotensive and PIH patients, is paramount as these changes have clinical implications and cause renal compromise to be undiagnosed for physicians, sonographers, and caregivers. 17 This is because normotensive pregnant women, with minimal renal dysfunction, stand a 90% chance of a successful pregnancy. 18 This is in contrast to patients experiencing hypertension during pregnancy who have a poor prognosis and outcome. 19 So, accurate diagnosis of renal function, during pregnancy, depends on the ability of sonographers or sonologists to detect changes in renal volume, during a normal pregnancy and also as a side effect of PIH, which can cause an adverse pregnancy outcome. Achieving this goal would depend on having a range of renal volumes, throughout a normal pregnancy, so that any change in these dimensions could be attributed to a suspected pathologic change.
Although there are established nomograms for the renal volumes of pregnant women in Iraq and India,20,21 factors such as sex, age, and body habitus (body mass index [BMI]) have been shown to affect renal volume, in addition to race and ethnicity. This assumption was supported by studies22,23 that found racial differences in renal volume among the studied populations. Applying these reference range values, clinically for alternative populations, may be erroneous. This, therefore, strengthens the need to gather specific reference values for renal volume, among pregnant women of varied ethnicity. The lack of specific data on renal volume in this study population in normotensive pregnant women coupled with no comparative data for renal volume in normal and preeclamptic women, necessitated this study.
This study was specifically aimed at sonographically assessing renal volume among both normotensive women and PIH women, living in South-East Nigeria.
Materials and Methods
This cross-sectional study was carried out by recruiting 450 patients, which were further divided into 350 normotensives and 100 PIH patients. These women were recruited using convenience sampling method at an antenatal clinic, connected to a Nigerian teaching hospital, during May 2018 to April 2019. The patients recruited to this study were women with no known pregnancy complication, a healthy fetus, and women with PIH. Excluded from this study were women with preexisting renal disease, hypertension, previous renal surgery, and those who declined consent to participate in the study.
Patients who met the inclusion criteria were counseled and the procedure was explained to them before signing the consent form. The study was approved and ethical clearance was granted by the ethical review committee of the associated teaching hospital.
Equipment
Sonographic assessment of the patient’s renal volume was performed using a 2017 Mindray, model DC-N3, ultrasound equipment system and a curved linear-array transducer that had a 2.5- to 5-MHz bandwidth (Shenzhen Mindray Biomedical Electronics Co., Ltd, China). Maternal weight and height were measured using a stadiometer with a weighing scale, model ZT-160 (Medifield Equipment and Scientific Ltd, England). Maternal blood pressure was measured using a medical desktop mercury sphygmomanometer, model Hq-Sm-201 (Yiwu Hongqian Technology Industry Co., Ltd, Zhejiang, China).
Sonographic Technique
Prior to the actual study, a pilot was conducted to determine the interobserver variability, for renal volume measurements, within and between two sonographers. The participating sonographers had more than 15 years’ experience in obstetric sonography. Renal volume measurements were completed with the subject in a supine position or in a slightly right or left lateral decubitus position. Acoustic couplant was applied generously, to the abdomen, for easy ultrasound transmission. The right and left kidneys were identified using the liver and spleen as acoustic windows, respectively. Measurement of renal length (L) and anteroposterior (AP) diameter was taken with an image captured in the longitudinal plane. The renal length was taken using the longest distance from the upper pole to the lower pole of the kidney. The AP diameter was taken by capturing the maximum AP diameter at the estimated middle third of the kidney. From this longitudinal sonographic image, the transducer was rotated 90° to obtain the renal width (W), which was the maximum transverse diameter taken at the level of the renal hilum. All measurements were captured during the patient’s deep inspiration (Figures 1 and 2). The renal volumes were calculated using the following formula: L (AB) × W (EF) × AP (CD) × 0.523. 24
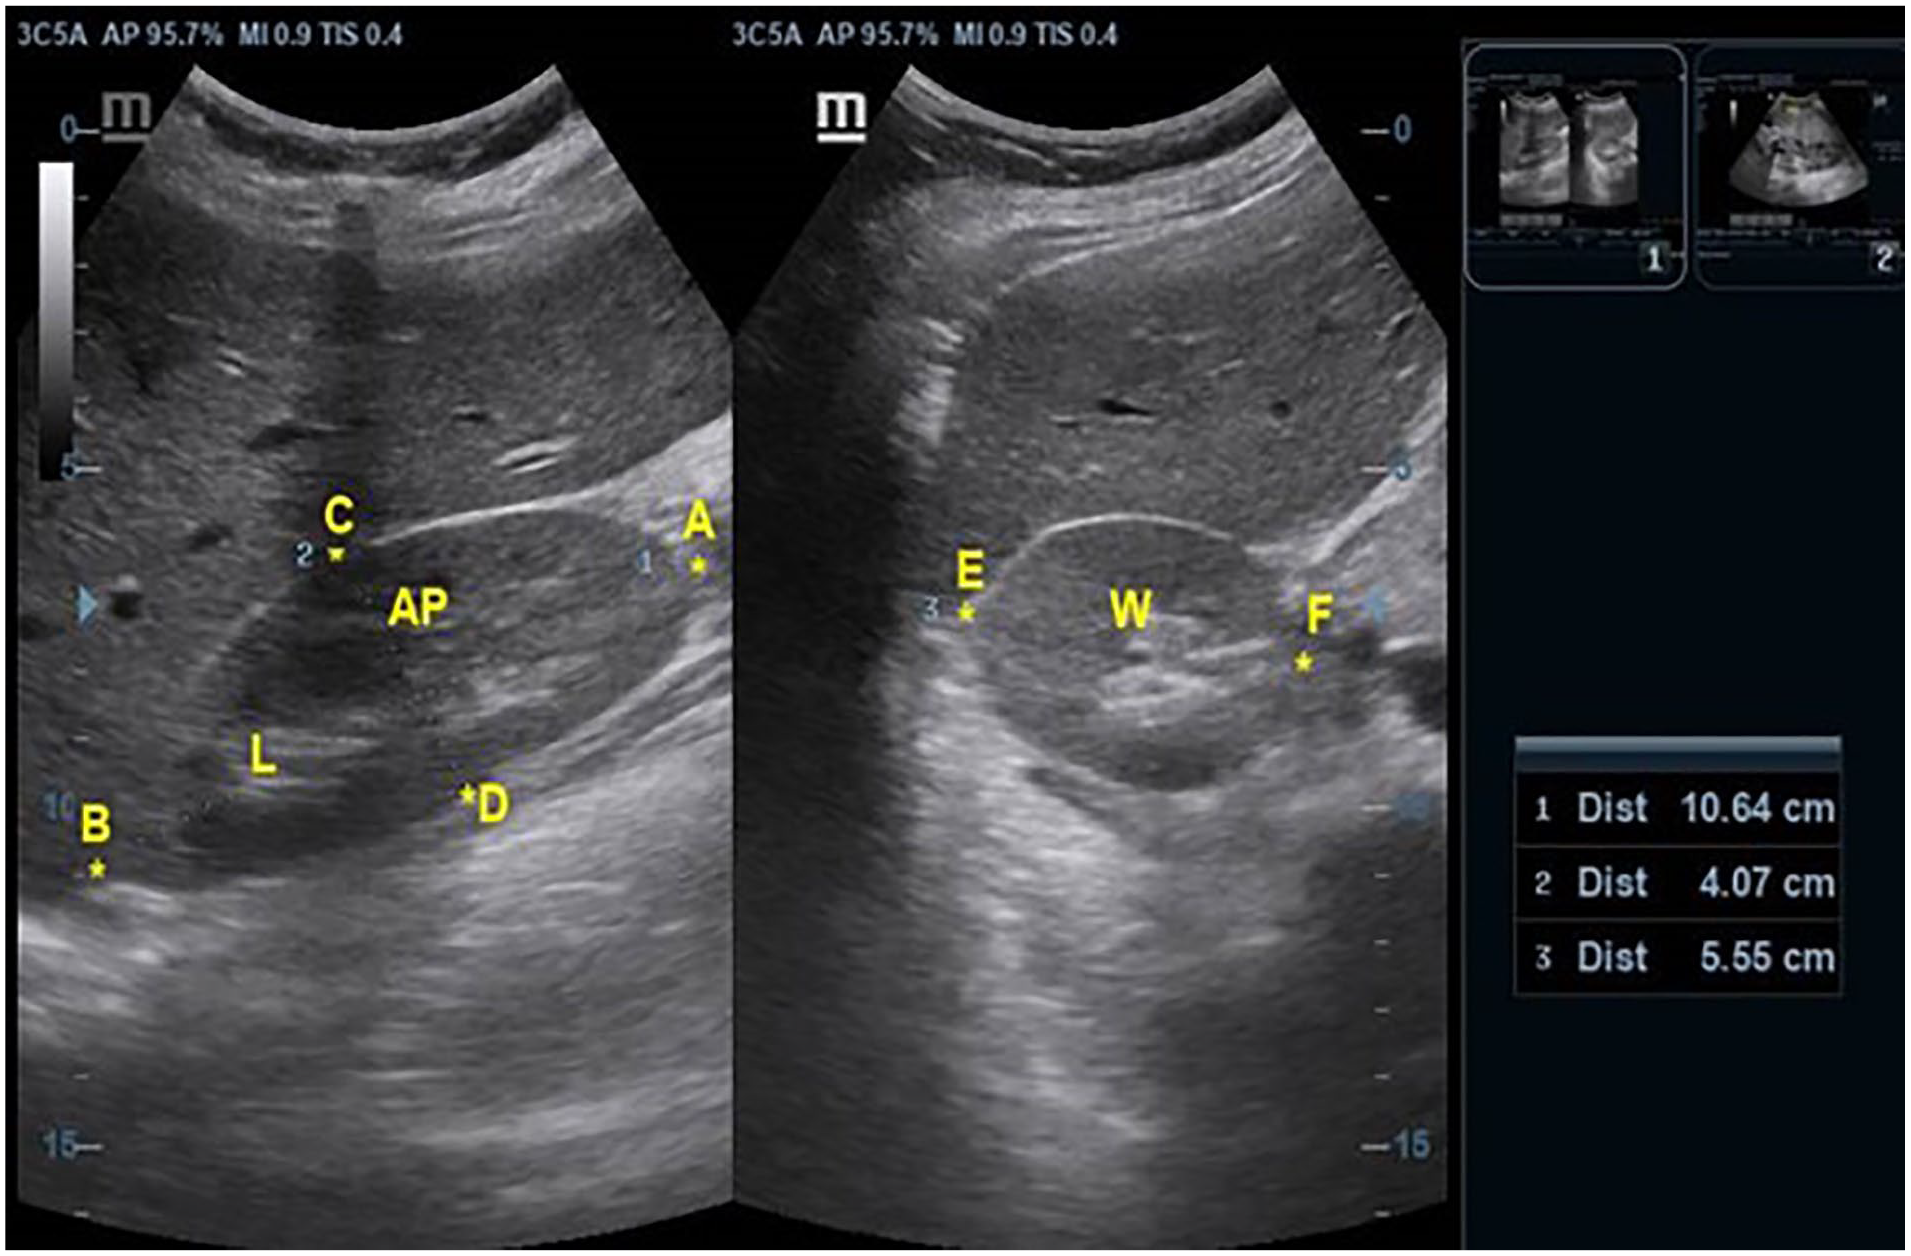
Sonogram shows measurement of renal volume of normotensive woman.
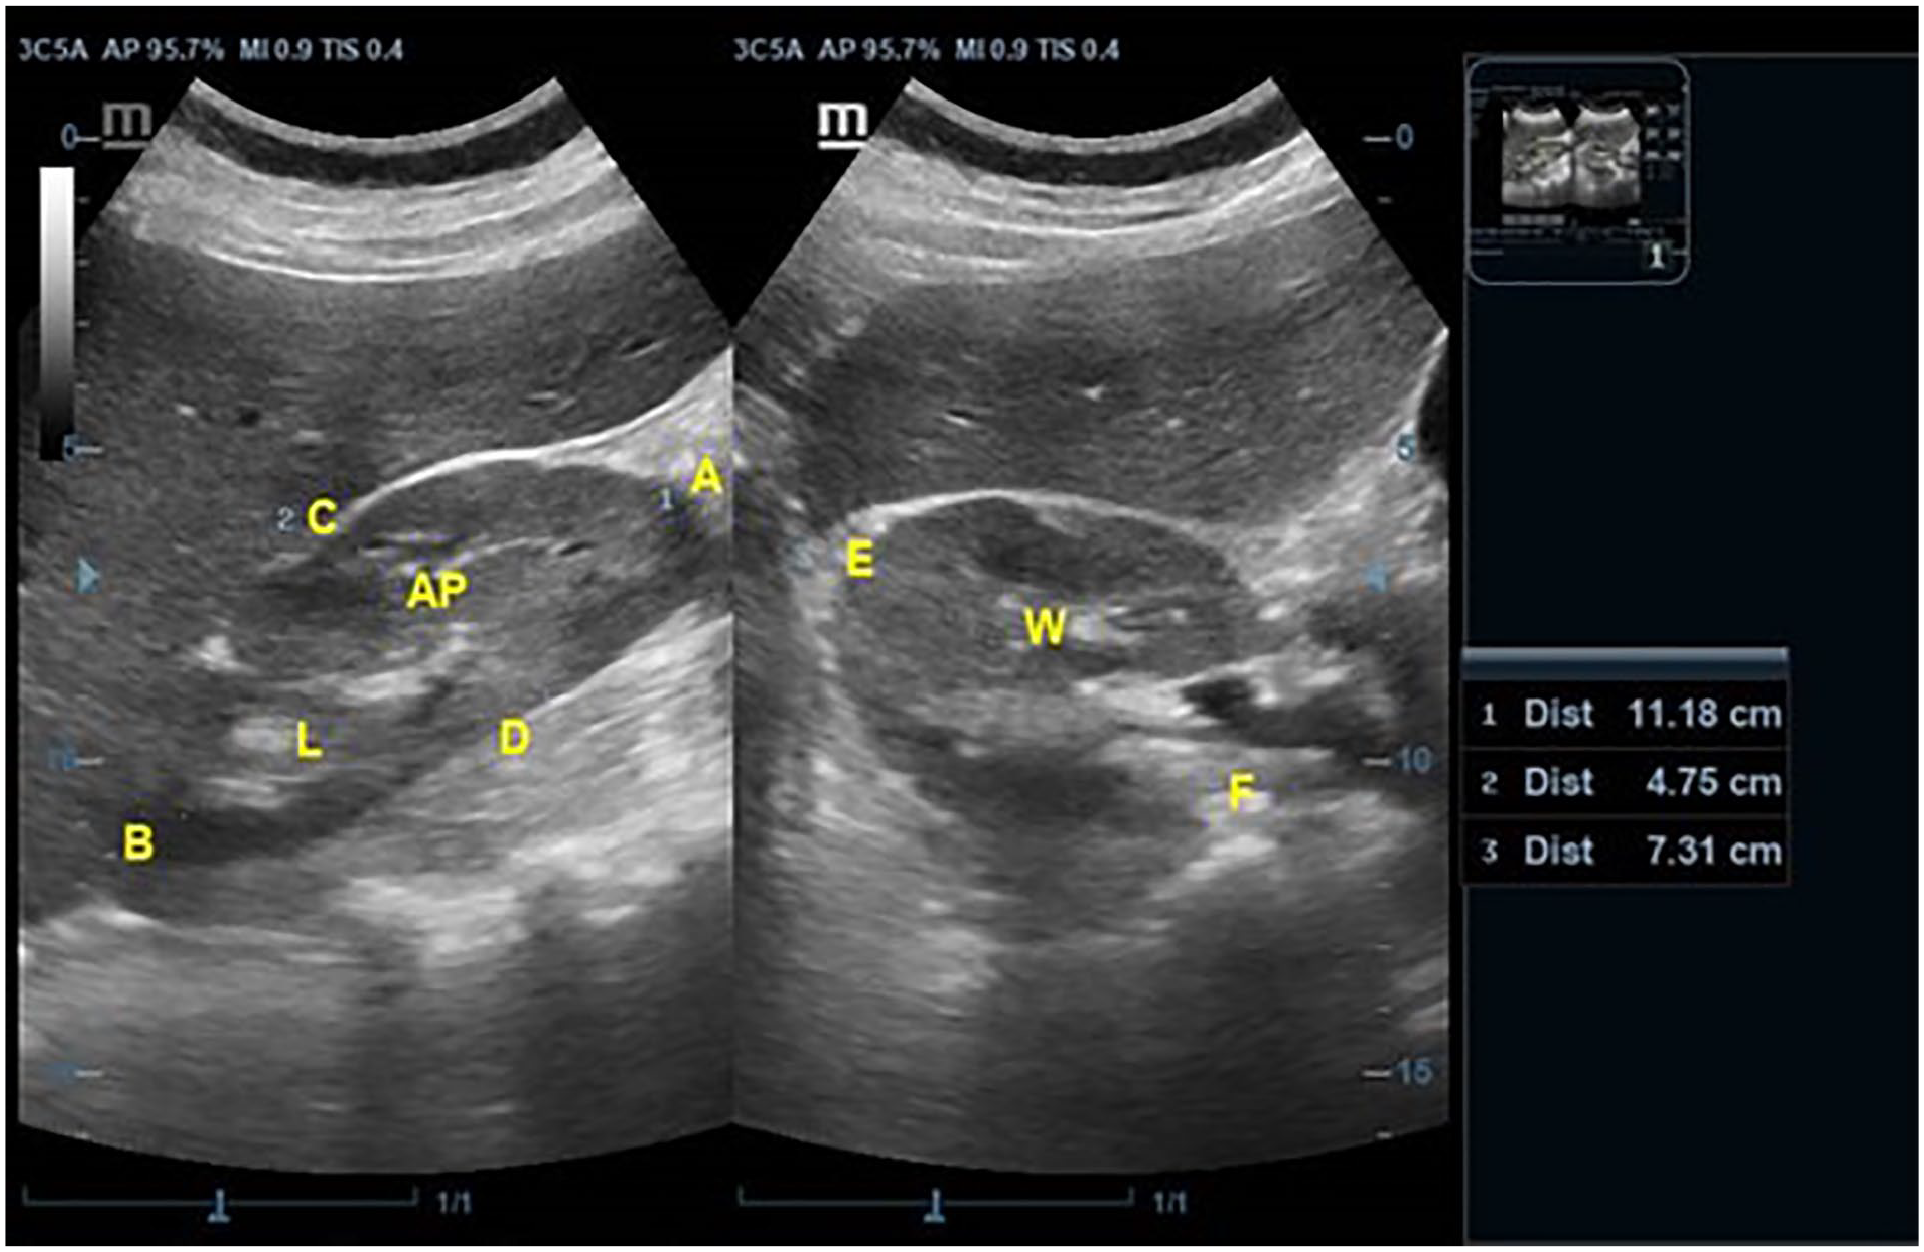
Sonogram shows measurement of renal volume of PIH woman. PIH, pregnancy-induced hypertensive.
Results
The mean age and standard deviation of normotensive pregnant women were 29.22 ± 4.60 years with the modal age group of 26–30 years (n = 142, 40.6%), while the mean age and standard deviation of pregnant women with PIH were 31.69 ± 5.34 years with the modal age group of 31–35 years (n = 34, 34%). The majority of normotensive patients are low multiparous (n = 180, 51.4%), while the majority of PIH patients are nulliparous (n = 42, 42%). The majority of the normotensive women were overweight (n =144, 41.1%), while those with PIH were majorly obese (n = 52, 52.0%) (Table 1). The mean systolic and diastolic blood pressure for normotensive women was 106.51 and 72.92 mmHg, respectively, while the mean systolic and diastolic pressure of women with PIH was 106.10 and 98.70 mmHg, respectively. There was a statistically significant difference between systolic and diastolic pressure of normotensive pregnant women and women with PIH (P < .05).
Patients’ Demographics.
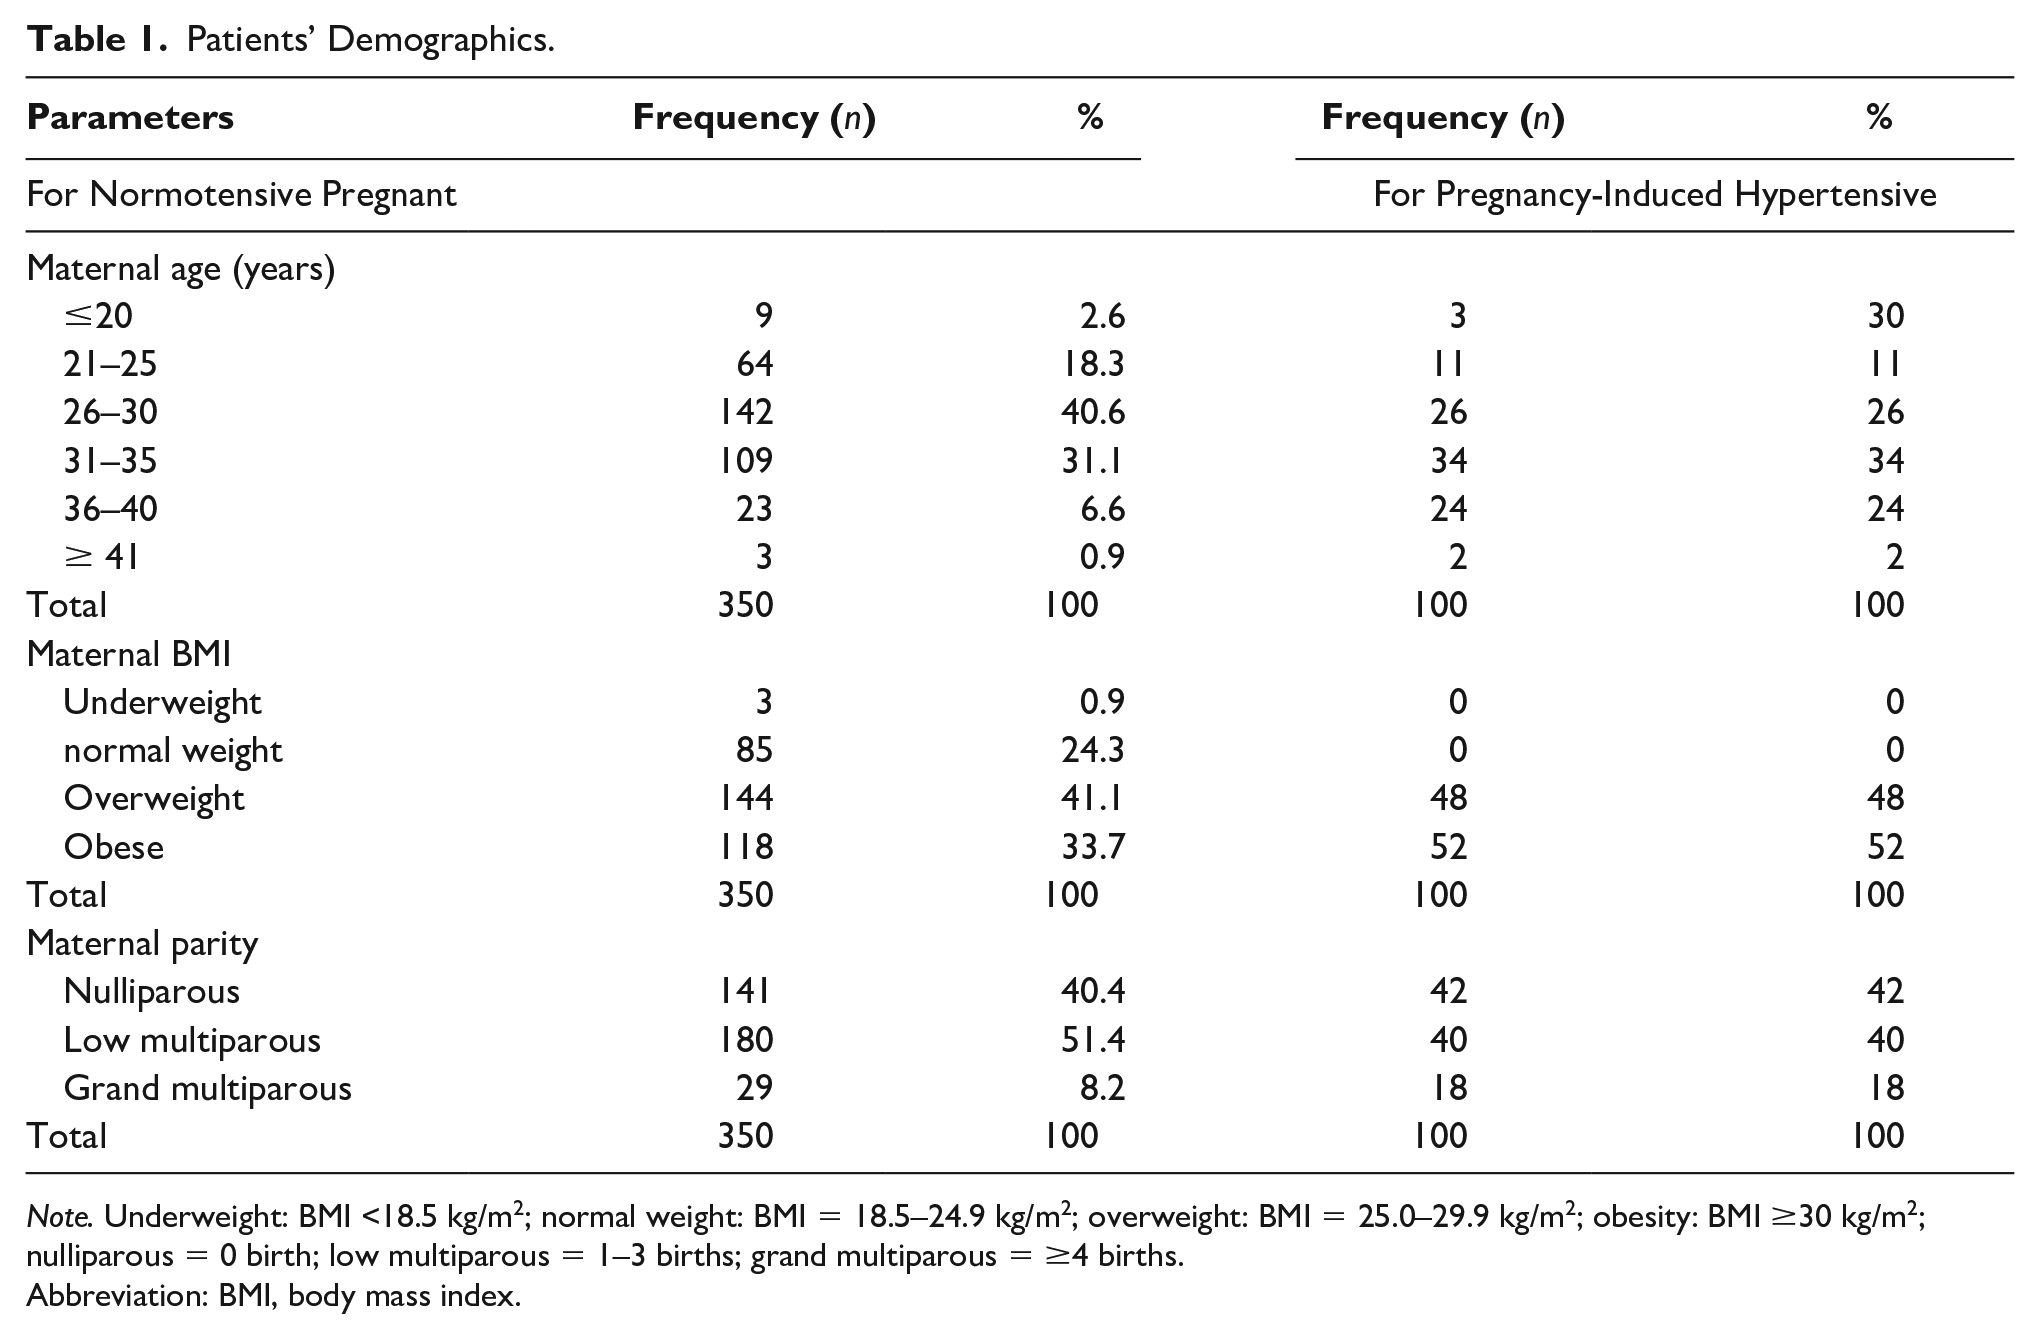
Note. Underweight: BMI <18.5 kg/m2; normal weight: BMI = 18.5–24.9 kg/m2; overweight: BMI = 25.0–29.9 kg/m2; obesity: BMI ≥30 kg/m2; nulliparous = 0 birth; low multiparous = 1–3 births; grand multiparous = ≥4 births.
Abbreviation: BMI, body mass index.
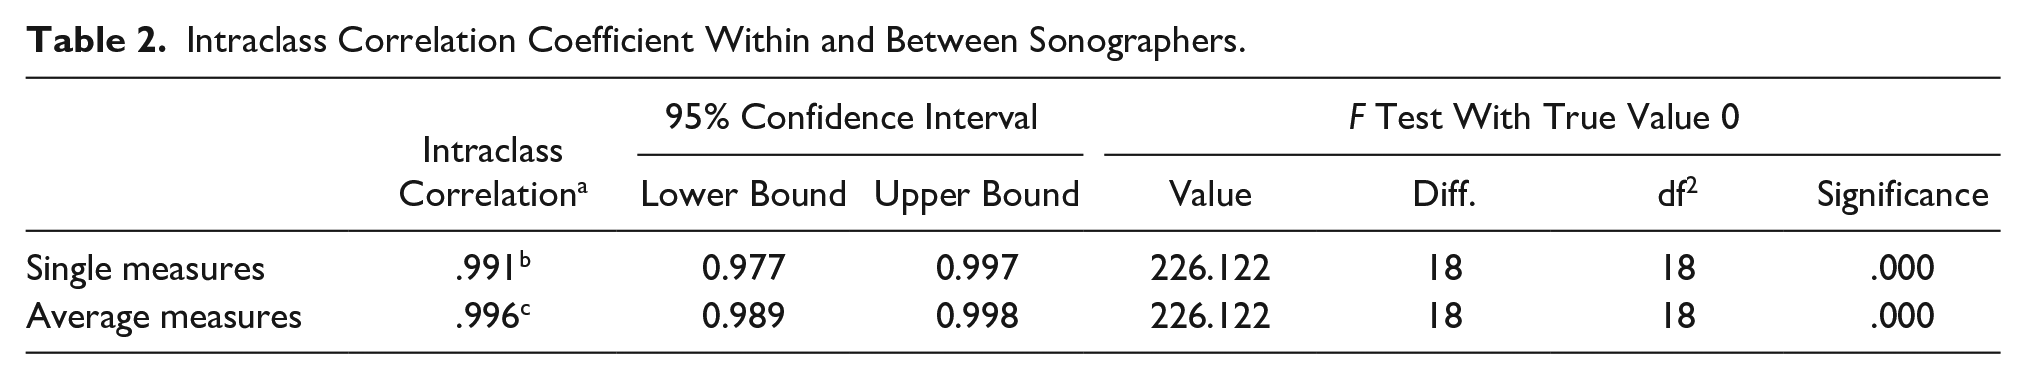
The measurement of renal volume showed excellent correlation within and between two sonographers with intraclass correlation coefficient (ICC) of 0.991 and 0.996, respectively (Table 2). Bland-Altman plot (Figure 3) showed no pattern above and below the mean reference line (1.18) with a 95% confidence interval of −8.65 to + 8.65. Also, to assess for bias, linear regression was carried out and a P value of 0.339 was obtained, which would suggest no significant difference between the two measurements.
Intraclass Correlation Coefficient Within and Between Sonographers.
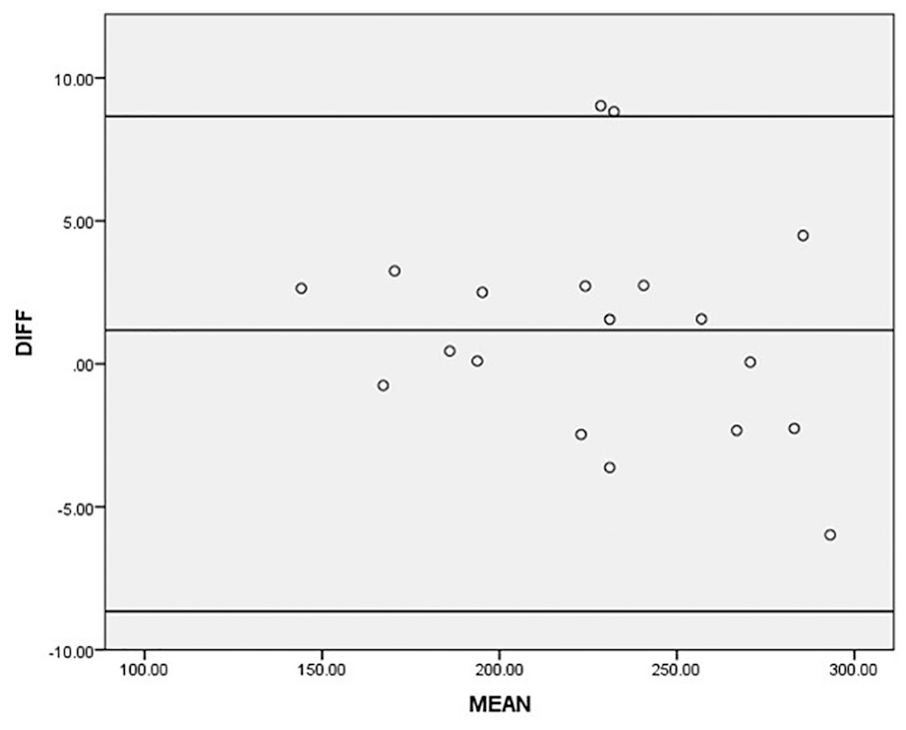
Bland-Altman plot of agreement between two sonographers in the measurement of renal volume.
The mean renal volume for normotensive pregnant women was 147.74 ± 1.87 cm3. The mean and standard deviation of right renal volume were 116.45 ± 5.04 cm3, 136.46 ± 2.93 cm3, and 154.87 ± 2.20 cm3 in the first, second, and third trimesters, respectively. Also, the mean and standard deviation of left renal volume were 122.84 ± 7.69 cm3, 153.84 ± 4.16 cm3, and 181.08 ± 2.32 cm3 in the first, second, and third trimesters, respectively (Table 3).
Maternal Renal Volume of Normotensive Patients According to Trimesters.
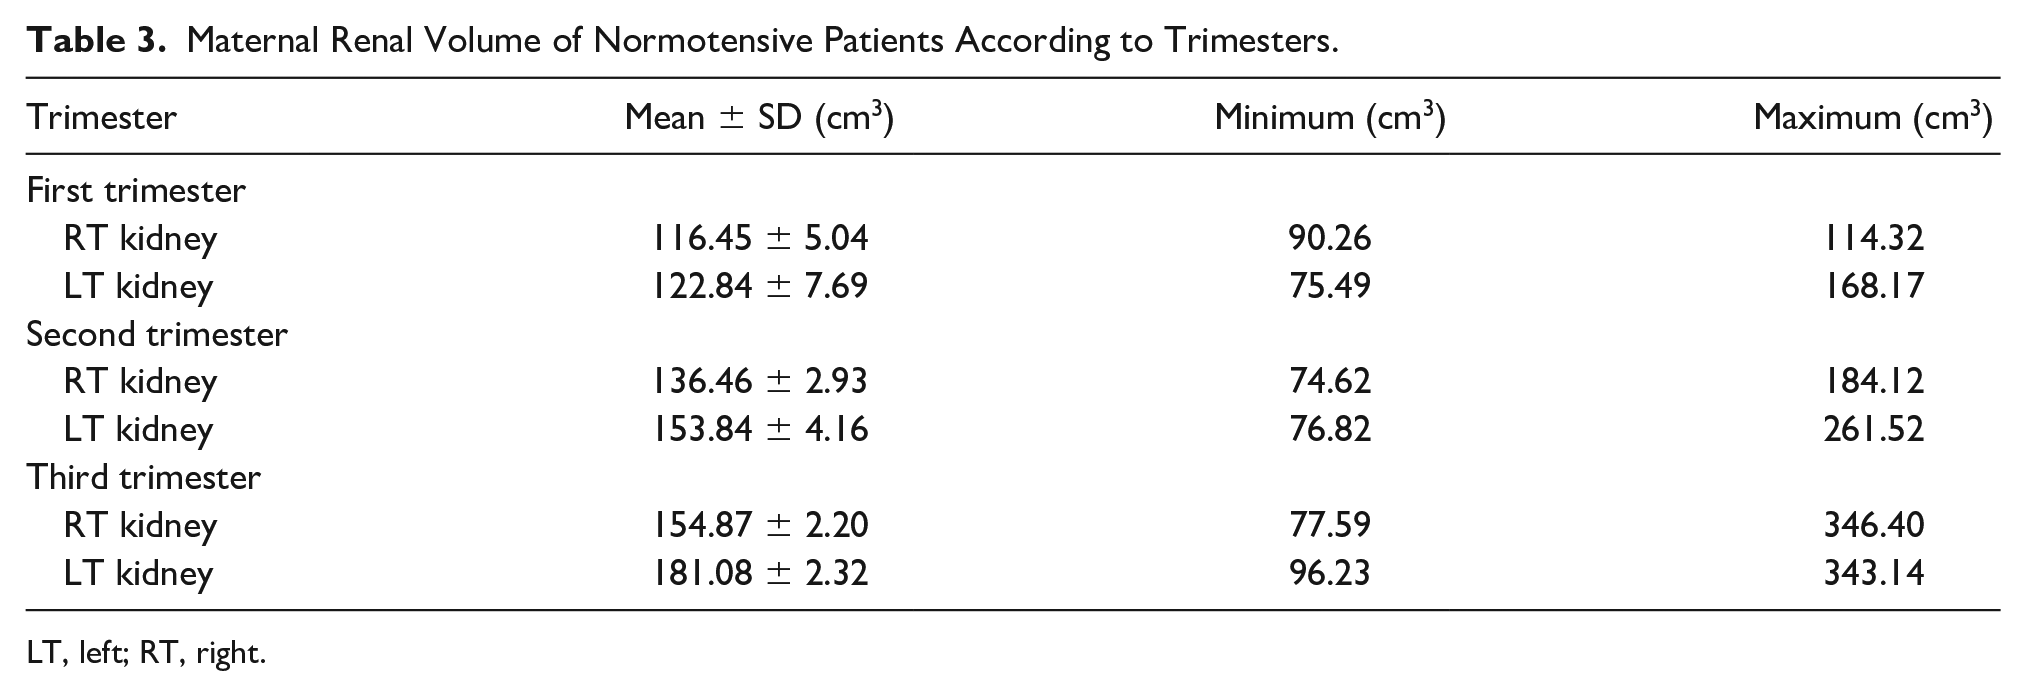
LT, left; RT, right.
The mean and standard deviation of the right and left renal volume in women with PIH were 189.23 ± 5.15 cm3and 221.68 ± 6.48 cm3, respectively. There was a statistically significant difference between renal volume in normotensive patients and those with PIH (P < .05) (Table 4).
Renal Volume of Normotensive and Pregnancy-Induced Hypertensive Pregnant Patients.
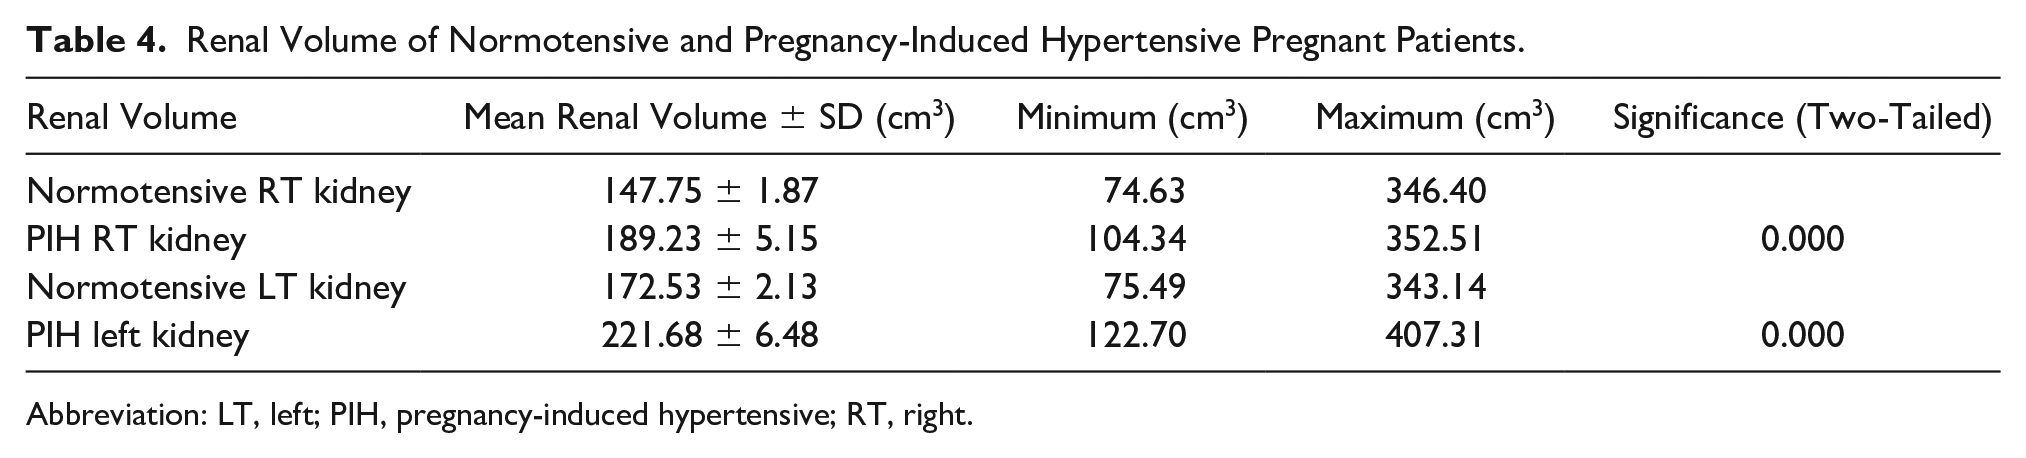
Abbreviation: LT, left; PIH, pregnancy-induced hypertensive; RT, right.
The right renal volume showed significantly (P < .05) low strength of association with BMI and fetal gestational age (FGA), given r = 0.357 and r = 0.379, respectively. Also, the right renal volume showed a nonsignificant but positive relationship with parity (r = 0.037, P > .05). The left renal volume demonstrated a significantly (P < .05) low strength of association with BMI and FGA, due to r = 0.384 and r = 0.423 respectively. The left renal volume also showed negative lack of relationship and nonsignificance compared to parity (r = −0.014, P > .05).
Discussion
Normal physiologic changes in pregnancy result in a change in renal function, such as an increase in glomerular filtration rate and an increase in renal volume. Disruption in these physiologic changes can result in pregnancy complications, such as preeclampsia, a leading cause of poor pregnancy outcomes globally. 25 Interestingly, the incidence of preeclampsia in developing countries is approximately seven times higher than that in the developed world. 26 Preeclampsia can result in targeted organ damage, and renal endothelial damage is one of the most prominent effects. This damage leads to glomerular endothelial swelling, loss of endothelial fenestrae, and occlusion of the capillary lumen which can manifest as an increase in renal volume. Prompt diagnosis of this adverse condition is paramount, such that pregnancy management can lead to a better health outcome and can depend on the sonographer’s examination. It is important for sonographers and sonologists to differentiate a change in renal volume during a normal pregnancy from those volume changes attributed to PIH.
From this study, the measurement of renal volume was highly reliable and reproducible both within and between two sonographers. In this study, the range of reference values, for renal volume, during different trimesters was generated and it helped to eliminate the racial bias for measured renal volume, during pregnancy, in this locality. Also, in agreement with previous studies,27,28 this study found a statistically significant difference (P < .005) in renal volume between pregnant women suffering with PIH compared to normotensive pregnant women, with the former being higher than the latter. This difference may be attributed to the increase in the production of inflammatory cytokines as a result of an abnormal cytotrophoblastic invasion of the cyclic artery.29,30,31 The resultant placental ischemia leads to the production of inflammatory cytokines—tumor necrosis factor-α (TNF-α) and interleukin-1 (IL-1)—that enhance the formation of endothelin. This cascade of cytokines can also lead to a reduced production of acetylcholine-induced vasodilatation.32,33 These can cause massive inflammation and destruction of the renal endothelial cells and contribute to increased renal volume for those with PIH. 34 Also, it was noted that there was an inequality in right and left renal volume, for both normotensive and PIH women. The data indicate that the left renal volume was found to be statistically higher than the right renal volume (P < .05). This is comparable to other studies24,27 that found the left renal volume to be higher than that on the right. The reason for such discrepancy could be attributed to the fact that the left renal artery is shorter and straighter than the right renal artery, which results in more blood flowing into the left kidney, which can lead to increasing renal volume. Also, the relative positions of the kidneys relative to the liver and spleen could be influential, given that the liver occupies more space than the spleen and constrains the right kidney, unlike the left. 35
Several studies have reported an increase in renal volume as pregnancy progresses.36,37 This is in tandem with the result of this study and could be attributed to an increase in blood flow as the pregnancy progresses. The increase in volume peaks at the third trimester at about 60%–80% above prepregnancy levels and contributes to an increased glomerular filtration rate, which leads to increasing renal volumes.
BMI showed a low strength of association that was significant, compared to renal volume, and no significant correlation existed between parity and renal volume. The results of this study are in agreement with previously published works.27,38 A low strength of association existed, for these patients, between BMI and renal volume and has been previously reported. This may begin to explain an increase in maternal weight due to fetal, placental, and amniotic fluid weights as the pregnancy progresses.
The strength of this study lies on the cross-sectional recruitment of both normotensive patients and those with preeclampsia, of Igbo extraction. This eliminated the effect of race and other cofounding variables such as diabetes in pregnancy, which could also have affected the measurement of renal volume. The weakness of this work is the study design threats, a limited sample size of both normotensive and PIH women, which affects the generalizability of this study. Future research in this area, using 3D sonographic measurements of renal volume, is highly recommended. Building more reliable measurement ranges has the potential to provide a more reliable diagnosis and reduces renal volume measurement errors.
Conclusion
This study successfully generated a range of renal volume measurements for normotensive and PHI patients who were living in South-East Nigeria. In this cross-sectional sample, renal volume was found to increase as pregnancy progressed, and the left renal volume was significantly more than that of the right kidney.
Footnotes
Ethics Approval
The study was approved and ethical clearance was granted by the ethical review committee of the associated teaching hospital.
Informed Consent
Written informed consent was obtained from all subjects before the study.
Animal Welfare
Guidelines for humane animal treatment did not apply to the present study because no animals were used.
Declaration of Conflicting Interests
The author(s) declared no potential conflicts of interest with respect to the research, authorship, and/or publication of this article.
Trial Registration
Not applicable.
Funding
The author(s) received no financial support for the research, authorship, and/or publication of this article.