
Abstract
Objective:
Recumbent rest elicits a decrease in muscle size of the lower extremity, but the extent of decrease may be related to differences in muscle quality. This could have implications for ultrasound-derived measures of muscle size, particularly in individuals with a large proportion of intramuscular contractile elements. The research objective was to determine whether decreases in muscle size following recumbent rest are related to ultrasound-derived corrected echo intensity in resistance-trained males.
Methods:
Cross-sectional area (CSA), echo intensity (EI), subcutaneous fat thickness (SFT), and EI corrected for SFT (EICor) of the vastus lateralis (VL) were measured via ultrasonography in 30 resistance-trained males. Measures were obtained immediately following recumbency (T0) and 15 minutes after recumbency (T15). The association between EICor and percentage change in CSA (%ΔCSA) from T0 to T15 was examined. Comparisons of morphological characteristics were examined between a subset of participants with the lowest (LO; n = 10; <33rd percentile) and highest (HI; n = 10; >66th percentile) EICor.
Results:
EICor was not correlated with %ΔCSA (P = .151), and the decrease in CSA from T0 to T15 did not differ between the LO and HI groups.
Conclusions:
Muscle quality (EICor) is not related to the decrease in CSA of the VL following recumbent rest among resistance-trained, young males. The time frame of muscle CSA acquisition should not differ based solely on differences in muscle quality.
Skeletal muscle size is an important factor mediating muscle function, as force output is largely a product of the amount of contractile elements within a muscle. 1 Accurate measures of muscle size are therefore imperative to a comprehensive understanding of the structure–function relationship of skeletal muscle. 2 Ultrasonography has recently been used as a cheaper, safer, and more easily accessible alternative to other medical imaging techniques for the examination of muscle size and structure.3,4 Although ultrasonography is valid, reliable, and robust, ultrasound-derived measures of muscle size and shape may be affected by confounding factors, which could diminish the ability to predict function from structure. One of these factors is the amount of time spent in recumbency prior to sonographic assessment.5–10 Ultrasound assessment of the lower body is typically completed while a subject lays in a recumbent position on an examination table. The transition from standing to recumbency elicits a redistribution of gravitational and hydrostatic forces acting on the body,11,12 inducing blood relocation from the legs to the abdomen and upper body,12,13 reducing lower body muscle size measures.5,6,8,9 This decrease in lower body muscle cross-sectional area (CSA) seems to equilibrate after approximately 10–15 minutes of supine rest,5,8 and many researchers using ultrasonography to characterize tissue size incorporate this rest period prior to assessment to allow for fluid redistribution.5,14–20 Most studies examining the morphology of the thigh musculature have reported a decrease in muscle CSA of about 1–2% following 10–30 minutes of supine rest.5–10 Although this small change may not seem meaningful, previous research reports that the decrease in muscle CSA induced by recumbent rest significantly altered the ability of these measures to predict muscle strength and power outcomes. 6 These findings highlight the importance of standardized and accurate sonographic methodologies of measuring muscle mass for functional assessment.
Several studies have reported decreases in muscle size within the lower body following recumbent rest,5–10 but it has been suggested that the extent of change (i.e., how much or how little the muscle decreases in size following rest) may depend on muscle composition. 9 Specifically, decreases in muscle size may occur to a greater degree in muscles containing less intramuscular fat, connective tissue, and/or fibrous tissue than in those that contain more. 9 In alignment, while recumbent rest induces significant decreases in lower body muscle size in physically active individuals,5,6,8 minimal (i.e., slower rates of change and smaller overall change) to no change in muscle size is observed in physically inactive individuals 10 and in older adults.10,21 These observations are congruent with the notion that physical inactivity and aging decrease the proportion of contractile tissue and increase the infiltration of intramuscular fat, which may lead to a decline in muscle fluid storage.22,23 It is thought that the greater water content in muscles with more contractile tissue may result in a greater capacity for fluid flux and muscle size change following recumbent rest, whereas the opposite may be true for muscles with increased intramuscular fat content. 9 However, previous research reports that subcutaneous adipose tissue, with its high fat and low water content, also decreases in thickness as a result of fluid efflux following recumbent rest.8,10 In addition, movement of fluid from the intracellular to extracellular compartment only occurs as a result of changes in osmolality between the extracellular and intracellular fluid, but this does not occur with a transition to recumbency.24,25 The decrease in muscle size is therefore likely a result of a redistribution of filtrate from the interstitial space into the intravascular space and not out of the intracellular compartment. 12 Since this fluid movement occurs extracellularly, changes in muscle size are likely not affected by muscle composition; however, this remains to be explored in a healthy, young, physically active population. Alternatively, if prolonged recumbent rest affects the size of leaner muscles to a greater extent than muscles that are less lean, error is nonsystematically introduced into these measures, diminishing the predictive ability of muscle strength and power from muscle size.
Surrogate measures of muscle composition and quality can be assessed noninvasively via ultrasonography through the assessment of echo intensity (EI). EI is a measure of the reflectance of ultrasound waves off a tissue of interest and is quantified through gray-scale analysis of pixels within a region of interest in a sonogram, where brighter pixels have a higher EI value and darker pixels have a lower EI value. 26 Contractile elements of a muscle appear darker in a sonogram, whereas noncontractile elements appear brighter. 26 Thus, a higher muscle EI value is typically indicative of lower-quality skeletal tissue, and muscle EI has been positively associated with intramuscular fat and fibrous tissue content.26–29 EI may also signify muscle quality as it is negatively associated with muscle function, strength, and power across populations.15,17,30–32 Additionally, there is evidence to suggest that EI decreases following chronic resistance training17,30,33–35 and increases with age,10,29,30 potentially reflecting changes in the contractile and noncontractile components of muscle.
Up to this point, investigations comparing the degree of decrease in muscle size following recumbent rest between populations have been limited to examining physically inactive individuals. Using ultrasonography, Shea 10 observed similar degrees of decreases in muscle CSA between younger and older physically-inactive males following 30 minutes of recumbency, despite higher muscle EI values in the older males. On the contrary, Cerniglia et al 9 observed a greater decrease in muscle size in normal-density muscle (characterized by lower intramuscular fat) compared with low-density muscle (characterized by higher intramuscular fat) following 15 minutes of supine rest in sedentary, postmenopausal females using computerized tomography (CT). Resistance training is purported to increase the ratio of intramuscular contractile to noncontractile tissue 36 ; however, large discrepancies in muscle quality and composition can exist even between resistance-trained individuals. The authors have previously reported that 15 minutes of recumbent rest results in significant decreases in CSA of the vastus lateralis (VL) in resistance-trained males 6 , but the effects of muscle quality on the extent of decrease in muscle CSA were not examined. Thus, the research objective was to determine whether muscle quality, as determined via ultrasound-derived EI corrected for subcutaneous fat thickness (SFT), is related to the extent of change in CSA of the VL following 15 minutes of recumbent rest. A secondary purpose was to determine whether individuals with the lowest and highest muscle quality differed in the CSA response to 15 minutes of recumbent rest.
Methods
Experimental Design
The purpose of this study was to determine whether rest-induced decreases in CSA observed in our previous study was related to muscle EI. Therefore, several of the methods presented here have been previously described by the authors. 6 Briefly, participants were recruited and reported to the Human Performance Laboratory on two occasions. During the first visit, participants were informed of all study procedures, risks, and benefits and completed a written informed consent form. To establish participant eligibility, potential participants completed a Physical Activity Readiness Questionnaire (PAR-Q+) 37 and a medical history and physical activity questionnaire. Eligible participants were instructed to return to the laboratory on a separate day for their testing visit. Participants were instructed to refrain from vigorous lower body exercise for at least 72 hours, alcohol and caffeine for 24 hours, and food and flavored beverages for 4 hours prior to the scheduled testing time. During the testing day, each participant underwent hydration status assessment to ensure euhydration, anthropometric testing and body composition assessment, and two rounds of ultrasound image assessments.
Subjects
Thirty-five recreationally active males between the ages of 18 and 35 years were recruited and provided written informed consent. Participants were required to be resistance-trained, which was defined as participating in at least three sessions of resistance training per week for the previous year or more, which was confirmed with the medical history and physical activity questionnaire. Participants were also required to be nonsmokers, free from previous use of any performance-enhancing drugs, free of any physical limitations, chronic diseases, or injuries, and deemed healthy (as determined by the medical history and physical activity questionnaire and PAR-Q+).
Procedures
Hydration status assessment
To participate in the testing day assessments, participants were required to arrive in a state of euhydration. Each participant provided a urine sample in a container to determine hydration status. Urine samples were assessed via refractometry by placing a small drop of urine on a digital refractometer (Human Urine Refractometer; MISCO Refractometer, Cleveland, OH, USA). Participants were required to have a urine specific gravity of ≤1.020 to continue with the testing day procedures. If participants did not meet hydration criteria, they were instructed to consume water, wait, and were retested again until they were properly hydrated.
Anthropometric and body composition assessments
Participants removed their footwear, socks, and jewelry and were asked to dress in minimal clothing (i.e., undergarments) prior to anthropometric and body composition assessment. Body mass and height were measured using a Health-O-Meter Professional scale (Patient Weighing Scale, Model 500 KL; Pelstar, Alsip, IL, USA) to the nearest 0.1 kg and 0.1 cm, respectively. Multifrequency bioelectrical impedance analysis (BIA) (InBody770; InBody, Cerritos, CA, USA) was used to determine body composition (body fat percentage), as previously described. 38 Briefly, participants wiped their hands and feet with an InBody tissue to enhance electrical conductivity and reduce surface bacteria before assessment. Each participant was then instructed to stand on the InBody platform electrodes while holding two handheld electrodes out to the side so that their arms did not make contact with the sides of their body. Participants held this position for about 1 minute as the device sent electrical currents throughout the body to determine body composition.
Sonographic assessments
Each participant underwent two sonographic assessments. Similar sonographic techniques to those used in this investigation have been previously described after 15 minutes of recumbent rest.14–20 However, the main purpose of this study was to examine the relationship between muscle quality and changes in muscle CSA following recumbent rest; therefore, two rounds of sonograms were captured: one immediately after the participant was placed on the examination table and one 15 minutes later. 6 Prior to the first round of sonographic imaging, each participant was required to stand upright for 15 minutes. Participants were then instructed to lay down on an examination table on their nondominant lateral recumbent side for sonographic capture of the VL muscle in the dominant leg (determined by self-reporting which leg they felt they could kick better with) (Figure 1). Participants’ legs were positioned stacked on top of one another, and a foam pad was placed between their ankles. A goniometer was used to position the knees of each participant at 10° of knee flexion. Upon attaining this positioning, sonograms of the VL in the dominant limb were taken immediately (T0). Participants were then instructed to remain in the nondominant lateral recumbent position for an additional 15 minutes. The second round of sonograms was captured after 15 minutes in this position (T15).
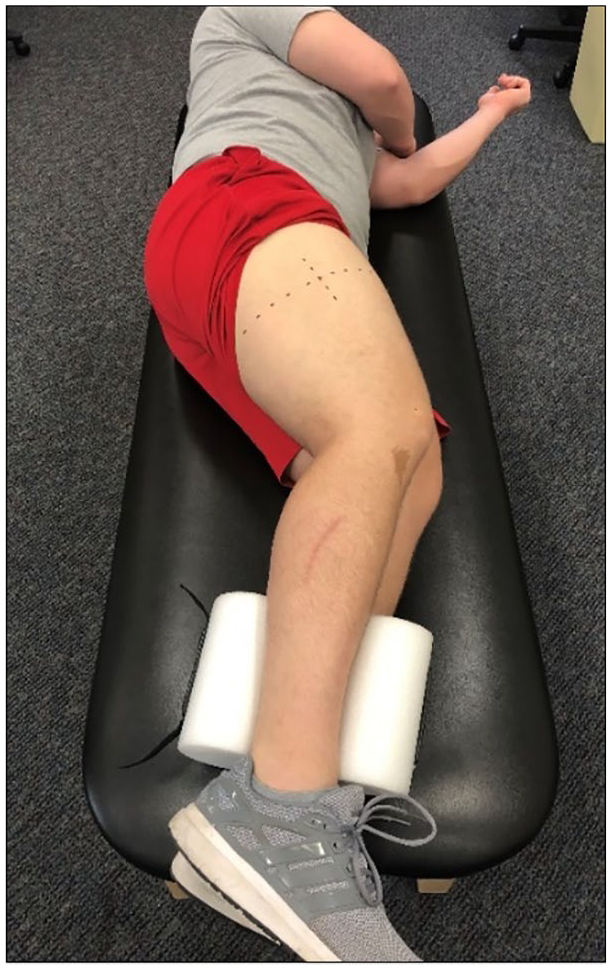
A participant lying in the nondominant lateral recumbent position for ultrasound assessment of the vastus lateralis (VL) in the dominant limb.
Anatomic features of interest for determining the location of sonographic capture were identified, and sonograms were captured at 50% of the distance from the greater trochanter to the lateral border of the patella.17,20 To ensure consistent image capture, a semi-permanent marker was used to draw a line along the surface of the skin at the aforementioned location. The sonographer applied consistent probe pressure along the surface of the skin while taking all sonographic images. All measures of muscle morphology were obtained using a B-mode, 12-MHz linear transducer (General Electric LOGIQ e, Wauwatosa, WI, USA), which was coated with transmission gel (AquasonicVR 100; Parker Laboratories, Fairfield, NJ, USA) to provide acoustic contact without depressing the dermal layer of the skin.17,20 The transducer was oriented perpendicularly to the skin, and the transducer marker was facing the lateral side of the body for transverse scans. Ultrasound settings remained fixed for each participant and for each round of assessments (gain: 50 dB; dynamic range: 72; depth: 5 cm). For both T0 and T15, three sonograms were captured in the transverse plane using extended field-of-view panoramic ultrasonography (LogiqView™). The same experienced sonographer, with 5 years of experience in ultrasonography, completed all sonographic images and image analyses. Sonograms were analyzed offline using an image analysis software (ImageJ, version 1.45s; National Institutes of Health, Bethesda, MD, USA). Recent research suggests that SFT adjacent to the muscle can nonsystematically affect EI values, such that increasing SFT results in an attenuation of the ultrasound beam in deeper tissues and a subsequent artificial decrease in EI.27,39 Therefore, EI corrected for SFT may better reflect true muscle quality than raw EI values. In accordance, CSA, SFT, uncorrected EI, and EI corrected for SFT (EICor) were assessed using the following procedures, which have been previously described 6 :
CSA: An arbitrary known distance in each sonogram was used to calibrate the image analysis software. In each image, the outline of the VL muscle was traced using the polygon function tool, including as much of the VL muscle as possible without including surrounding connective tissue, bone, SFT, or fascia. 20 The total area of the traced polygon was calculated and reported in centimeters squared.
EI: The region of interest previously demarcated for CSA determination was used to quantify EI. EI of the traced polygon was determined using the brightness standard histogram function in the image analysis software. The standard histogram function allows for quantification of the gray-scale of each individual pixel in the region of interest, and values were expressed as a number between 0 and 255 arbitrary units (AU) (0: black; 255: white).17,20,26 The gray-scale values for each individual pixel were projected on a histogram. EI was quantified as the mean of all gray-scale values5–7,17–20,27,31,39–41 and was reported in AU.
SFT: SFT was determined as the perpendicular distance between the superior border of the superficial aponeurosis and the inferior border of the epithelium. 27 Because SFT values can change along the length of the muscle, quantification of overall SFT was determined as the average of SFT values at three locations in the image: adjacent to the lateral, mid-line, and medial portions of the VL. SFT was quantified using the line tool in the image analysis software (Figure 2)27,39 and was reported in centimeters.
EICor: EI values for each image were corrected for SFT using an equation previously established by Young et al 27 and were reported in AU:

The average values for each variable calculated from all three images at each time point (T0 and T15) were used for further analysis.
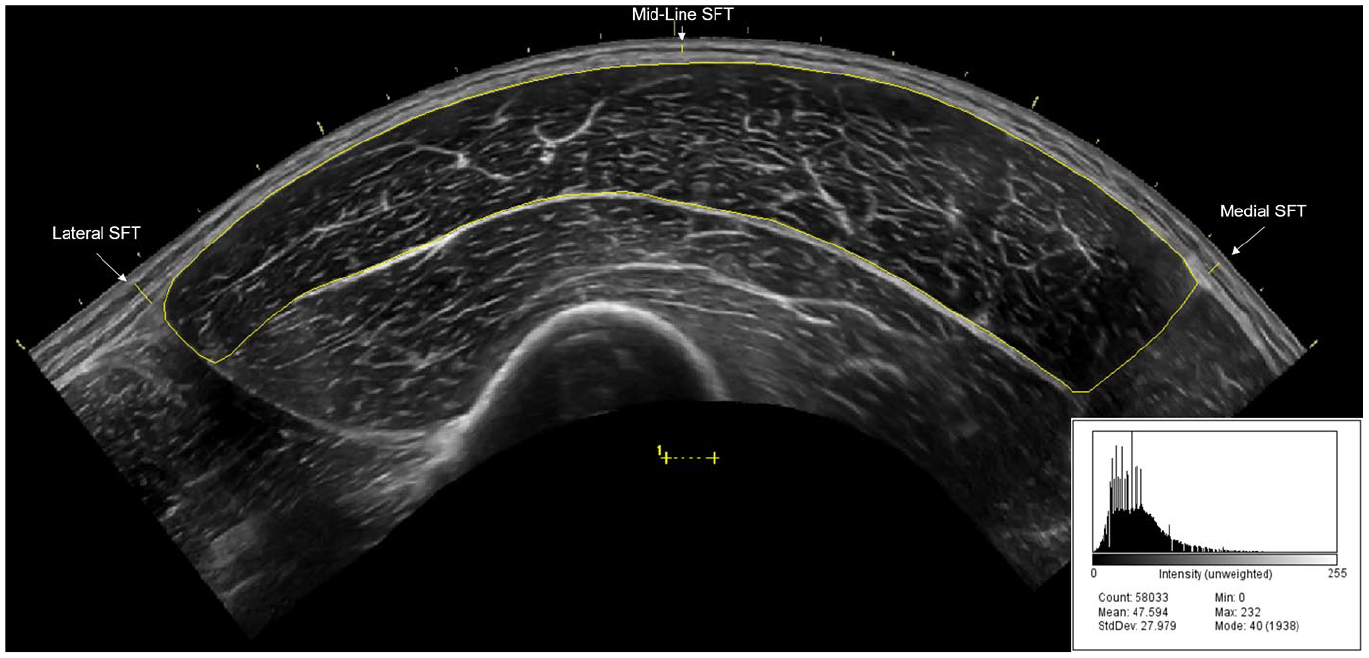
An example panoramic ultrasound image of the vastus lateralis (VL). Echo intensity (EI) was determined by manually tracing the border of the VL, excluding the surrounding fascia using the polygon function in ImageJ software (National Institutes of Health, Bethesda, MD, USA). Subcutaneous fat thickness (SFT) was determined from the average of the lateral, mid-line, and medial SFT values (which are highlighted in the image) and was used to calculate corrected EI (EICor) as described by Young et al. 27 An example of the corresponding gray-scale histogram for EI quantification is provided.
Intraday reliability values of the sonographer in the quantification of CSA, EI, SFT, and EICor of the VL for the three images taken at T0 and T15, corresponding to immediately post recumbency (“IP”) and 15 minutes after rest in the non-dominant lateral recumbent position (“NDLR”) in our previous study, respectively, have been reported. 6 In addition, interday reliability values of the sonographer in the quantification of CSA and EI of the VL have previously been completed on a separate sample of participants with at least 24 hours between examinations. 19 These values demonstrate high to excellent precision and reliability of the sonographer for all variables measured. 42
Statistical Analyses
Prior to statistical analysis, data were assessed for normality and sphericity. To determine whether muscle quality affected the decrease in CSA following recumbent rest, two separate analyses were completed. The first aim was to establish whether a relationship existed between muscle quality (EICor) and the percentage change in CSA (%ΔCSA) from T0 to T15 using Pearson’s r. %ΔCSA was calculated using the following equation:
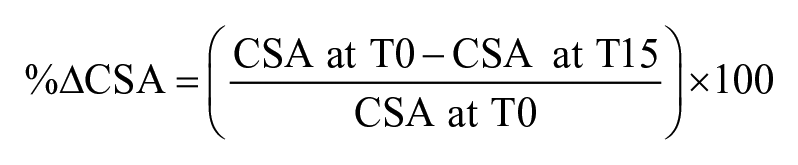
Negative values were used to indicate a decrease in CSA from T0, and positive values were used indicate an increase in CSA from T0. Correlation magnitudes were quantified using the following descriptors: 0.00–0.10: trivial; 0.11–0.30: small; 0.31–0.50: moderate; 0.51–0.70: large; 0.71–0.90: very large; 0.91–1.00: almost perfect. 43
The second aim was to determine whether participants with the lowest and highest muscle quality differed in their muscle morphological response to recumbent rest. Participant data were categorized into groups based on the EICor values obtained during T0, such that EICor values lower than the 33rd percentile were classified as “lowest” (LO) and EICor values greater the 66th percentile were classified as “highest” (HI). This three-category split procedure has been shown to be substantially more efficient than a median split procedure from a statistical perspective, as these groups represent high and low categories that are distinct from one another, and data in the middle category (ranging from the 33rd to 66th percentile) are discarded.44,45 Group differences (LO vs HI) in anthropometric measurements and body composition were analyzed using independent-samples t-tests. Group differences in muscle morphological characteristics over time were analyzed using a 2 × 2 (Group [LO vs HI] × Time [T0 vs T15]) repeated-measures analysis of variance (ANOVA). A Greenhouse–Geisser correction was applied if the assumption of sphericity was violated. In the event of a significant interaction, Bonferroni post hoc tests were used for pairwise comparisons. Comparisons between groups were analyzed using 95% confidence intervals (CIs) and Cohen’s d. Magnitudes of the standardized effects were interpreted using thresholds of <0.01, 0.2, 0.5, 0.8, 1.2, and 2.0, which were considered very small, small, medium, large, very large, and huge effects, respectively. 46
Significance was set at P ≤ .05, and a statistical software (Statistical Package for the Social Sciences [SPSS] V.26.0, Chicago, IL, USA) was used for all analyses. Outliers were classified as EICor values that exceeded 1.5 times the interquartile range from the first and third quartiles of the data 47 and were not included in the final analysis. All data are reported as mean ± SD, unless otherwise noted.
Results
Participants
One participant was withdrawn from the investigation, as he failed to appear for the testing visit. Data from three participants were removed from the analysis because the VL muscle could not fit into the image at a depth of 5 cm. An additional participant was removed from the final data analysis because they were deemed to be an outlier. Therefore, data from 30 participants were included in the primary correlation analysis, and data from 20 participants were included in the secondary grouping analysis (corresponding to EICor values falling below the 33rd [66.37 AU] or above the 66th [80.20 AU] percentile). Thus, participants with EICor values at or below 66.37 AU were deemed “LO,” and participants with EICor values at or above 80.20 AU were deemed “HI.” All data for outcome variables exhibited normality.
Anthropometric Measurements and Body Composition
Descriptive and anthropometric data (age, height, body mass, body fat percentage) of all participants included in the primary analysis are presented in Table 1. Comparisons between participants dichotomized into LO and HI groups for the secondary analysis revealed no significant differences in age or height (all P > .05) between groups. However, body mass (t = 2.931; P = .009; d = 1.31; CI = 4.249–25.751 kg) and body fat percentage (t = 5.271; P < 0.001; d = 2.36; CI = 4.948–11.692%) were significantly greater in the HI compared with LO group.
Descriptive Information and Anthropometric Measurements of Participants Included in the Overall Analysis As Well As Those in LO and HI Groups.
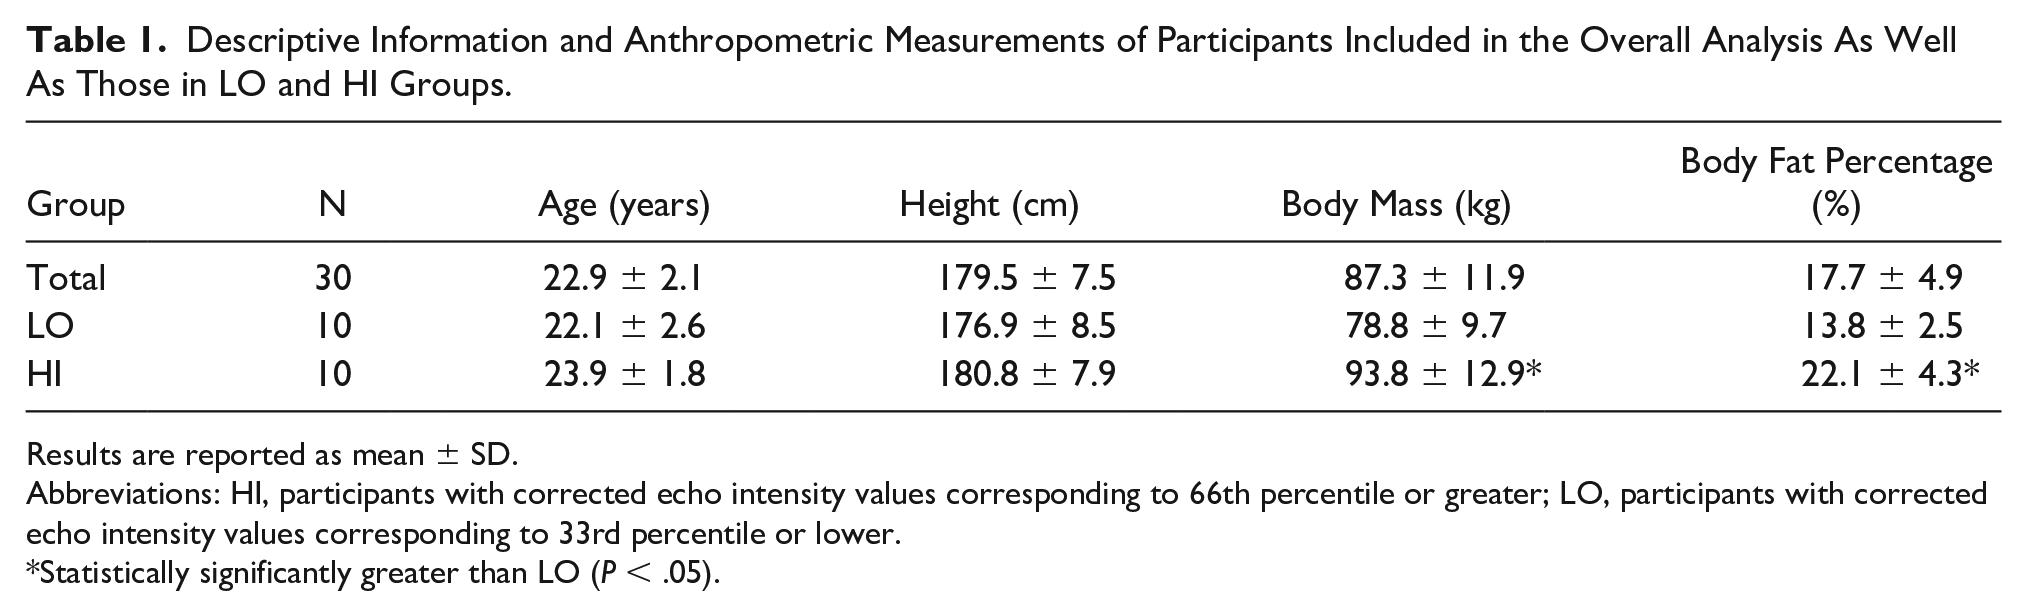
Results are reported as mean ± SD.
Abbreviations: HI, participants with corrected echo intensity values corresponding to 66th percentile or greater; LO, participants with corrected echo intensity values corresponding to 33rd percentile or lower.
Statistically significantly greater than LO (P < .05).
Sonographic Assessments
Individual data for EICor and corresponding %ΔCSA are presented in Figure 3. No significant correlations were observed between EICor at T0 and %ΔCSA (r = 0.269; P = .151).
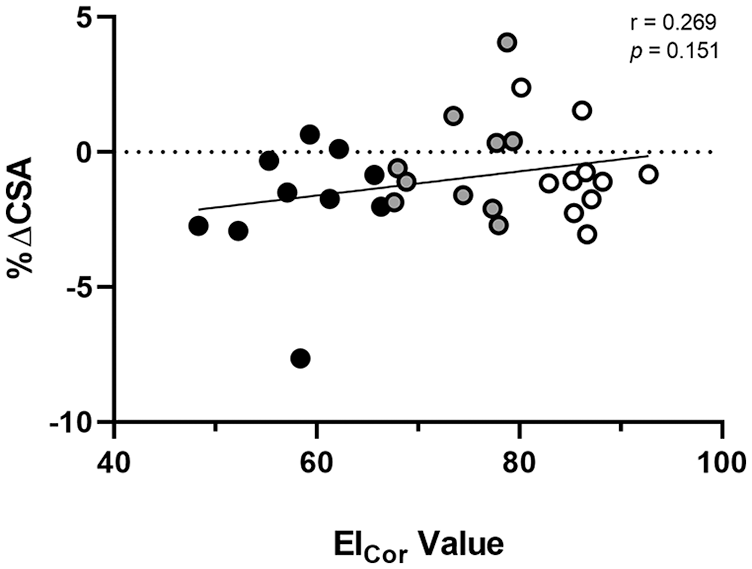
Individual data for corrected echo intensity values (EICor; AU) and corresponding percentage changes in cross-sectional area (%ΔCSA; %) of the vastus lateralis (VL) following 15 minutes of recumbent rest. A negative %ΔCSA denotes a decrease in muscle CSA. Participants with EICor values lower than the 33rd percentile were classified as “LO” and are denoted by black circles. Participants with EICor values greater than the 66th percentile were classified as “HI” and are denoted by white circles. The line of best fit is indicated by the solid black line.
Values for CSA, EI, SFT, and EICor between LO and HI at T0 and T15 are presented in Table 2. No significant Group × Time interactions were observed for any muscle morphological variable (CSA: F1,18 = 1.512; P = .235;
Group Comparisons in Muscle Morphological Characteristics Following 15 Minutes of Recumbent Rest.
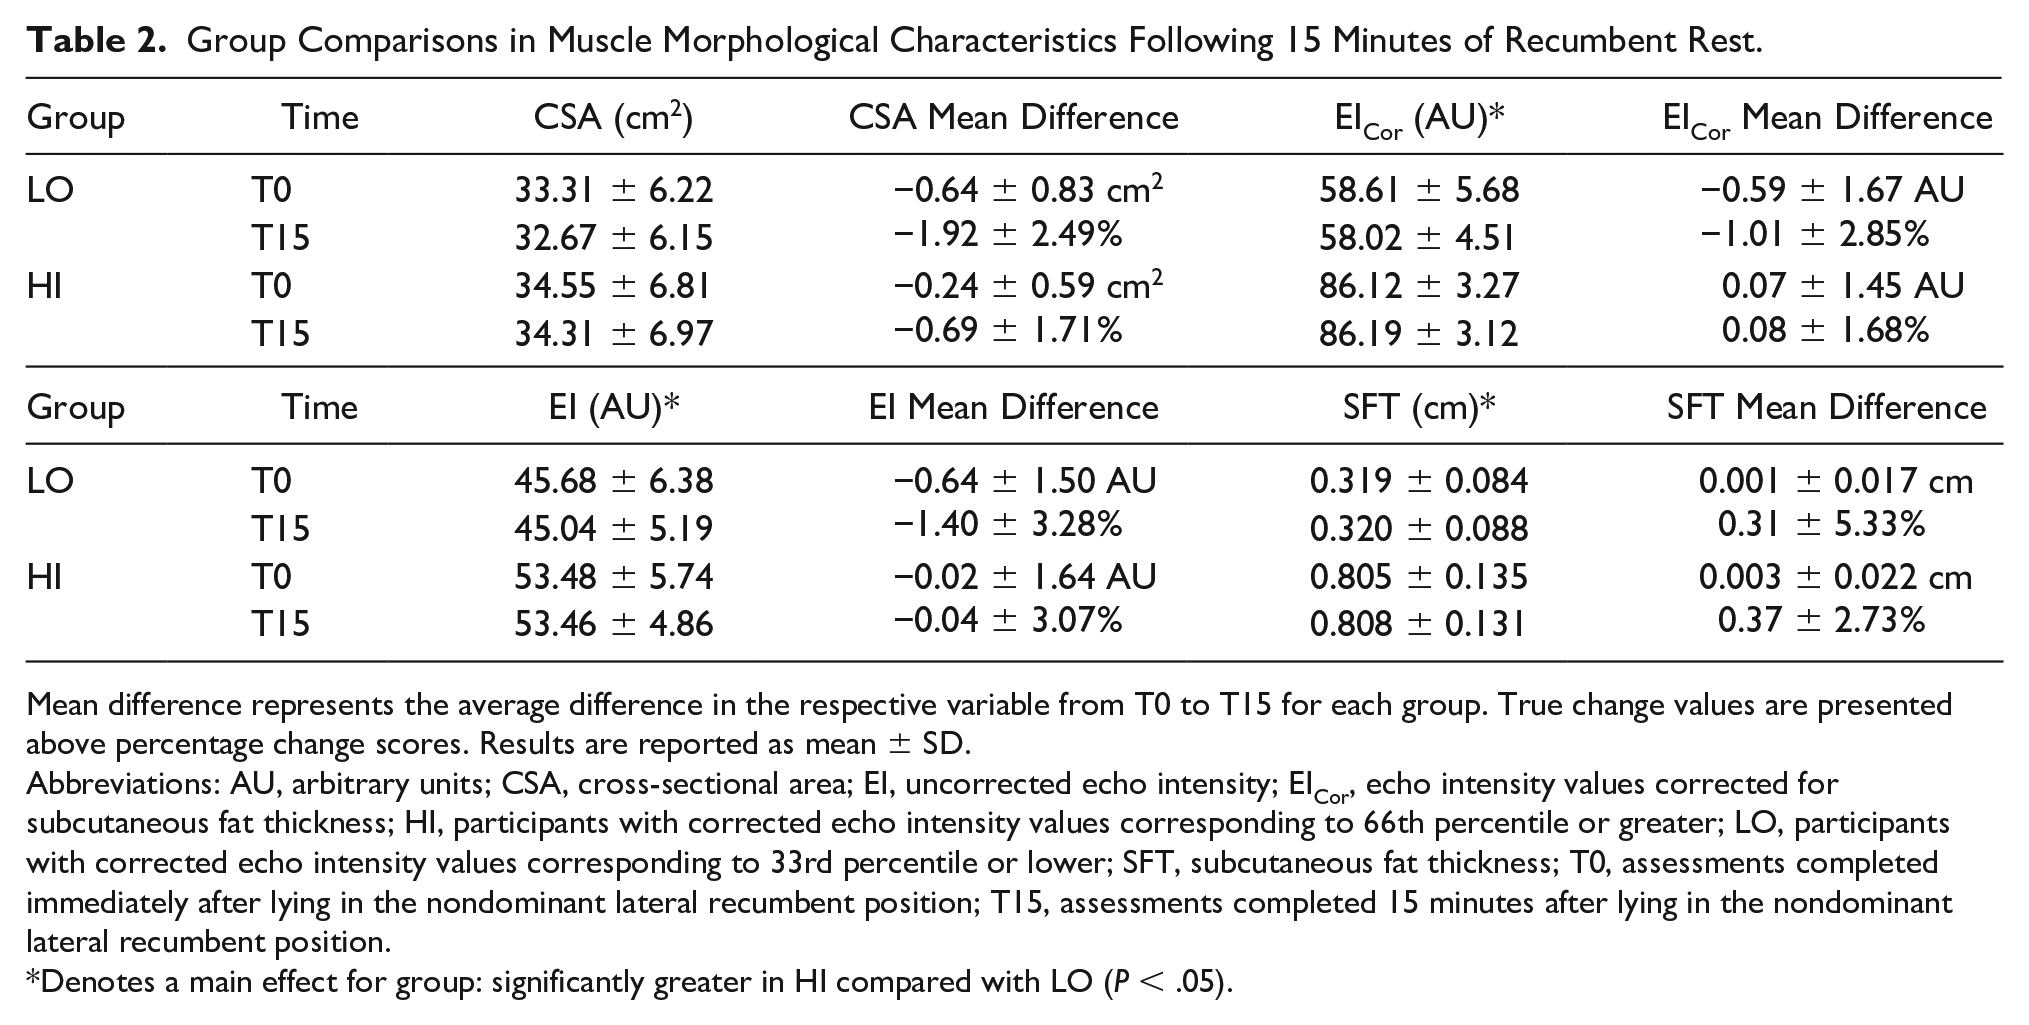
Mean difference represents the average difference in the respective variable from T0 to T15 for each group. True change values are presented above percentage change scores. Results are reported as mean ± SD.
Abbreviations: AU, arbitrary units; CSA, cross-sectional area; EI, uncorrected echo intensity; EICor, echo intensity values corrected for subcutaneous fat thickness; HI, participants with corrected echo intensity values corresponding to 66th percentile or greater; LO, participants with corrected echo intensity values corresponding to 33rd percentile or lower; SFT, subcutaneous fat thickness; T0, assessments completed immediately after lying in the nondominant lateral recumbent position; T15, assessments completed 15 minutes after lying in the nondominant lateral recumbent position.
Denotes a main effect for group: significantly greater in HI compared with LO (P < .05).
Discussion
Previous research reports that 15 minutes of recumbent rest results in significant decreases in CSA of the VL in physically active adults.5,6 It has been suggested that the extent of this change may be dependent on tissue composition, in which muscles with greater contractile tissue content exhibit greater decreases in lower extremity muscle size. 9 In contrast to this hypothesis, this study observed no significant relationship between EICor and %ΔCSA from T0 to T15. Furthermore, there were no significant differences in VL CSA from T0 to T15 between participants dichotomized into LO and HI EICor groups. These findings indicate that differences in sonographically-derived muscle quality do not affect the change in muscle size following recumbent rest.
This study demonstrates that the degree of decrease in CSA of the VL following recumbent rest is not related to muscle quality as assessed via EICor. These findings align with those of Shea, who observed significant decreases in VL CSA after 20 minutes of supine rest in both younger and older physically inactive males, but no differences in the degree of CSA decrease between groups. 10 Although EI typically increases with aging17,30,48 and both EICor and raw EI were greater in older compared with younger males in the investigation by Shea, 10 muscle quality is not solely dependent on age. In the current study, there was considerably large variability in EICor values between subjects, despite the young age of subjects recruited. The lack of group differences in muscle morphological changes to recumbent rest between LO and HI illustrates that even individuals with the lowest and highest muscle quality do not differ in muscle size response to recumbent rest. Lower EICor, EI, body mass, body fat percentage, and SFT were observed in LO compared with HI, reflecting a greater overall body adiposity in the HI group. It is thought that excess SFT can lead to infiltration of intramuscular fat,52,53 and total body adiposity seems to be highly predictive of tissue-specific intramuscular fat.52,53 In theory, greater SFT may correspond with an increased raw EI value. However, raw EI is nonsystematially affected by the amount of SFT adjacent to the muscle, creating an artificial decrease in muscle EI in deeper tissues. 27 The correction of EI for SFT reduces the nonsystematic effects of ultrasound beam attenuation on muscle quality measures, making EICor a more accurate measure of muscle quality than raw EI.27,39 Accordingly, EICor has been shown to better predict muscle function6,54 and adiposity27,39 than raw EI, highlighting the importance of correcting for SFT in the examination of muscle quality.
The lack of a significant relationship between EICor and %ΔCSA from T0 to T15 is consistent with the notion that fluid movement likely does not occur without changes in intracellular or extracellular fluid osmolality, which does not occur with recumbent rest.24,25 According to the proposed theory that muscle composition may affect the extent of fluid shifts following recumbent rest, a decrease in hydrostatic pressure within the lower body induced by a recumbent position may allow intracellular fluid to move out of muscle cells into the interstitial space and into the vascular system. 9 This implies that there is a movement of fluid from the intracellular to the extracellular compartment and that this volume of movement will be greater in muscle containing more lean tissue. However, postural manipulations result only in significant changes in interstitial fluid, blood, and plasma volume, with no true changes in intracellular or extracellular fluid volumes.12,55,56 Hargens 57 observed decreased interstitial fluid pressure and volume of the leg after transitioning from a standing to a supine 5% head-down tilt position, but no significant changes in type I and type II muscle fiber areas. Nevertheless, research using BIA and bioelectrical impedance spectroscopy (BIS) has indicated that recumbent rest may induce significant changes in whole body and segmental extracellular and intracellular fluid volumes.25,58–60 The changes in intracellular and extracellular water reported in previous investigations8,10,25,58–60 are thought to reflect a fluid redistribution from the lower body to the head and thorax, which induces changes in resistance and impedance between body segments. Therefore, these changes are probably spurious and do not indicate a true movement of fluid between the extracellular and intracellular compartments.25,60 In addition, postural-induced changes in CSA are not associated with changes in the intracellular water or extracellular water to total body water ratios. 10 These findings demonstrate that recumbent rest does not induce true fluid movement from the intracellular to extracellular compartments. 25 Thus, the lack of significant group differences in CSA in this study are likely a result of similar net movements of fluid between the interstitial fluid and bloodstream among subjects, which does not appear to be affected by muscle composition.
The proposition that muscle composition may affect the extent of rest-induced fluid shifts was derived from an investigation by Cerniglia et al 9 in which older, sedentary females with normal-density muscle (containing lower intramuscular fat) had significantly greater decreases in thigh muscle CSA following supine rest compared with females with low-density muscle (containing higher intramuscular fat). Although it is difficult to determine why the present CSA results differed from those of Cerniglia et al, 9 differences in imaging techniques, populations, and physical activity status between participants may elucidate these discrepancies. The current study used sonography, whereas the investigation by Cerniglia et al., used CT, both of which entail vastly different procedures and technical skills. CT captures images in a plane along a perfectly vertical axis, perpendicular to the table and not to the participant. In contrast, sonography captures images perpendicular to the participant’s leg and not to the table. Previous research has suggested that a difference in the perpendicular axis of measurement of only 5–10° can result in a difference in muscle CSA of approximately 1 –3%. 61 Thus, sonography may be more appropriate to detect true changes in CSA than CT. In addition, this study evaluated CSA of the VL muscle, whereas the study by Cerniglia et al 9 examined CSA of the entire thigh musculature, and both were measured at different anatomic locations. A greater overall muscle area may allow for a greater degree of posturally-induced fluid shifts, however future research is necessary to determine these effects. The examination of muscle density in the investigation by Cerniglia et al 9 compared with EICor in this study is another important methodological difference. Muscle quality measures derived from CT and sonography have been shown to be significantly different, although related. 28 The CT radiologic density value is primarily affected by the presence of intramuscular fat and water content, 62 whereas EI may also be influenced by the presence of fibrous tissue and other connective tissue. 63 Previous research has suggested that EI may be a more effective indicator of muscle quality than radiologic density. 28 Nevertheless, EI is influenced by various factors other than muscle composition, including tissue depth,27,39 probe tilt, 64 glycogen content, 65 and muscle damage, 14 indicating that EI in itself is not a perfect measure of muscle quality. Furthermore, Cerniglia et al 9 used an automated technique for the assessment of tissue size as well as a preprogrammed range of radiologic density to distinguish low-density muscle from normal-density muscle. The present study used a tracing technique in an image analysis software to manually define borders of skeletal muscle. Percentiles were also used in the present study to delineate participants with the highest and lowest muscle quality. Perhaps most importantly, this study used a sample of young, resistance-trained, healthy males, whereas the investigation by Cerniglia et al 9 investigated sedentary older females. It is possible that health and exercise training status may have influenced the results, as the proportion of noncontractile to contractile tissue increases with age and inactivity. 52
This study has several limitations that must be considered when interpreting its results. Firstly, EI can be influenced by several confounding factors, and a recent review has cautioned against the use of EI as a measure of muscle quality. 66 Nevertheless, most studies included in this review 66 did not correct for SFT in their measurement of EI, and EI measures may have been nonsystematically affected by differences in SFT. In addition, the equation established by Young et al 27 used to calculate EICor in the current investigation was developed using data from other muscle groups (rectus femoris, biceps femoris, tibialis anterior, and medial gastrocnemius), and it is it possible that this correction factor may not apply to the VL. As EI is influenced by the ultrasound device and settings used, the correction factor established by Young et al 27 may not apply to different ultrasound methodologies. However, previous research has used the same equation in the VL to confirm that SFT-corrected EI is more predictive of physical performance 6 and provides more consistent values along the length of the VL 67 than raw EI, despite using different ultrasounds, populations, and image settings. It is also possible that the decrease in muscle CSA may be a consequence of changes in muscle shape and dimension that occur with the transition to a recumbent position, regardless of the fluid volume shifting out of the muscle. Therefore, the degree of CSA change may be dependent on various other factors, such as muscle shape, location, pennation, width, and degree of muscle contraction. Certainly, future research is necessary to determine the effects of these factors on rest-induced changes in muscle CSA. In addition, we used a relatively homogeneous sample of resistance-trained males and a surrogate measure of muscle quality (EICor) in this investigation, without directly measuring the proportion of intramuscular contractile to noncontractile tissue between subjects. Muscle quality is purported to increase following resistance training, and it is possible that any differences in EI between subjects may not necessarily indicate differences in contractile components of the muscle. Similar ages and physical activity levels among participants in this study may have contributed to the lack of an observable relationship between muscle quality and the decrease in muscle CSA. Including a sample of inactive or older individuals may have helped to expand our results; however, adding other populations into our analysis may have introduced additional confounding factors. For example, the physiological consequences of aging and inactivity expand further than just changes in muscle composition. Decreased muscle capillarization, typically observed with aging, may affect blood distribution following postural manipulations. 68 Furthermore, differences in cardiovascular responses to sudden upright posture, 69 venous compliance, blood flow responses, and blood pooling between physically active and sedentary individuals 70 may also lead to differences in blood distribution throughout the body, which potentially could affect changes in muscle size measures after recumbency. Future research is necessary to determine the independent effects of age and activity level on the muscle size response to recumbent rest.
Conclusion
Ultrasonography has been used in previous research to quantify muscle morphological characteristics, which aid in the prediction of muscle function from structure. Sonograms of the lower body are typically captured while the participant is lying down. However, the transition to recumbency elicits changes in tissue size of the lower extremity, affecting the relationship between muscle structure and function. It has been previously postulated that muscle composition may affect the extent of decrease in muscle size of the lower extremity following recumbency, 9 and research has suggested that the time frame of muscle size data acquisition may be different between populations.9,10 The results of this investigation suggest that the decrease in muscle CSA (%ΔCSA) of the VL induced by recumbency is not affected by muscle quality (EICor) as measured via sonography in young, resistance-trained males. These findings also show that 15 minutes of recumbent rest elicits similar decreases in CSA of the VL in resistance-trained males with low and high muscle quality (LO and HI groups), indicating that postural-induced fluid shifts do not depend on differences in muscle quality alone. Consequently, the time frame of muscle size data acquisition should not differ based on potential differences in muscle quality. Nevertheless, the overall decrease in muscle CSA with recumbent rest is sufficient enough to alter the ability of CSA measures to predict muscle strength and power; therefore, CSA measures may be most accurate for predicting strength when obtained immediately after recumbency.5,6,9 Future research is necessary to determine whether physical inactivity may contribute to a reduced overall fluid flux with postural changes. In conclusion, these data demonstrate that surrogate measures of muscle quality of the VL, as assessed via EICor, do not affect the extent of decrease in VL CSA following recumbent rest in resistance-trained young males.
Footnotes
Ethics Approval
This investigation was approved by the Institutional Review Board for human subjects at the University of Central Florida (BIO-18-14303), and all procedures were in accordance with the ethical standards of the 1964 Helsinki Declaration and its later amendments.
Informed Consent
Written informed consent was obtained from all subjects before the study.
Animal Welfare
Guidelines for humane animal treatment did not apply to the present study because only human subjects were used.
Declaration of Conflicting Interests
The authors declared no potential conflicts of interest with respect to the research, authorship, and/or publication of this article.
Trial Registration
Not applicable.
Funding
The authors received no financial support for the research, authorship, and/or publication of this article.