
Abstract
Objective
To evaluate grayscale sonographic characteristics and their correlation with the estimated glomerular filtration rate.
Methodology: This cross-sectional study included 103 patients with stage III and above chronic kidney disease. Correlation between ultrasonography measurements and estimated glomerular filtration rate was performed. Differences in the mean estimated glomerular filtration rate were evaluated using one-way analysis of variance.
Results
The mean (± SD) estimated glomerular filtration rate was 34.47 ± 15.81 mL/min/1.73 m2 (range: 9.6–45.9 mL/min/1.73 m2). The mean (± SD) average renal length was 8.97 ± 1.42 cm. The mean parenchymal and cortical thicknesses were 1.36 ± 0.45 and 0.85 ± 0.27 cm, respectively. There was a significant correlation between the estimated glomerular filtration rate and the average renal length, relative renal length, and parenchymal thickness (r = 0.26, p = 0.009; r = 0.25, p = 0.01; and r = 0.25, p = 0.01, respectively). A statistically significant negative correlation was observed between renal echogenicity and estimated glomerular filtration rate (p < 0.001).
Conclusion
A correlation was noted between the degree of renal function loss and sonographic findings. This indicates that ultrasound can be used in combination with other modalities for the diagnosis, assessment, and monitoring of chronic kidney disease.
Keywords
Introduction
One of the main causes of mortality and morbidity in developed as well as developing countries is chronic kidney disease (CKD). In 2015, 10% of the global population was estimated to have CKD. 1 In Africa, the pooled prevalence of CKD is 10.1% in the general population, 24.7% in hypertensive individuals, and 16.6% in those with diabetes mellitus (DM). 2
Glomerular diseases are one of the major causes of end-stage renal disease (ESRD). In the US, 20%–35% of patients who required renal replacement therapy had glomerular disease. Glomerular diseases are also common in low-income countries, with 2%–3% of medical admissions estimated to be due to renal complaints secondary to glomerulonephritis. Infections constitute the other renal pathologies that lead to ESRD. Cystitis has an incidence of 0.5 per person per year in sexually active women with a recurrence rate of 27%–44%. 3 Urinary schistosomiasis and genitourinary tuberculosis are common in developing countries. Obstructive uropathy is the leading cause of ESRD in developing countries. 3
The most reliable measure for overall renal function is serum creatinine (SCr) levels. Currently, the most reliable technique to determine glomerular filtration rate (GFR) for various populations is the Chronic Kidney Disease Epidemiology Collaboration (CKD-EPI) creatinine equation. The CKD-EPI creatinine equation, in contrast to the Modification of Diet in Renal Disease Study equation, allows for more precise risk prediction for unfavorable outcomes, fewer false-positive diagnoses of CKD, lower prevalence estimates for CKD, and more accurate GFR estimation.4,5
In the clinical evaluation of patients with renal disease, renal ultrasound is usually the initial imaging modality used. The majority of pathological conditions that evolve into chronic renal diseases result in parenchymal atrophy, sclerosis, fibrosis, and a reduction in renal size. 6
Several renal measurements that are assessed sonographically are believed to be related to renal function in patients with CKD, including absolute renal length, cortical echogenicity,7–9 relative renal length, and cortical thickness. 6
Sonographic examination is still not regularly incorporated into the care of patients with CKD despite growing evidence on its use. This study aimed to evaluate the correlation between eGFR and ultrasonographic renal parameters in individuals with CKD.
Methodology
Study design and setting
In this cross-sectional study, we recruited 103 consecutive adults with CKD who were known to have stage 3 and above disease and visited the renal follow-up clinic. The study was performed between May 2021 and August 2021. The reporting of this study conforms to the Strengthening and Reporting of Observational Studies in Epidemiology (STROBE) guidelines. 10
Study participants
Patients above 18 years of age with known stage 3/4/5 CKD whose GFR was determined to be <60 mL/min/1.73 m, 2 as calculated by CKD-EPI, were included in the study.
Patients undergoing dialysis, kidney transplant recipients, and those with acute kidney injury were not included. Additionally, patients with chronic liver disease and fatty liver were excluded.
Data collection
Grayscale ultrasonographic findings, clinical data, laboratory data, and sociodemographic data were all documented in the data-collecting format.
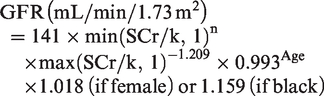
For eGFR calculations, the lowest SCr level recorded within 90 days of ultrasonography was used. The lowest SCr was used to estimate GFR, which was calculated using the CKD-EPI creatinine equation (2009).
4
Variables
SCr: Serum creatinine (mg/dL)
k: 0.7 for females and 0.9 for males
α: −0.329 for females and −0.411 for males
min: The minimum value of SCr/k or 1
max: The maximum value of SCr/k or 1
The investigator was blinded to the results of eGFR to minimize potential bias. After conducting three different measurements for each kidney, the average measurement was determined.
During inhalation, a coronal scan revealed and highlighted the superior and inferior poles. Based on the largest distance between the superior and inferior poles, the renal length (L) was determined.
The renal cortical thickness was measured as the shortest distance between the base of the medullary pyramid and the renal capsule, bilaterally in the sagittal plane at the level of the mid-kidney over a medullary pyramid and perpendicular to the capsule. It was used to calculate the average cortical thickness.
Parenchymal thickness was measured as the distance between the sinus fat and the renal capsule. The upper, middle, and lower poles of the kidneys were measured for thickness, and the average values were calculated (Figure 1).
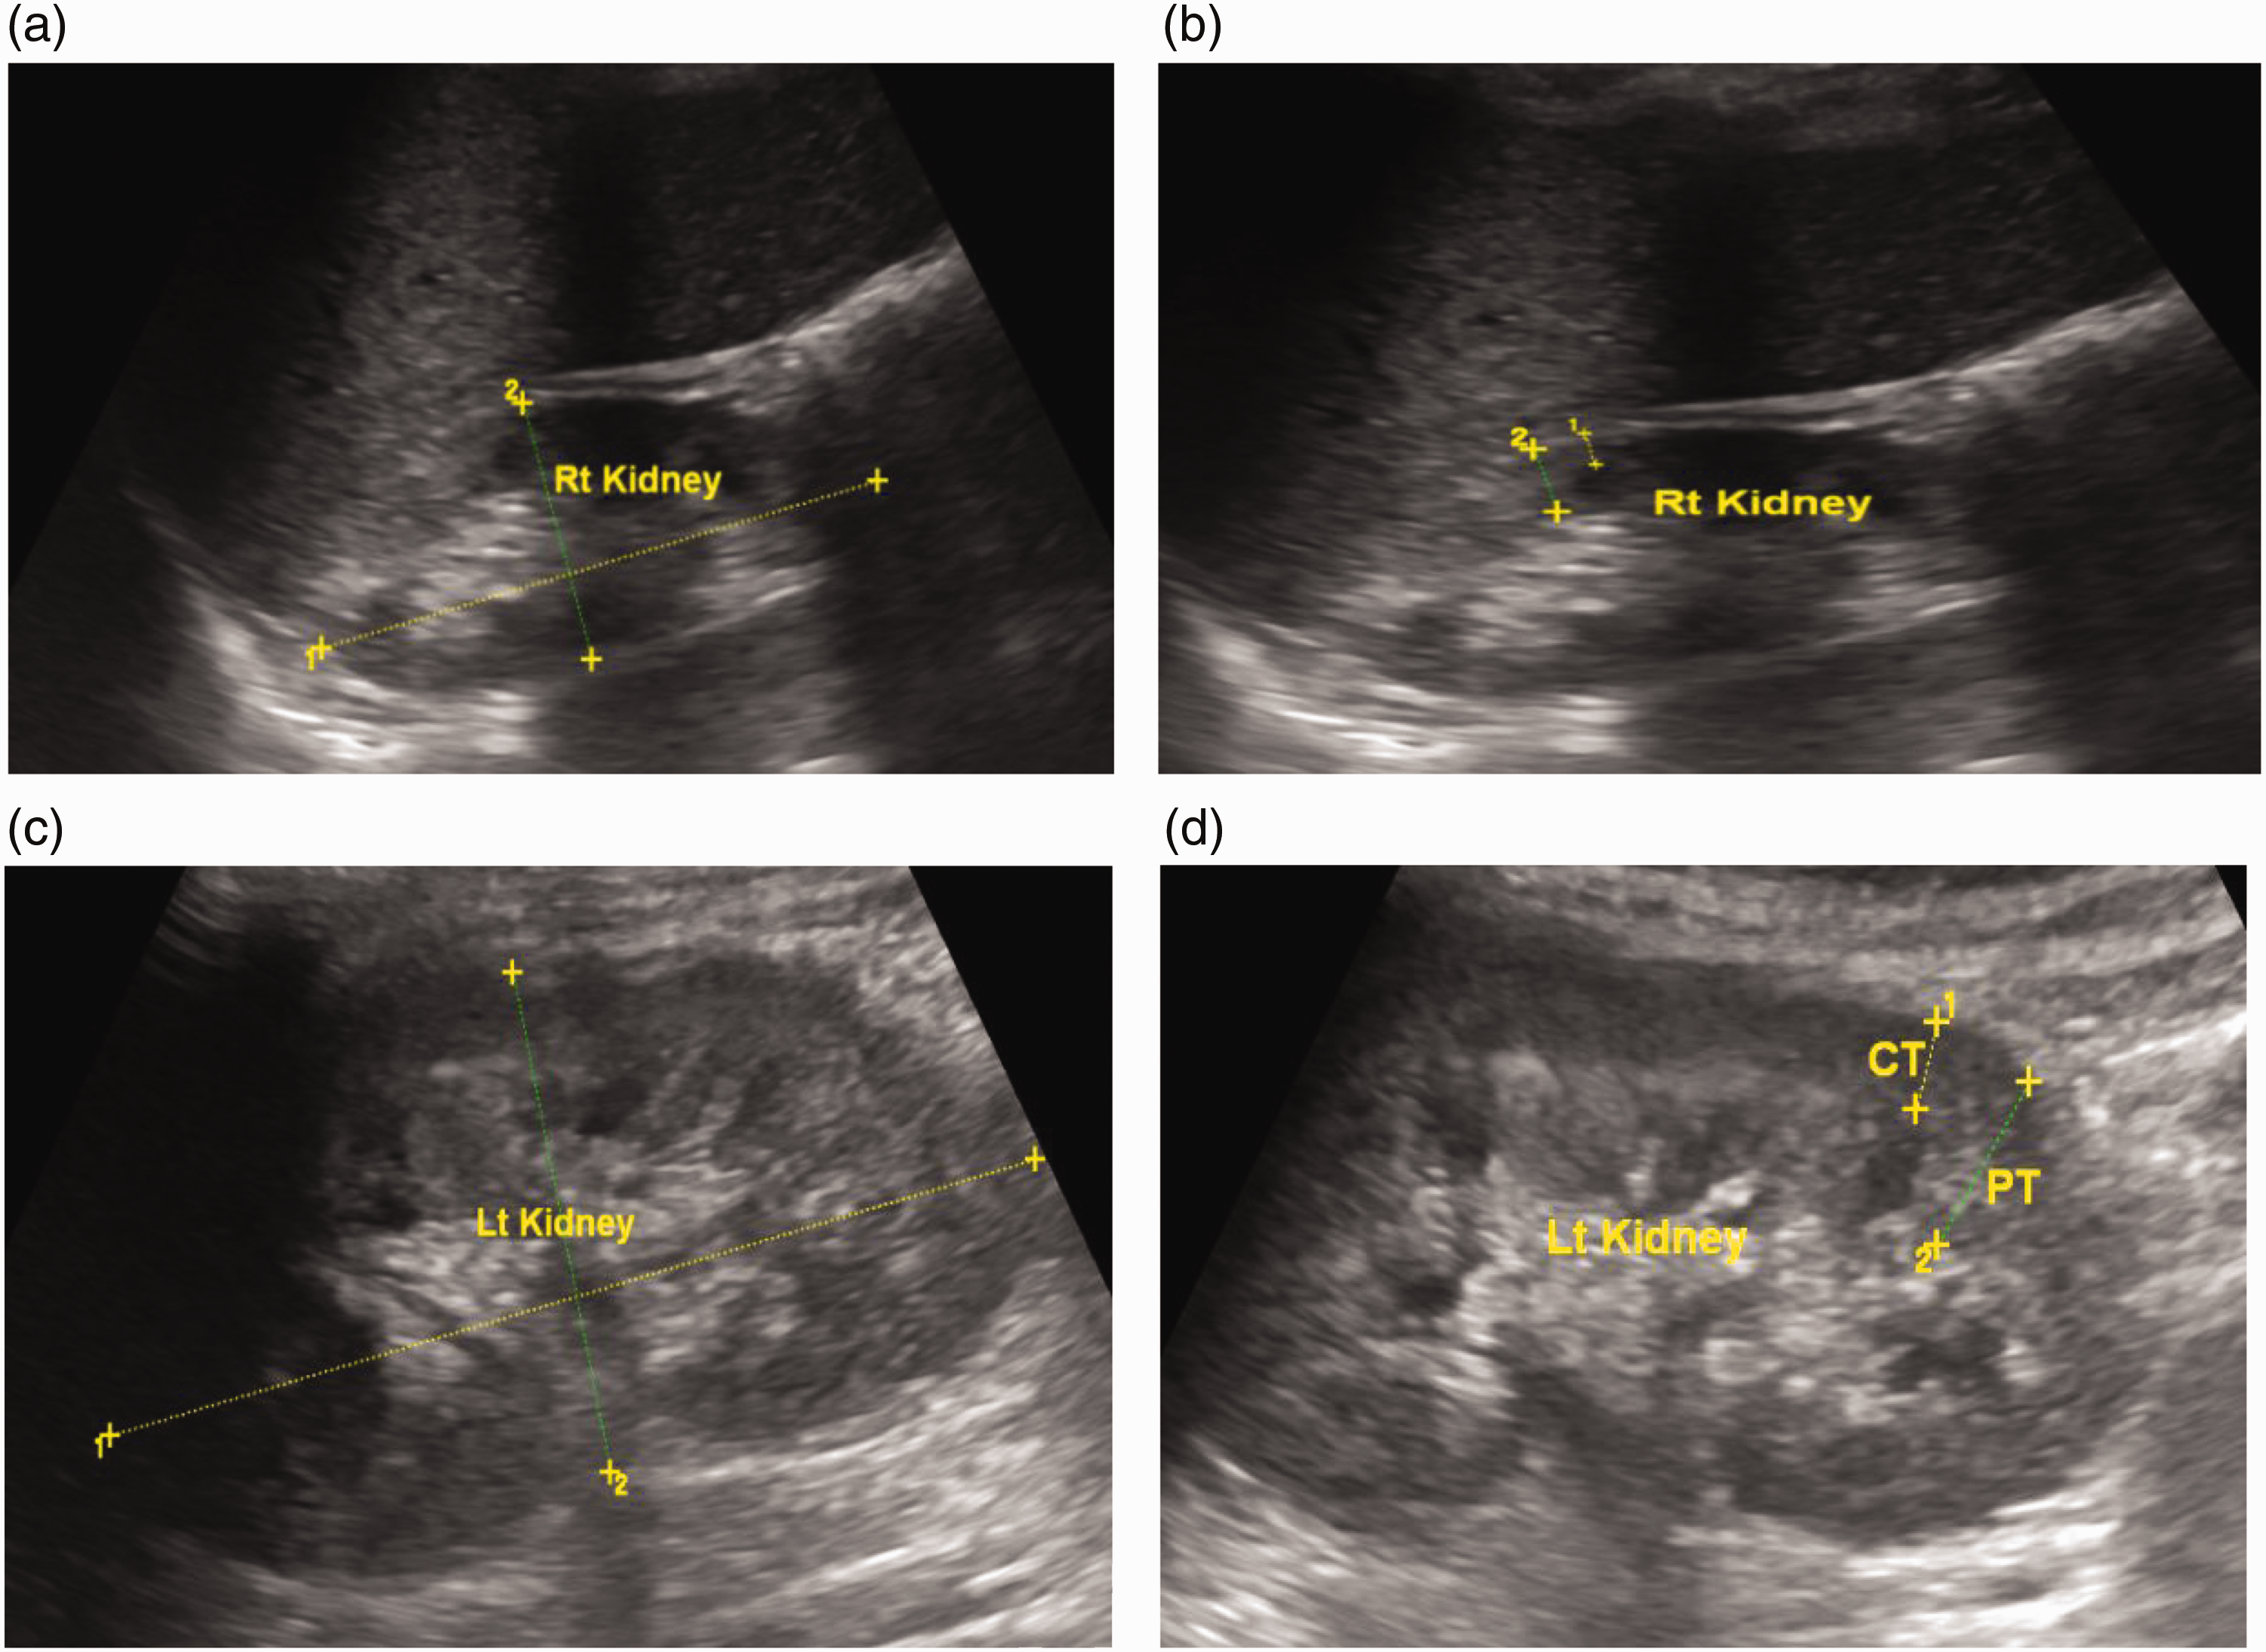
(a) A 49-year-old woman with stage III CKD. Figure 1(a) and 1(b) shows a longitudinal grayscale ultrasound image of the right kidney. Based on the longitudinal ultrasound image, the right kidney measured 7.4 cm in length (Figure 1(a)). As shown in Figure 1(b), “1” represents the first calibre measuring a CT of 0.44 cm, and “2” represents the second calibre measuring a PT of 0.88 cm. Grade II cortical echogenicity was demonstrated. Figures 1(c) and 1( d) represents a longitudinal grayscale ultrasound image of the left kidney. The left kidney measured 8.2 cm in length. Figure 1(d) shows a PT of 1.2 cm and CT of 0.65 cm with grade II cortical echogenicity. CKD: chronic kidney disease; CT: cortical thickness; PT: parenchymal thickness.
Renal cortical echogenicity was compared and graded according to the echogenicity of the liver and renal medulla. According to Brenbridge et al., renal parenchymal echogenicity is graded from I to IV. Grade I renal echogenicity is less than that of the liver/spleen, and grade II renal echogenicity is similar to that of the liver/spleen. Grade III renal echogenicity is more than that of the liver/spleen, and grade IV renal echogenicity is equal to that of the central renal sinus. 11
Statistical analysis
IBM Statistical Package for Social Science (SPSS) (Version 26.0, IBM Corp., Armonk, NY, USA) was used for statistical analyses. The mean, standard deviation, frequencies, and percentages were used to calculate the patients’ demographic and clinical characteristics. The correlations between eGFR and renal length, parenchymal thickness, and cortical thickness were evaluated using Pearson’s correlation coefficient. The relationship between cortical echogenicity and eGFR was evaluated using Spearman’s ranking correlation. Finally, the difference in the mean eGFR between the different grades of parenchymal echogenicity was evaluated using a one-way analysis of variance (ANOVA). A p-value of <0.05 and 95% confidence level were used to indicate statistical significance.
Ethical consideration
This study adhered to the 1964 Helsinki Declaration, any subsequent revisions, or equivalent ethical norms for all procedures carried out. The Research and Ethics Committee of the Department of Radiology at the Addis Ababa University granted ethical approval for the study to be carried out. All patient data were de-identified.
Results
Baseline characteristics, etiology, and associated comorbidities
Among the 103 patients, 67 (65%) were males and 36 (35%) were females. Table 1 presents the mean age, duration since CKD diagnosis, and blood pressure. Table 1 also provides the mean body mass index (BMI), recent hemoglobin (Hg) level, recent SCr level, and calculated eGFR.
Demographic and baseline clinical profiles of patients.

CKD: chronic kidney disease; SBP: systolic blood pressure; DBP: diastolic blood pressure; BMI: body mass index; Hg: hemoglobin; eGFR: estimated glomerular filtration rate.
DM caused CKD in 45 (43.7%) cases, hypertension in 30 (29.1%) cases, glomerulonephritis in 5 (4.9%) cases, and DM and hypertension in 4 (3.9%) cases. Unknown causes were observed in 14 (13.6%) cases and other causes in 5 (4.9%) cases.
Comorbidities included hypertension in 33 (32%) cases, hypertension and cardiovascular disease in 18 (17.5%) cases, and cardiovascular disease in 15 (14.6%) cases. Dyslipidemia was present along with hypertension in 6 (5.83%) cases, along with cardiovascular disease in 5 (4.85%) cases, and alone in 4 (3.88%) cases.
Ultrasonographic patterns and correlation with eGFR
The ultrasonographic average renal length ranged from 5.85 to 12.89 cm. The average measurements of renal length and cortical and parenchymal thicknesses are presented in Table 2.
Ultrasonographic parameters and Pearson’s correlation coefficients for the relationship of ultrasonographic parameters with eGFR.

eGFR: estimated glomerular filtration rate.
Renal cortical echogenicity was categorized from grade 0 to grade IV. The majority of the patients had markedly increased cortical echogenicity (Table 3).
Renal echogenicity grading and Spearman’s rank correlation coefficient for the relationships between renal cortical echogenicity and eGFR.

eGFR: estimated glomerular filtration rate.
Relationship between independent and dependent variables
A statistically significant positive correlation was observed between eGFR and age and recent Hg level (g/L) (r = 0.27, p = 0.005 and r = 0.46, p = 0.001, respectively). A negative correlation was observed between eGFR and duration since CKD diagnosis, systolic blood pressure, and diastolic blood pressure; however, it was not statistically significant.
There was a statistically insignificant positive correlation between eGFR and BMI (r = 0.07, p = 0.48).
The correlation between various renal ultrasonographic indices and eGFR was assessed. The results are presented in Table 2.
Cortical thickness was measured in 54 patients, and there were 49 missing values due to difficulty in measurement of the accurate cortical thickness in grade III and IV echogenic kidneys. There was no significant correlation between average cortical thickness and eGFR (Table 2).
A statistically significant negative correlation was noted between eGFR and renal cortical echogenicity (Table 3).
One-way ANOVA was conducted to compare the impact of eGFR level on renal cortical echogenicity. Comparison was made between grade 0, grade I, grade II, grade III, and grade IV echogenicity. There was a significant difference in eGFR among the groups (F = 11.39, p < 0.001).
Discussion
The primary aim of this study was to evaluate the correlation between ultrasound characteristics and eGFR values in patients with CKD.
In the current study, the majority of participants were men. Similar distributions in terms of age and sex have been observed in previous research. 12
The most common causes of CKD include DM, hypertension, and unknown etiology. Similar results have also been reported in another study. 13 Additionally, we have demonstrated that a higher number of patients have CKD with an unknown etiology, which may be related to the global rise in such cases. 14
Consistent with previous studies, statistically significant positive correlations were observed between eGFR and the absolute renal length, height-adjusted relative renal length, and mean parenchymal thickness.6–8 The histological characteristics of CKD, such as tubular atrophy, interstitial fibrosis, and sclerosed glomeruli, which might result in decreased renal parenchymal thickness, can explain these findings. 15
A study compared the renal resistive index and renal parenchymal thickness for the determination of GFR, which concluded that renal disease assessment can be performed by examining parenchymal thickness and resistive index. 16
Cortical echogenicity of grades II and III is observed in most patients. According to other studies, grade II cortical echogenicity is the most prevalent echogenicity.8,17
Similar to other research, a statistically significant negative correlation was found between eGFR and cortical echogenicity grading.7,8,13,15 The mean eGFR decreased with increasing cortical echogenicity grade.
Although ultrasound has been widely incorporated in the routine care of several urinary system diseases, there is a paucity of research conducted on its use as a tool in routine clinical care of CKD. Our study provides essential baseline data on ultrasound features and their correlation with eGFR. Furthermore, this study highlights the need for integrating ultrasound diagnosis and the management of CKD.
Although this study provides valuable insights, some limitations must be considered. First, the sample size was relatively small, which may limit the generalizability of the results. Additionally, the use of visual method to estimate the grade of cortical echogenicity, rather than the use of hepatorenal index, may have introduced subjectivity and potentially affected the study outcomes.
Conclusion
The majority of grayscale ultrasonographic measurements showed a correlation with eGFR. Thus, in addition to the use of eGFR, these sonographic parameters can help evaluate kidney function.
Footnotes
Acknowledgment
The authors would like to express their appreciation to all healthcare professionals working in the Renal Clinic of Tikur Anbesa Specialized Hospital for helping with data collection.
Authors’ contribution
FHG contributed to conceptualization of the study, methodology, data collection, analysis, and writing. FBG contributed to methodology, data analysis, writing, review, and editing. BFK contributed to data analysis, writing, and editing. LGA contributed to data analysis, writing, and editing.
Consent to participate
All participants in the study provided verbal consent before participation, per ethical guidelines.
Data availability statement
The data analyzed in the current study are available from the corresponding author upon reasonable request.
Declaration of conflicting interests
The authors declare that they have no competing interests with respect to the research, authorship, and/or publication of this article.
Ethical consideration
This study adhered to the 1964 Helsinki Declaration, any subsequent revisions, or equivalent ethical norms for all procedures carried out. The Research and Ethics Committee of the Department of Radiology at the Addis Ababa University granted ethical approval for the study to be carried out.
Funding
This work was supported by Addis Ababa University, College of Health Sciences, Ethiopia.