
Abstract
Objective
Esophageal varix (EV) bleeding is a particularly serious complications of cirrhosis. Prediction of EV bleeding requires extensive endoscopy experience; it remains unreliable and inefficient. This retrospective cohort study evaluated the feasibility of using deep learning (DL) to predict the 12-month risk of EV bleeding based on endoscopic images.
Methods
Six DL models were trained to perform binary classification of endoscopic images of EV bleeding. The models were subsequently validated using an external test dataset, then compared with classifications performed by two endoscopists.
Results
In the validation dataset, EfficientNet had the highest accuracy (0.910), followed by ConvMixer (0.898) and Xception (0.875). In the test dataset, EfficientNet maintained the highest accuracy (0.893), which was better than the endoscopists (0.800 and 0.763). Notably, one endoscopist displayed higher recall (0.905), compared with EfficientNet (0.870). When their predictions were assisted by artificial intelligence, the accuracies of the two endoscopists increased by 17.3% and 19.0%. Moreover, statistical agreement among the models was dependent on model architecture.
Conclusions
This study demonstrated the feasibility of using DL to predict the 12-month risk of EV bleeding based on endoscopic images. The findings suggest that artificial intelligence-aided diagnosis will be a useful addition to cirrhosis management.
Keywords
Introduction
Variceal bleeding is a particularly serious complication of cirrhosis. 1 Variceal bleeding-related mortality remains high, with a prevalence approaching 20%.2–4 Esophageal varices (EVs) are the most common gastrointestinal varices. 5 According to the Baveno consensus, high-risk varices in patients without prior EV bleeding are defined as: medium or large varices, small varices with red wale marks, or any size varices in patients with Child–Pugh class C disease. 6 The consensus recommends endoscopic surveillance for patients with cirrhosis who have portal hypertension. During upper endoscopy, endoscopists are advised to perform a series of systematic assessments to record the locations, sizes, and appearances of EVs. Risk stratification based on these endoscopic assessments is essential for the clinical management of EVs; it can optimize medical resources and improve patient outcomes. 7
In the past 15 years, substantial advances in deep learning (DL) algorithms have revolutionized image analysis patterns in various datasets. 8 In clinical settings, computer vision (CV) tasks include helping radiologists and endoscopists to make decisions regarding large numbers of medical images.9–11 Convolutional neural networks (CNNs), a class of artificial neural networks, are characterized by the shared-weight architecture of sliding convolution kernels. 12 Recently, transformer-based neural networks have emerged as a competitive alternative with potential applications in diverse CV tasks. 13 Various DL models have been increasingly used in analyses of endoscopy datasets,14,15 including polyp detection (colonoscopy), early gastric cancer diagnosis (upper endoscopy), and automatic lesion detection (capsule endoscopy).16–21
Although high-risk varices have been well-characterized since the late 1980 s,22,23 the prediction of EV bleeding risk requires extensive endoscopy experience; it remains unreliable and inefficient.2,5 Early identification of patients with cirrhosis who have high-risk EVs is important for improving patient outcomes and optimizing medical resources. 1 In this multicenter study, we evaluated the feasibility of using DL to predict the 12-month risk of EV bleeding based on model training via classification of endoscopic images.
Methods
Study design
This multicenter retrospective cohort study included randomly selected patients with cirrhosis who attended two hospitals—The First Affiliated Hospital of Soochow University, Suzhou, China (Suzhou hospital, training and validation datasets) and Jintan Affiliated Hospital of Jiangsu University, Changzhou, China (Jintan hospital, test dataset)—between 1 January 2015 and 1 January 2021 (Supplementary Table 1). All variceal images were acquired during maximal insufflation and distention of the esophageal lumen, in the absence of peristaltic waves. The images were fully anonymized before analysis by the authors; the investigators also de-identified all patient information. This study protocol was approved by the Ethics Committee of The First Affiliated Hospital of Soochow University (approval number 2022098); the study was conducted in accordance with the Helsinki Declaration of 1975, as revised in 2013. All participants provided written informed consent for inclusion in the study. This article adheres to the STROBE guidelines. 24
At both centers, EVs were diagnosed based on the 2014 guidelines of the American Society for Gastrointestinal Endoscopy (ASGE 2014). 25 Patients were excluded if they had a history of EV bleeding, were receiving treatment for EVs, or had a non-cirrhotic etiology of portal hypertension. Treatments for EVs included nonselective beta blockers, sclerotherapy, endoscopic ligation, transjugular intrahepatic portosystemic shunt, and laparoscopic splenectomy. 26 Patients were followed up for at least 12 months to record EV outcomes (i.e., first occurrence of EV bleeding). Variceal bleeding was defined as follows: 1) active variceal bleeding on endoscopy or 2) melena/hematemesis after exclusion of other causes of upper gastrointestinal bleeding (e.g., digestive ulcers or Dieulafoy disease).
The study protocol is shown in Figure 1. First, six CNN- or transformer-based DL models were selected for transfer learning in the CV task. After models had been pretrained on ImageNet (detailed in next section), they were trained to perform binary classification of endoscopic images of EVs from Suzhou hospital (training and validation datasets). Moreover, the DL models were externally validated using images from Jintan hospital (test dataset), then compared with classifications performed by two endoscopists. Additionally, DL model inferences were visualized by gradient-weighted class activation mapping (Grad-CAM). Finally, artificial intelligence-aided performance was evaluated.

Study flowchart. (a) Datasets and (b) processes used in this study.
Models and pretraining
Six CNN- or transformer-based models were chosen: MobileNet (MobileNet V1), ResNet (ResNet-50 V2), Xception, EfficientNet (EfficientNet V2 s), ViT (ViT-B16), and ConvMixer (ConvMixer-768/32). These models were pretrained on the ImageNet database (www.image-net.org), prior to transfer learning. Architectures and pretrained parameters were downloaded from Keras (keras.io) or TensorFlow Hub (tfhub.dev). A flowchart for the model training process is provided in Supplementary Figure 1.
Target training and internal validation
As shown in Figure 1, 675 images of EVs were collected from Suzhou hospital and saved in JPEG format. All images were obtained from endoscopic systems established by Olympus Corporation (Tokyo, Japan) or Fujifilm Corporation (Tokyo, Japan). Images were divided into two classes according to whether bleeding occurred within 12 months after initial diagnosis: control (no bleeding, n = 439) vs. bleeding (n = 236). After image augmentation, the numbers of images were increased to 2000 in the training dataset (1000 vs. 1000) and 400 in the validation dataset (200 vs. 200). All images were rescaled and normalized to pixel dimensions of 331 × 331 × 3. Considering the unique nature of endoscopy data, we used non-rigid transformation for endoscopic images. Rotational transformation and flip transformation were performed to augment the data. The augmentation procedure is shown in Supplementary Figure 2.
The parameter transfer learning procedure was implemented in Keras software (Google), using the TensorFlow framework as the backbone. Transfer learning was applied to the aforementioned CNN- or transformer-based architectures by combining the existing feature extraction layers (fixed layers) with additional activation layers (training layers) for binary classification. Fitted models were compiled using an Adam optimizer and the binary cross-entropy cost function, with a fixed learning rate of 0.0001 and batch size of 32. Training was discontinued when accuracy in the validation dataset did not improve for three epochs. The maximum number of training epochs was limited to 100. This experiment was performed on a Mac mini (Apple M1, 8 cores, 16G RAM, macOS Ventura 13.0.1). The training code is available at https://osf.io/ycxwr.
External validation
Test dataset images were collected from Jintan hospital (control [no bleeding, n = 200] vs. bleeding [n = 200]). The criteria and procedure were consistent with the methodology regarding Suzhou hospital. Furthermore, the performances of two endoscopists (one from Jintan hospital [#1] and one from Suzhou hospital [#2]) were compared with the performances of the models. First, endoscopists with more than 10 years of experience independently classified the images based on the ASGE 2014 guidelines. 25 In accordance with the guidelines, large EVs (>5 mm) or EVs displaying red wales or spots were predicted to have a high risk of bleeding. Second, after independent judgement, the two endoscopists were given access to the best model’s predictions; they subsequently re-classified the images, and this approached was regarded as artificial intelligence-aided prediction.
Model visualization
Grad-CAM has been proposed to visualize models by highlighting regions that are important for predictions from these models. 27 In this study, Grad-CAM heatmaps were created for inferential explanation of multiple output layers from the best model.
Evaluation criteria
DL models were fitted using Python software (version: 3.9; Python Software Foundation) and TensorFlow (2.8.0; Google). Model performances were evaluated in terms of accuracy, recall, precision, and F1-score. The algorithms are shown below (TP, true positive [correct assumption that an event has occurred]; TN, true negative [correct assumption that an event has not occurred]; FP, false positive [incorrect assumption that an event has not occurred]; FN, false negative [incorrect assumption that an event has not occurred]):


Accuracy, precision, and recall are the main indicators of machine learning performance. The F1-score combines precision and recall into a single indicator. Statistical agreement among the DL models and the endoscopists was measured using Cohen's κ, which evaluates the level of agreement between two raters or judges when classifying items into mutually exclusive categories. Two-sided p-values <0.05 were considered statistically significant.
Results
Development and internal validation of DL models
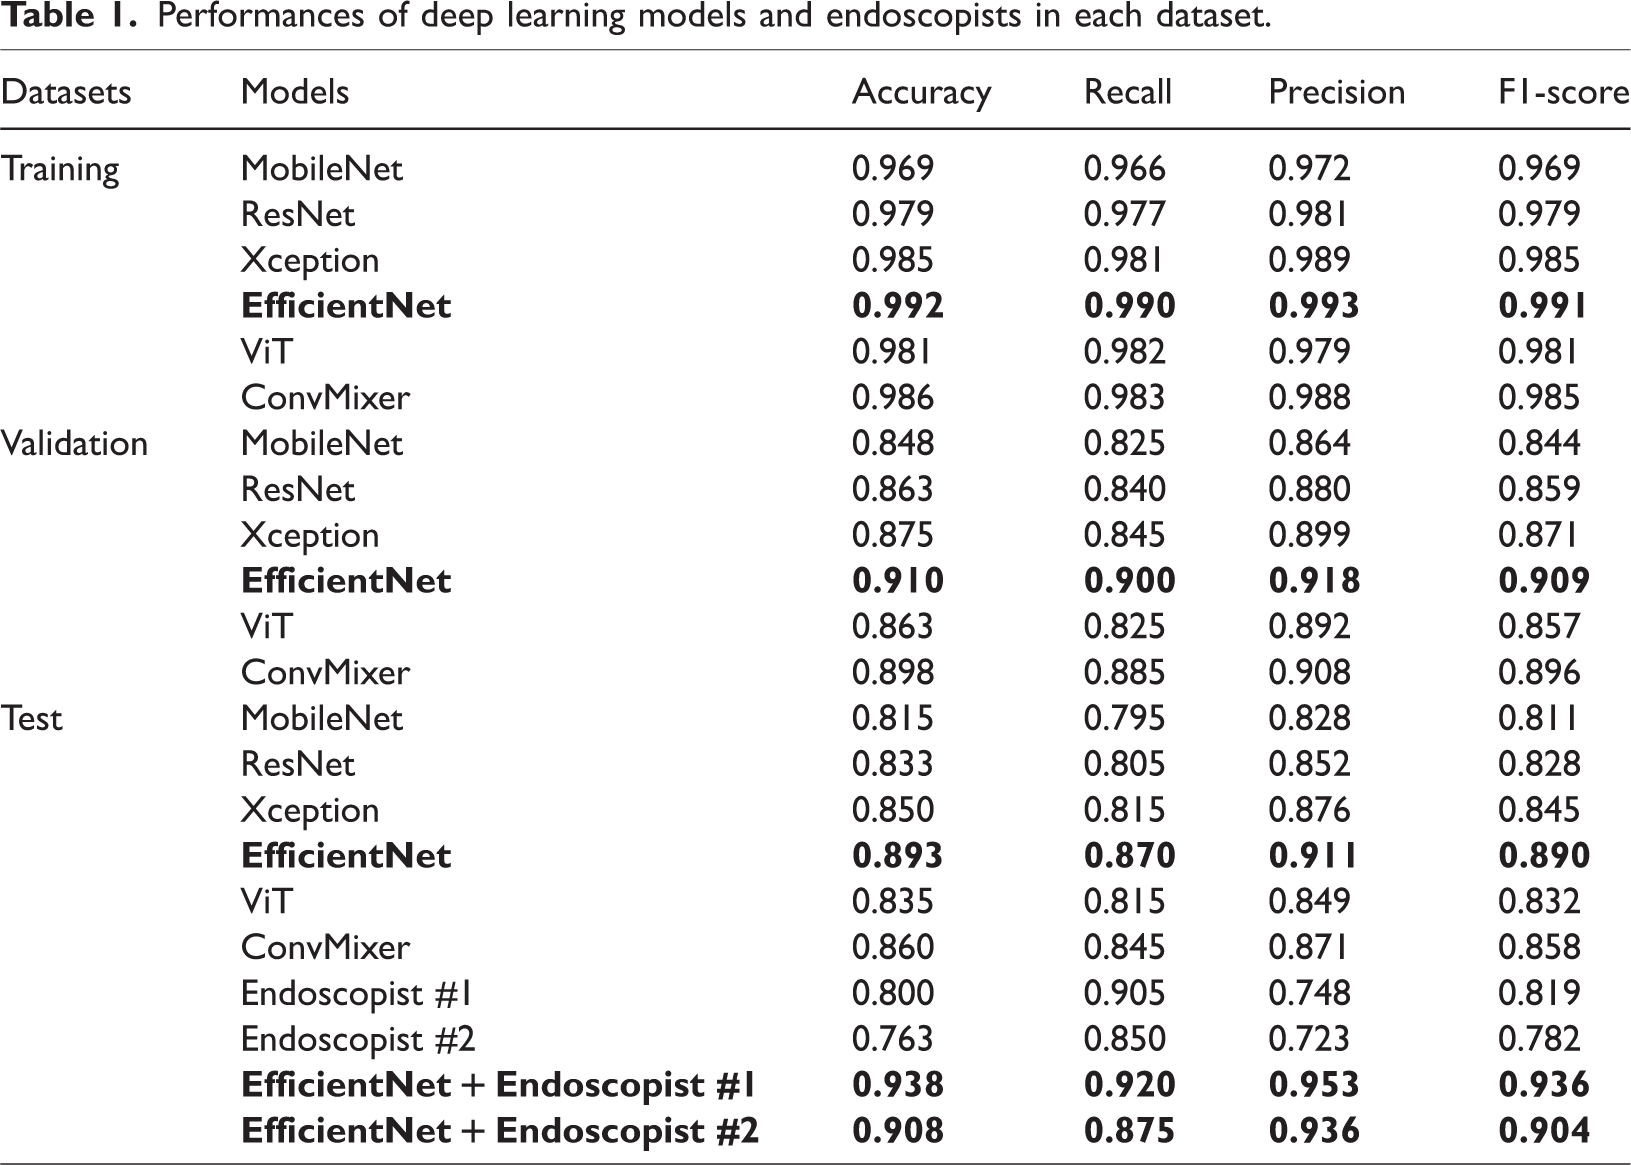
The six CNN- or transformer-based models were trained by transfer learning, then used for binary classification of the 12-month risk of EV bleeding based on endoscopic images. The performances of the six models in the validation dataset are shown in Figure 2a and Table 1. EfficientNet showed the highest accuracy (0.910), followed by ConvMixer (0.898) and Xception (0.875). The recall, precision, and F1-score of the EfficientNet model were 0.900, 0.918, and 0.905; these values were superior to the values of the other models. The confusion matrices of the models are shown in Figure 3a.

Performances of deep learning models and endoscopists in the validation and test datasets. a) Artificial intelligence models in validation dataset. b) Artificial intelligence models in test dataset. c) Endoscopists + best artificial intelligence model in test dataset.
Performances of deep learning models and endoscopists in each dataset.

Confusion matrices of deep learning models and endoscopists in the validation and test datasets. a) Artificial intelligence models in validation dataset. b) Artificial intelligence models in test dataset. c) Endoscopists in test dataset. d) Endoscopists + artificial intelligence model in test dataset.
External validation of DL models
The performances of the six models in the test dataset are shown in Figure 2b and Table 1. EfficientNet maintained the highest accuracy (0.893), followed by ConvMixer (0.860) and Xception (0.850). The recall, precision, and F1-score of EfficientNet were 0.870, 0.911, and 0.890; these values were superior to the values of the other models. The confusion matrices of the models are shown in Figure 3b.
Comparison with endoscopists
The performances and confusion matrices of the two endoscopists in the test dataset are shown in Figure 2c, Figure 3c, and Table 1. The accuracies of the endoscopists were 0.800 and 0.763. Although their accuracies were lower than the DL model accuracies, endoscopist #1 achieved a recall of 0.905, which was superior to EfficientNet.
Artificial intelligence-aided performance
The performances of the two endoscopists with assistance from the best DL model (EfficientNet) are presented in Figure 2c, Figure 3d, and Table 1. For endoscopist #1, the accuracy increased by 17.3% to 0.938; recall was 0.920, precision was 0.953, and F1-score was 0.936. For endoscopist #2, accuracy increased by 19.0% to 0.908, which was superior to EfficientNet.
Agreement between models and endoscopists
As shown in Figure 4, statistical agreement among the DL models and endoscopists was measured using Cohen's κ. According to model architecture, the four CNN-based models displayed high levels of agreement (ranging from 0.745 to 0.945), whereas the κ value between the two Transformer-based models was 0.800. Finally, the two endoscopists demonstrated a κ value of 0.860.

Statistical measures of agreement among the models and endoscopists.
Inferential explanation of the EfficientNet model
Based on the outputs of the EfficientNet model, Grad-CAM was used to highlight the artificial intelligence-inferred EVs on original images, as shown in Figure 5. Based on the best Grad-CAM model outputs, inferential explanations were established via heatmaps.

Visualization of EfficientNet model inferences by gradient-weighted class activation mapping (Grad-CAM). Left column) Original endoscopic images. Middle column) Heatmaps established using the output of the last feature-extractor layer in the EfficientNet model. Right column) Grad-CAM heatmap overlaid on the original images, where highlighted regions reflect esophageal varices identified by the model.
The left column shows the original endoscopic images. The middle column shows heatmaps established using the output of the last feature-extractor layer in the EfficientNet model. The right column shows the Grad-CAM heatmap overlaid on the original images, where highlighted regions reflect EVs identified by the model.
Discussion
In this study, we evaluated the feasibility of using DL models to classify images of EVs according to the 12-month risk of bleeding. We found that DL models demonstrated better classification accuracy and inference time, compared with endoscopists. Furthermore, artificial intelligence-aided prediction displayed considerable improvement.
In the late 1980s, the Japan Society for Portal Hypertension initially proposed a system to record the endoscopic appearance of EVs. 23 In 1995, the society revised the rules into the “General Rules for Recording Endoscopic Findings of Esophagogastric Varices.” 28 In 2010, information regarding portal hypertensive gastropathy and endoscopic ultrasonography was included in the second edition of the rules. 29 These rules are widely used in Japan and other countries. Among Western countries, in 1988, the North Italian Endoscopic Club released a prediction index to determine 12-month risk of bleeding, based on Beppu’s Variceal Score and the Japanese rules. 22
Guidelines from the American Association for the Study of Liver Disease and the Baveno V consensus suggest the use of screening endoscopy for patients with cirrhosis to diagnose EVs and stratify bleeding risk.6,30 The optimal surveillance schedule for EVs is largely dependent on endoscopic appearance and the stage of portal hypertension. For patients with compensated cirrhosis and no varices on screening, endoscopy is recommended every 2 to 3 years; patients with small varices should undergo endoscopy every 2 years. 25 EVs may progress faster in patients with alcohol-induced or decompensated cirrhosis, or with high-risk signs on endoscopic examination; these patients should undergo endoscopy annually. 25 Current evidence indicates that the annual risk of EV bleeding increases by ∼15% in patients with cirrhosis decompensation, large variceal size, or red signs in varices (e.g., red wale markings, cherry red spots, hematocystis, and telangiectasia).6,29 Early identification of high-risk EVs is needed to optimize medical resources and improve outcomes among patients with cirrhosis. 1
DL has been applied to various clinical datasets. 31 In the past 5 years, DL-based computer-aided detection and diagnosis systems have demonstrated robust performance in digestive endoscopy.14,16,18,32 In the present study, six DL models were trained by transfer learning, then used for binary classification of the 12-month risk of EV bleeding based on endoscopic images. EfficientNet showed the highest accuracy in the internal validation and external test datasets. EfficientNet is a CNN-based architecture that uses a compound scaling method, which uniformly scales all dimensions using a set of fixed scaling coefficients. 33 In various image classification competitions, EfficientNet has demonstrated superior transfer performance and state-of-the-art accuracy, while using considerably fewer parameters. 34
We also evaluated the performances of the DL models, compared with the performances of two endoscopists. Generally, the models showed superior accuracy and precision. However, the endoscopists displayed slightly better recall. In this study, two endoscopists classified images of EVs using the ASGE 2014 guidelines, 25 in which large EVs or varices with red wales or spots are presumed to have a high risk of bleeding. This approach might increase the number of EVs with a predicted risk of bleeding, resulting in higher numbers of true positives and false positives, along with higher recall and lower precision. The F1-score is a combination indicator of the model’s precision and recall. In terms of F1-score, EfficientNet and other DL models remained superior to the endoscopists. Furthermore, assessments of statistical agreement among the models and endoscopists revealed that the agreement was dependent on model architecture. Variability between the two endoscopists (i.e., observer bias) is an important source of disagreement. Interpretability is an essential step of DL model development. Data scientists and medical practitioners often focus on the rationale for inferences by artificial intelligence, especially in CV tasks. Thus, Grad-CAM was used to provide an inferential explanation via heatmaps. Finally, the endoscopists re-classified the images based on the results of EfficientNet. The artificial intelligence-aided predictions displayed substantial improvement compared with the predictions by endoscopists alone, which may be useful in clinical applications.
This study had some limitations. First, it only focused on endoscopic images, rather than other clinical data (e.g., liver function or radiological findings). Second, bleeding risk was predicted based on a single image, rather than multiple images from multiple EV sites. Further studies based on structured clinical data, radiological data, and multiple images are needed to establish more complex models for prediction of EV bleeding risk. Moreover, the rationale underlying agreements between various model architectures should be explored. Finally, this study did not include extensive independent datasets; such datasets should be included in future validation studies.
Conclusions
This study demonstrated the feasibility of using DL to predict the 12-month risk of EV bleeding based on endoscopic images. Artificial intelligence models demonstrated better classification accuracy and inference time, compared with endoscopists. Moreover, we found that agreement between models was architecture-dependent. The findings suggest that artificial intelligence-aided diagnosis will be useful in future cirrhosis management efforts.
Supplemental Material
sj-pdf-1-imr-10.1177_03000605231200371 - Supplemental material for Deep learning to predict esophageal variceal bleeding based on endoscopic images
Supplemental material, sj-pdf-1-imr-10.1177_03000605231200371 for Deep learning to predict esophageal variceal bleeding based on endoscopic images by Yu Hong, Qianqian Yu, Feng Mo, Minyue Yin, Chang Xu, Shiqi Zhu, Jiaxi Lin, Guoting Xu, Jingwen Gao, Lu Liu and Yu Wang in Journal of International Medical Research
Supplemental Material
sj-pdf-2-imr-10.1177_03000605231200371 - Supplemental material for Deep learning to predict esophageal variceal bleeding based on endoscopic images
Supplemental material, sj-pdf-2-imr-10.1177_03000605231200371 for Deep learning to predict esophageal variceal bleeding based on endoscopic images by Yu Hong, Qianqian Yu, Feng Mo, Minyue Yin, Chang Xu, Shiqi Zhu, Jiaxi Lin, Guoting Xu, Jingwen Gao, Lu Liu and Yu Wang in Journal of International Medical Research
Footnotes
Author contributions
YH, QY, and GX collected data. QY and FM wrote the manuscript. MY, JL, JG, LL, SZ, and CX analyzed data and trained the models. YH and YW contributed to the study design.
Declaration of conflicting interest
The authors declare that there is no conflict of interest.
Funding
This study was supported by the Medical Education Collaborative Innovation Fund of Jiangsu University [JDY2022018] and the Science and Technology Plan (Apply Basic Research) of Changzhou City [CJ20210006].
References
Supplementary Material
Please find the following supplemental material available below.
For Open Access articles published under a Creative Commons License, all supplemental material carries the same license as the article it is associated with.
For non-Open Access articles published, all supplemental material carries a non-exclusive license, and permission requests for re-use of supplemental material or any part of supplemental material shall be sent directly to the copyright owner as specified in the copyright notice associated with the article.