
Abstract
The objective was to enhance the contrast and segment the femoral artery pseudoaneurysm (FAP) area from patients’ ultrasonography (US) images. In addition, this study compared the intra- and interobserver reliability and variability of the FAP measurements from the original, contrast-enhanced, and segmented US. Retrospectively, 25 FAP sonograms were evaluated by four observers (two trained and two novice). They twice measured the FAP body width, neck width, and length from original, enhanced, and segmented US. The intra- and interobserver reliability for measuring FAP body width, neck width, and neck length improved by 10% after enhancing the original 2D US contrast and segmenting the region of interest across all observers. Also, the intra- and interobserver variability among measurements across all observers decreased by 44%. Using US processing was more profound for novice observers (intraclass correlation coefficient [ICC], 0.76–0.93) compared to trained observers (ICC, 0.94–0.99). US postprocessing resulted in a decrease in variability for FAP measurements.
Pseudoaneurysms are a major source of morbidity after cardiac catheterization. 1 Femoral artery pseudoaneurysm (FAP), also known as a false aneurysm, is a pulsating encapsulated hematoma in communication with a ruptured vessel. 2 It is mostly formed after surgical procedures, penetrating trauma, or femoral fractures. 3 The incidence of FAP after diagnostic catheterization and routine percutaneous intervention ranges from 0.05% to 2%.4,5 The incidence increases to 6% after more complex and emergent procedures, such as primary percutaneous intervention, for acute myocardial infarction, prolonged multivessel intervention, or procedures.4,5 These procedures usually require larger sheath sizes (e.g., 8 French gauge).
The early diagnosis of FAP is crucial to avoid further complications, such as a rupture, and for treatment planning. 6 Computed tomography (CT) can be used to detect a FAP and provides high-resolution imaging of the FAP structure. 7 However, CT may not be readily available, and the pre- and postcontrast CT imaging depends on exposure to ionizing radiation. Therefore, ultrasonography (US) remains a safe alternative method for the diagnostic imaging of patients with groin complications postcatheterization. 8 US involves the use of nonionizing radiation and no contrast agent, and it is noninvasive, inexpensive, portable, and readily available. 9
However, one of the main disadvantages of US for detecting a FAP is that it mainly provides details on the blood flow, as opposed to the structure. A FAP is diagnostically confirmed by looking at the characteristic bidirectional Doppler waveform in the neck as well as a swirling pattern of flow within the pseudoaneurysm.10–12 Another disadvantage of US is that it is an operator-dependent modality, 10 which may result in high levels of interobserver and intraobserver variability. Therefore, it is important to know the range of interobserver and intraobserver variability for either the same or different operators who provide follow-up US examinations, given that the treatment choice depends on the FAP measurements.
Depending on the size of the FAP body and hemodynamic status of the patient, either an immediate treatment or a follow-up observation should be performed. 3 If the FAP body width is less than 2 cm, it usually thromboses spontaneously within two to four weeks with no complications and does not require any specific treatments.11,12 If it is greater than 2 cm, depending on the length and the width of the FAP neck, the physicians will decide on the treatment via either thrombin injection or open surgery. 13 Thrombin injection is preferred because it is easy to perform and can be done at the bedside with no anesthesia. 14 A thrombin injection can be performed with a FAP that has a long thin neck so that the thrombin does not pass through the neck and enter into the arterial circulation, inducing limb ischemia.15–17 In general, a FAP neck length of 1 cm and a width of less than 3 to 5 mm are required for thrombin injection. 18 If the neck is too short (less than 1 cm) or too wide (wider than 2 cm), an open surgery is performed to treat the FAP. 19
It has been reported that US has a low level of contrast and is corrupted with speckle, a granular “noise” that inherently exists and degrades the quality of the image. 20 Different filters have been proposed to remove speckle and enhance the contrast of US images. 20 Also, several studies reported that image segmentation remains a necessary step in medical imaging to obtain qualitative measurements such as the location of objects of interest as well as for quantitative measurements, such as dimensions, area, and volume.21–24 Image segmentation is the partition of an image into a set of nonoverlapping regions whose union is the entire image. The purpose of segmentation is to decompose the image into parts that are meaningful with respect to a particular application. 25
Due to a lack of published data, the aim of this study was to quantify the intra- and interobserver reliability and variability of measuring the FAP body width, neck width, and length from B-mode US images. Also, the aim was to compare the results with the measurements taken from the US images after enhancing the contrast and segmenting the area of interest. This would allow for testing the impact of image processing on the results of the FAP measurements taken by trained and novice observers from original, enhanced, and segmented US images. Reliability, reproducibility, and precision are terms used to describe the extent to which the measurements of a stable phenomenon, repeated by different persons or instruments at different times or in different places, achieve similar results. 26 The hypothesis of this study is that the variation among FAP measurements may be reduced by postprocessing of those B-mode US images.
Materials and Methods
This was designed as a retrospective study. A total of 25 FAP US images were generated from 18 subjects. The images were acquired from The George Washington University database, and the images reviewed were acquired between January 2012 and September 2017. An institutional review board (IRB) approval was obtained before accessing subjects’ US images.
Data Acquisition and Measurement
All the images were processed by a single operator using MATLAB R2017b software (MathWorks, Natick, Massachusetts) to enhance the contrast and to segment the FAP areas from the background. The operator also calculated the spatial calibration factor. The process of spatial calibration involves calibrating a single image against known values, then applying that calibration to the uncalibrated image. 27 The contrast of the images was enhanced using histogram equalization (HE), which is one of the global methods used to enhance the contrast of the edges and image features. 25 In general, the aim of image enhancement is to improve detail resolution and perception in images and to provide better input for other automated image-processing techniques. The images were segmented automatically to separate the region of interest from the rest of the image based on Otsu’s adaptive threshold method 25 and region growing technique. 28 The goal of thresholding is to convert a gray-scale image into a binary image, separating an object’s pixels from the background pixels. The first step in the region growing technique is finding the center of the cluster, which is the seed point, by computing the mean and standard deviation of the object from the thresholded image. The grow process is done in a recursive way where, first, the eight neighboring pixels of the seed point are computed. Then, each of the neighboring pixels found to be similar and included becomes the seed point. The last step is to keep iterating until all the pixels in the object array are evaluated.
The image categories that were used in this study were color flow duplex US images, original B-mode US images, enhanced B-mode US images, and segmented B-mode US images. This study used four observers. Observers A and B had training in measuring FAP from B-mode US images six months prior to the study. They were educated on how to identify the FAP neck and how to measure the neck diameter from inner-to-inner wall. In addition, they were involved in measuring the FAP neck width from 15 US images two times over a two-week time interval. This was done to test the intra- and interobserver reliability and variability. Observers C and D were novice in measuring a FAP from B-mode US images. All observers were given color flow duplex US images for each subject, in addition to the B-mode US original, enhanced, and segmented images, to assist in identifying the FAP neck area (see Figure 1). All observers used MATLAB to measure the FAP body width, neck width, and length from the original, enhanced, and segmented US images. Each measurement on all image types (original, enhanced, and segmented) was completed twice and then again in two weeks to avoid recall bias. 29 See Figure 2 for examples. This was step was made to avoid a systematic error, which can happen when a participant remembers past events. 30 These measurements were done independently without communication between observers. Measurements were converted to centimeters at the end of the study by multiplying them by the spatial calibration factor 0.02, which is the number of centimeters per pixel.
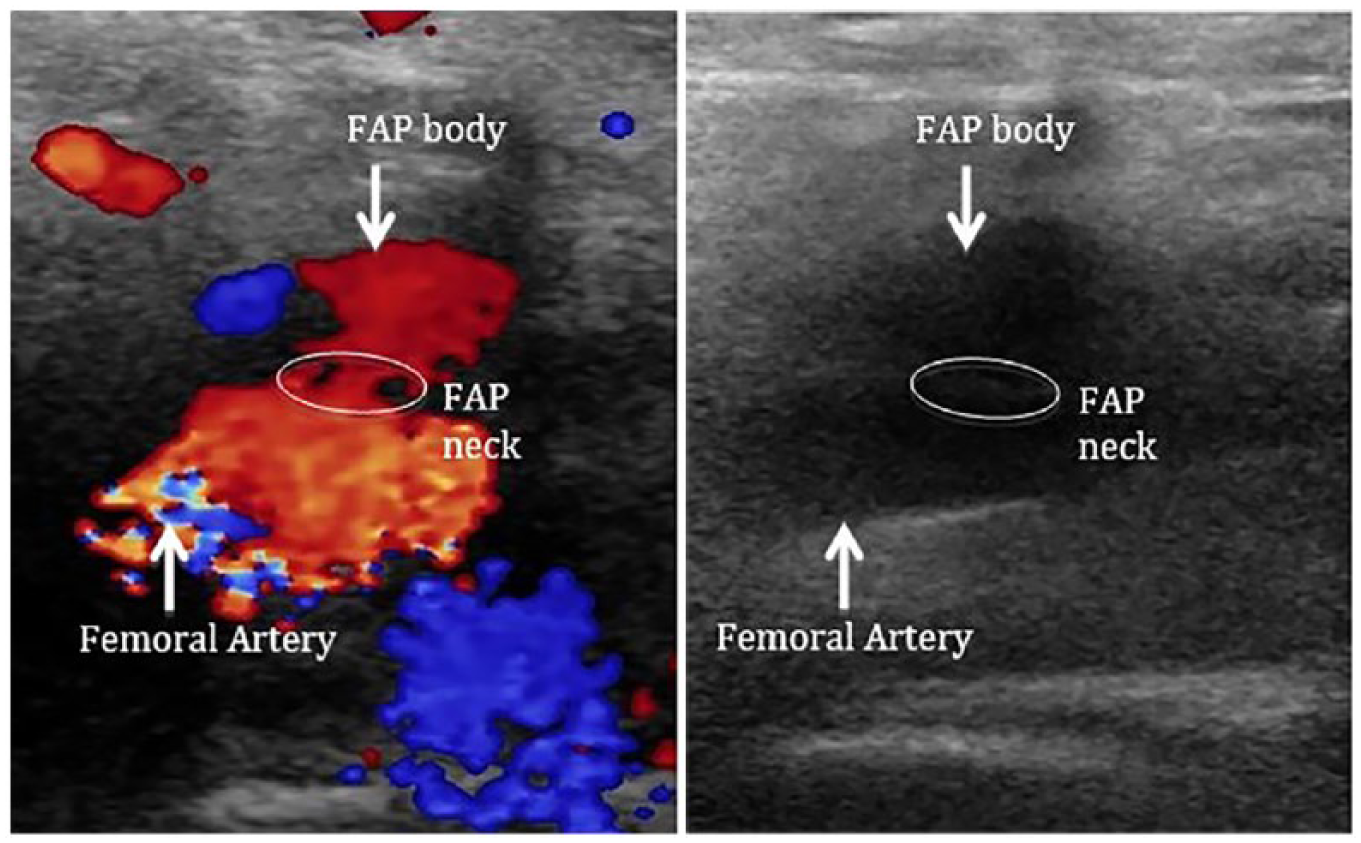
Original sonographic images of femoral artery pseudoaneurysm. (A) Color flow duplex showing swirling pattern of flow in the pseudoaneurysm. (B) B-mode sonographic image for the same subject.
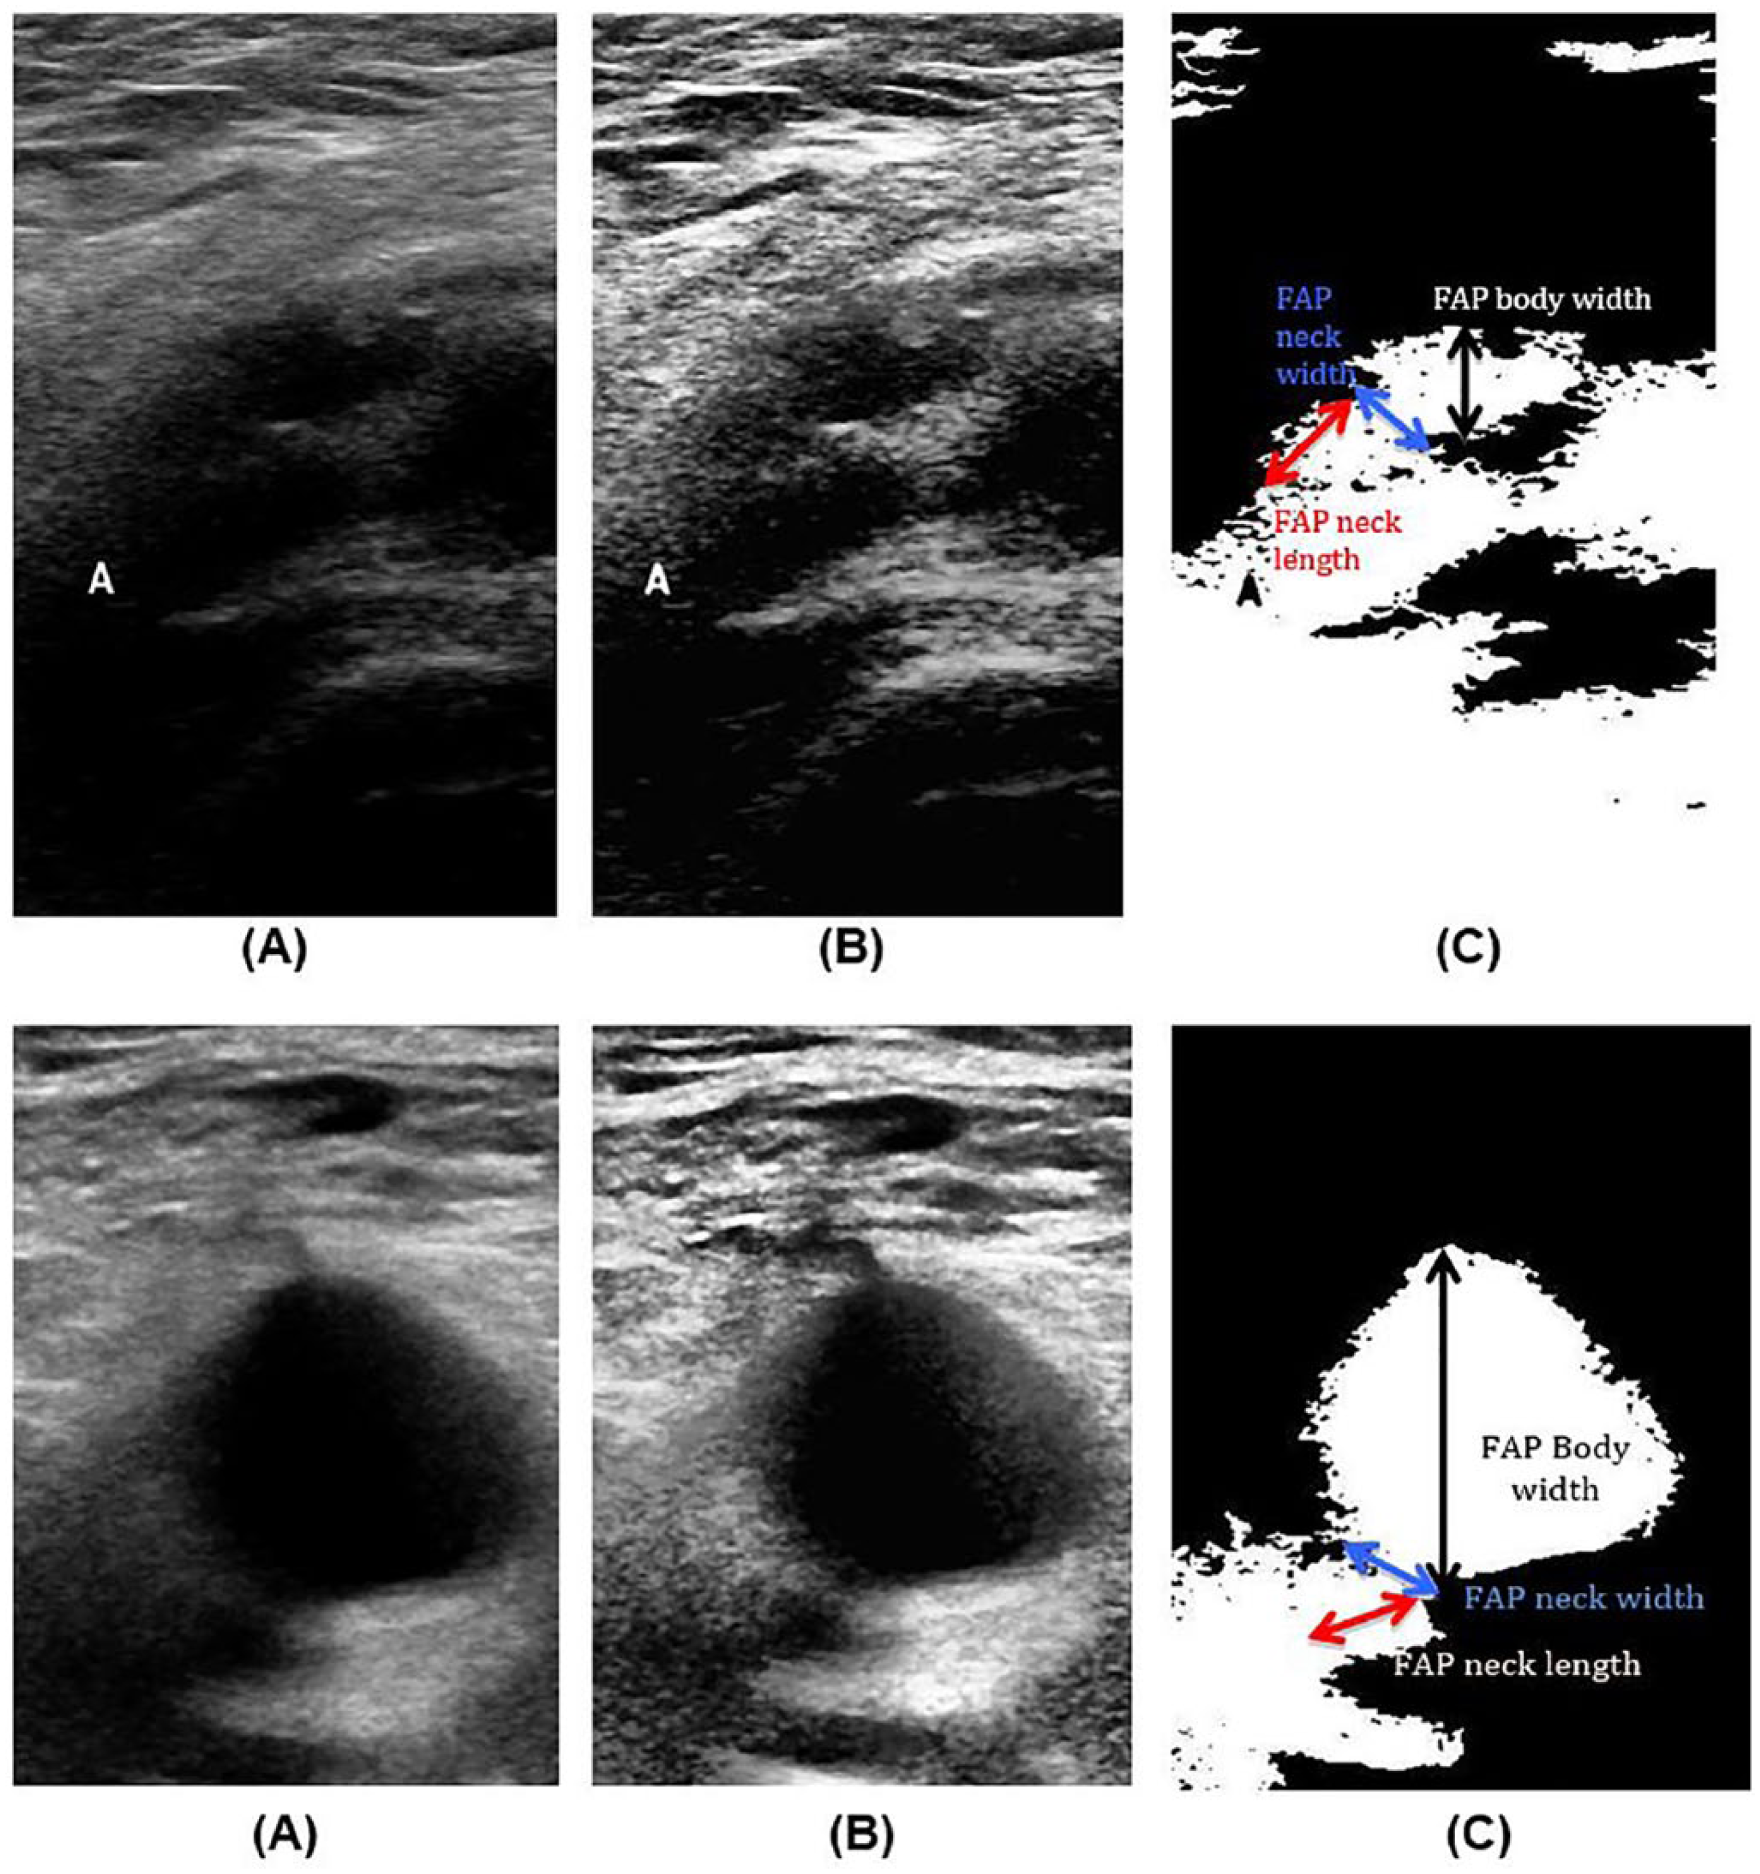
Two examples of B-mode sonographic images of femoral artery pseudoaneurysm. (A) original image, (B) contrast-enhanced image, and (C) segmented image.
Statistical Analysis
Statistical analysis was performed by SPSS Statistics version 22 (SPSS, Inc., an IBM Company, Chicago, Illinois) and Microsoft Excel 2011 (Excel, Redmond, Washington). The intra- and interobserver reliabilities were evaluated by calculating the standard error of measurement (SEM) and the intraclass correlation coefficient (ICC (2, 1)) using a two-way random model with absolute agreement. SEM estimates how repeated measurements by a person on the same instrument tend to be distributed around his or her “true” score. 31 ICC is used in the assessment of consistency or reproducibility of quantitative measurements made by different observers measuring the same quantity. 32 According to Currier, 33 an ICC value between 0.80 and 1.00 is considered good reliability, 0.60 to 0.79 is considered moderate reliability, and <0.60 is considered poor reliability. Smaller SEM values are desired for a good reliability. The intra- and interobserver variability was calculated by using the mean absolute difference (MAD) between measurements and the standard deviation of the absolute difference (SD). Smaller MAD values and SD values point to less variability. For the interobserver reliability and variability, the second measurement from all observers was used.
Results
The patient cases were descriptively divided into 11 females and 7 males, with a mean age of 70.1 ± 9.8 years (range, 53–86 years).
Based on the patient cases and the resulting images, the intraobserver reliabilities and variations of the FAP body width, neck width, and length measurements from original, enhanced, and segmented US images were recorded for all observers (see Table 1). For the FAP body width measurements from the original US images, the average ICC value from all observers was 0.97 and the average SEM was 0.05, indicating high intraobserver reliability. The average ICC values increased for the enhanced and segmented images with an average value of 0.98 and 0.99, respectively. The MAD and the SD between the two trials obtained from the original US images, for observer 1 (O1), observer 2 (O2), observer 3 (O3), and observer 4 (O4), were 0.10 ± 0.14, 0.13 ± 0.05, 0.18 ± 0.19, and 0.16 ± 0.16, respectively. This would indicate that these trained observers (O1 and O2) and novice observers (O3 and O4) had low variability between the two trials of original image analysis. This variation between the two trials decreased even more for all observers when these measurements were obtained from enhanced and segmented images with average values of 0.11 ± 0.12 and 0.09 ± 0.08, respectively. For the FAP neck width, the reliability of the measurements from original US images was good for O1, O2, and O4 with an ICC value of >0.85 and a SEM value of <0.1, and the reliability was moderate for O3, with an ICC value of 0.65 and a SEM value of 0.26. However, the reliability of the measurements from enhanced and segmented US images increased for all observers with ICC values >0.80, which indicated good reliability for all observers. The average values of SEM from the original, enhanced, and segmented images were 0.10, 0.04, and 0.02, respectively, which points to higher reliability for measurements taken from enhanced and segmented images. The variation between the two trials decreased in the enhanced and segmented US images for all observers compared to the measurements from original US images. For FAP neck length, trained observers (O1 and O2) had good reliability based on the original images, with an average ICC value of 0.92 and an average SEM value of 0.03. Novice observers (O3 and O4) had a moderate reliability with an average ICC value of 0.63 and an average SEM value of 0.18. The average ICC values from enhanced images increased for both trained and novice observers to 0.97 and 0.85, respectively. The reliability increased using segmented images with an average ICC value of 0.98 for trained observers and 0.88 for novice observers. The variability, defined as MAD ± SD, decreased as well from enhanced and segmented images compared to the original images for all observers. A summary of the average values of the intraobserver reliability and variability of FAP measurements from the original, enhanced, and segmented US images by trained and novice observers is provided in Table 2.
Intraobserver Reliability and Variation of Femoral Artery Pseudoaneurysm Measurements from Original, Enhanced, and Segmented Ultrasonography Images by All Four Observers.
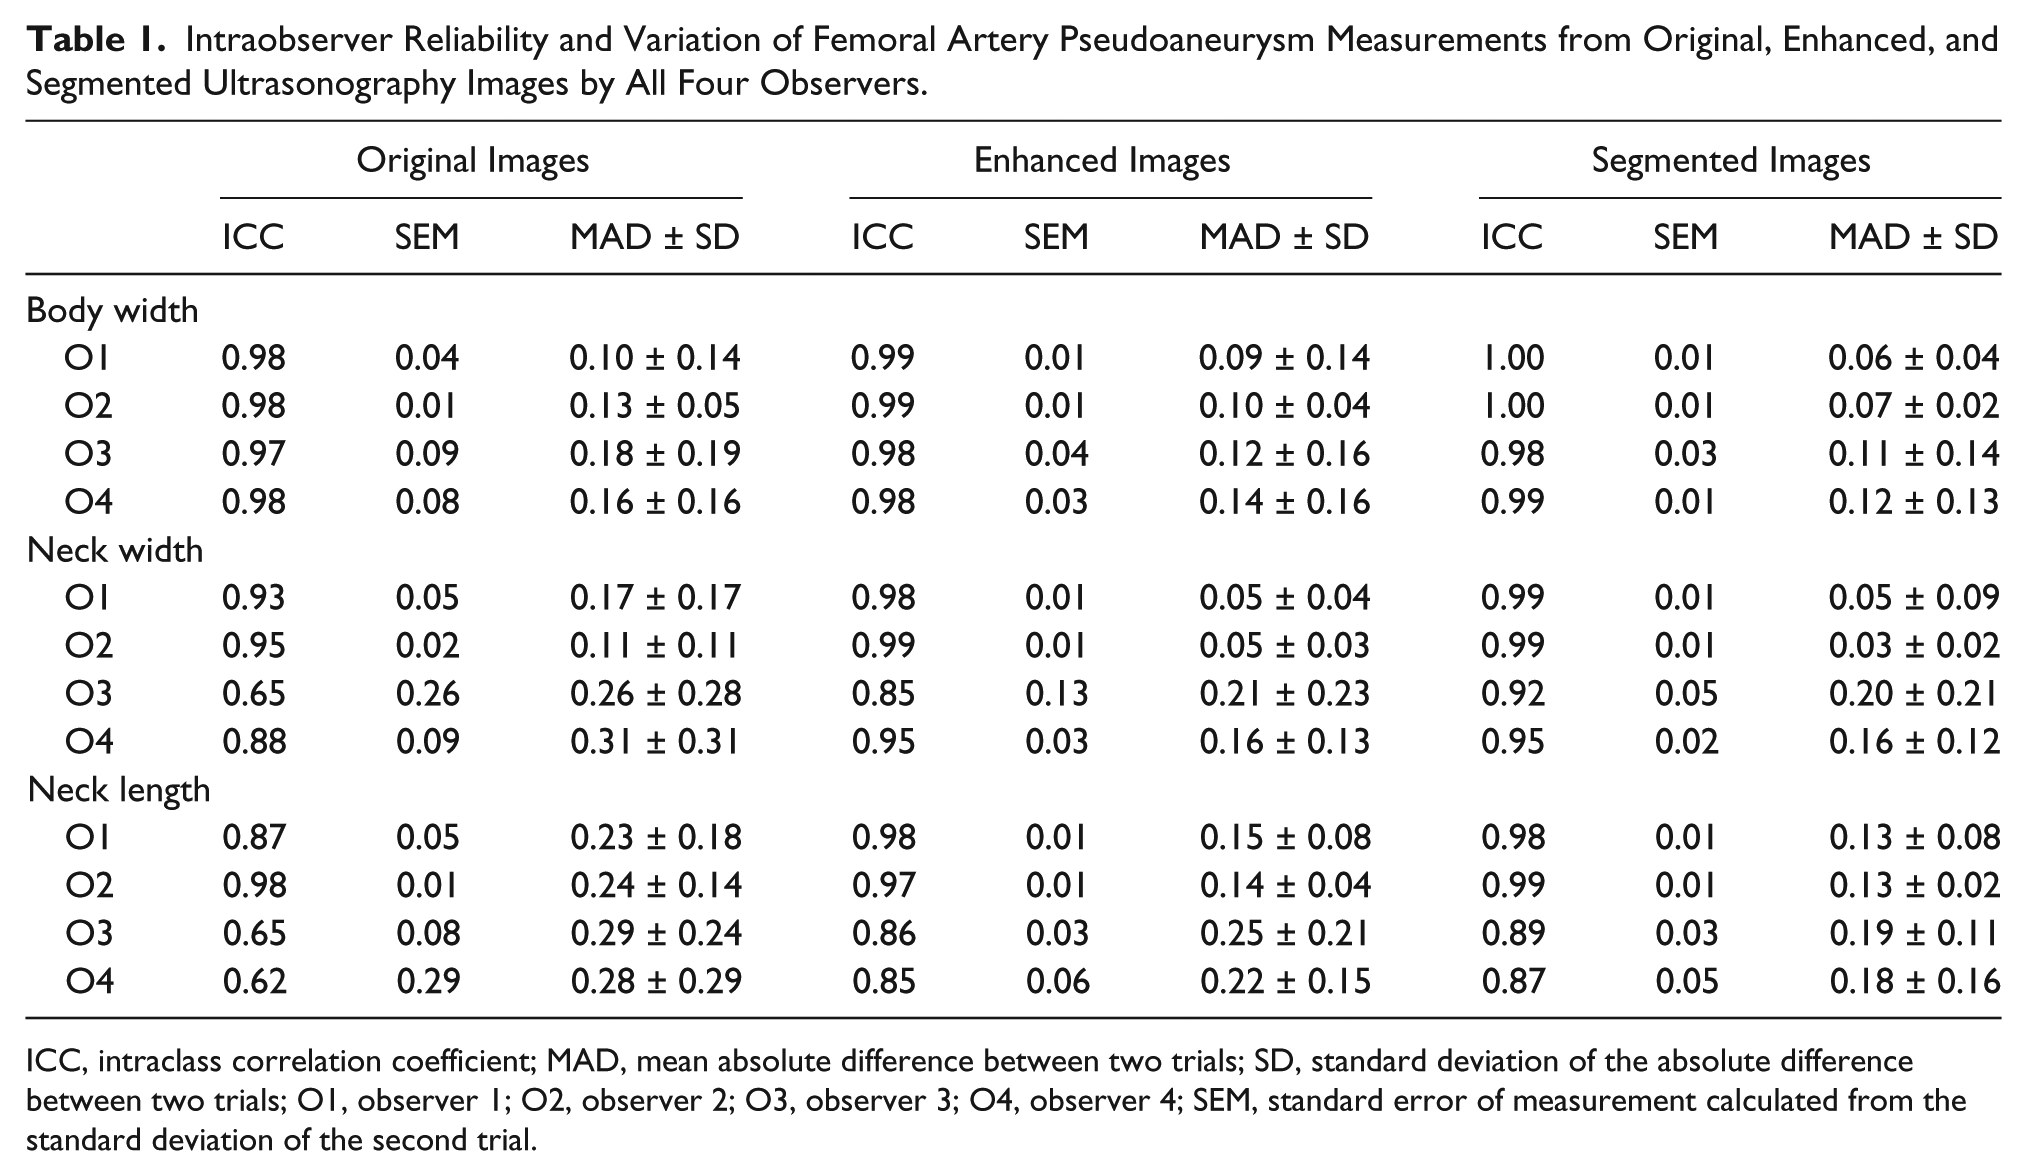
ICC, intraclass correlation coefficient; MAD, mean absolute difference between two trials; SD, standard deviation of the absolute difference between two trials; O1, observer 1; O2, observer 2; O3, observer 3; O4, observer 4; SEM, standard error of measurement calculated from the standard deviation of the second trial.
Average of Intraobserver Reliability and Variation of Femoral Artery Pseudoaneurysm Measurements From Original, Enhanced, and Segmented Ultrasonography Images by Trained and Novice Observers.
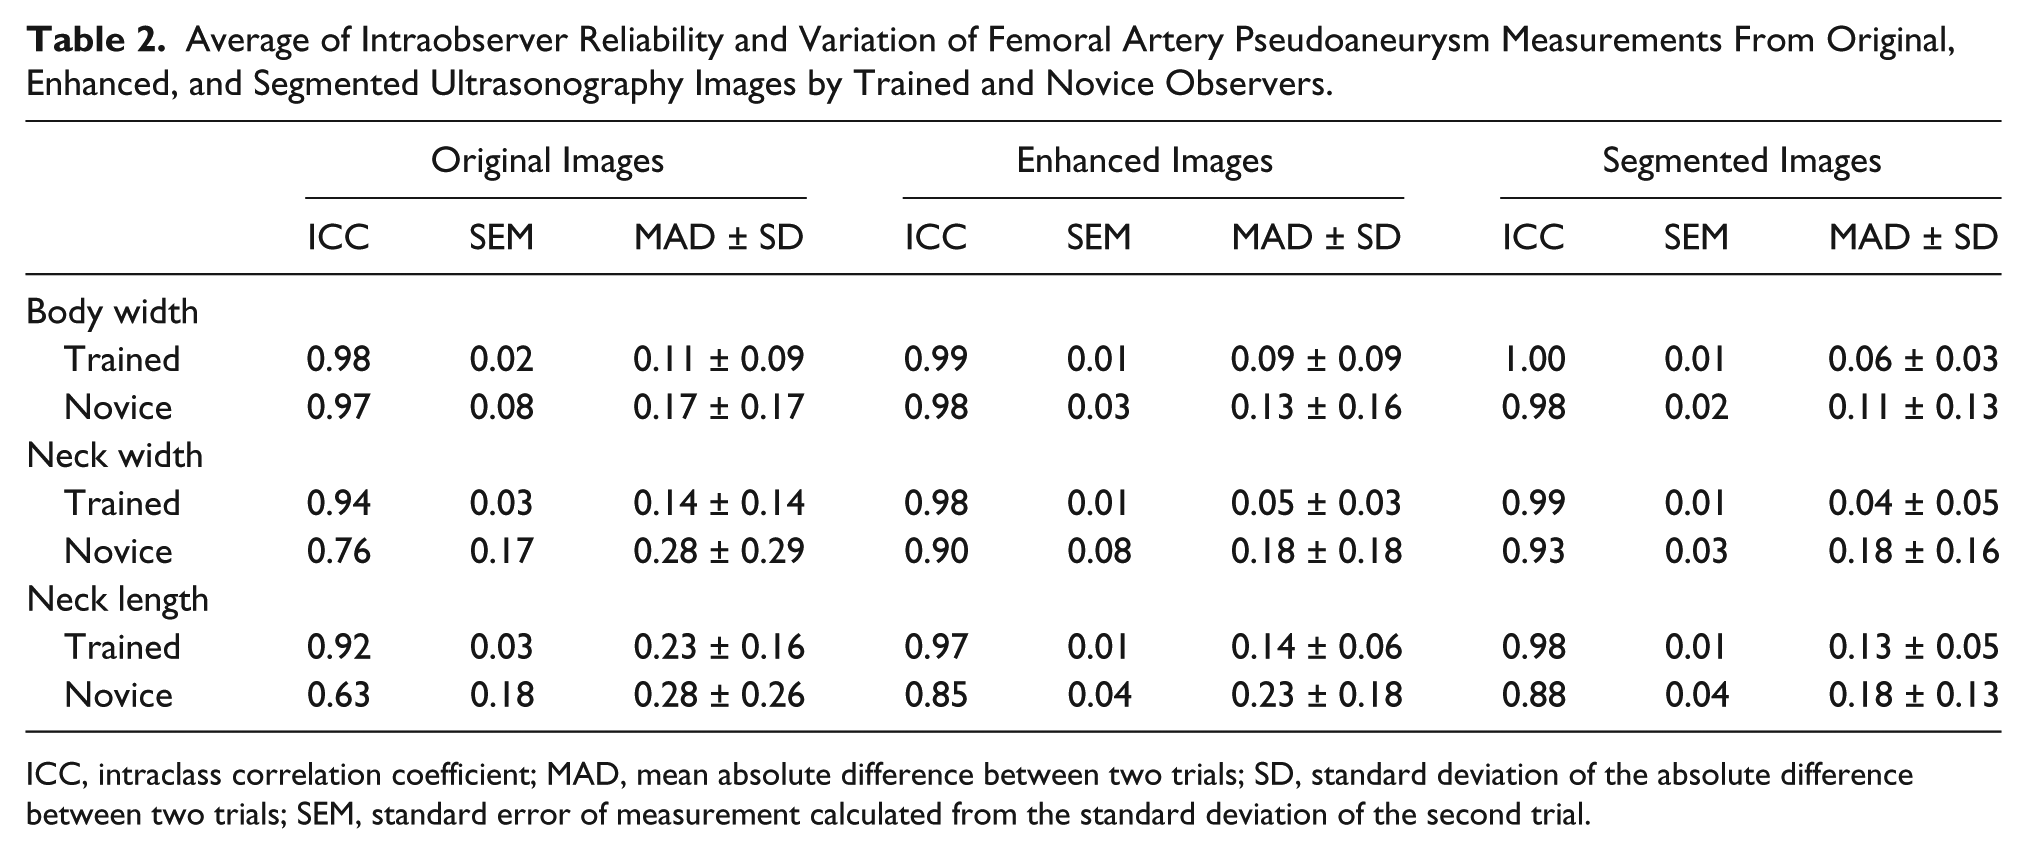
ICC, intraclass correlation coefficient; MAD, mean absolute difference between two trials; SD, standard deviation of the absolute difference between two trials; SEM, standard error of measurement calculated from the standard deviation of the second trial.
The interobserver reliability and variability of FAP body width from original enhanced and segmented US images are provided in Table 3. The reliability values were good among observers and the variability values were low. For the FAP neck width, the interobserver reliability and variability of FAP neck width from original, enhanced, and segmented US images are provided in Table 4. The reliability between O1 and O2 (trained observers) was good, with an ICC value of 0.8 and a SEM of 0.07. The reliabilities were moderate between the other observers, with an average ICC value of 0.78 and an average SEM value of 0.13. The average variability decreased in the segmented images compared to the original images. MAD ± SD was 0.34 ± 0.23 from original images and decreased to 0.20 ± 0.16 for the segmented images. The interobserver reliability and variability of FAP neck length from original, enhanced, and segmented US images are provided in Table 5. The average ICC and SEM values from original images were 0.75 and 0.13, indicating moderate reliability. The average ICC and SEM values increased in enhanced and segmented images, showing good reliability with average ICC values of 0.83 and 0.84, respectively. The variability of the measurements between observers decreased in the segmented images compared to the original images. MAD ± SD values were 0.42 ± 0.43 in the original images and 0.22 ± 0.21 in the segmented images.
Interobserver Reliability and Variation of Femoral Artery Pseudoaneurysm Body Width From Original, Enhanced, and Segmented Ultrasonography Images.
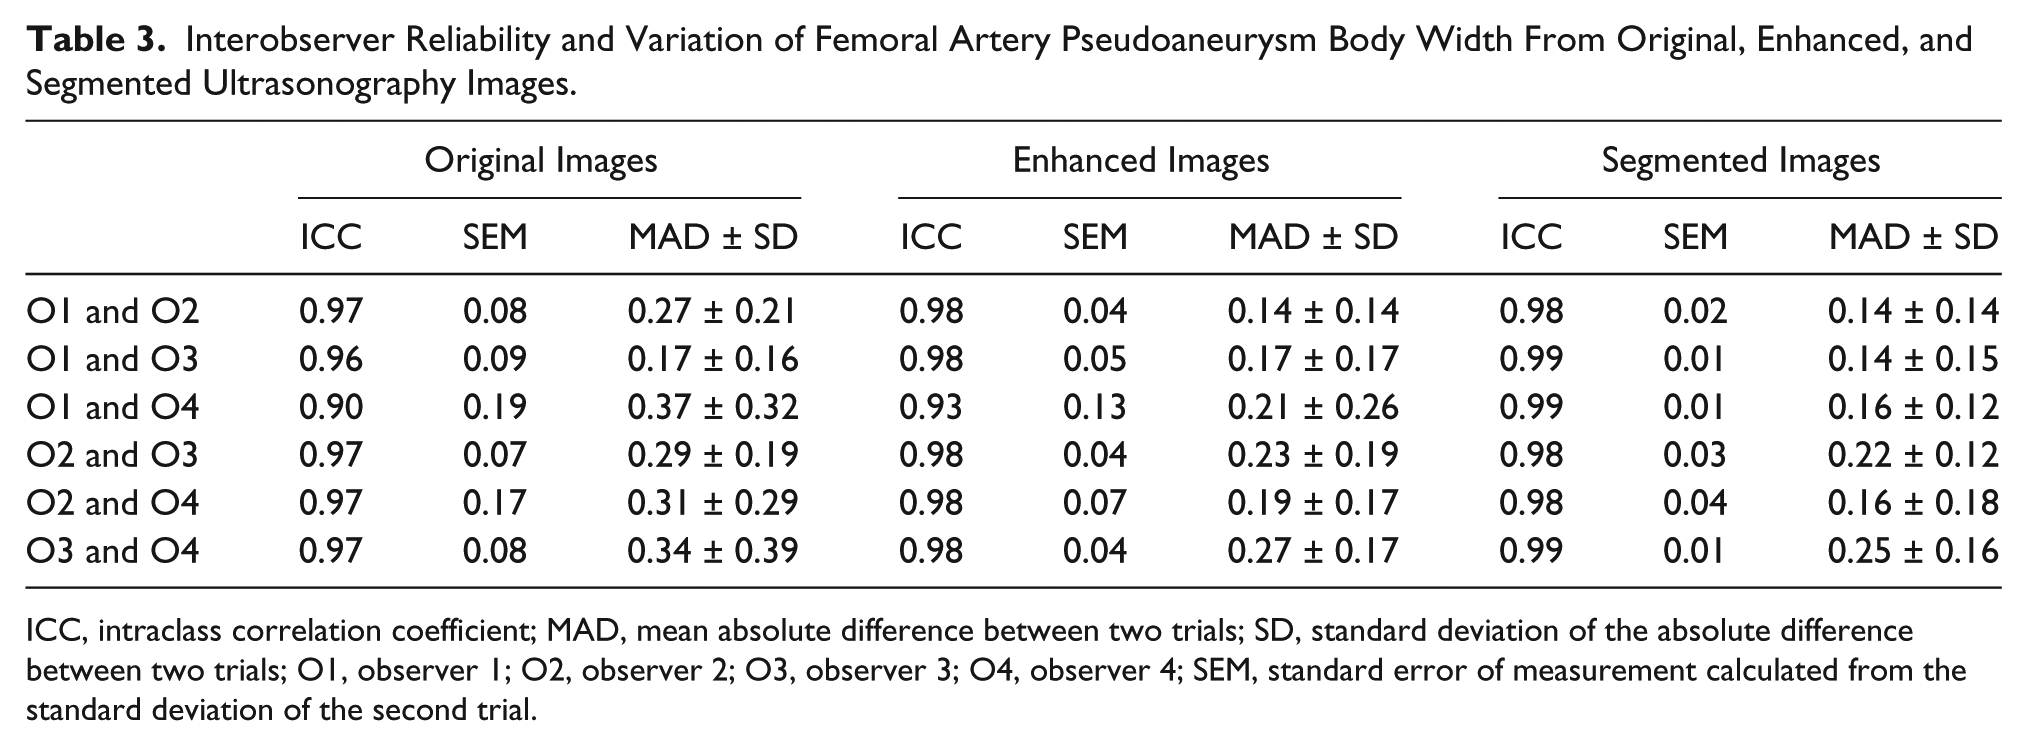
ICC, intraclass correlation coefficient; MAD, mean absolute difference between two trials; SD, standard deviation of the absolute difference between two trials; O1, observer 1; O2, observer 2; O3, observer 3; O4, observer 4; SEM, standard error of measurement calculated from the standard deviation of the second trial.
Interobserver Reliability and Variation of Femoral Artery Pseudoaneurysm Neck Width From Original, Enhanced, and Segmented Ultrasonography Images.
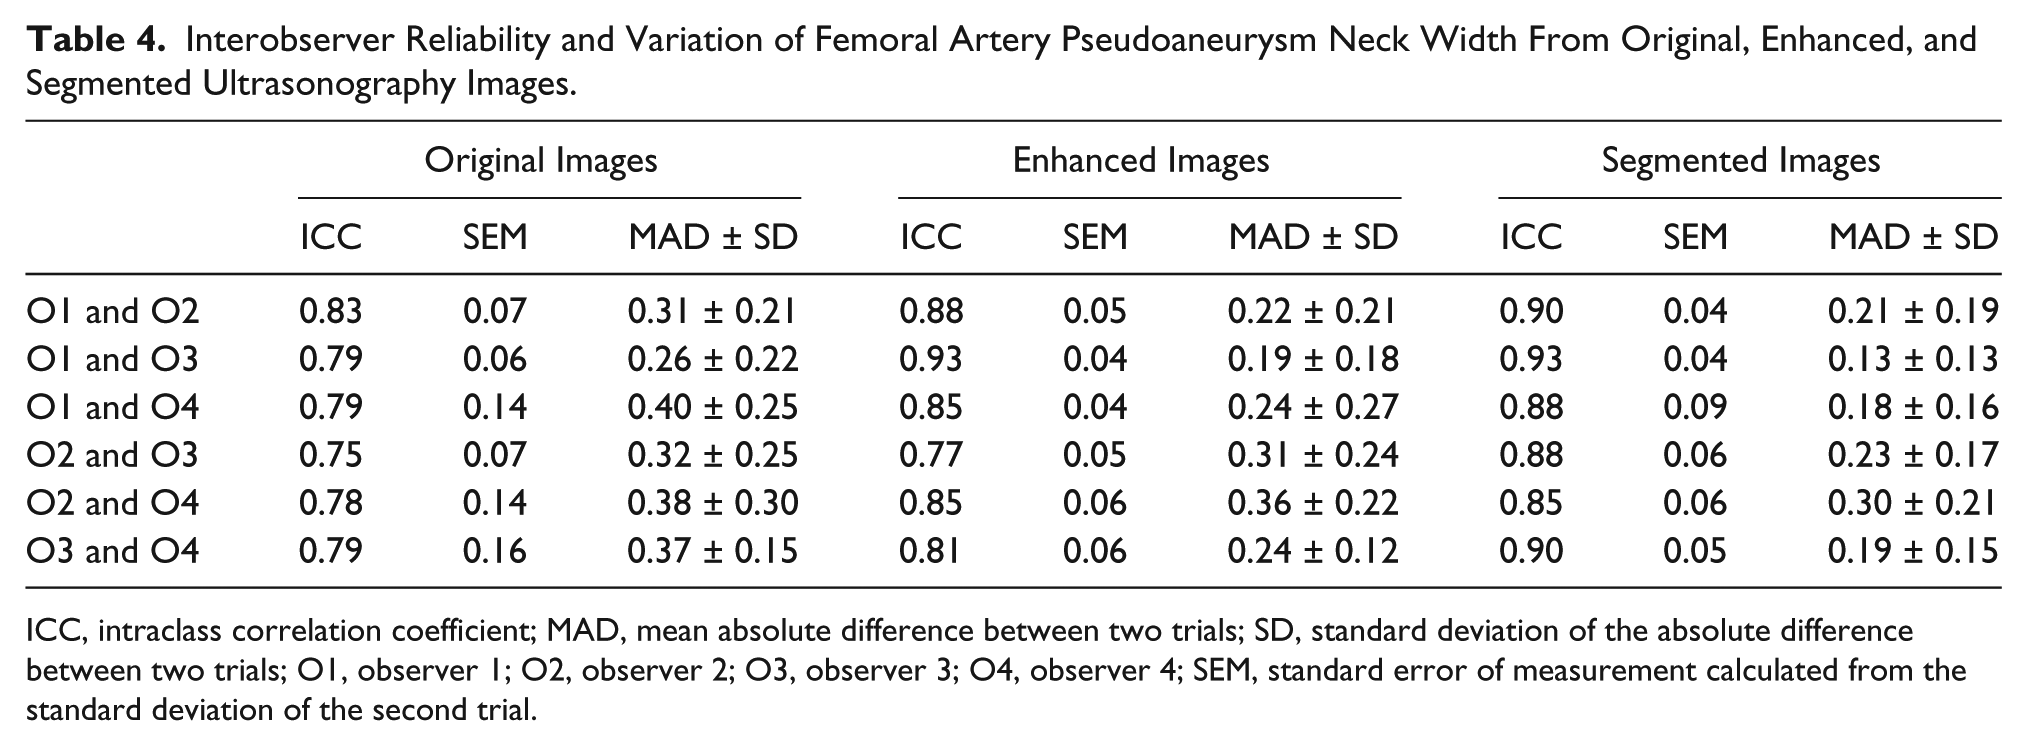
ICC, intraclass correlation coefficient; MAD, mean absolute difference between two trials; SD, standard deviation of the absolute difference between two trials; O1, observer 1; O2, observer 2; O3, observer 3; O4, observer 4; SEM, standard error of measurement calculated from the standard deviation of the second trial.
Interobserver Reliability and Variation of Femoral Artery Pseudoaneurysm Neck Length From Original, Enhanced, and Segmented Ultrasonography Images.
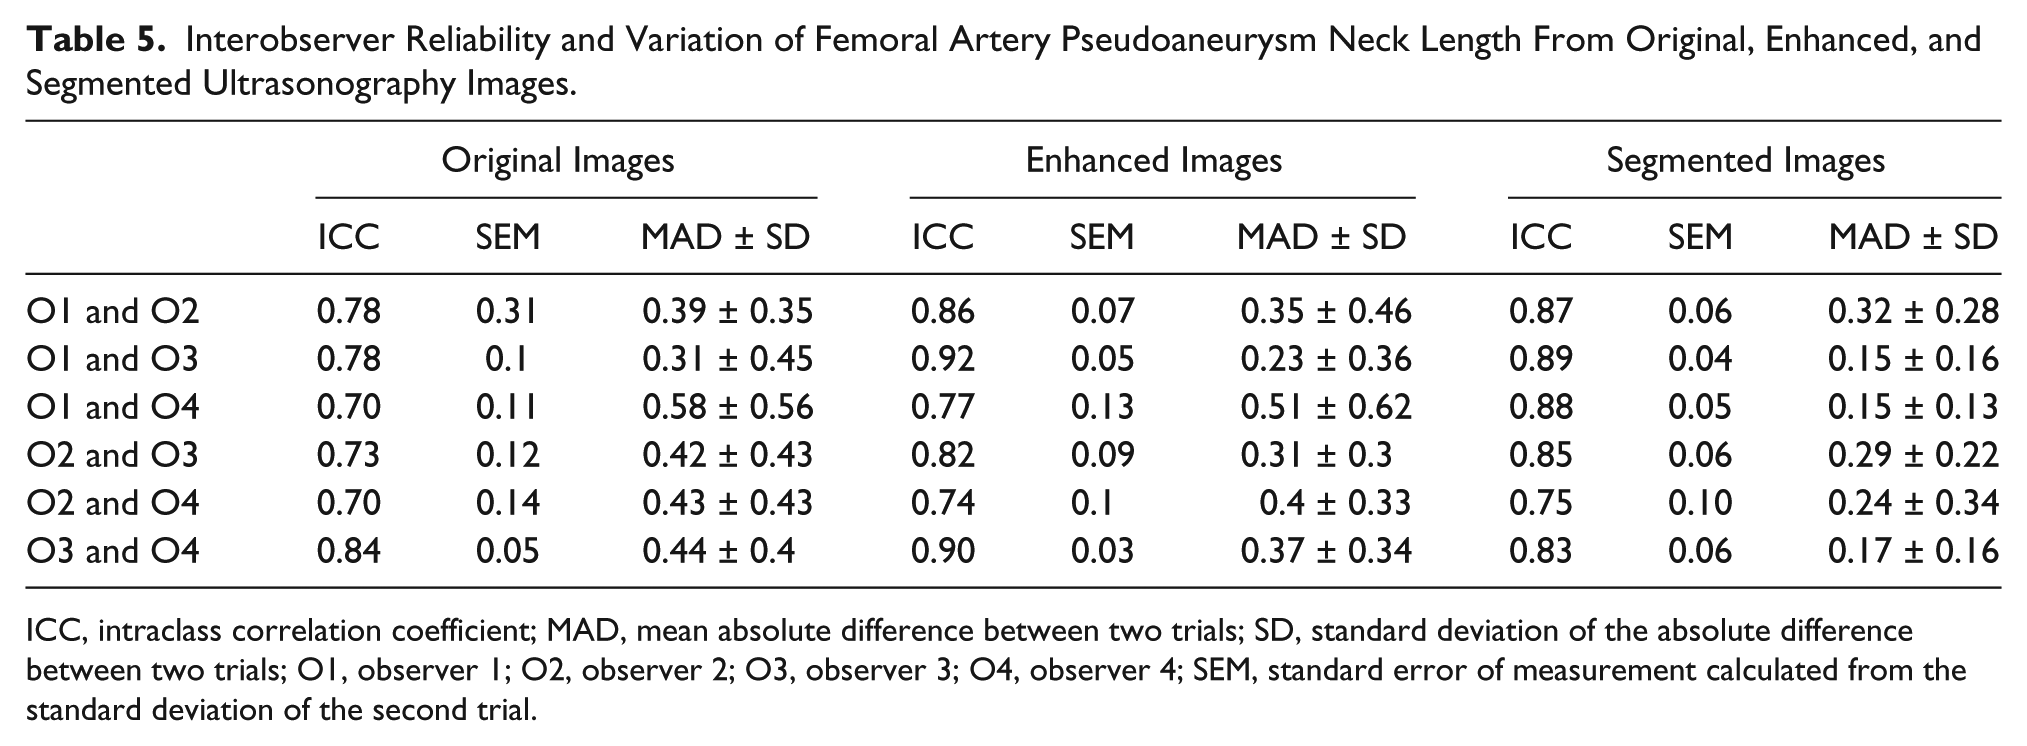
ICC, intraclass correlation coefficient; MAD, mean absolute difference between two trials; SD, standard deviation of the absolute difference between two trials; O1, observer 1; O2, observer 2; O3, observer 3; O4, observer 4; SEM, standard error of measurement calculated from the standard deviation of the second trial.
Discussion
In this study, a group of participants quantified the intra- and interobserver reliability and variability by measuring FAP body width and FAP neck width and length from B-mode US images. This was compared to the results with the measurements taken from the US images after enhancing the contrast and segmenting the area of interest. Also, an attempt was made to see the impact of image processing on the results of the FAP measurements taken by trained and novice observers from original, enhanced, and segmented US images. This study demonstrated that the intra- and interobserver reliability from FAP body width, FAP neck width, and length increased after enhancing the contrast of the B-mode US images as well as segmenting the FAP area from the background for both trained and novice observers. Since US is an operator-dependent modality, the consistency of replicate measurement might be adversely affected. 10 This study showed that the variation of the measurements among observers and among trials decreased with the aid of image processing. Among all FAP measurements that are required to determine the treatment option, FAP body width had the highest average reliability and the lowest average intra- and interobserver variability from the original US images. This indicated that it was easy for these observers to locate the FAP body and measure the body width twice with a high reliability and low variability between the two measurements. Even though the reliability was good for the FAP body width from the original images, the average of the intraobserver reliability ICC value increased by 1% from the enhanced images compared to the original images. It also increased by 2% from the segmented images compared to the original images. Since treatment options initially depend on the size of FAP body width, it is important to detect lesions with a high reliability. These study results showed that for both trained and novice observers, the reliability values were high. However, it is also important to report the variability of repeated measures of FAP body width since most FAPs, which are less than 2 cm in width, are followed expectantly with serial US. These results demonstrated that the average variability value for repeated measures of FAP body width decreased by 21% in enhanced images and by 35% in segmented images compared to the original images.
In addition, these study results showed that for FAP neck width and length, trained observers had good reliability from the original images and novice observers had moderate reliability. This may indicate that the impact of image processing is higher for novice observers compared to trained observers. For FAP neck width, the average reliability ICC value from enhanced images increased by 4% for the trained observers compared to the original images. It also increased by 5% for segmented images compared to the original images. However, the average ICC value increased by 18% for novice observers for enhanced images and increased by 22% from segmented images. For FAP neck length, trained observers’ ICC average value increased by 5% from enhanced images and by 6% from segmented images compared to the original images. In contrast, the average ICC value increased by 34% from the enhanced images and increased by 39% from the segmented images for novice users compared to the original images. This finding indicates that the usage of image enhancement and segmentation could have an impact on patients’ care. It could also benefit less experienced sonographers and aid in their ability to take the required measurements for treatment planning with high reliability and less variability. These results showed that image processing helped these novice observers more than trained observers in repeating their measurements with less variability. The general lack of improvement found in the trained observers may speak to the fact that those observers are already relatively well practiced and educated in performing FAP measurements. Even though the proposed US image processing showed an improvement in novice observer reliability and decreased variability in measuring FAP, further studies with a larger database of patient images are needed.
Conclusion
In conclusion, image postprocessing in this study resulted in a decrease in variability by novice observers for FAP measurements completed with US images after image postprocessing and image segmentation. Proposed image processing may potentially allow for better detection of correct width and length of the FAP neck, thereby allowing better decision making on what treatment(s) (if any) to provide.
Footnotes
Declaration of Conflicting Interests
The authors declared no potential conflicts of interest with respect to the research, authorship, and/or publication of this article.
Funding
The authors received no financial support for the research, authorship, and/or publication of this article.