
Abstract
Objective:
To assess the reliability and variability of femoral artery pseudoaneurysm (FAP) measurements between pre- and postprocessed sonograms acquired in a major medical center in Saudi Arabia as compared with results obtained from a major medical center in the United States.
Methods:
Retrospective image analysis was conducted on 23 FAP sonograms, which were evaluated by four observers. Observers measured FAP sac and neck from pre- and postprocessed images and remeasured again after 2 weeks, to avoid recall bias.
Results:
The use of image processing was more profound for the novice observers in measuring FAP neck width and length. The intraclass correlation coefficient (ICC) for FAP neck width improved after segmentation from 0.63 to 0.91; in contrast, the ICC improved from 0.91 to 0.97 for experts. The average ICCs for FAP neck length improved from 0.40 to 0.79 for novices and from 0.86 to 0.95 for experts. The largest variation of values, within observers, were for neck length obtained from the original images. The range varied from 0.16 to 0.37 cm and was reduced to 0.10 to 0.18 cm with segmented images.
Conclusion:
As demonstrated previously, sonographic image processing resulted in increased reliability and decreased variability for FAP measurements.
Keywords
Femoral artery pseudoaneurysm (FAP) is a common complication after cardiac catheterization, and it is known as an iatrogenic pseudoaneurysm. 1 In pseudoaneurysms, blood accumulates between the two outer layers of an artery, the tunica media and the tunica adventitia, forming a pulsatile hematoma also known as a false aneurysm.2,3 A pseudoaneurysm is distinct from a true aneurysm, which results from dilation of all layers of the arterial wall. 3 FAP mostly occurs after surgical procedures, penetrating trauma, blunt trauma, and infection caused by self-injection of drugs. 4 Although modern imaging modalities have made the diagnosis of pseudoaneurysms more common, the increase in the number of surgical and angiographic procedures performed has led to an increase in the prevalence of pseudoaneurysms. This may be caused by poor control of arterial bleeding following the procedure. 3 This is usually a result of insufficient pressure being applied over the puncture site or pressure being applied for an insufficient amount of time. 1
Early diagnosis of FAP is crucial to avoid complications such as rupture, thromboembolism, compression of nerves, and vessels with associated neuropathy, claudication, or, rarely, critical limb ischemia.5,6 Furthermore, local ischemia of the skin may lead to necrosis and infection. 7 Conventional angiography remains the standard for FAP diagnosis, yet it is an invasive procedure. 7 The alternative safe imaging modality for FAP diagnosis is ultrasonography (US). 8 US of FAP does not involve the use of ionizing radiation and contrast agents. Furthermore, it is portable, readily available, noninvasive, and inexpensive. 9 The diagnostic examination of choice is duplex US with a 5- to 7-MHz linear transducer, where duplex US represents a combination of gray-scale and color Doppler US.6,10 Gray-scale imaging alone is unable to differentiate FAP from hematoma. 11 Duplex US enhances the diagnostic accuracy of US by identification of the bidirectional waveform in the FAP neck as well as the swirling pattern of flow within the FAP sac11,12 (Figure 1). Nevertheless, evaluation of anatomic features such as sac size, shape, and neck size on gray-scale US is equally important to determine proper treatment. 13
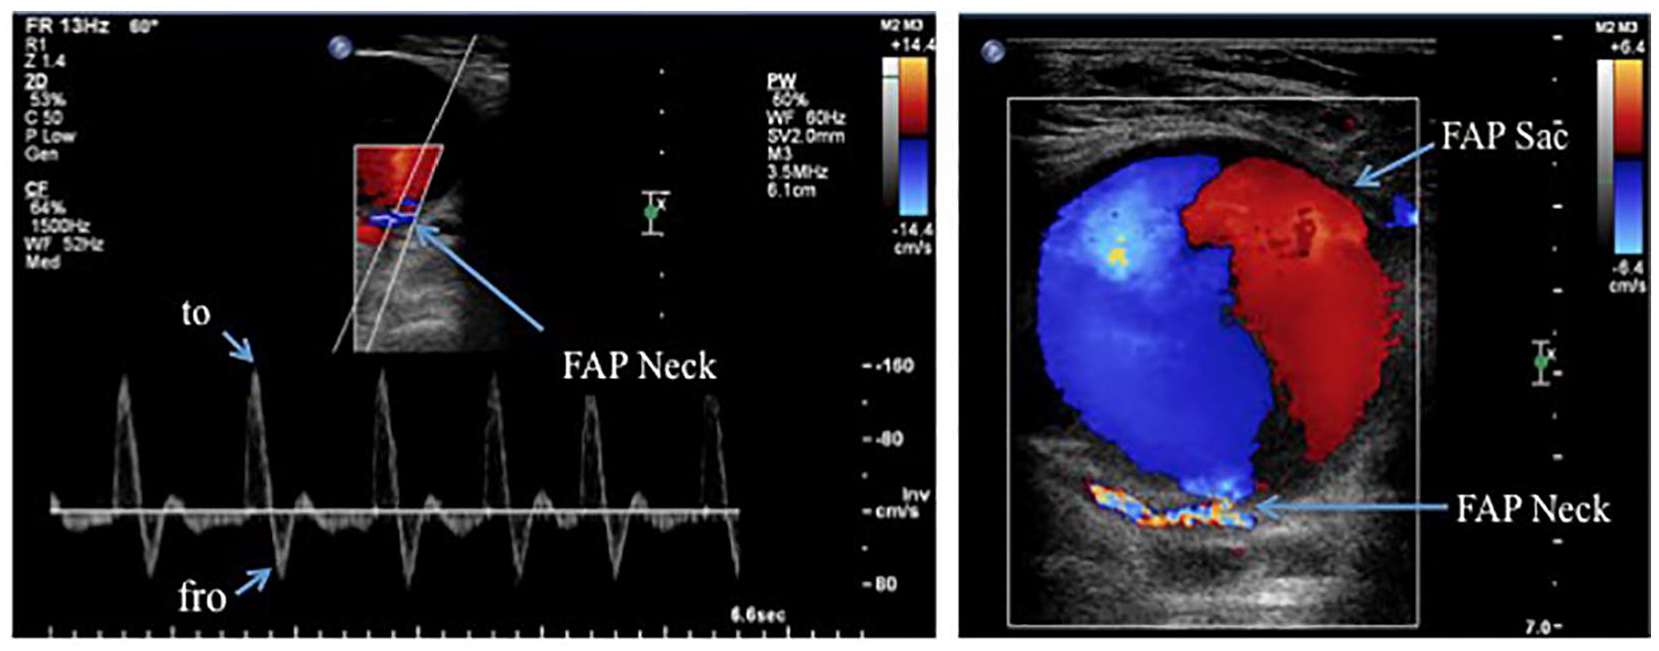
Color flow duplex ultrasonographic images of femoral artery pseudoaneurysm acquired from a major medical center in Saudi Arabia. On the right, the swirling “yin-yang” pattern within the sac. On the left, the bidirectional “to and fro” flow classic pattern in the neck.
In fact, the type of treatment depends on the hemodynamic status and FAP sac size. 4 If the sac size is <2 cm, it usually thromboses spontaneously within 2 to 4 weeks, with no complications, and it needs only surveillance.12,14 If FAP persists, ultrasound-guided compression (UGC) may be considered. If the sac size is >2 cm, then hospital-specific treatment guidelines may include UGC or ultrasound-guided thrombin injection (UGTI) as a first-line therapy, followed by surgical repair. 15 However, UGC is not commonly used, since it is often accompanied by significant patient discomfort as well as potential risk for a sonographer’s work-related injury due to the prolonged compression (e.g., manual compression for 1 hour). 16 Depending on the length and width of the FAP neck, physicians may decide treatment via either UGTI or surgical repair. 15 UGTI can be performed with a FAP that has a long neck (1-cm length) and a narrow neck (<1-cm width) so that the thrombin does not pass through the FAP neck and enter the arterial circulation, a risk for limb ischemia. 17 If the FAP neck is too short (<1 cm length) or too wide (>1 cm), surgical repair is preferred to treat the FAP 18 (Figure 2).
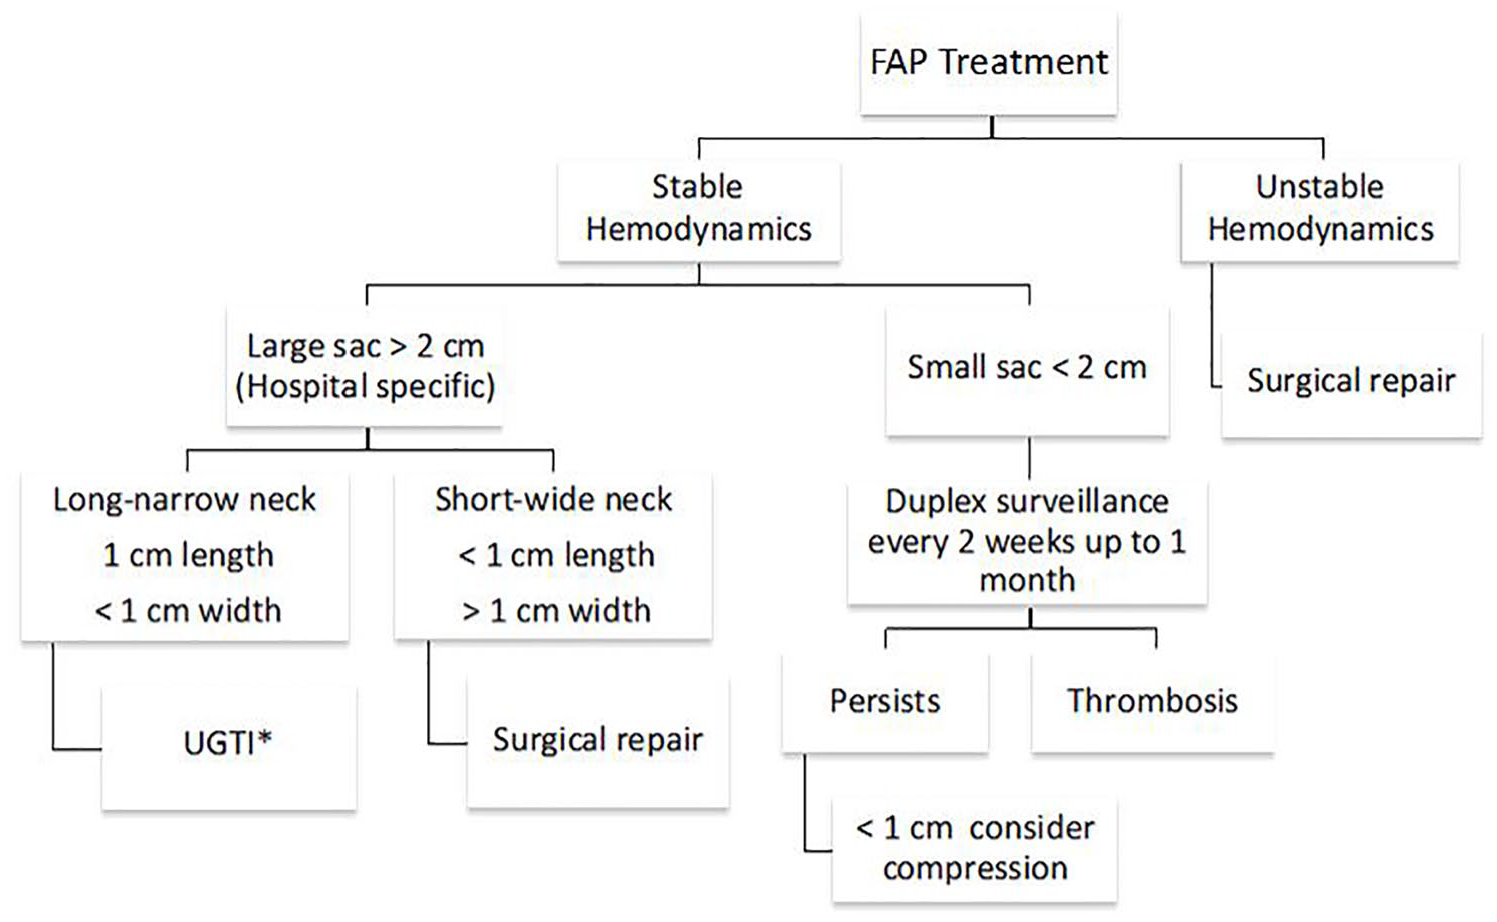
Algorithmic illustration for types of femoral artery pseudoaneurysm treatment (FAP). *UGTI, ultrasound-guided thrombin injection.
One of the main limitations of US is the low level of contrast caused by the presence of speckle, an inherently granular “noise” that degrades the quality of the image. 19 Also, US is an operator-dependent modality, which may result in a high level of intra- and interoperator variability. 7 It has been reported that the data integrity of an US examination is directly related to operator skill, training, and experience. 20 Recently, the use of medical image-processing methods such as semi- or fully automatic segmentation has increased in clinical applications to avoid complications that may arise as a result of interoperator variability and to aid in diagnosis and treatment planning. 21 The previously reported intra- and interobserver variability and reliability of the FAP measurements between pre- and postprocessed US images acquired from a major medical center in the United States showed that the influence of image processing was more profound on novice observers in repeating their measurements with less variability and high reliability. 22
Since diverse samples from multisite studies can provide results that are more generalizable, the aim was to test the impact of image processing on intra- and interobserver reliability and variability in measuring FAP sac width, neck width, and neck length. The sample gray-scale US images were acquired from a major medical center in Saudi Arabia. This allowed for a comparison of results with previous findings based on US images acquired at a major medical center in the United States. 22 The hypothesis of this study was that the image-processing method used to obtain the previously published data 22 may yield comparable results when applied to images acquired from a foreign institution.
Materials and Methods
Ethics approval was granted from the local health research ethics board of the ministry of the National Guard. Obtaining consent was exempted for this study. This was designed as a retrospective study. A total of 23 FAP US images were generated from 10 subjects. The images were acquired from a major medical center in Saudi Arabia. The images reviewed were acquired between January 2013 and September 2018.
Data Acquisition and Measurement
All images were processed by a single operator using MATLAB R2018b software (MathWorks, Natick, MA) to enhance the contrast and to segment the FAP area from the background with the same preprocessing and segmentation method used in the previously cited study 22 (Figure 3).
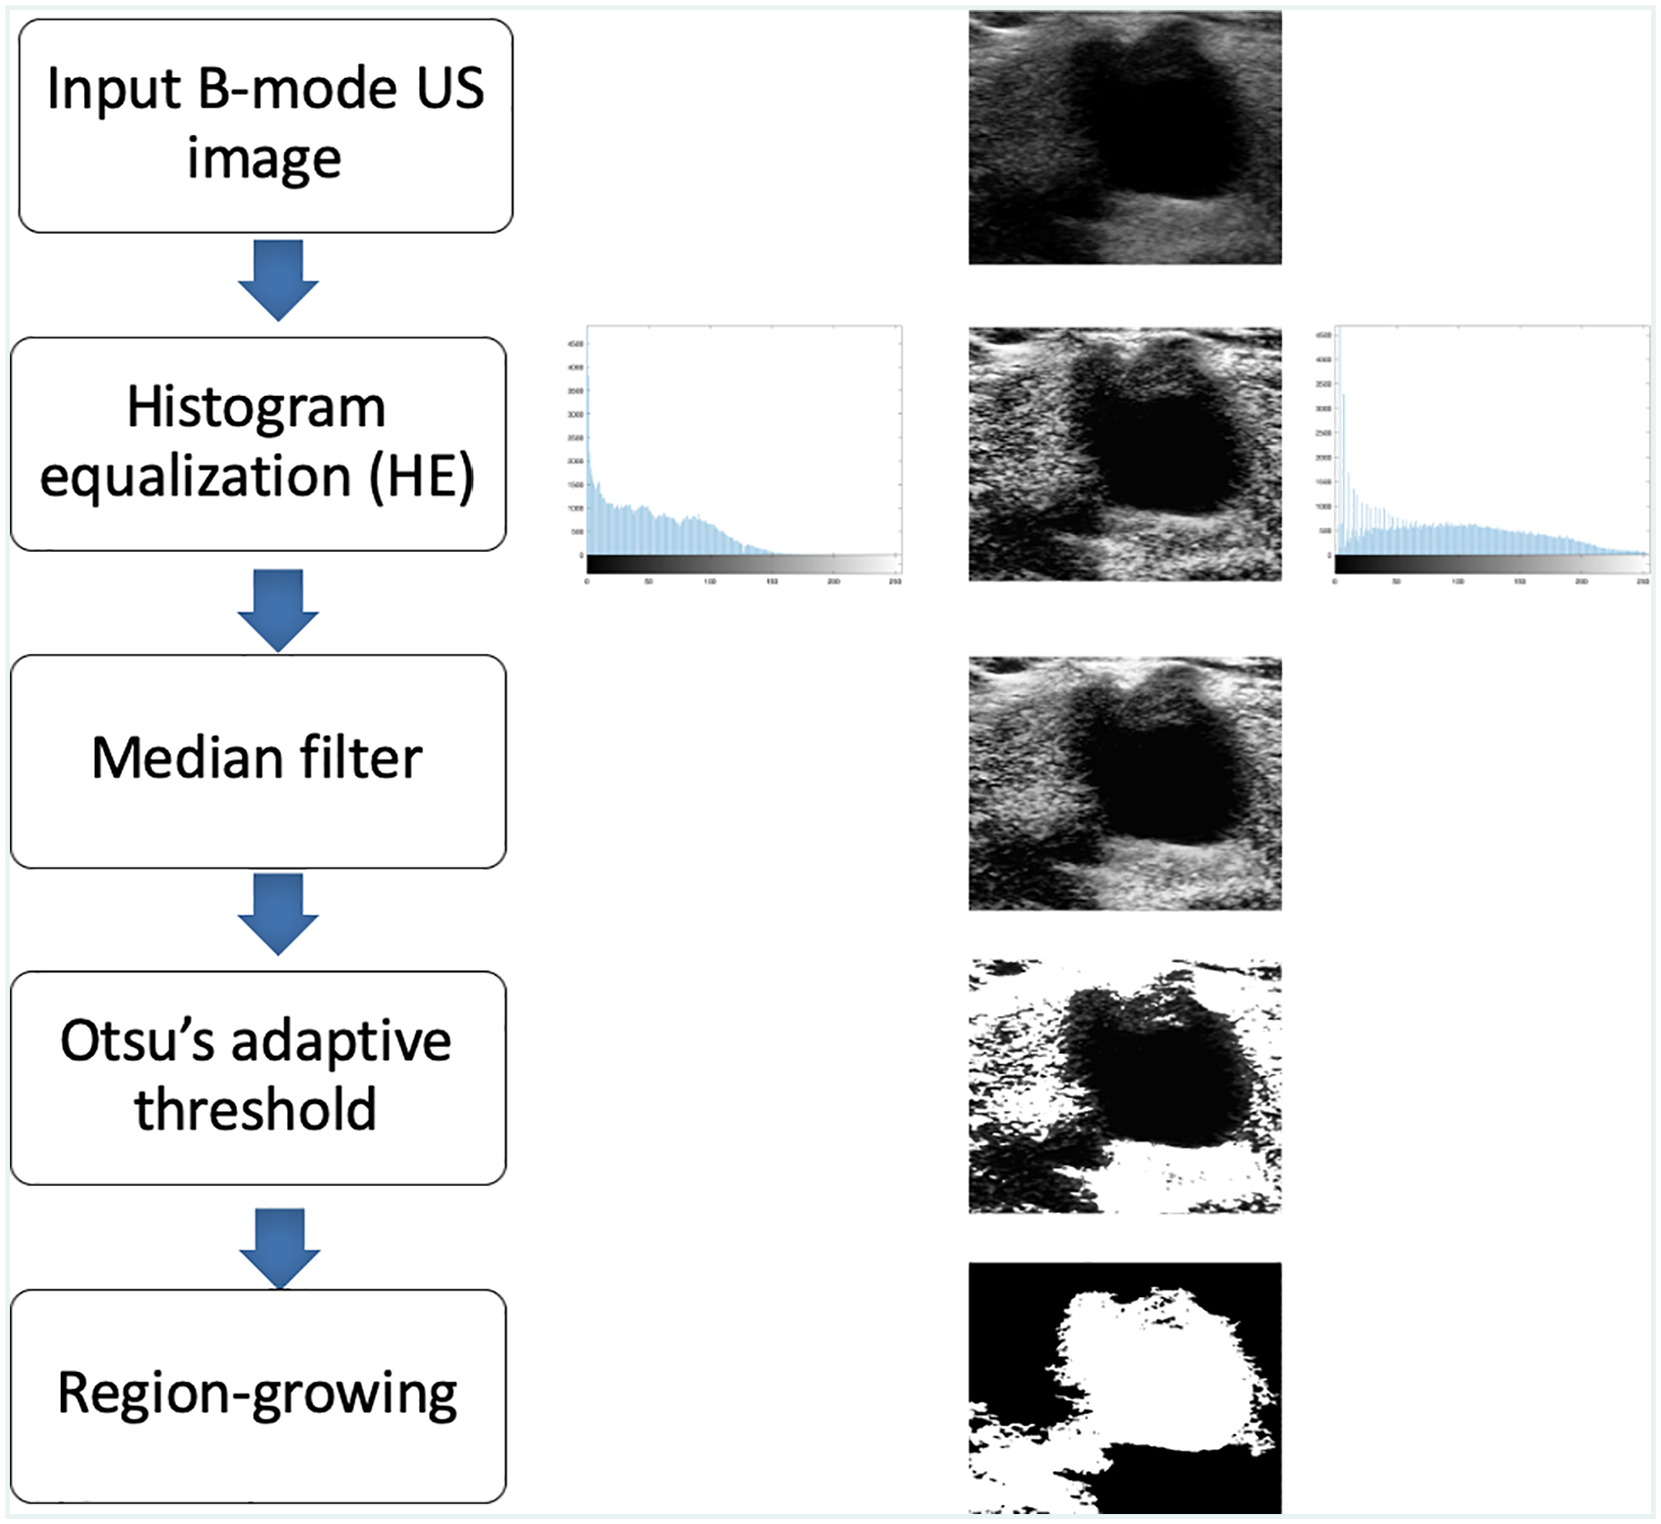
Flowchart of image-processing algorithm. From top to bottom, the following steps are shown: input B-mode ultrasonographic (US) image of femoral artery pseudoaneurysm, contrast-enhanced US image with histogram equalization, a median filter, a threshold image with Otsu’s adaptive method, and a segmented US image based on the region-growing technique.
The image categories used in this study were color flow duplex US images, original B-mode US images, postprocessing contrast-enhanced US images, and segmented US images. This study involved four observers. Observers 1 and 2 were expert sonographers. Observer 1 has 2 years of experience as a sonographer, and observer 2 has 5 years of experience. Observers 3 and 4 were novice in measuring FAP from B-mode US images. All observers were given color flow duplex US images for each subject, in addition to the B-mode original, postprocessing contrast-enhanced, and segmented images, to assist in identifying the FAP neck area. All observers used MATLAB to measure the FAP sac width, neck width, and length from the original, postprocessing contrast-enhanced, and segmented US images. Each measurement on all image types (original, postprocessing contrast-enhanced, and segmented) was completed twice and then again 2 weeks later to avoid recall bias. 23 This step was taken to avoid a systematic error, which can happen when a participant remembers past events. 24 These measurements were done independently, without communication among observers.
Statistical Analysis
Statistical analysis was performed with SPSS 22 (IBM Company, Chicago, IL) and Microsoft Excel 2011 (Microsoft, Redmond, WA). Statistical graphs were made with GraphPad Prism 8.2.0 software (GraphPad, La Jolla, CA). The intra- and interobserver reliabilities were evaluated by calculating the standard error of measurement (SEM) and the intraclass correlation coefficients (ICCs [2,k]) with a two-way random model with absolute agreement. 25 SEM estimates how repeated measurements taken by a person on the same instrument tend to be distributed around his or her “true” score. ICC is used in the assessment of consistency or reproducibility of quantitative measurements made by different observers measuring the same quantity. 26 According to Currier, 27 an ICC value between 0.80 and 1.00 is considered good reliability, 0.60 to 0.79 moderate reliability, and <0.60 poor reliability. Smaller SEM values are desired for good reliability. The intra- and interobserver variability was calculated by using the mean absolute difference (MAD) between measurements and the standard deviation of the absolute difference (SD). Smaller MAD values and SD values point to less variability. 28 For the interobserver reliability and variability, the second measurement from all observers was used. The Bland-Altman method consisted of a scatter plot of the difference of the two measurements against the average of the two measurements (i.e., bias), and limits of agreement were used to examine the agreement of measurements between pairs of observers. 29
Results
Patient cases consisted of seven women and three men, with a mean ± SD age of 53.6 ± 21.6 years (range, 19−89 years). Based on the patient cases and resulting images, the intraobserver reliabilities and variation in the FAP sac width, neck width, and length measurements from the original, postprocessed contrast-enhanced, and segmented US images were recorded for all observers (Table 1).
Intraobserver Reliability and Variation of Femoral Artery Pseudoaneurysm Measurements From Ultrasonography Images by All Four Observers.
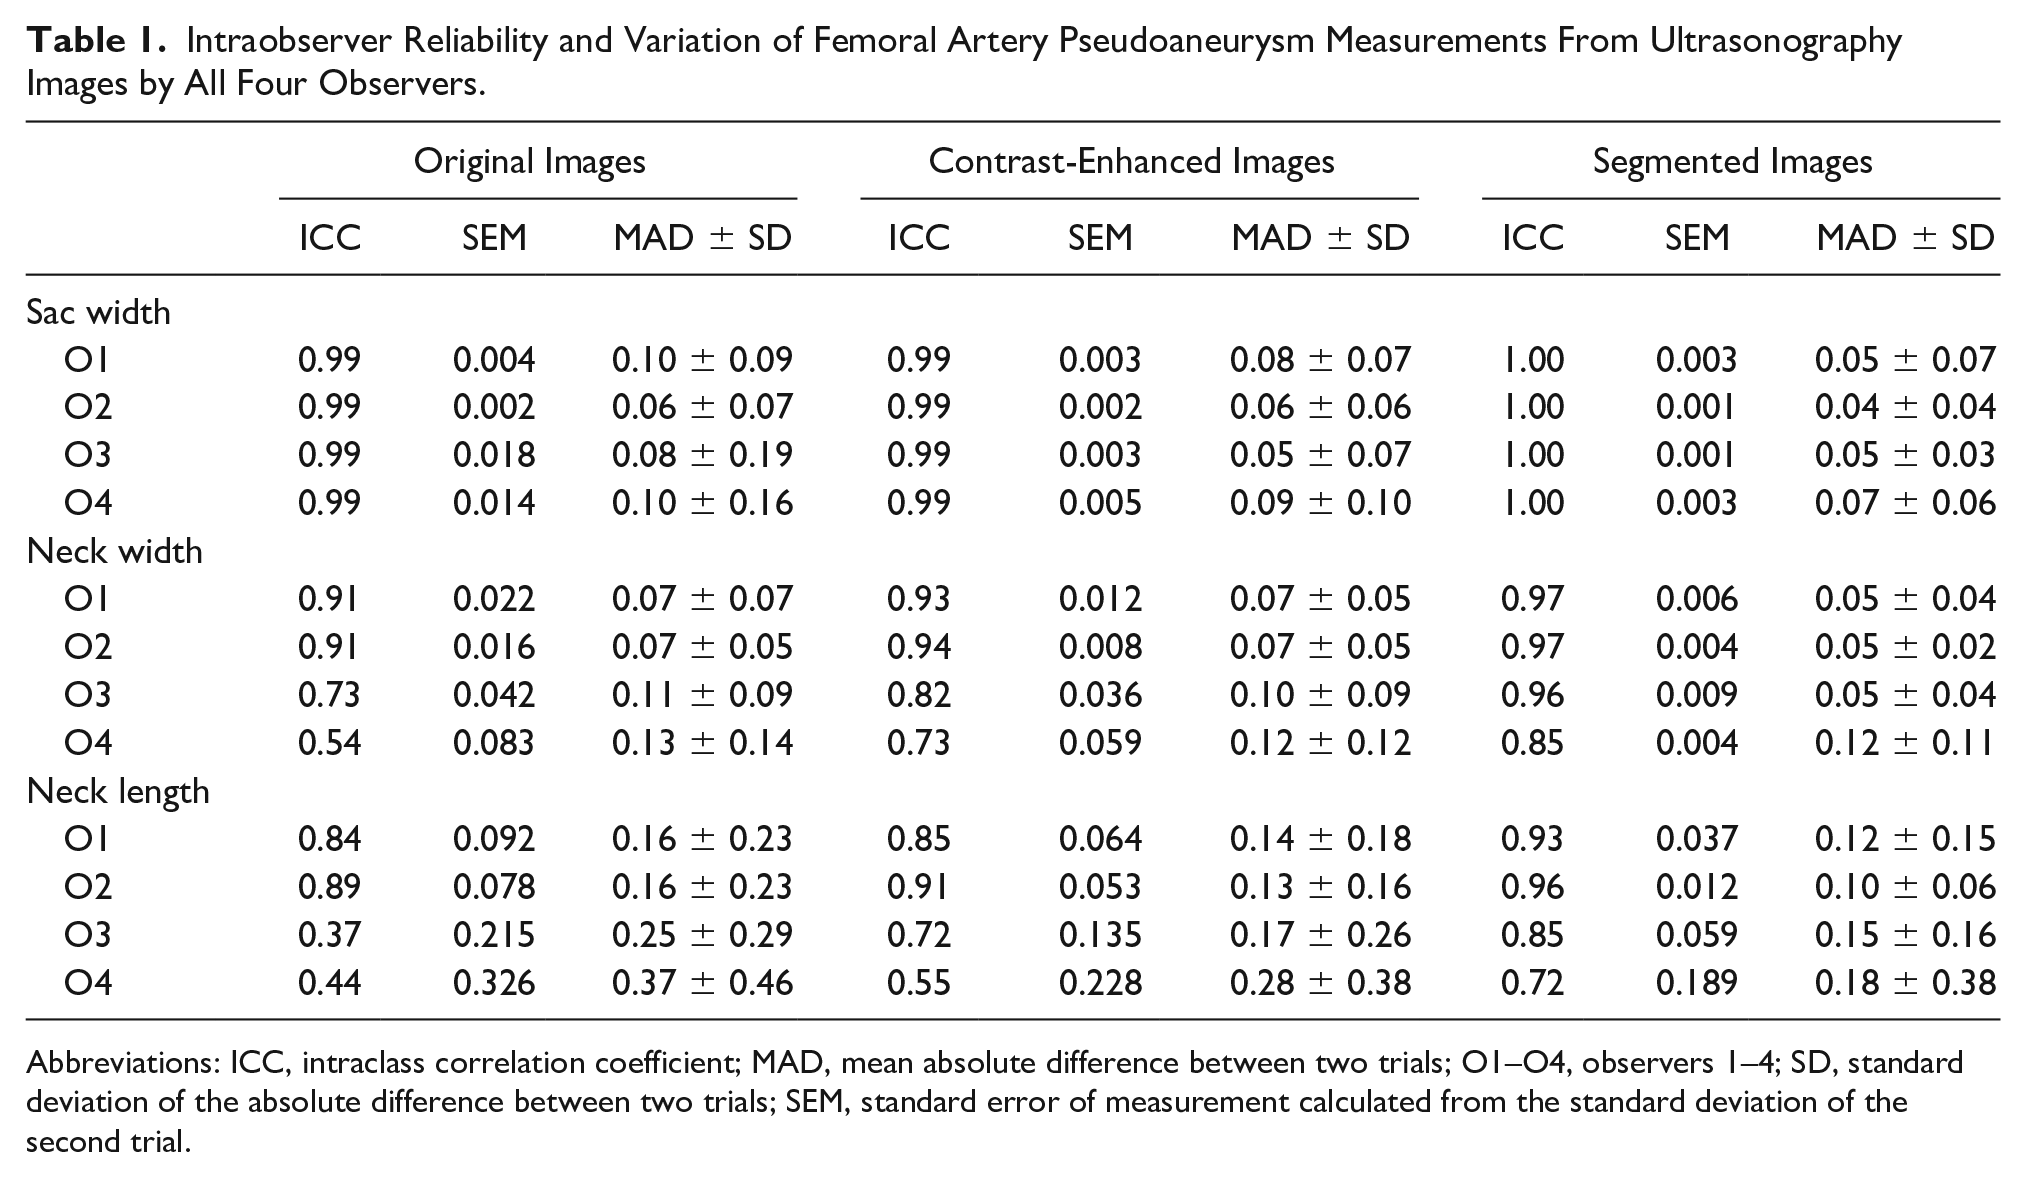
Abbreviations: ICC, intraclass correlation coefficient; MAD, mean absolute difference between two trials; O1–O4, observers 1–4; SD, standard deviation of the absolute difference between two trials; SEM, standard error of measurement calculated from the standard deviation of the second trial.
For the FAP sac width measurements, the average ICC value from the original US images was 0.99 for all observers, and the average SEM was 0.01, indicating high intraobserver reliability. The ICC values increased to 1 for all observers from segmented images. The variability—defined as MAD and the SD between the two trials obtained from the original US images by observer 1 (O1), observer 2 (O2), observer 3 (O3), and observer 4 (O4)—was 0.10 ± 0.09 cm, 0.06 ± 0.07 cm, 0.08 ± 0.19 cm, and 0.10 ± 0.16 cm, respectively. This finding indicated that the expert observers (O1 and O2) and the novice observers (O3 and O4) had low variability between the two trials of analysis of original (unprocessed) B-mode US images. This variation between the two trials decreased even further for all observers when these measurements were obtained from postprocessed contrast-enhanced and segmented US images, with MAD values ranging from 0.05 to 0.09 cm and 0.04 to 0.07 cm, respectively.
For the FAP neck width, the reliability of the measurements from the original US images was good for O1 and O2, with an ICC value >0.90 and SEM value <0.03. The reliability was moderate for O3 and poor for O4, with ICC values of 0.73 and 0.54 and SEM values of 0.04 and 0.08, respectively. However, the reliability of the measurements from the postprocessed contrast-enhanced and segmented US images increased for all observers, with ICC values >0.70. The average values of SEM from the original, postprocessed contrast-enhanced, and segmented images were 0.04, 0.02, and 0.01, respectively, which points to higher reliability for measurements taken from postprocessed contrast-enhanced and segmented images. The variation between the two trials decreased in the segmented US images for all observers as compared with the measurements from original US images, with values ranging from 0.07 to 0.13 cm and 0.05 to 0.12 cm.
For FAP neck length, expert observers (O1 and O2) had good reliability based on the original images, with an average ICC value of 0.86 and average SEM value of 0.03. The novice observers (O3 and O4) had poor reliability, with an average ICC value of 0.40 and average SEM value of 0.18. The average ICC values from postprocessed contrast-enhanced US images increased for the expert and novice observers to 0.88 and 0.64, respectively. The reliability increased with segmented images, with an average ICC value of 0.95 for the expert observers and 0.79 for the novices. The variability also decreased from segmented images, with MAD ranging from 0.10 to 0.18 cm, as compared with the original images, with MAD ranging from 0.16 to 0.37 cm, within observers. Table 2 provides a summary of the average values of the intraobserver reliability and variability of FAP measurements from the original, postprocessed contrast-enhanced, and segmented US images by expert and novice observers.
Average Intraobserver Reliability and Variation of Femoral Artery Pseudoaneurysm Measurements From Ultrasonography Images by Expert and Novice Observers.
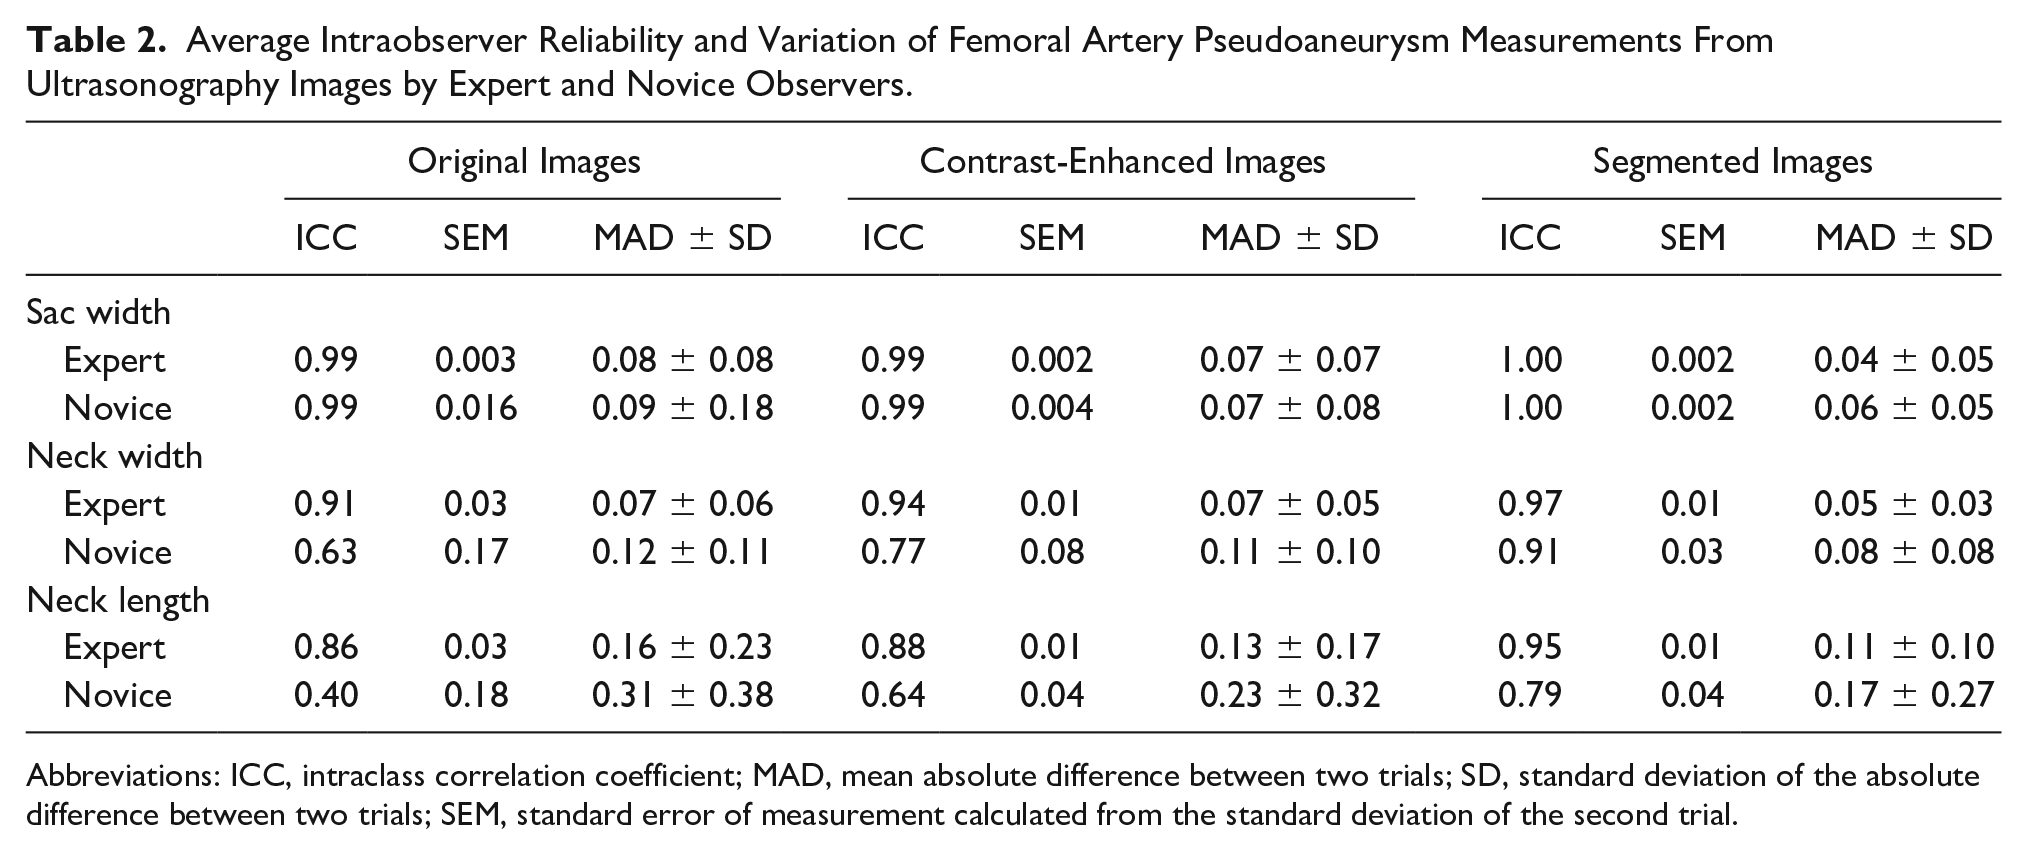
Abbreviations: ICC, intraclass correlation coefficient; MAD, mean absolute difference between two trials; SD, standard deviation of the absolute difference between two trials; SEM, standard error of measurement calculated from the standard deviation of the second trial.
The interobserver reliability and variability of FAP sac width from the original, postprocessed contrast-enhanced, and segmented US images are provided in Table 3. The reliability values were high among observers, and the variability values were low. For the FAP neck width, the interobserver reliability and variability of FAP neck width from original, postprocessed contrast-enhanced, and segmented US images are provided in Table 4. The reliability between O1 and O2 (expert observers) was good, with an ICC value of 0.85 and an SEM of 0.02. The reliability was poor between O3 and O4 (novice observers), with an ICC value of 0.47 and an SEM value of 0.08. However, the reliability increased for the novice observers to an ICC value of 0.86 and an SEM of 0.03 for the segmented images. The average variability decreased in the segmented images as compared with the original images. MAD ranged from 0.09 to 0.15 cm from original images and decreased to a range of 0.06 to 0.10 cm for the segmented images. Table 5 provides the interobserver reliability and variability of FAP neck length from original, postprocessed contrast-enhanced, and segmented US images. The average ICC and SEM values from the original images were 0.44 and 0.25. The average ICC and SEM values improved in segmented images, showing good reliability with an average ICC value of 0.82 and an SEM value of 0.07 for all observers. The variability of the measurements between observers decreased in the segmented images as compared with the original images, where MAD values ranged from 0.18 to 0.37 cm from the original images and from 0.09 to 0.29 cm for the segmented images.
Interobserver Reliability and Variation of Femoral Artery Pseudoaneurysm Sac Width From Ultrasonography Images.
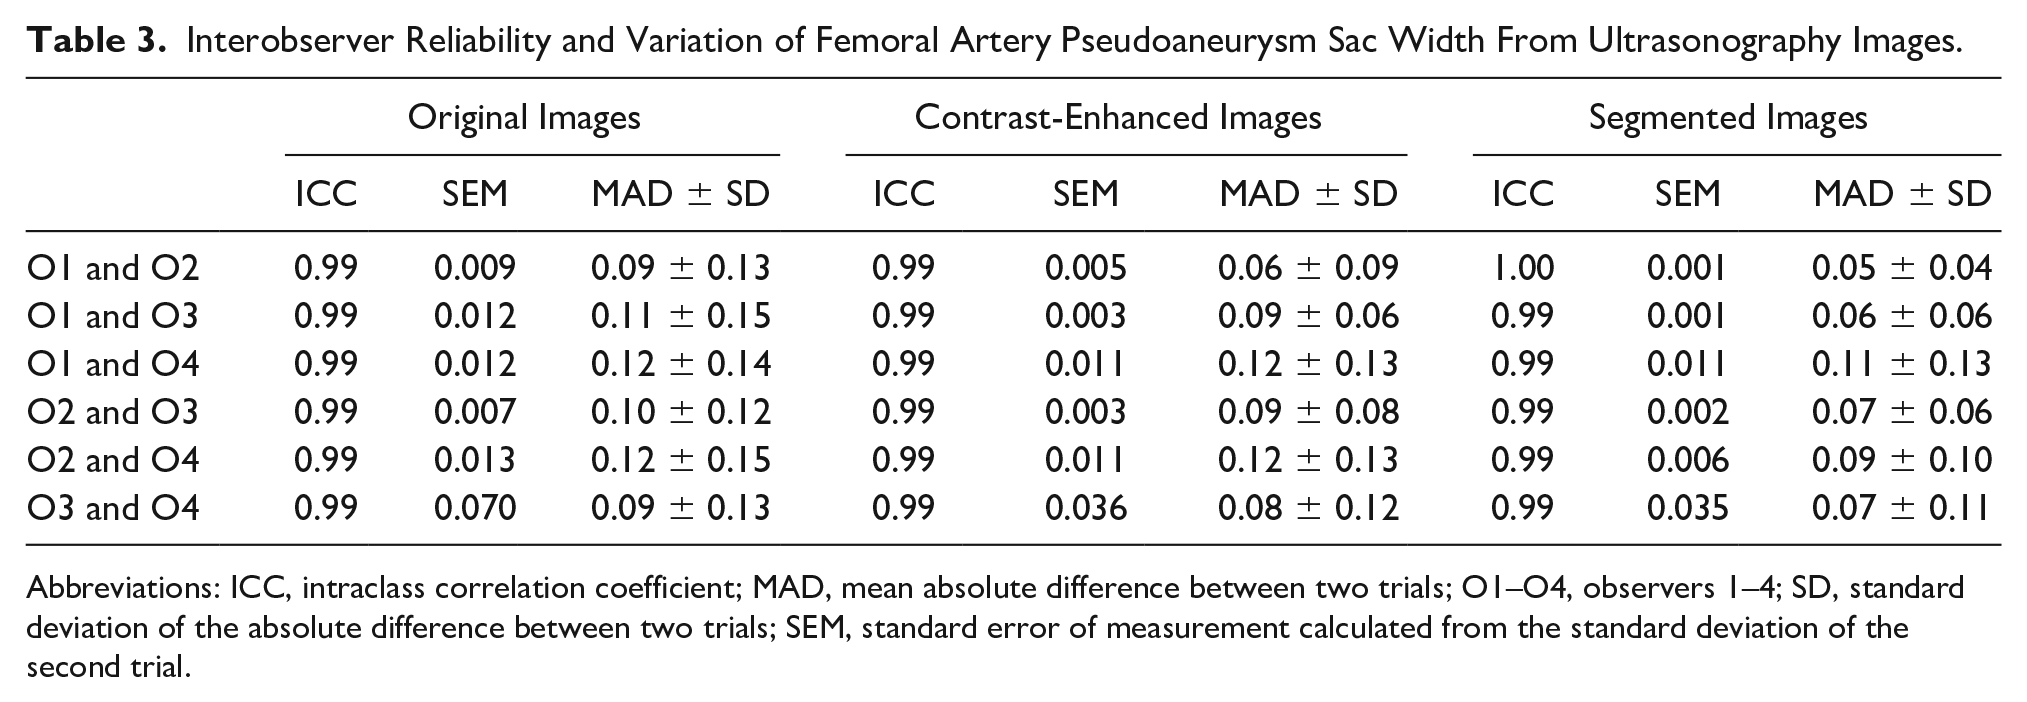
Abbreviations: ICC, intraclass correlation coefficient; MAD, mean absolute difference between two trials; O1–O4, observers 1–4; SD, standard deviation of the absolute difference between two trials; SEM, standard error of measurement calculated from the standard deviation of the second trial.
Interobserver Reliability and Variation of Femoral Artery Pseudoaneurysm Neck Width From Ultrasonography Images.
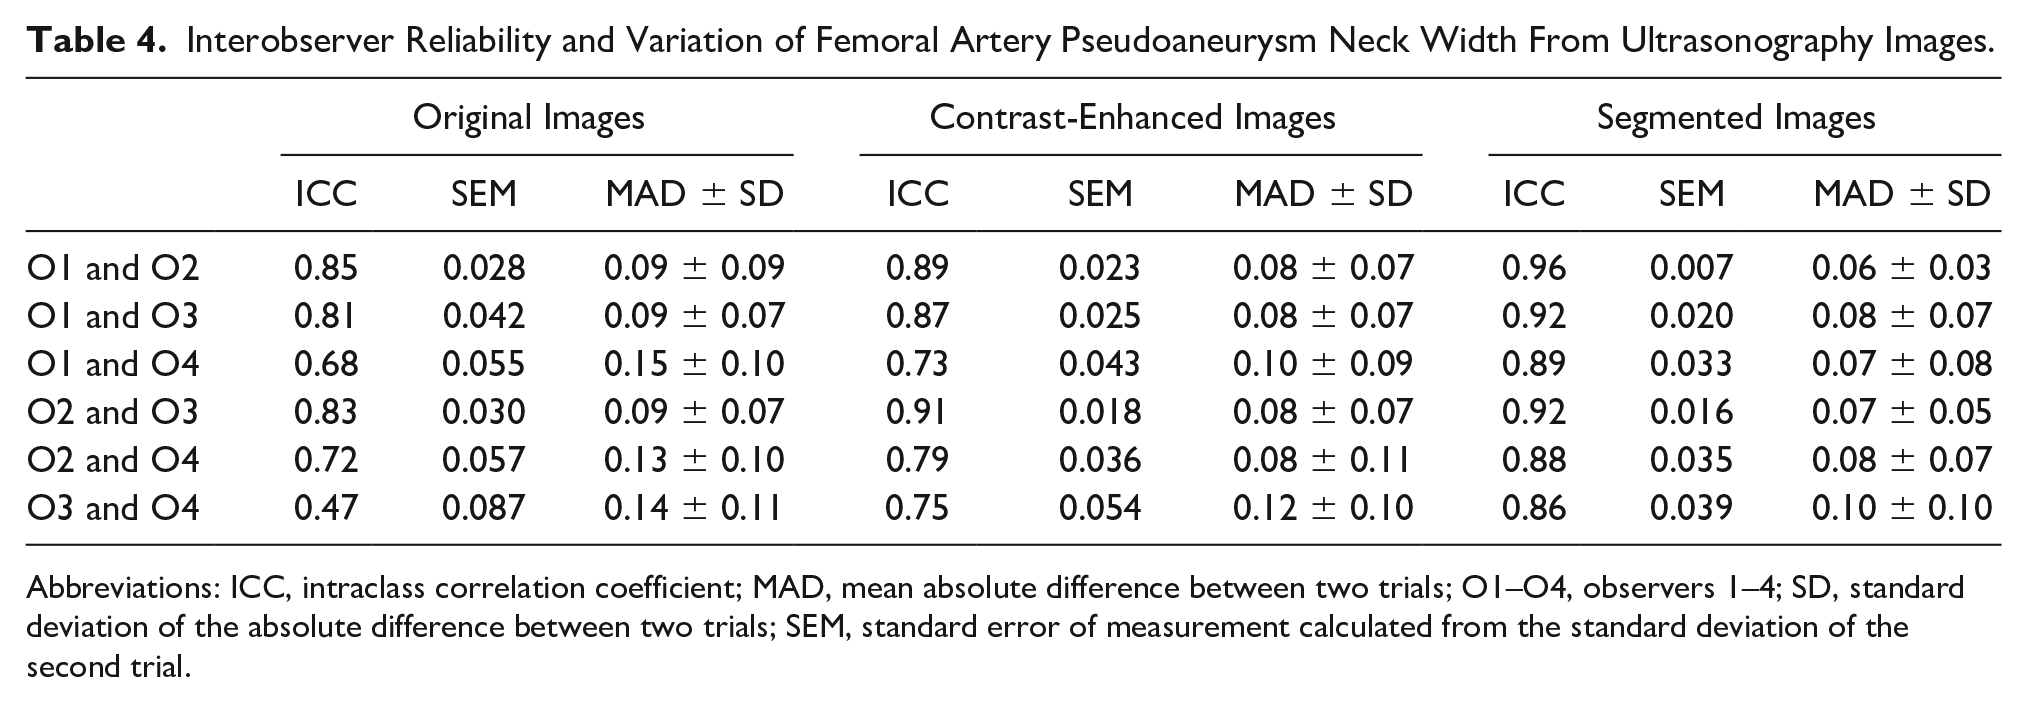
Abbreviations: ICC, intraclass correlation coefficient; MAD, mean absolute difference between two trials; O1–O4, observers 1–4; SD, standard deviation of the absolute difference between two trials; SEM, standard error of measurement calculated from the standard deviation of the second trial.
Interobserver Reliability and Variation of Femoral Artery Pseudoaneurysm Neck Length From Ultrasonography Images.
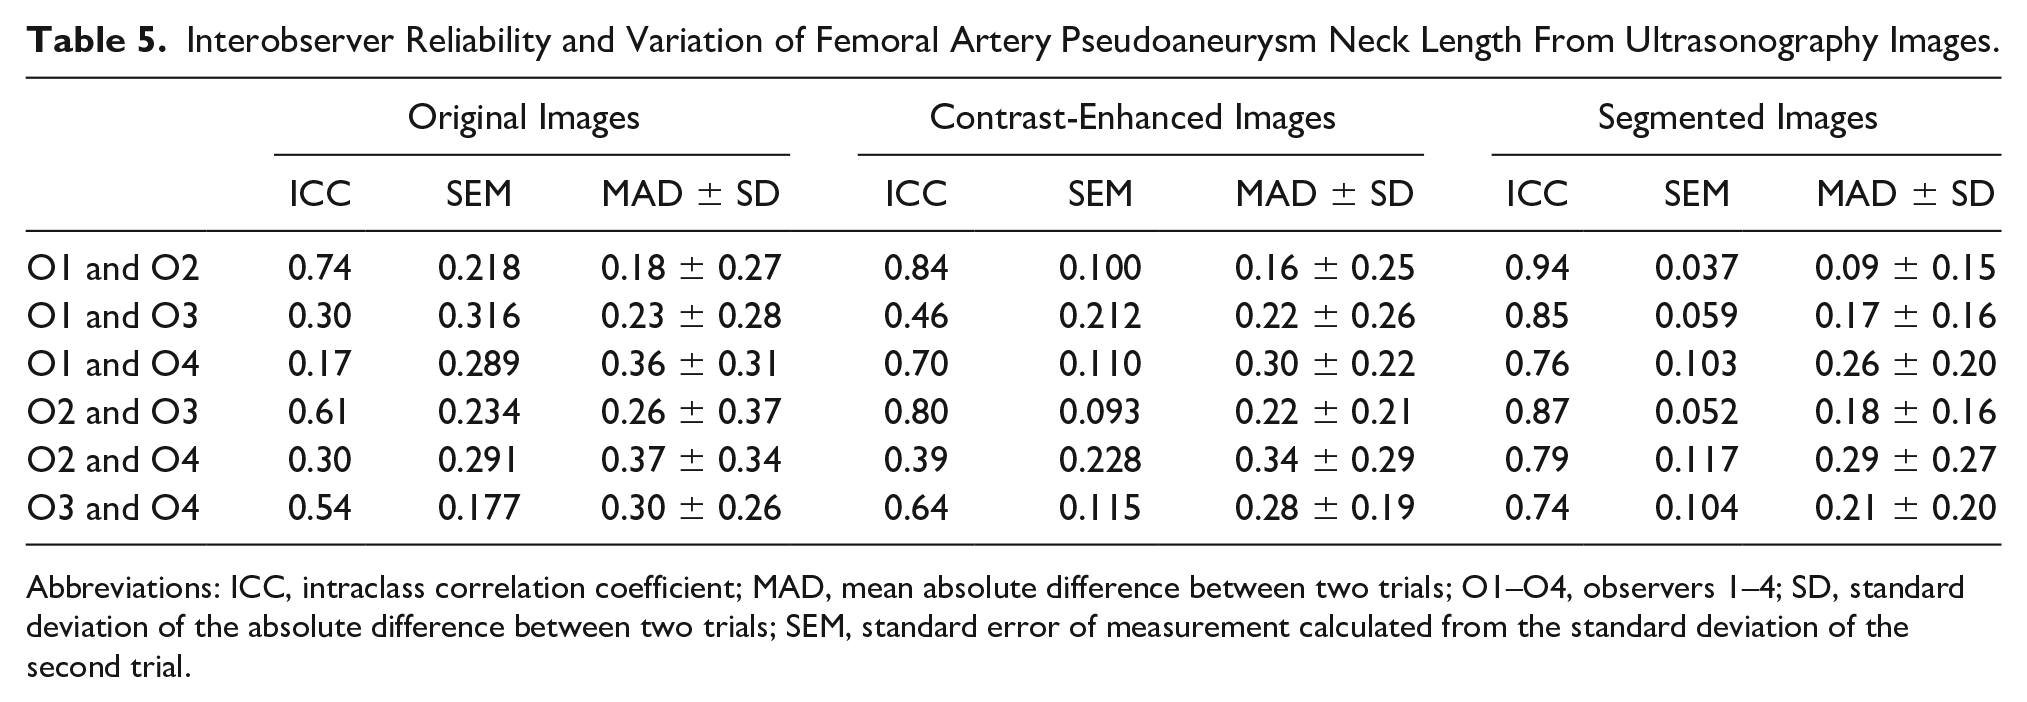
Abbreviations: ICC, intraclass correlation coefficient; MAD, mean absolute difference between two trials; O1–O4, observers 1–4; SD, standard deviation of the absolute difference between two trials; SEM, standard error of measurement calculated from the standard deviation of the second trial.
Figures 4 to 6 show Bland-Altman plots of the agreement between the novice observers and between the expert observers for FAP sac width, FAP neck width, and length measurements acquired from pre- and postprocessed US images. The Bland-Altman analysis demonstrated wider limits of agreements among the novice observers for all quantitative measurements as compared with the expert observers. However, limits of agreements narrowed between the novice observers and between the expert observers for all quantitative measurements acquired from postprocessed US images. In addition, almost all the measurements clustered around the central lines, showing good agreement and no systematic bias except for a few outliers, indicating low discrepancy between the mean difference and limits of agreement.
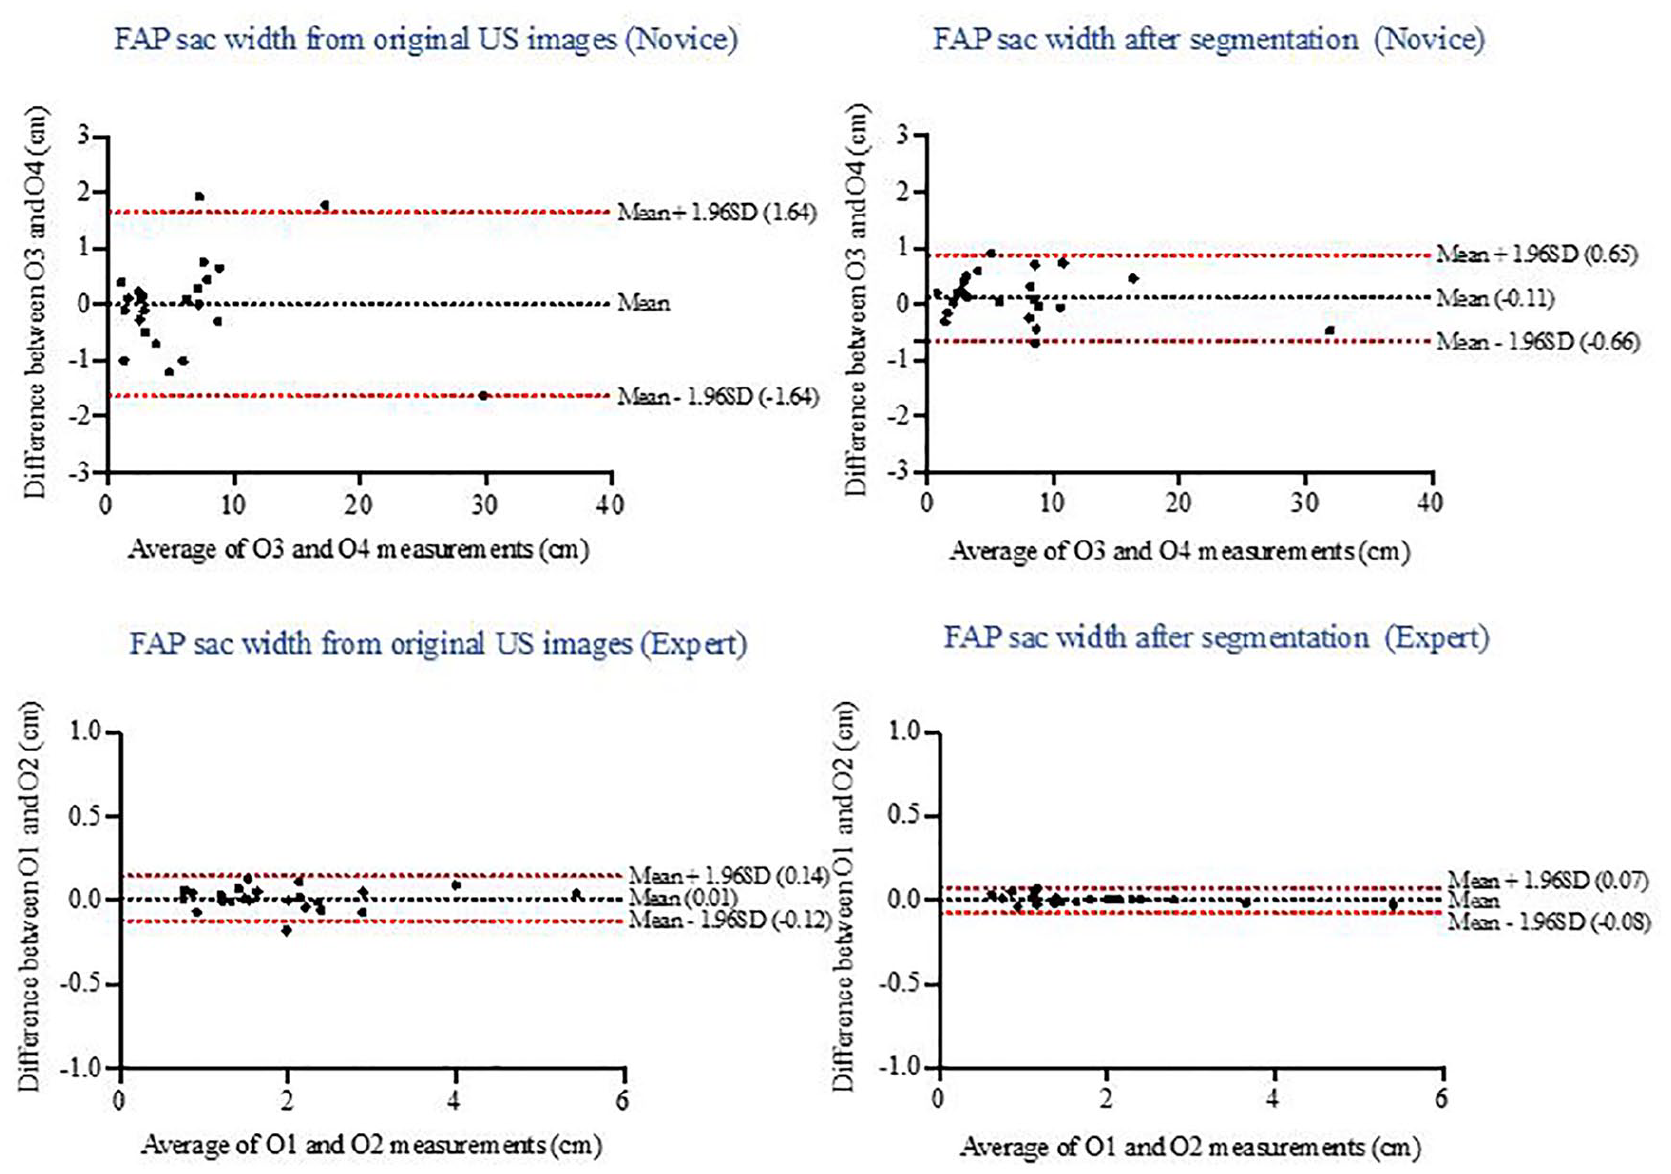
Bland-Altman plot of the agreement between novice and between expert observers for femoral artery pseudoaneurysm (FAP) sac width measurements acquired from pre- and postprocessed ultrasonographic (US) images.
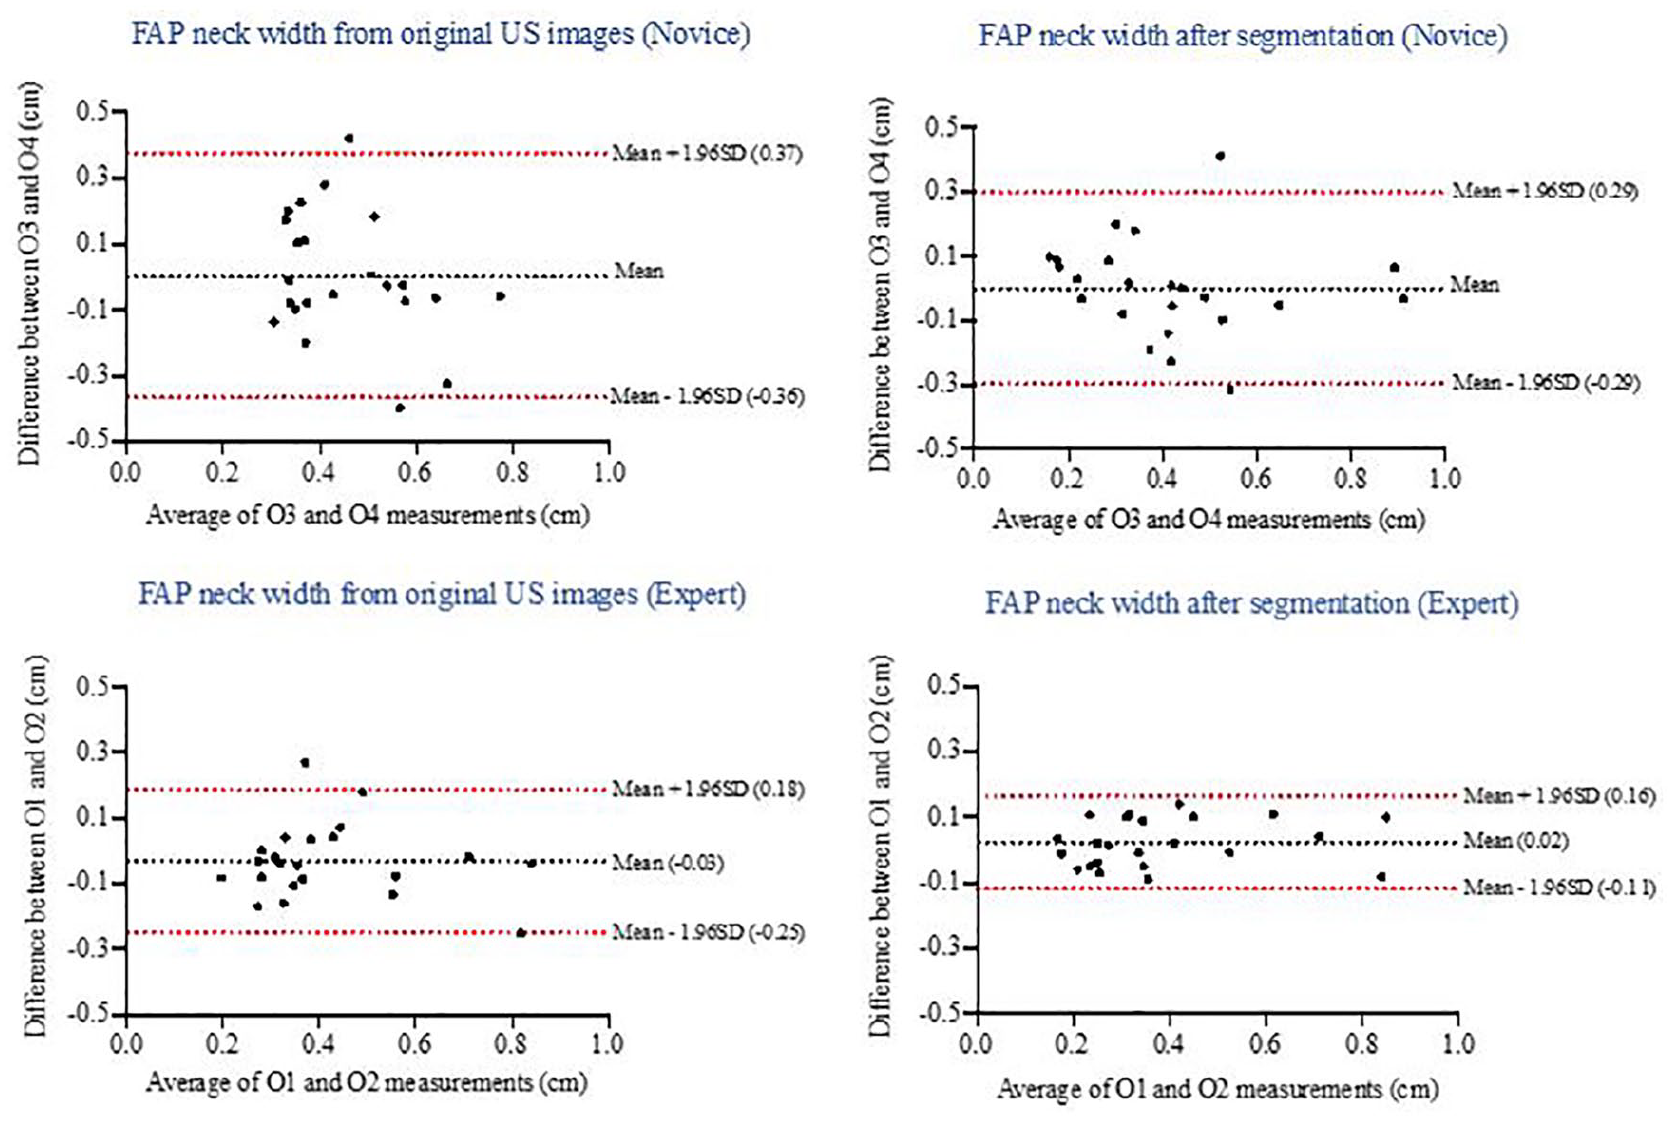
Bland-Altman plot of the agreement between novice and between expert observers for femoral artery pseudoaneurysm (FAP) neck width measurements acquired from pre- and postprocessed ultrasonographic (US) images.
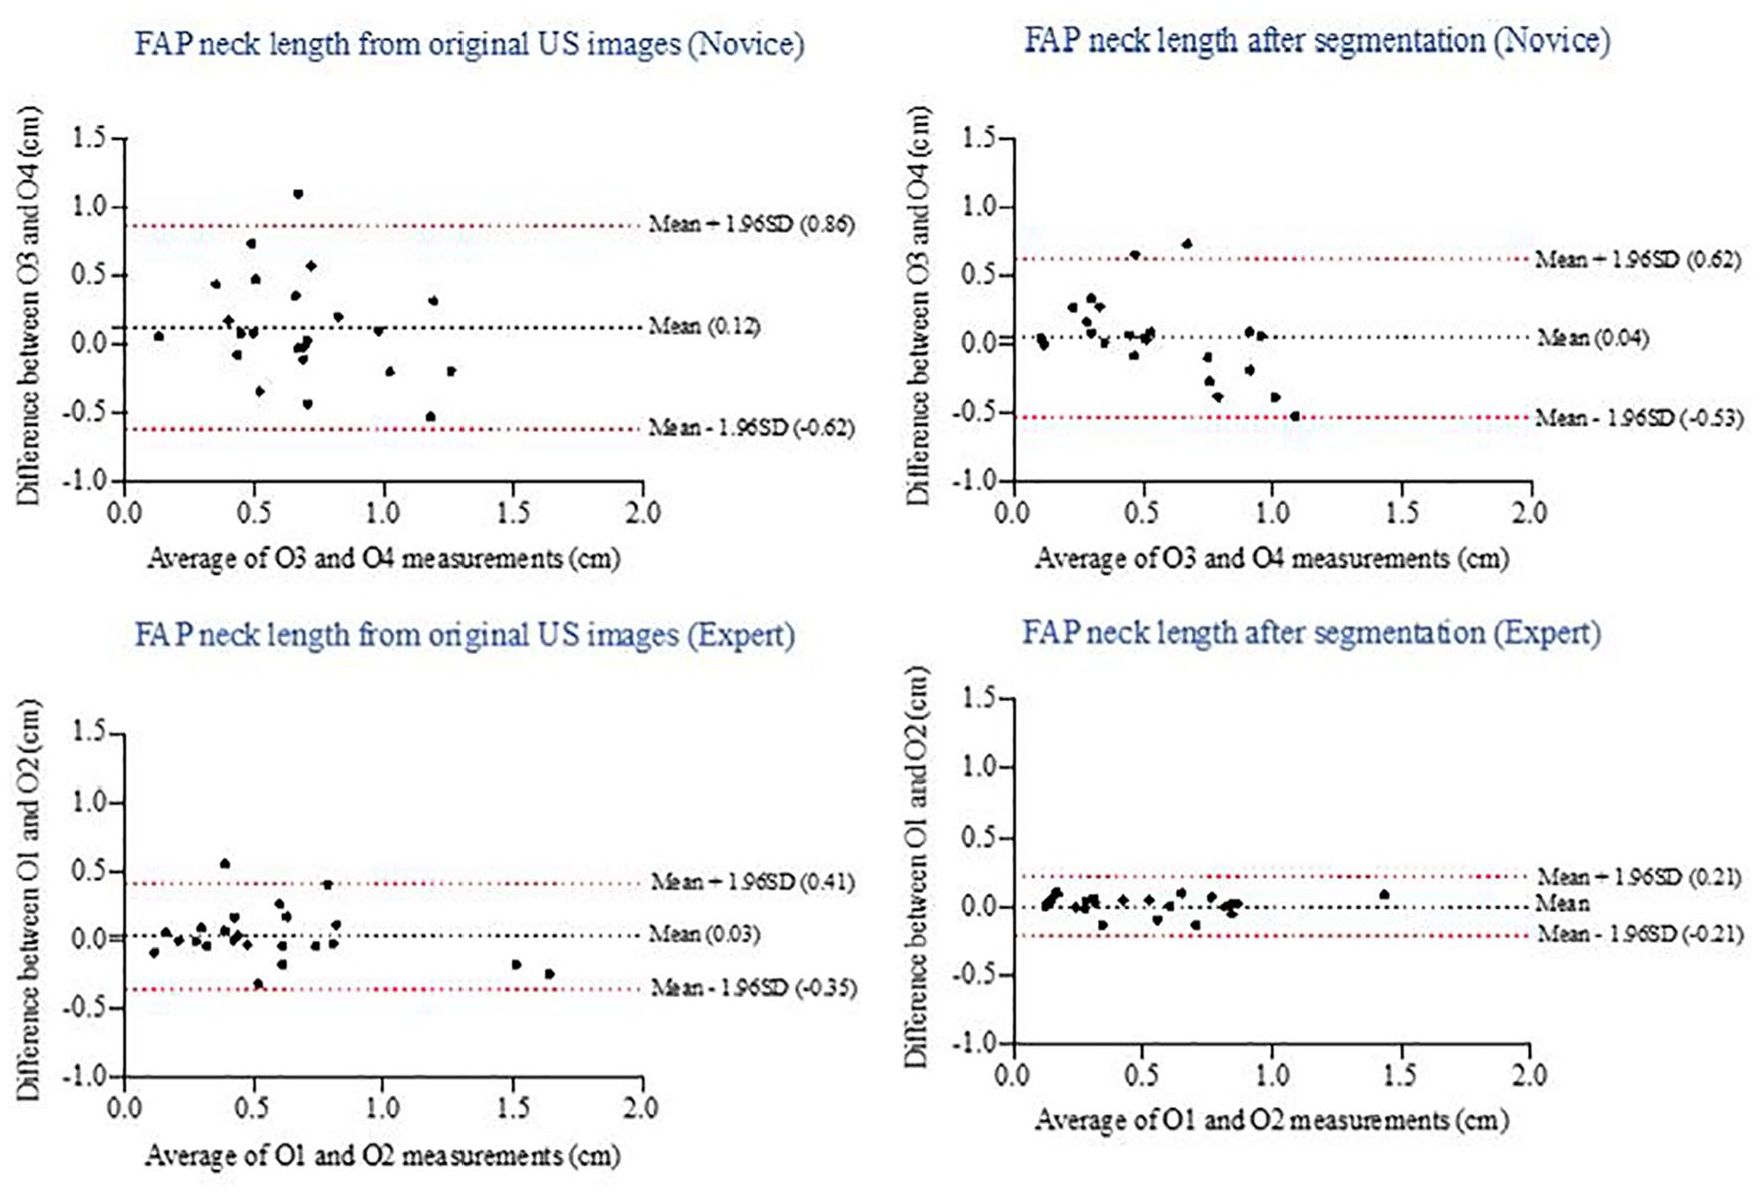
Bland-Altman plot of the agreement between novice and between expert observers for femoral artery pseudoaneurysm (FAP) neck length measurements acquired from pre- and postprocessed ultrasonographic (US) images.
Discussion
In this study, a group of participants quantified intra- and interobserver reliability and variability in measuring FAP sac width, neck width, and neck length from gray-scale US images acquired from a hospital database in Saudi Arabia. This was compared with the results for the measurements obtained from postprocessed contrast-enhanced and segmented US images. In addition, an attempt was made to assess the impact of image processing on the results of the FAP measurements taken by expert and novice observers from original, postprocessed contrast-enhanced, and segmented US images. The overall purpose of this study was to compare the results with those obtained from a hospital database in the United States. 22
In terms of the average values for intra- and interobserver ICCs of the FAP sac width from original gray-scale US images, this study yielded similar results (0.99 and 0.99) to a previous publication (0.98 and 0.96, respectively). 22 This study verified that all FAP measurements required for treatment options were more accurate in locating the FAP body and sac width as compared with the original B-mode US images. Because treatment options depend on FAP sac width, obtaining measurements with high reliability is required. However, it is also important to report the variability of repeated measures of FAP body width because most FAPs, which are <2 cm in width, are followed expectantly with serial US. This study showed that the average intra- and interobserver variability for FAP sac width (0.08 and 0.22, respectively) were the lowest among the measurements from preprocessed US images. As compared with previous study values, 22 in which the average variability of repeated measures of FAP sac width decreased by 21% in contrast-enhanced images and by 35% in segmented images, this study showed comparable results: the average variability decreased by 18% in contrast-enhanced images and by 41% in segmented images as compared with the original images.
In addition, when compared with the previous study results for FAP neck width, this study showed similar results: the expert observers had good reliability from the original images, and the novice observers had moderate reliability. More important, for FAP neck length, the expert observers had good reliability from the original images, and the novice observers had poor reliability. This may explain how operator skill, training, and experience directly relate to accuracy in an US examination. As compared with the previous study, 22 in which the percentage increase in average reliability of FAP neck width measurements after contrast enhancement was 4% among trained observers and 18% among novice observers, this study showed that expert observers’ average reliability increased by 3% and that of novice observers increased by 22%. The average reliability increase after image segmentation in the previous study was 5% for trained observers and 22% for novice observers. This study showed similar results, with an increase of 6% for expert observers and 44% for novice observers. This verified that the impact of image processing is higher for novice observers than for expert observers.
For FAP neck length, expert observers’ average ICC value increased by 2% from contrast-enhanced images and by 10% from segmented images as compared with the original images. In contrast, the average ICC value increased by 60% from the postprocessed contrast-enhanced US images and by 97% from the segmented images for the novice users as compared with the original images. This finding helps to verify the results of the previous study 22 that the usage of image enhancement and segmentation can benefit less experienced sonographers and aid their ability to obtain the required measurements for treatment planning with high reliability and less variability. Overall, the current results demonstrated that image processing helped novice observers more than expert observers in repeating their measurements with less variability. Table 6 provides a comparison of data between Saudi Arabia and the United States on average intraobserver reliability and variation in FAP measurements from original, postprocessed contrast-enhanced, and segmented US images by expert and novice observers. Because US is highly effective in the hands of a trained operator, the use of image processing for early education and practice of novice operators is a priority that will ultimately align with increases in the level of US education. Even though the proposed US image processing showed similar results with the previously reported study, with increased novice observer reliability and decreased variability in measuring FAP, the truth measurements are unknown. Therefore, appropriate evaluation of segmentation algorithms is needed in gaining acceptance in clinical practice or in comparing different algorithms. 30
A Comparison Between NG and GWU Data of Average Intraobserver Reliability and Variation of Femoral Artery Pseudoaneurysm Measurements From Ultrasonography by Expert/Trained and Novice Observers.
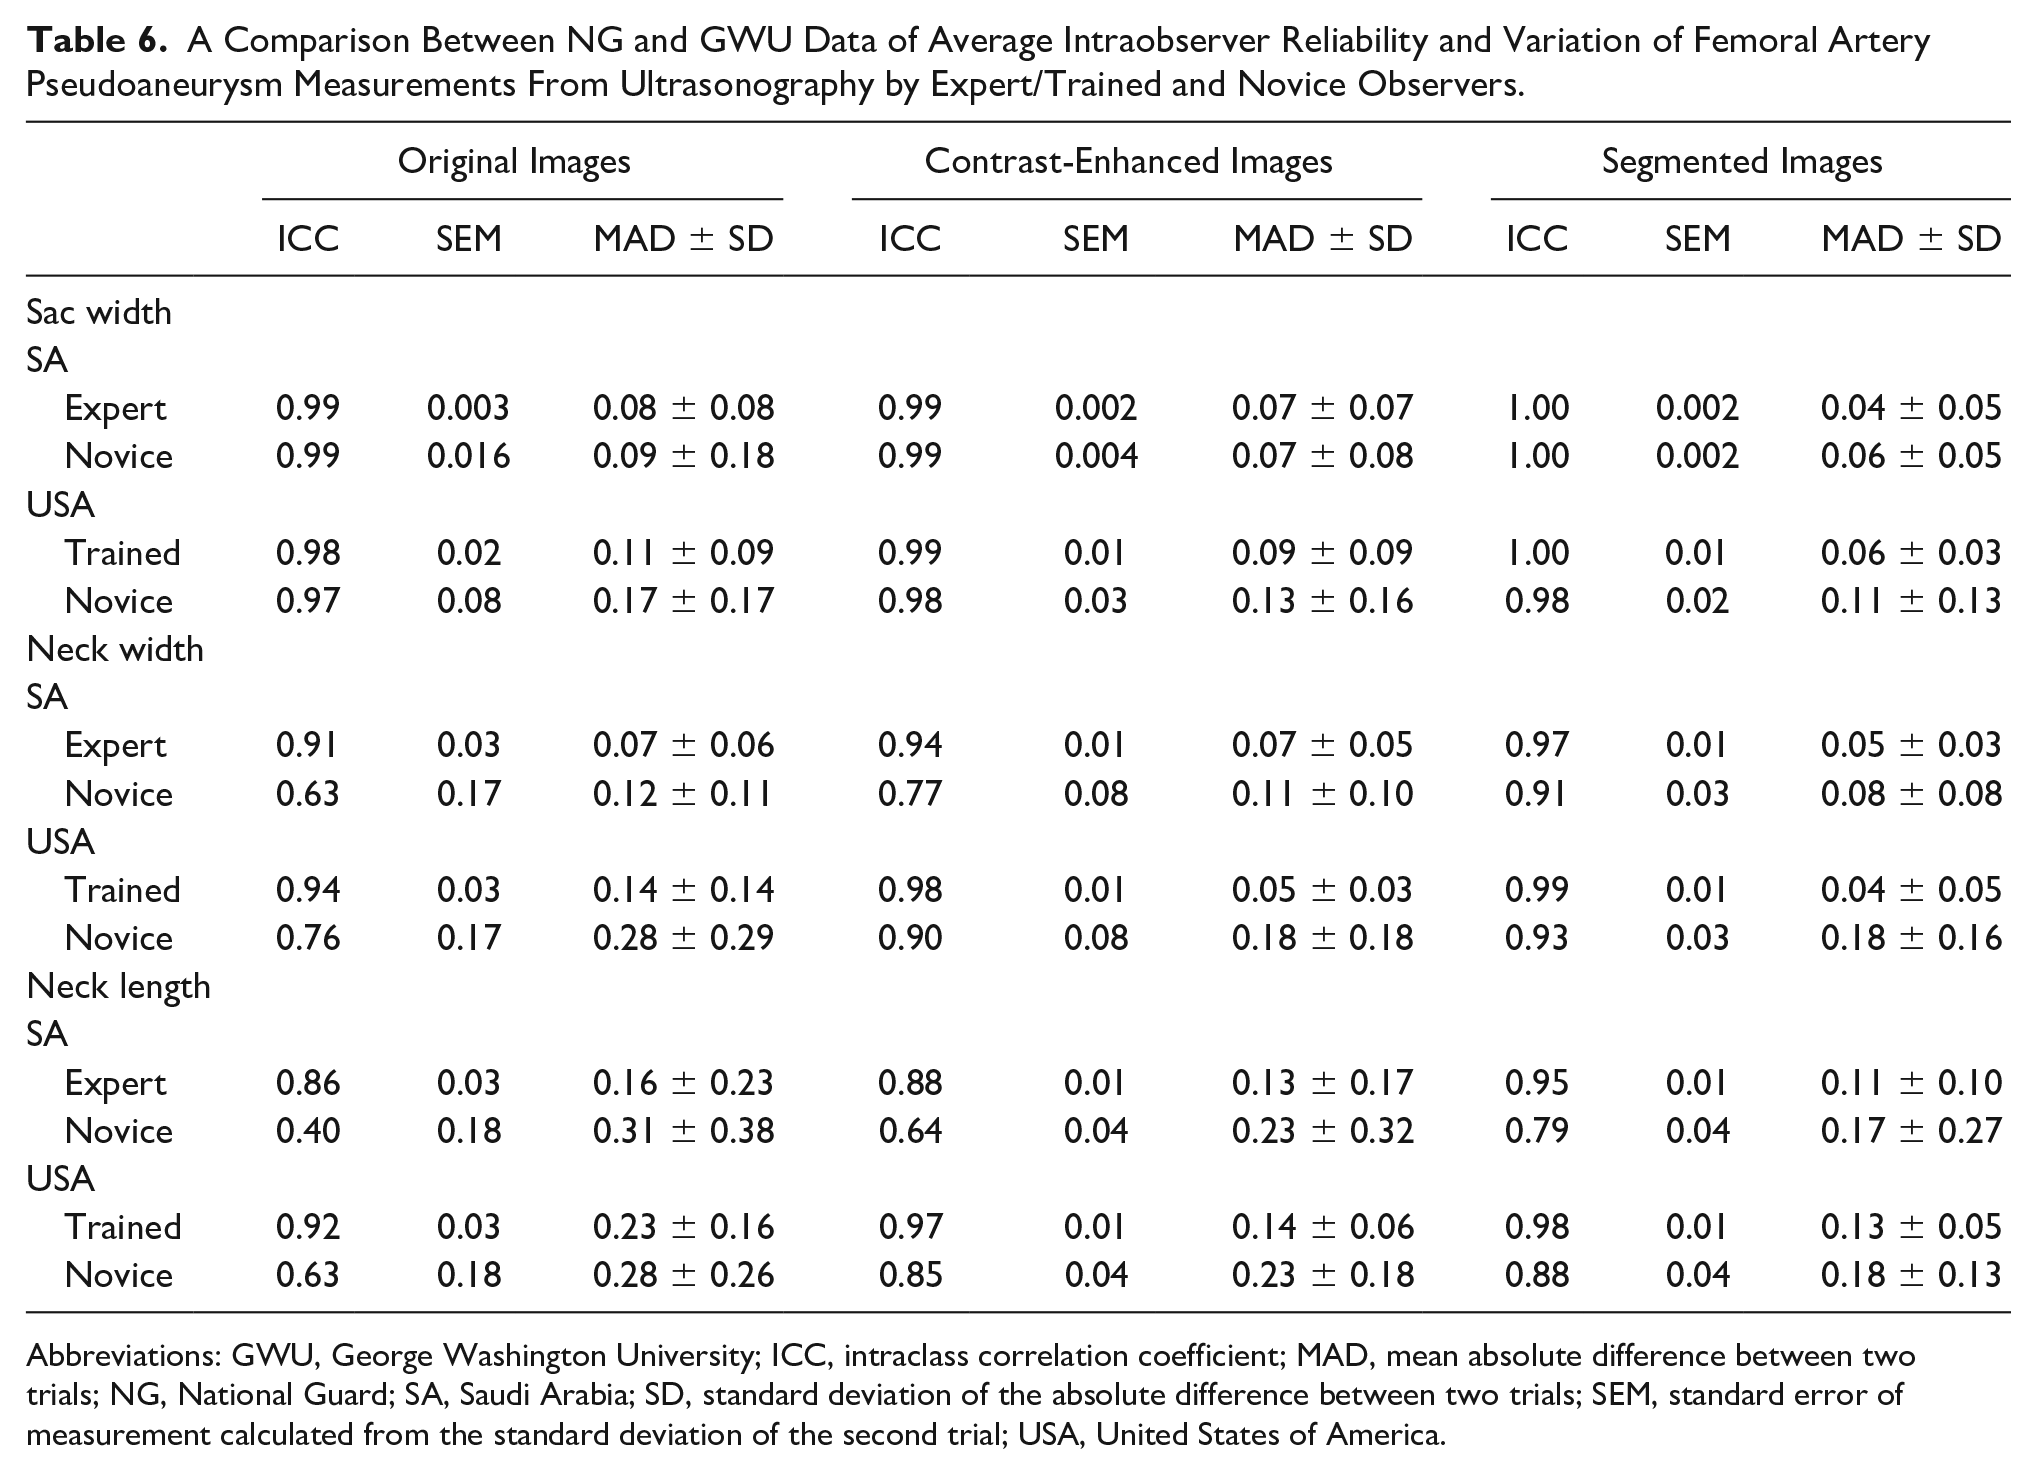
Abbreviations: GWU, George Washington University; ICC, intraclass correlation coefficient; MAD, mean absolute difference between two trials; NG, National Guard; SA, Saudi Arabia; SD, standard deviation of the absolute difference between two trials; SEM, standard error of measurement calculated from the standard deviation of the second trial; USA, United States of America.
Conclusion
Similar to the results of the previous study, the intra- and interobserver reliability for sac width, neck width, and length measurements increased after enhancement of the contrast in gray-scale US images as well as segmentation of the FAP area from the image background for expert and novice observers. In addition, because the impact of image processing is higher for novice observers than for expert observers, image processing can be used in early education and practice for the former.
Footnotes
Authors’ Note
Dr. Mohammed Almatrafi is currently affiliated with Umm Al-Qura University, Electronic, and Communication Engineering Department. Dr. Almatrafi’s current email address is
Declaration of Conflicting Interests
The authors declared no potential conflicts of interest with respect to the research, authorship, and/or publication of this article.
Funding
The authors disclosed receipt of the following financial support for the research, authorship, and/or publication of this article: This work was supported by Saudi Arabian Cultural Mission and King Saud bin Abdulaziz University for Health Science in Jeddah, Saudi Arabia.