
Abstract
The purpose of this study was to assess the correlation between hepatocellular carcinoma (HCC) and surrounding liver parenchyma stiffness using point shear wave elastography (pSWE). HCC was diagnosed using the criteria of the American Association for the Study of Liver Diseases. Liver fibrosis was classified into three groups (nonsignificant fibrosis, significant fibrosis, and cirrhosis). pSWE was performed on the HCC and the adjacent hepatic parenchyma and was expressed as kilopascal (kPa). A total of 59 HCC patients with 64 tumors were included in the study. The mean stiffnesses of HCC and liver background were 9.25 ± 3.76 and 10.84 ± 4.81 kPa, respectively. There was no statistical significance in HCC stiffness in any stage of liver fibrosis. Low HCC/liver background stiffness ratio was noted in the cirrhotic group and statistically significant in two comparison groups (cirrhosis vs significant fibrosis and cirrhosis vs nonsignificant fibrosis), with P < .001. In this cohort, HCC stiffness alone demonstrated no statistically significant difference in various stages of liver fibrosis.
Hepatocellular carcinoma (HCC) is the sixth most common tumor and the third most common cause of cancer mortality in the general population. 1 There are increasing numbers of patients with HCC who can now undergo successful treatment with newer antiviral drugs, especially in cases of advanced liver fibrosis and cirrhosis. 1 Fibrosis in late cases of cirrhosis will not respond to antiviral treatment, while fibrosis in the earlier stage of liver fibrosis has a significant chance of regression with antiviral treatment. 1 This is why early sonographic detection of a small HCC and the determination of liver fibrosis is important. The American Association for the Study of Liver Diseases (AASLD) recommends sonography for HCC surveillance at 6-month intervals in cirrhotic patients. 2 It is recommended for HCC surveillance because of its lack of ionizing radiation, lower cost, and greater availability when compared with other imaging modalities, such as computed tomography (CT) and magnetic resonance imaging (MRI).1,2
Conventional sonography provides morphologic information regarding the liver parenchyma. Sonographic elastography provides information on the mechanical property (stiffness) of the tissue. Tissues of various types have a different stiffness or elasticity. Normal tissue is softer than pathologic tissue, such as liver fibrosis or a focal liver lesion such as HCC. There are technologies that can measure this mechanical property of the tissue, and transient elastography (TE) was the first to be used for this purpose. However, TE does not provide an image, is limited in case of ascites, and cannot be used to evaluate a focal lesion. 3 Magnetic resonance elastography is the best technique, 4 but its use is limited based on availability. Conversely, sonography is more widely available in general clinical practice. Point shear wave elastography (pSWE) is a sonographic technique that can be used to evaluate liver tissue. It generates shear waves at a specific point in the tissue and uses the velocity of the wave to determine tissue stiffness. It provides an image that allows placement of the region of interest (ROI) in the liver or in the focal liver lesion. pSWE has demonstrated that it is a good technique that is reproducible in evaluating the liver and is not limited by ascites. Sonographic elastography has been used to study diffuse liver parenchyma, especially in cases of liver fibrosis.5,6 More recently, it has been applied to the evaluation of the stiffness of focal liver lesions, including HCC.7–14 The value of HCC stiffness may be in providing added information in HCC surveillance. Because there are different forms of sonographic elastography, 3 the value of each method is different. However, the results of each method used to evaluate liver fibrosis and focal liver lesions should yield similar results.
There are only a few articles reporting on the value of pSWE in HCC. Some of these have conflicting results regarding the correlation of stiffness between HCC and the surrounding liver parenchyma. The purpose of this study was to investigate the correlation between the HCC stiffness and the stiffness of the surrounding liver parenchyma by pSWE and to identify the mean value of HCC stiffness.
Methods
Patients
Institutional Review Board approval for this prospective study was obtained. All patients were required to provide written informed consent before participation in the study. Between September 2014 and October 2015, CT or MRI studies of patients who had just been newly diagnosed with HCC were reviewed. These patients were referred to the university hospital from a variety of geographic and social backgrounds. The clinical reason for these referrals included routine sonographic surveillance for HCC, routine follow-up of liver nodules by MRI in livers with various degrees of fibrosis, patients with elevated α-fetoprotein and abnormal liver function tests, and those being evaluated for malignancy. Inclusion criteria included patients who were undergoing initial evaluation for first transarterial chemoembolization or percutaneous tumor ablation. The diagnosis of HCC was based on the AASLD guideline (tumor ⩾1 cm with hypervascularity on the arterial phase and washout on the portal venous or delayed phase). All participants had not received any prior treatment of their HCC (i.e., percutaneous ethanol injection, radiofrequency ablation, transarterial chemoembolization). All participants had to fast for at least 4 hours before the examination. Exclusion criteria included HCC that was located deeper than 8 cm from the skin (which was estimated from CT or MRI study) because the maximal depth of ROI for pSWE is 8 cm. Any obese patient who met inclusion criteria but failed pSWE was excluded from the study. A total of 59 participants were included in the final study cohort.
B-Mode Sonography Examination
Sonography was performed with an iU22 ultrasound system (Royal Philips Electronics, Eindhoven, the Netherlands) equipped with an ElastPQ feature for elastography. A convex transducer C5-1 (1–5 MHz) was used. Gray-scale imaging was used to locate the liver parenchyma and tumor location before the ElastPQ examination. A radiologist with 18 years of clinical experience in the use of sonography performed each study.
ElastPQ Examination
ElastPQ was done immediately after the gray-scale sonographic examination, and an intercostal scanning approach was used. An ROI box was placed in the tumor, excluding areas of necrosis in larger tumors, and also in a vessel-free area of the adjacent liver parenchyma. The depth of the ROI box in the liver did not exceed 8 cm from the probe on the skin surface (Figures 1 and 2). The size of the ROI box was depth dependent, with a size of 0.5 cm × 1.5 cm at a depth of 4 cm. The value of the liver stiffness was calculated only within the ROI.
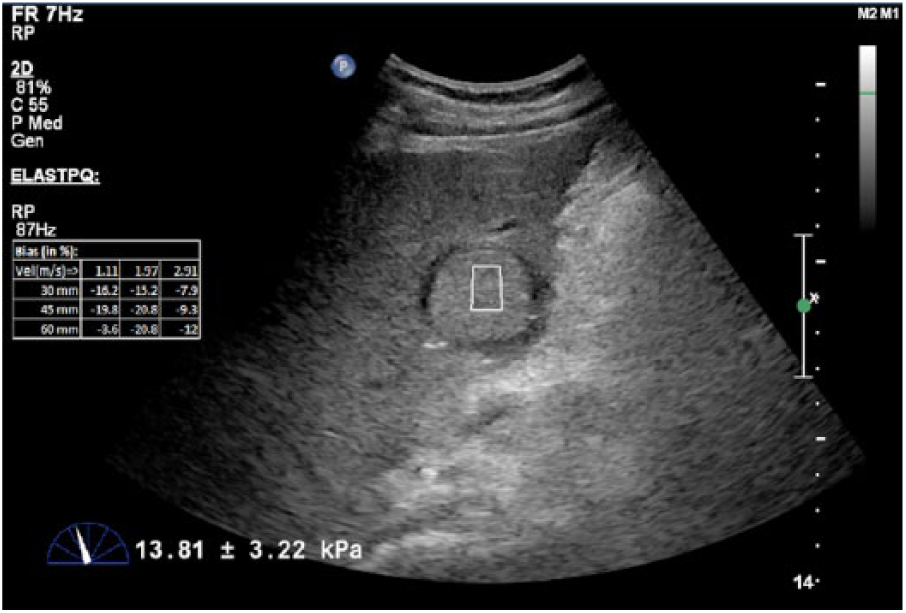
Hepatocellular carcinoma (HCC) stiffness measurement was acquired by placing a region of interest within the HCC. The quantitative value of HCC stiffness was calculated automatically by the ultrasound unit and is shown at the bottom of the image. The measurement was repeated 15 times, and the average stiffness value was automatically calculated.
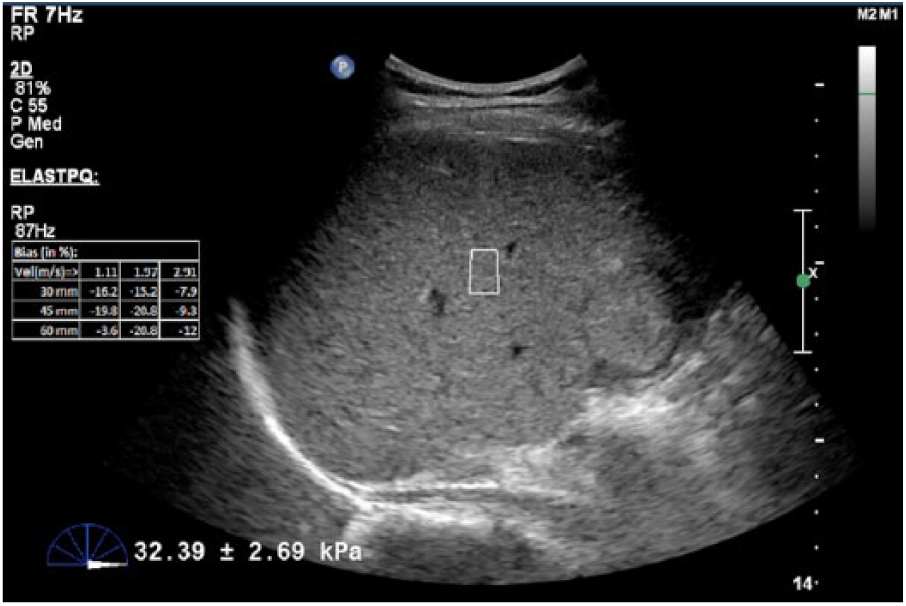
The stiffness of the background liver measurement was completed by placing the region of interest in the same hepatic lobe where the hepatocellular carcinoma (HCC) was located. The quantitative value of liver background stiffness was automatically calculated by the ultrasound unit and is shown at the bottom of the image. The measurement was repeated 15 times in each area, and the average stiffness value was automatically calculated.
ElastPQ measurements were repeated 15 times on each HCC and 15 times on different regions of surrounding liver parenchyma in the same hepatic lobe. Participants held their breath for approximately 4 seconds during each measurement. The average value of stiffness was automatically calculated by the ultrasound unit in kilopascal (kPa).
There were 59 patients with 64 tumors in the study group, and 5 patients had 2 tumors. Tumors were classified into three groups according to liver fibrosis staging based on the study of Ferraioli et al. 15 in this cohort, the groups were segregated by five tumors with nonsignificant fibrosis (less than 5.7 kPa), 11 tumors with significant fibrosis (5.7–7.19 kPa), and 48 tumors with cirrhotic livers (more than 7.2 kPa; Figure 3).
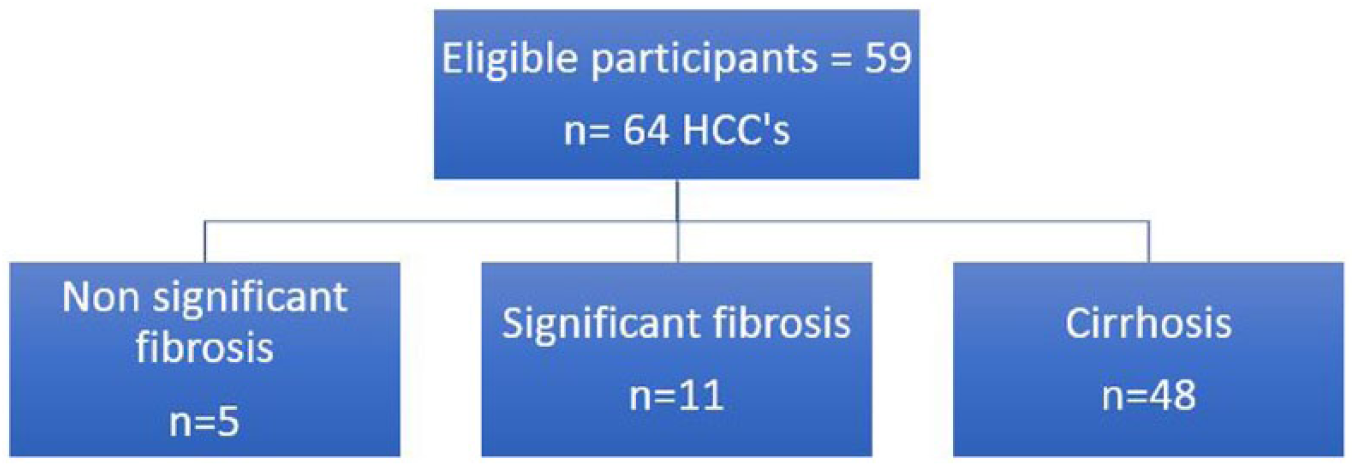
Flowchart of the participants in the study.
Statistical Analysis
The mean and standard deviation of stiffness for each HCC and its surrounding liver parenchyma were calculated. The HCC/liver background stiffness (HBS) ratio was calculated by dividing the stiffness of HCC by that of surrounding liver parenchyma.
A one-way analysis of variance (ANOVA) was used to determine whether the stiffnesses of the HCCs and the HBS ratio were different across the various groups of liver fibrosis. Data are expressed as mean ± standard deviation. A Tukey post hoc test was used to determine the stiffness of the HCCs and the HCC/liver background stiffness in each comparison group.
All statistical analysis was performed by using STATA/MP version 14 (StataCorp LP).
Results
Participants
A total of 59 participants who met the inclusion criteria were identified: 43 were male and 16 were female, with a mean age of 60 years. The causes of their associated liver disease were HBV infection (42%), idiopathic (22%), HCV infection (19%), alcohol (7%), HCV infection and alcohol (5%), and HCV and HBV co-infection (5%).
HCC Characteristics
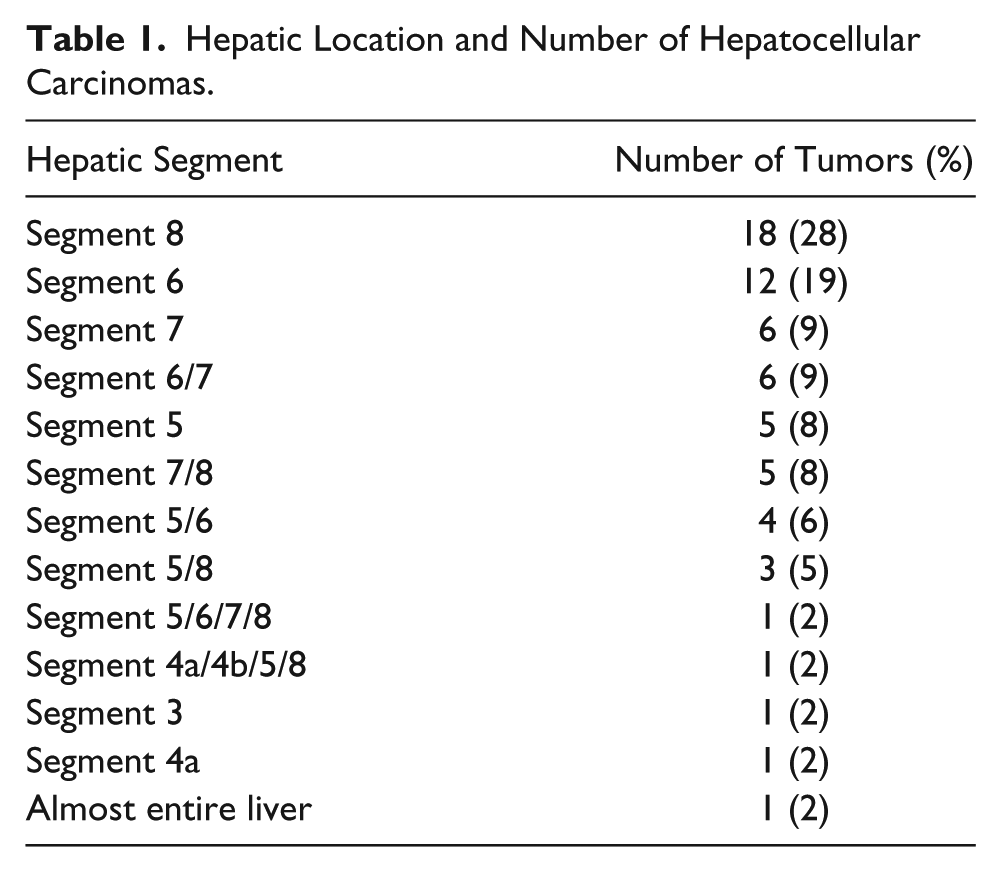
The locations of the HCCs are listed in Table 1. Eighteen (28%) were in hepatic segment 8 and 12 (19%) in hepatic segment 6. There were three large masses; one mass occupied nearly the entire right hepatic lobe, one mass occupied nearly the entire medial segment of left hepatic lobe and the anterior segment of the right hepatic lobe, and the final mass occupied nearly the entire liver parenchyma (Table 1).
Hepatic Location and Number of Hepatocellular Carcinomas.
The mean and standard deviation of the maximal diameter of the HCCs was 6.5 ± 4.3 cm. The minimum diameter of the smallest HCC was 1.3 cm, and the maximum diameter of the largest HCC was 17 cm.
HCC and Surrounding Liver Parenchyma Stiffness
The mean and standard deviation for the stiffness of HCCs was 9.25 ± 3.76 kPa. The mean and standard deviation for the stiffness of the surrounding liver parenchyma was 10.84 ± 4.81 kPa (Table 2). Most of the adjacent liver parenchyma in this study had cirrhosis (n = 48; Figure 3). The Tukey post hoc test used to determine the significant difference between the mean stiffness of the HCCs and the stiffness of the surrounding liver parenchyma showed that there was no statistical significance between the two (P = .115–.978; Figure 4).
Summary of the Mean Stiffness of HCC, the Mean Stiffness of Liver Parenchyma, and the Mean Stiffness of the HCC/Liver Background Ratio Based on the Stage of Liver Fibrosis.
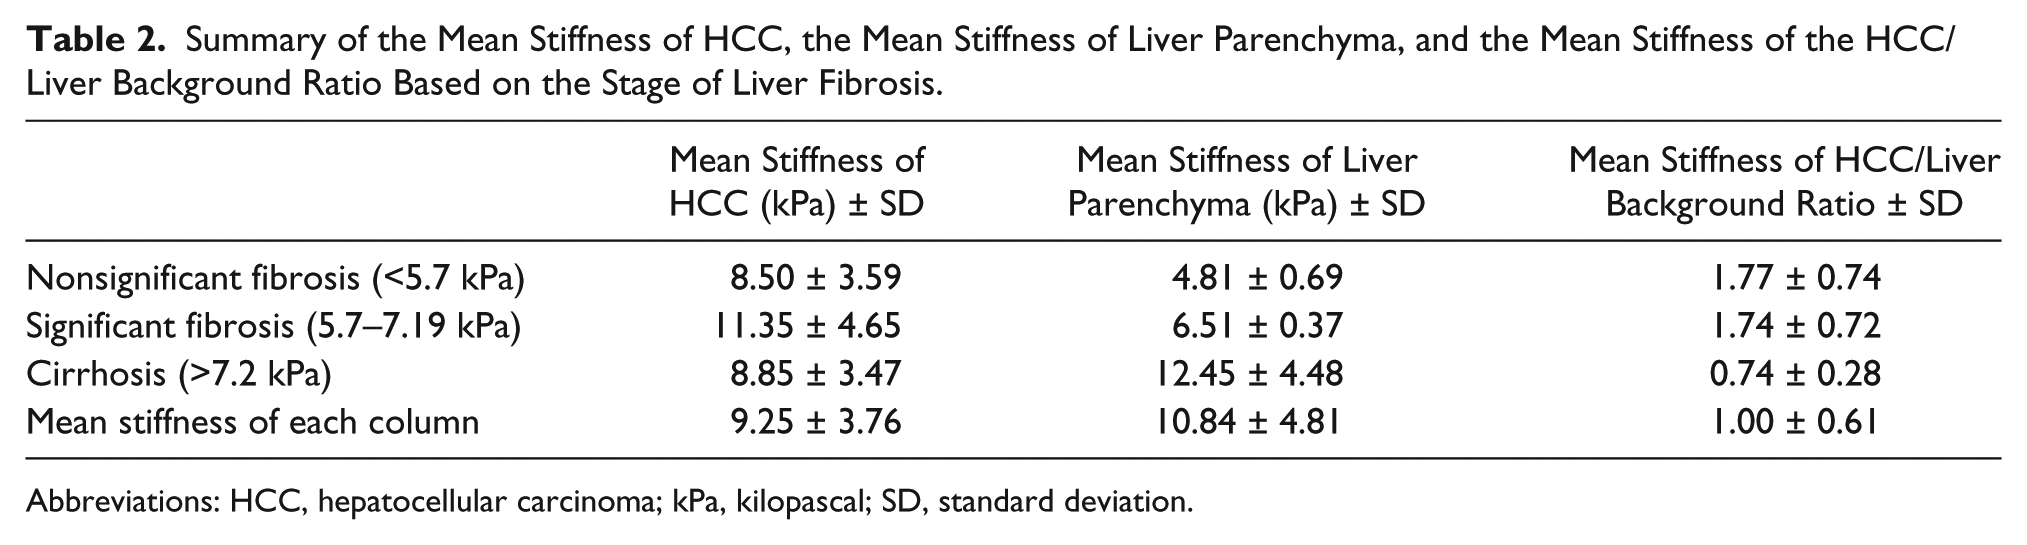
Abbreviations: HCC, hepatocellular carcinoma; kPa, kilopascal; SD, standard deviation.
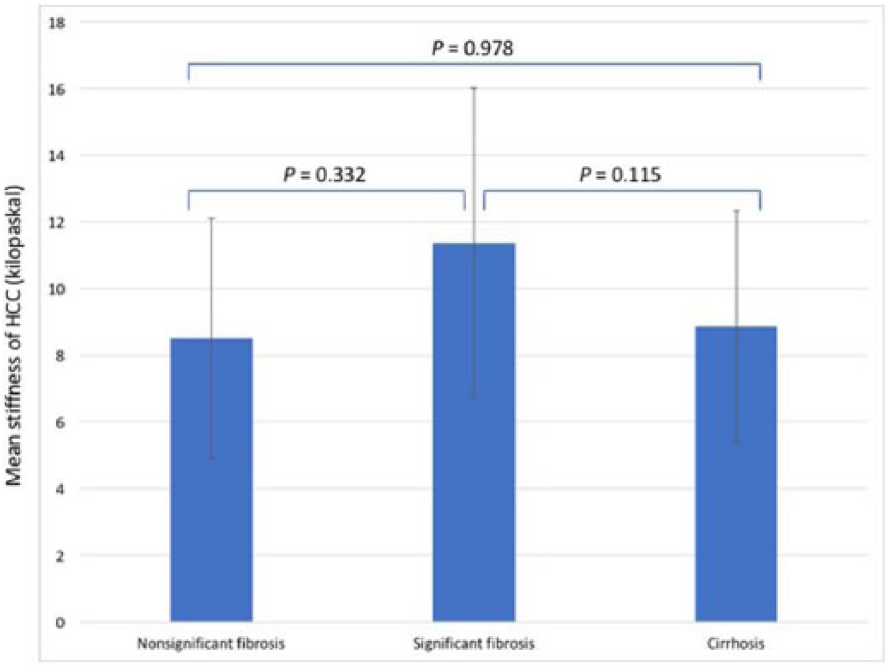
Pairwise comparison of the mean stiffness of hepatocellular carcinoma (HCC) based on the stage of liver fibrosis.
HBS Ratio
The HBS ratio in nonsignificant fibrosis stage and significant fibrosis stage is higher than 1. The HBS ratio in the cirrhotic stage is less than 1. One-way ANOVA testing was performed to examine the differences in HBS ratio across the three different stages of the liver fibrosis, and it showed a statistical significance (P = .000). The Tukey post hoc testing demonstrated a statistically significant differences in HBS ratio between the cirrhotic stage and the significant fibrotic stage (P = .000) and the cirrhotic stage and the nonsignificant fibrotic stage (P = .000). There was no statistically significant difference noted in the HBS ratio between the nonsignificant fibrotic stage and the significant fibrotic stage (P = .994; Figure 5).
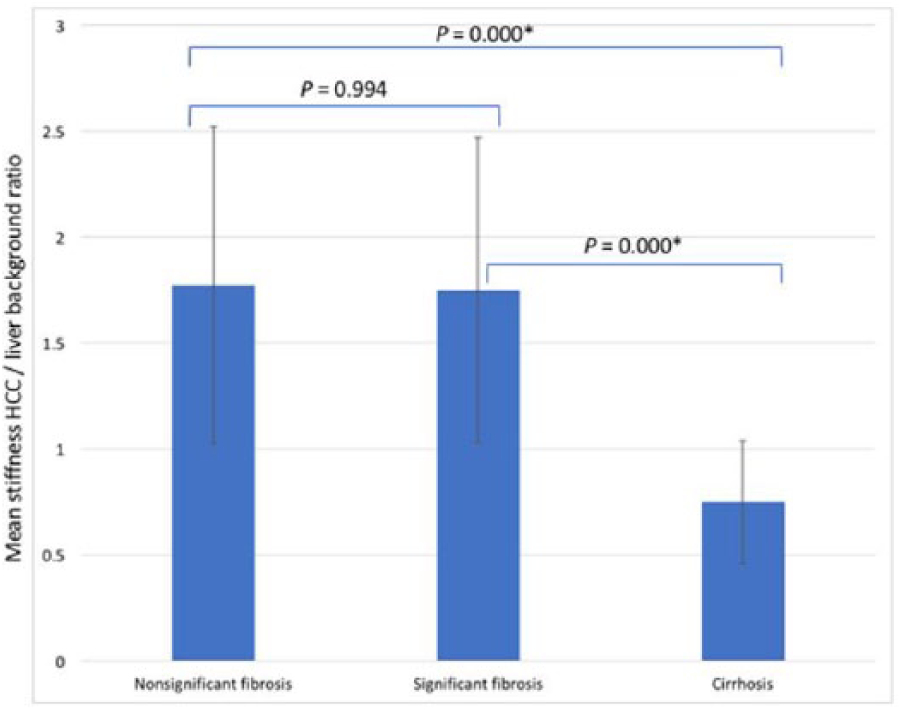
Pairwise comparison of the hepatocellular carcinoma (HCC)/liver background stiffness (HBS) ratio based on the stage of liver fibrosis. *Statistically significant.
Discussion
The mean and standard deviation for stiffness of HCCs in this study was 9.25 ± 3.76 kPa. The value from the present study was different compared with that published by Ling et al., 16 who used the same pSWE technique. Their study showed a mean stiffness of 42 kPa. The differences in values between these two studies may be due to the fact that in the current study, patients fasted before imaging, and the issue of fasting was raised as a concern in the Ling et al. study. Food intake increases mesenteric blood flow and leads to an increase in liver stiffness. In patients with cirrhosis, the effect of increased portal venous pressure has a greater effect on liver stiffness compared with normal liver. 4 The stiffness of HCC as measured by pSWE in this study is compatible with clinical practice, as patients are normally requested to fast prior to an abdominal sonogram. The values in the present study may be helpful to both the sonographer and radiologist when evaluating a focal liver lesion with pSWE in a fibrotic liver.
The stiffness of HCC has also been reported in units of m/s. The range of values reported in the literature are as follows: 1.2, 9 2.17, 10 2.40, 14 2.48, 13 2.63, 11 and 2.66 12 m/s. When these values were converted into kPa using the Young modulus (E = 3[vS2Xρ], where E = the Young modulus, vS = the shear wave speed, and ρ = the density of the tissue in homogeneous isotropic tissues [1 g/mL by assumption]), 5 there was a range of 4.32, 9 14.13, 10 17.28, 14 18.45, 13 20.75, 11 and 21.22 12 kPa. This wide range of HCC stiffness may be due to tumor vascularity 16 and the degree of tumor differentiation. 17
The correlation of the mean stiffness of HCC and the stiffness of the surrounding liver parenchyma has demonstrated a great variance across published studies. Some example studies that have reported the mean stiffness of HCC lower than surrounding liver parenchyma were reviewed. Gallotti et al. 10 reported that the mean stiffnesses of HCC and surrounding liver parenchyma were 2.17 and 2.99 m/s, respectively, while Heide et al. 11 showed values of 2.63 and 2.89 m/s, respectively. Other studies have reported the mean stiffness of HCC as higher than surrounding liver parenchyma. Kim et al. 12 showed that the mean difference in shear wave velocity between HCC and adjacent hepatic parenchyma was 0.35 m/s; Park et al. 13 showed these values to be 2.48 and 2.14 m/s, respectively; and Frulio et al. 14 found values of 2.40 and 2.32 m/s, respectively. Finally, Cho et al. 8 showed that only 24% of the HCCs had a lower stiffness than the surrounding liver parenchyma, and 76% of the HCCs had equal or high stiffness.
To demonstrate the difference between stiffness of HCC and liver background, the current study used a simple quantification of the HCC stiffness relative to the background stiffness by using the HBS ratio. 7 While there was no statistically significant difference between the mean stiffness of the HCC alone compared with each stage of liver fibrosis (Figure 4), the HBS ratio in cirrhosis demonstrated that HCC has a lower stiffness than the liver background. The HBS ratio in cirrhosis is less than 1, which showed that HCC has a lower stiffness than liver background. In contrast, the HBS ratio in the nonsignificant fibrosis and significant fibrosis in this study was higher than 1, suggesting that the HCC has a greater stiffness than liver background, although this was not a statistically significant difference. With a wide range of liver stiffness in patients with a risk of liver fibrosis, care needs to be taken when measuring the stiffness of HCC with the liver background. The HBS ratio could be a useful tool in evaluating patients with a focal liver lesion in the various stages of liver fibrosis.
Limitations
The pre-experimental research design is a definite limitation to this study, with the convenient sample of patients resulting in threats to internal and external validity. Additional limitations can be attributed to the fact that the pSWE technique does not have an adjustable ROI box, and the HCC has to be no deeper than 8 cm from the skin. This would be a limitation in patients with a high body mass index. The skill of the operator also has an impact on the accuracy of the stiffness measurement. Finally, tumor pathology was not available in this study; therefore, the correlation of HCC stiffness and the degree of tumor differentiation was not possible.
Conclusion
The stiffness of HCC is not necessarily lower or higher than the liver background because of the wide range of background stiffness in fibrotic livers. The HBS ratio proposed in this study may be a useful tool when evaluating HCC in the stage of liver cirrhosis, as HCC tends to have stiffness lower than liver cirrhosis.
Footnotes
Acknowledgements
The authors thank Professor Michael C. Hill, MB, Department of Radiology, The George Washington University Hospital, Washington DC, USA, for his assistance in the preparation of this manuscript.
Declaration of Conflicting Interests
The authors declared no potential conflicts of interest with respect to the research, authorship, and/or publication of this article.
Funding
Quality Improvement Fund, King Chulalongkorn Memorial Hospital. Code: 30101-76.