
Abstract
A substantial body of research has shown that Parkinson disease (PD) patients display an enlarged hyperechogenic substantia nigra (SN) by transcranial sonography (TCS). Nonetheless, the categorization of SN echogenicity is still subjective. A method is described to quantify SN echogenicity based on the gray-level histograms of digitized TCS images. In 31 PD patients and 57 controls, the gray-scale mean (GSM) of the SN, mesencephalon, and basal cisterns and their ratios were assessed using image-editing computer software. The GSM values were compared between the groups and correlated with age, SN area, and disease duration. The SN GSM was significantly higher in the PD group (P < .05) with a positive correlation with age but not with disease duration. In this cohort of participants, mesencephalon echogenicity was found to increase with disease duration. These results would suggest quantitatively SN hyperechogenicity in PD. Quantifying SN echogenicity is feasible and might minimize subjectivity in PD diagnosis by TCS. The method has the potential to disclose subtle changes in other midbrain structures’ echogenicity engendered by the disease process as well.
Mesencephalic substantia nigra (SN) echogenicity is an important parameter in the sonographic diagnosis of Parkinson disease (PD) by transcranial sonography (TCS).1,2 Many studies worldwide demonstrated that patients with idiopathic PD display SN hyperechogenicity in 68% to 99% of cases,3 –12 with a positive predictive value of 92.9%. 11 In healthy individuals, the SN is barely distinguishable within the hypoechogenic brainstem as a thin, strip-like echogenic structure. In contrast, most PD patients show a hyperechogenic SN, indicating that the structure has more extended areas of increased brightness.3,13 As signal brightness is difficult to quantify, qualitative or semiquantitative classification of nigral echogenicity has yielded results with only modest accuracy and reproducibility.2,5 To overcome this limitation, investigators suggested a more objective assessment.2,6 By encircling and measuring the area of hyperechogenic signals in the SN region, obtained at the mesencephalic axial plane, a better comparison across observers and studies might be possible.2,5,6 It is unclear whether volume measurements of small echogenic structures will be superior to planimetric measurements. 13
At this time, the planimetric measurement of the SN echogenic area is considered the standard procedure for diagnostic purposes. 2 This sonographic parameter showed good diagnostic accuracy and good interrater reproducibility when obtained by experienced investigators. 5 In addition, a study found a high correlation between visually rated SN echogenicity and planimetrically measured SN area in PD patients. 14 Despite these findings and although SN echogenicity is an important touchstone in the diagnosis of PD by TCS, visually evaluated SN echogenicity is still seen as inaccurate and operator biased.5,13,15 This skepticism prompted exploration of a computer-based analysis of echogenicity in TCS images based on gray-level histograms, as already studied for the liver, 16 carotid plaques, 17 and kidneys.16,18 The objective of this study was to investigate whether this more objective assessment could confirm the enhanced nigral echogenicity of Parkinsonian patients in relation to controls.
Materials and Methods
Study Participants
For this prospective case-control study, participants were consecutively recruited from the Movement Disorders outpatient clinic of a university hospital. Inclusion criteria for patients were a diagnosis of PD for at least 2 years, based on the United Kingdom Brain Bank criteria, 19 and for controls, recruited among caregivers, absence of known neurological disease. Exclusion criteria were previous cerebral neurosurgical procedure or stroke. Individuals without acoustic bone windows to enable the identification of mesencephalic structures were excluded after the examination. The included participants were divided into three groups: group I, Parkinsonian patients; group II, controls 60 years or older (“old controls”); and group III, controls younger than 60 years (“young controls”). Sociodemographic data were obtained from all participants. From PD patients, we registered disease duration and severity as indicated by the Hoehn and Yahr 20 scale. The study was approved by the local ethics committee, and written informed consent was obtained from all participants.
Sonographic Examination
Transcranial sonography was performed bilaterally at the temporal acoustic window by an examiner who was blinded to the patients’ clinical data and study group. The frequency of the phased array probe (Acuson X300; Siemens, Erlangen, Germany), which is required to penetrate the temporal bone, ranged from 1.3 to 2.5 MHz. At these frequencies, the axial resolution in the focal zone of the transducer was approximately 0.7 to 1.0 mm, with a lateral resolution of 3.0 mm and focus zone 4 to 8 cm from the contact plane of the probe. 15 The dynamic range was set to 50 to 55 dB. Tissue harmonic imaging (THI) was used to improve image resolution. Time gain compensation was tailored to minimize the effects of tissue absorption on sound intensity.
The mesencephalic brainstem area was examined on an axial plane, superior and parallel to the orbitomeatal line. The mesencephalon appears as a butterfly-shaped, echo-poor structure (i.e., hypoechogenic) surrounded by the echo-rich (i.e., hyperechogenic) tissue of the basal cisterns (Fig. 1). The image was enlarged three times, and the borders of the SN in the ipsilateral cerebral peduncle were tracked to allow its planimetric measurement. With both sides measured, the largest value for each participant was selected for between-group comparisons. The raw images in tag image file format (TIFF; size, 800 pixel width × 600 pixel height; resolution, 72 pixels/inch) were saved with the built-in software provided on the ultrasound system.
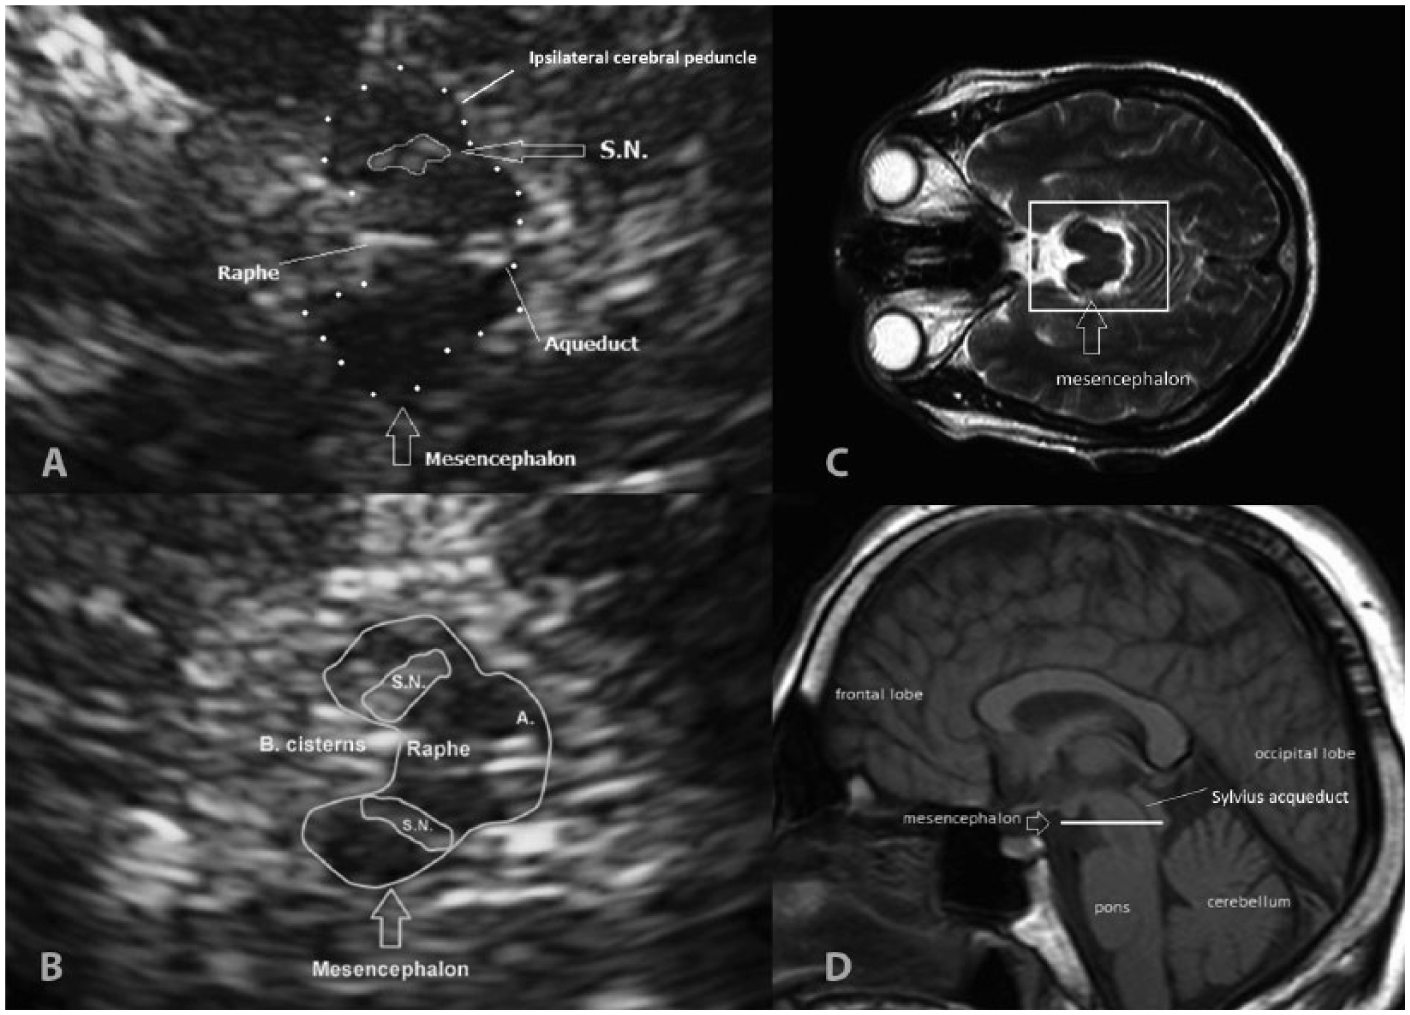
Mesencephalic images on transcranial sonography (TCS) and magnetic resonance (MR). (A, B) TCS midbrain axial section at the orbitomeatal line. At the center of the image, the hypoechoic, butterfly-shaped mesencephalon appears surrounded by the hyperechoic basal cisterns and divided by the hyperechoic raphe line. (A) Healthy participant with normal substantia nigra (SN) (encircled) at the ipsilateral cerebral peduncle. (B) Parkinson disease patient with bilateral enlarged hyperechoic SN encircled. (C, D) Normal MR images. (C) Axial plane at the level of orbits. Within the square, the mesencephalon is highlighted. (D) Sagittal MR image showing the brainstem and the sectional plane of the TCS images (white line). S.N., substantia nigra; A., Sylvius aqueduct.
Computer-Based Analysis
All of the saved images were analyzed using computer software (Photoshop CS2, version 9.0; Adobe, San Jose, California) by the same investigator who performed the original TCS, blinded to the participant status. The software was able to detect the gray-scale value of each pixel within a range of 0 (black) to 255 (white). For each image, the gray-scale mean (GSM) represented the mean gray-tone frequency distribution of the pixels included in the selected area. The GSM was thus used as a quantitative measure of echogenicity of the selected regions: the SN, the mesencephalon (ME), and the basal cisterns (BC).
Upon review of the saved images, the first step was to set all in gray scale and then to identify and manually encircle the entire SN echogenic region within the ipsilateral cerebral peduncle using the “lasso tool” of the software. This way, we obtained the GSM of the entire SN (Figure 2A). The same lasso (i.e., the same number of pixels, determined by the SN size) was displaced using the “moving tool” to the adjacent mesencephalon to obtain the ME GSM in the region of the crus cerebri (Figure 2B). Finally, the lasso tool was moved again to the BC posteriorly to the brainstem at a similar distance from the ultrasound probe as that of the SN to obtain the BC GSM (Figure 2C). Only one region of each structure was evaluated per image. The absolute GSMs of the SN, ME, and BC were then compared between the three study groups. The GSM values of the SN and ME were normalized using the BC GSM as a reference, and the SN/ME, SN/BC, and ME/BC echo ratios were calculated. These ratios were also compared between the study groups. The same procedure and calculations were repeated for all of the images using a predetermined 240-pixel frame called the FIX_GSM (Figure 2D –F). This frame was positioned first at the most echogenic spot of the SN (chosen by visual assessment), then at the center of the crus cerebri, and at last at a similar position where the first data were obtained from the BC.
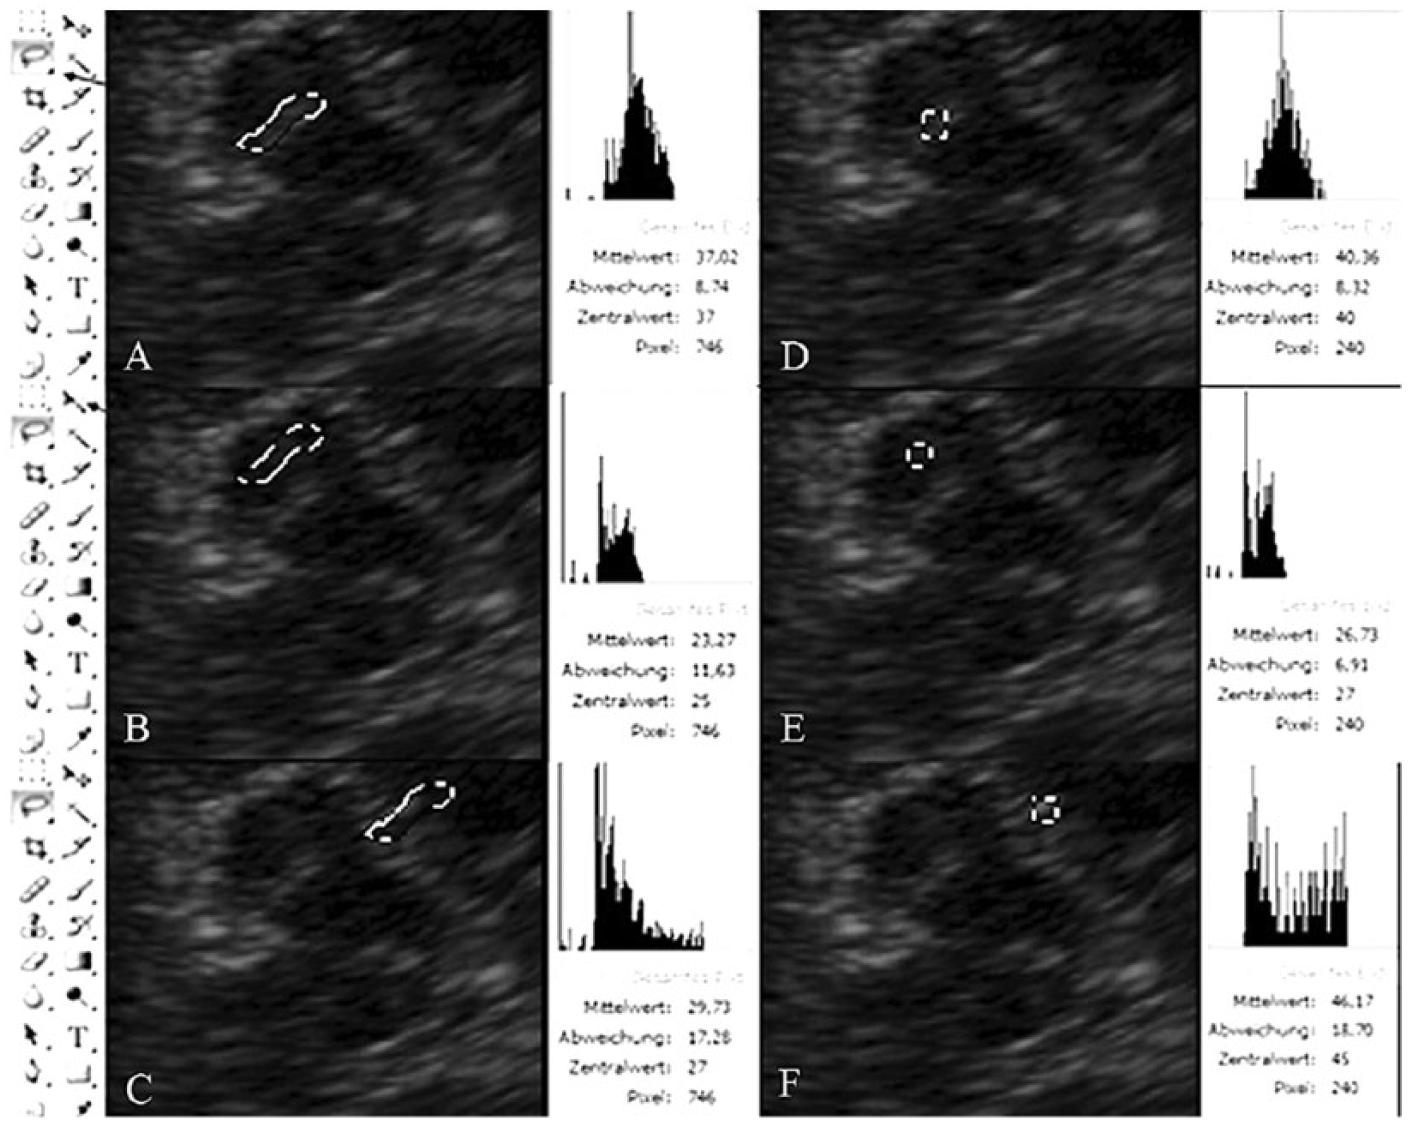
Data obtained by computer-aided quantification of echogenicity in a Parkinson disease patient. (A) In the first step, the substantia nigra was encircled (dotted line) using the “lasso tool” (black arrow, left panel). The gray-tone histogram of the pixels included in the selected area is displayed (right panel; GSM = 37.02). (B) Using the “moving tool” (black arrow, left panel), the circle was displaced to the adjacent mesencephalon at the crus cerebri. The histogram on the right shows a lower GSM = 23.27. (C) The histogram from the basal cisterns is shown with a GSM = 29.73 (circle moved to basal cisterns). (D–F) Data obtained within a fixed number of pixels (square dots: 240 pixels) in the region of interest: (D) substantia nigra, (E) mesencephalon, and (F) basal cisterns. GSM, gray-scale mean.
Statistical Analyses
All statistical analyses were performed in a standard statistical package (SPSS for Windows, version 20.0; SPSS, Inc., an IBM Company, Chicago, Illinois). The use of means, standard deviations, and parametric tests was justified by a test for normality of the GSM values (one-sample Kolmogorov-Smirnov test, P = .151). The data are expressed as mean ± SD. Comparisons between two groups were performed using analysis of variance (ANOVA). For multiple-group comparisons, Bonferroni post hoc correction was used. The correlations between continuous variables were calculated using Pearson’s product-moment correlation coefficient (r). The accepted level of statistical significance was P ≤ .05.
The GSM values and ratios of the SN, ME, and BC were compared between patients and controls. The GSM values of the mesencephalic structures were correlated with the planimetrically measured area of the SN (traditional TCS parameter), age, and disease duration among the patients.
Results
A total of 14 (13.7%) of the 102 eligible participants had bilateral inadequate acoustic temporal bone windows for TCS examination and were therefore excluded from the analysis. The demographic and clinical characteristics of the 88 individuals with good windows (i.e., the study population) are provided in Table 1. Group I (PD patients) and group II (old controls) were matched by sex, age, ethnicity, and schooling. Group III (young controls) was significantly younger and more educated than groups I and II. The PD patients had a mean disease duration of 144.4 months and median Hoehn and Yahr stage of 2.5.
Demographic and Disease Characteristics of the Study Population.
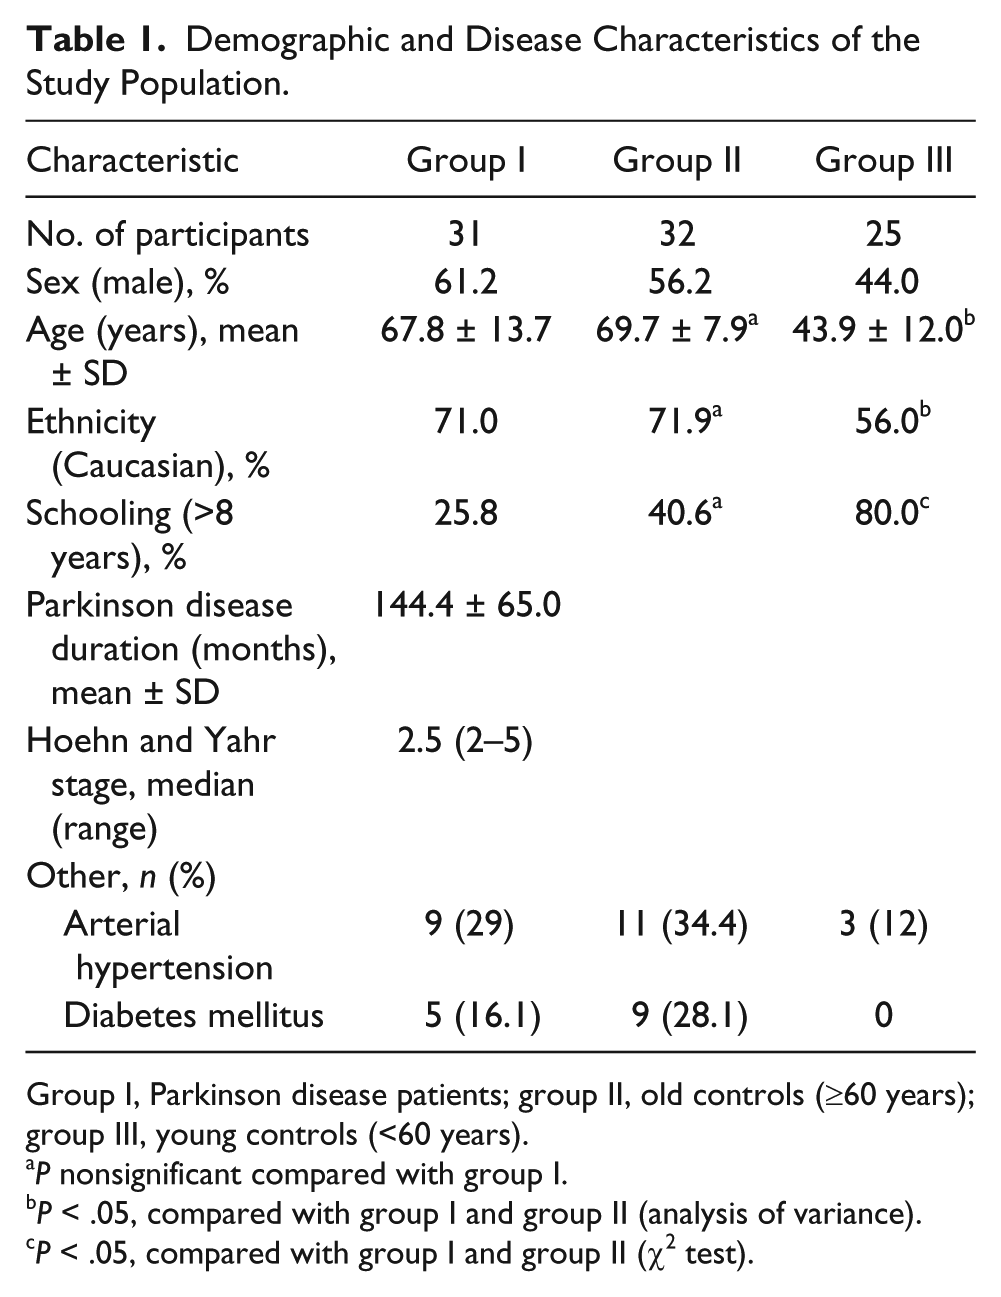
Group I, Parkinson disease patients; group II, old controls (≥60 years); group III, young controls (<60 years).
P nonsignificant compared with group I.
P < .05, compared with group I and group II (analysis of variance).
P < .05, compared with group I and group II (χ2 test).
The mean area of SN echogenicity (traditional parameter) on the larger side in the PD group was significantly different from the two other study groups (P < .001): group I = 0.33 ± 0.07 cm2 (range, 0.21–0.52 cm2), group II = 0.17 ± 0.06 cm2 (range, 0.08–0.33 cm2), and group III = 0.16 cm2 ± 0.09 (range, 0.00–0.49 cm2). In the present study, the best cutoff value to discriminate between patients and controls was SN area ≥0.22 cm2, indicated by the 90th percentile of the controls. Three patients exhibited SN areas <0.22 cm2, a false-negative value of 9.7%. In eight controls (14%), an enlarged echogenic SN area (false positive) was found on one side.
The comparative areas and GSM analyses are presented in Table 2 and Figure 3. The planimetrically measured SN echogenic areas measured during the scans and number of SN pixels encircled on the saved images were significantly larger in patients with PD (P < .001).
Traditional Substantia Nigra Echogenic Area Measurement and Gray-Scale Mean (Computer-Aided Echogenicity) Data of Mesencephalic Structures in Parkinson Disease Patients and Healthy Controls.
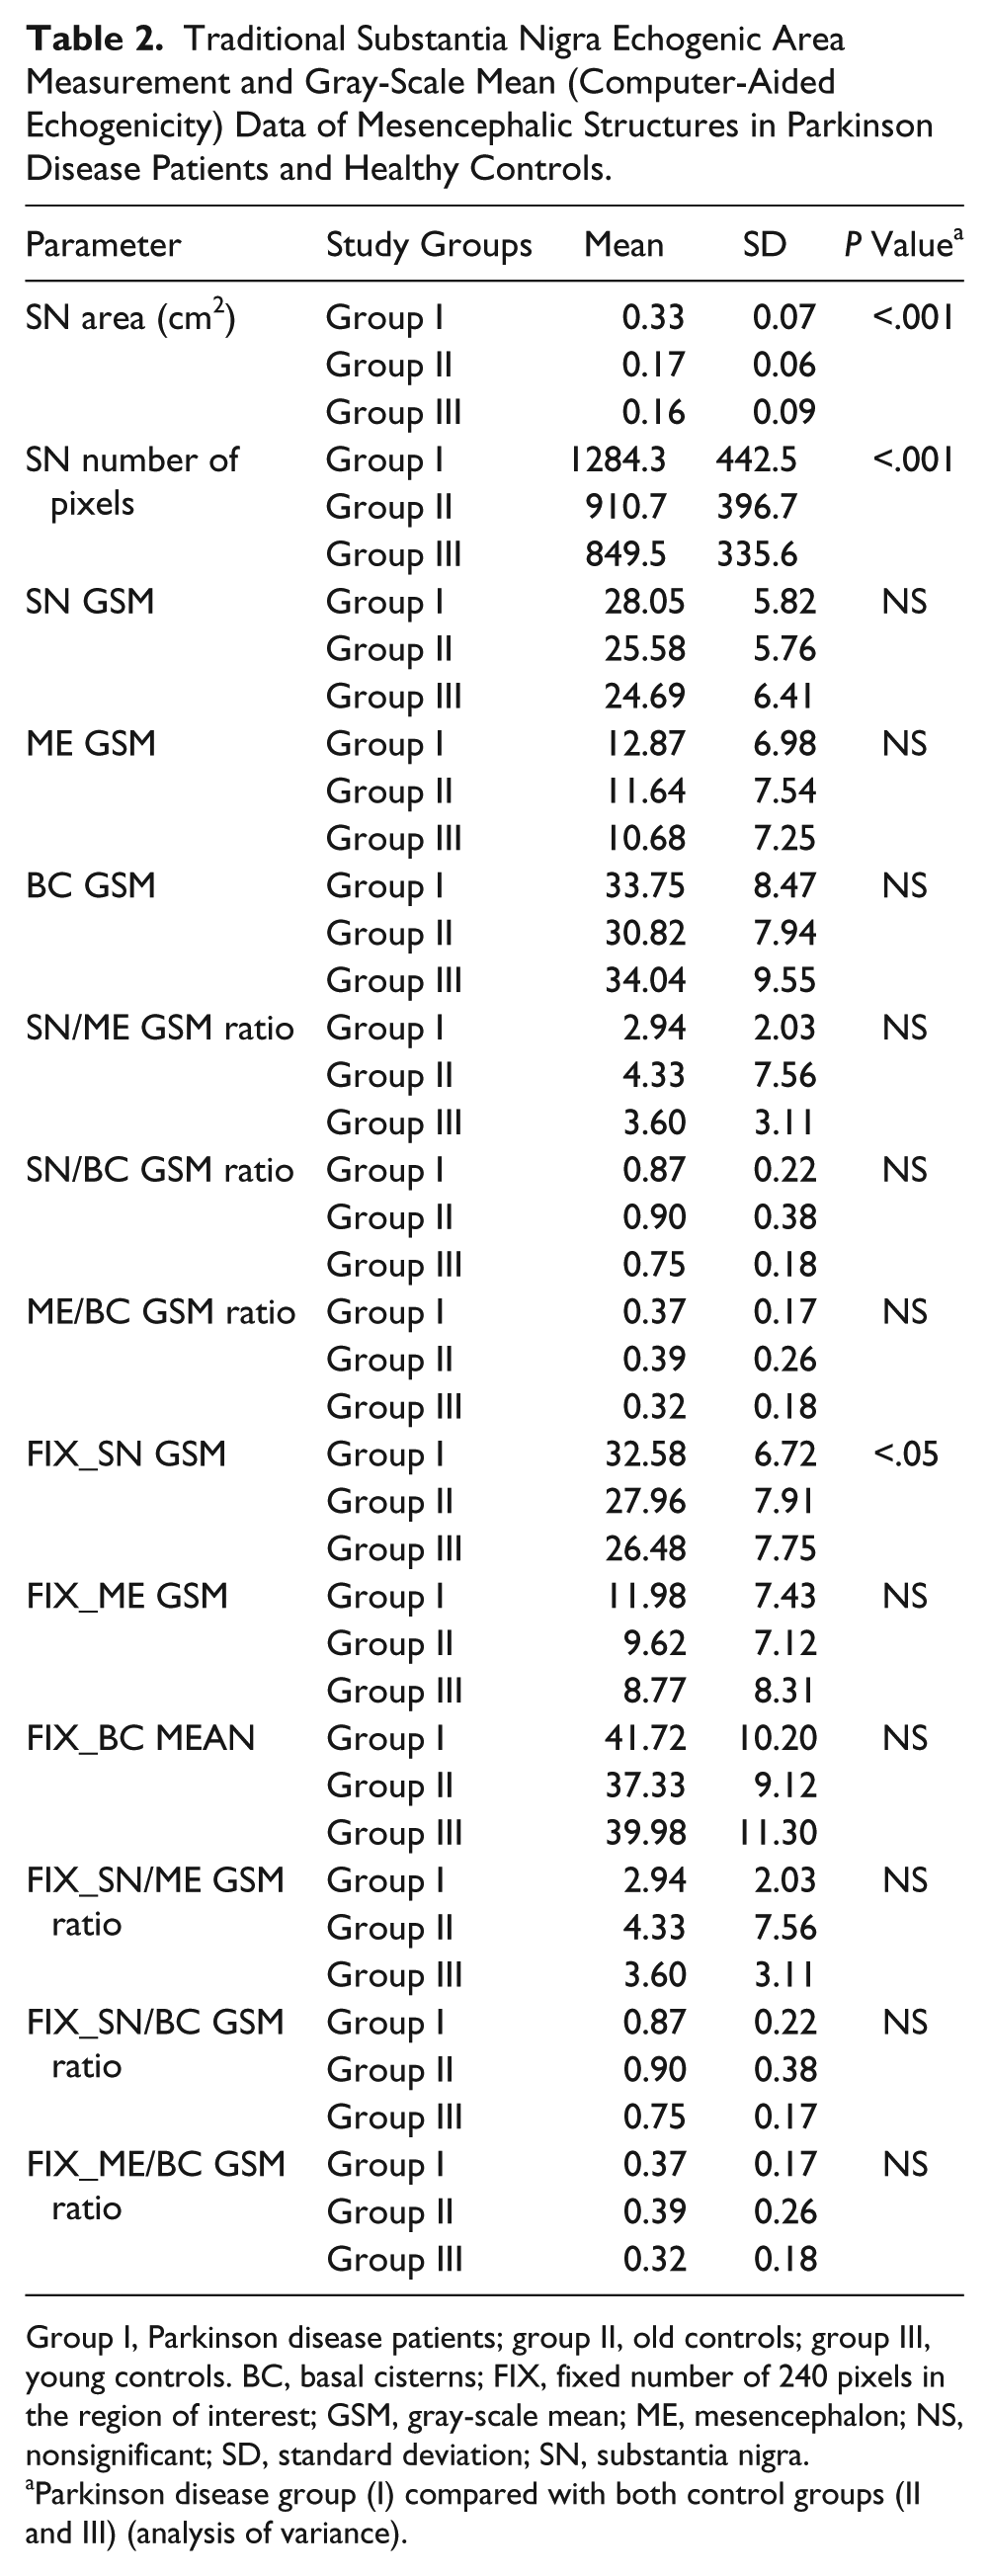
Group I, Parkinson disease patients; group II, old controls; group III, young controls. BC, basal cisterns; FIX, fixed number of 240 pixels in the region of interest; GSM, gray-scale mean; ME, mesencephalon; NS, nonsignificant; SD, standard deviation; SN, substantia nigra.
Parkinson disease group (I) compared with both control groups (II and III) (analysis of variance).
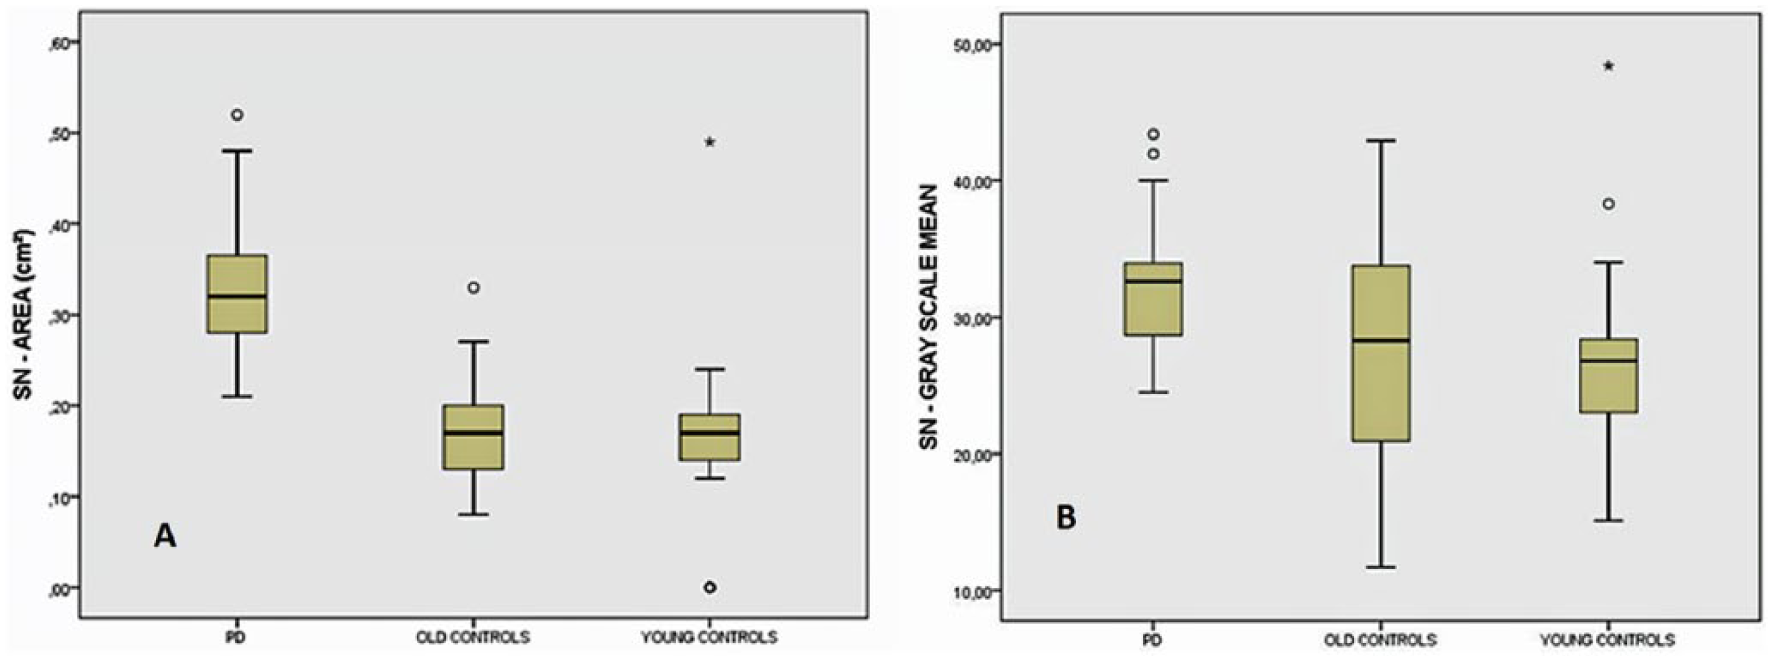
Gray-scale mean of substantia nigra (SN; obtained at its most echogenic site) in Parkinson disease (PD) patients compared with control groups. Boxplots with median, lower and upper quartiles, and range (PD × old controls, P = .048; PD × young controls, P = .009; analysis of variance with Bonferroni).
Although the echogenicity of the entire SN area was higher in group I, it did not reach statistical significance. However, nigral echogenicity evaluated at the most echogenic site of the SN (FIX_SN GSM) was significantly higher in the patients (group I) compared with both control groups (group II, P = .048; group III, P = .009).
The differences in the echogenicities of the ME and BC were nonsignificant between the study groups. None of the ratios was statistically significant either.
Correlation analyses are provided in Table 3. The planimetrically measured SN area was positively correlated with nigral echogenicity in the three study groups (SN/BC GSM ratio in PD patients and SN-GSM and FIX_SN-GSM in the old and young controls).
Correlations Among Traditional Substantia Nigra Echogenic Area Measurement, Mesencephalic Structures Gray-Scale Mean, Disease Duration, and Age.
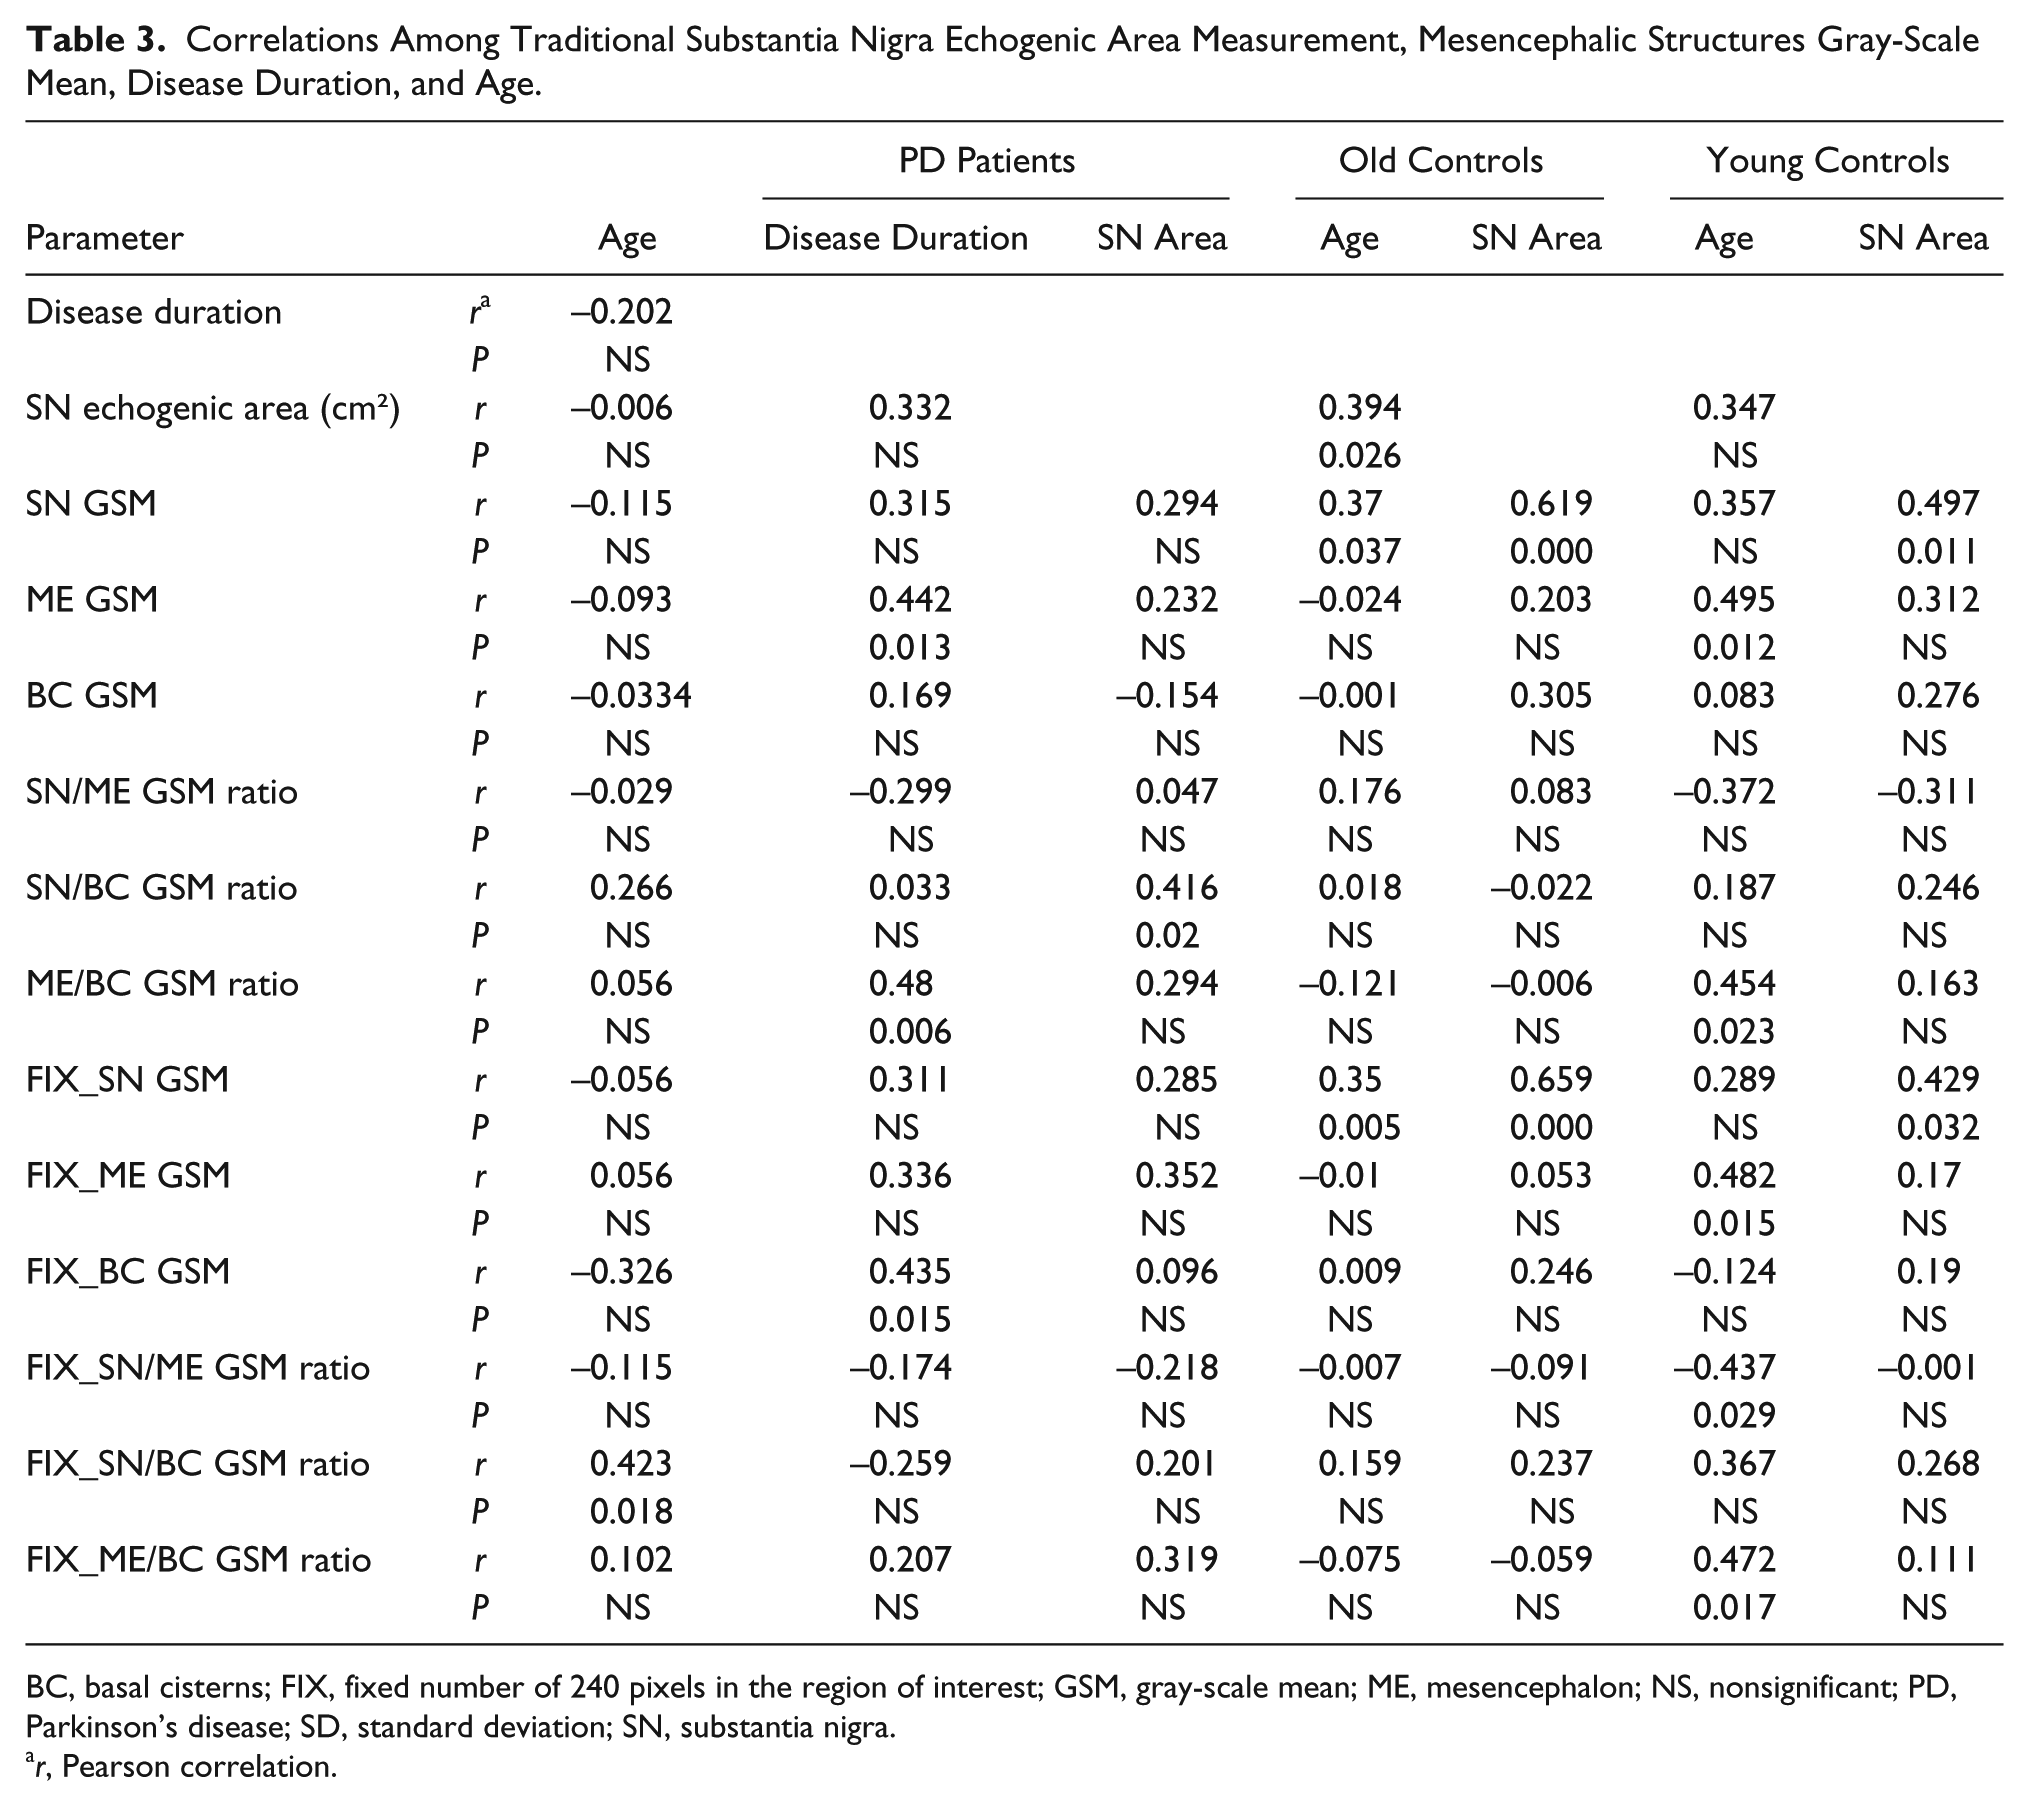
BC, basal cisterns; FIX, fixed number of 240 pixels in the region of interest; GSM, gray-scale mean; ME, mesencephalon; NS, nonsignificant; PD, Parkinson’s disease; SD, standard deviation; SN, substantia nigra.
r, Pearson correlation.
Age correlated positively with nigral echogenicity in the PD group (FIX-SN/BC GSM ratio) and in the old controls group (SN GSM and FIX_SN-GSM), whereas in the young control group, we found a positive correlation between age and mesencephalic echogenicity (ME-GSM, ME/BC-GSM ratio, FIX_ME-GSM, and FIX_ME/BC ratio).
In the patients, disease duration correlated with ME and BC echogenicities (ME-GSM, ME/BC-GSM, and FIX_BC-GSM).
Discussion
These results would suggest that the SN region depicted by TCS is indeed more echogenic in PD patients than in controls, as indicated by a higher GSM. It is important to note that SN GSM reached statistical significance only when obtained at its most echogenic site, probably reflecting the heterogeneous disease process within the SN. 21 The planimetrically measured SN area—the traditional TCS method—showed a positive correlation with SN GSM, indicating that a larger measured area was associated with greater echogenicity. Based on a limited review of the literature, this may be the first study to show enhanced SN echogenicity in PD patients using gray-level pictorial analysis; a previous study found similar results using another kind of software. 22 Criticisms of TCS studies are frequently based on the inherent lack of objectivity in the visual evaluation of the SN echo pattern. The presented method was easy to perform, used universally available software, and could help to overcome TCS limitations.
Difficulty quantifying the degree of the sonographic echogenicity of an organ is a long-time recognized problem. 23 Nonetheless, an effective, objective measure of the echo pattern is still a topic of research. Sonographers have generally relied on the subjective visual evaluation of images to assess the echo characteristics of different tissues, but because human perception itself is variable, this approach has given rise to mixed results. 16
Tissue echogenicity is determined by the size, richness, and distribution of its acoustic interfaces (i.e., regions with abrupt discontinuities in acoustic impedance). 18 Changes in echogenicity can be the result of pathological processes as cell proliferation in tumors or changes in cells or interstitial composition such as gliosis.16,18 Calcium deposits17,24 and heavy-metal accumulation (e.g., copper 25 and iron4,26) can also contribute to changes in ultrasound wave reflection.
In PD patients, enhanced SN echogenicity may mirror the increase in impedance differences at tissue interfaces as a result of morphological changes. These changes might include the proliferation of microglia that increase cellular interfaces, loss of dopaminergic neurons that results in tissue condensation, and increased heavy-metal tissue content. 25 Previous postmortem and neurochemical studies revealed a close correlation between SN echogenicity and tissue iron content. 4 In addition, experiments in rats have demonstrated more intense tissue echogenicity induced by injecting increasing amounts of iron into the SN. 27 Consistent with this theory, the current results might be explained by the putatively increased iron content in the nigral area and other parts of the mesencephalic brainstem in PD patients.
An observed overlap was noted in individual echogenicities when comparing patients with old controls (Figure 3). In addition, a positive correlation between nigral echogenicity and age suggests that not only the disease process may account for the enhanced echogenicity in the nigral area but also aging. This result matches with the linear increment of SN area with age found by Hagenah et al. 28 in individuals aged 0 to 72 years. However, a German study could not find any correlation between SN area and age in 93 participants aged 73 to 83 years. 29 This discrepancy might be explained by a plateau effect in the age-related increment of SN echogenicity, pointed out by the above-mentioned authors. 28 As the current sample ranged from 31.9 to 81.5 years old, the age effect on nigral echogenicity could be demonstrated.
In the present study, the SN GSM was not correlated with disease duration. This finding is in line with prior publications,30 –33 although some authors have found a moderate positive correlation between nigral area and the duration of the disease.34,35 Interestingly, a significant positive correlation between ME echogenicity and PD duration was detected but not previously described. The precise mechanisms responsible for the change in mesencephalon echogenicity observed in our cohort of PD patients are currently unknown. However, the neurodegenerative process is well known to affect many areas in the nervous system. 36 Thus, one might speculate that changes in other nuclei of the brainstem and consequently their connecting fibers could contribute to this alteration. Furthermore, as the determination of SN echogenicity by visual means uses the mesencephalon as a standard, the change in mesencephalic echogenicity could explain in part the lower reproducibility of the qualitative evaluation of SN echogenicity by the naked eye. 5 The same explanation applies to the nonsignificant ratios SN/ME and ME/BC. Noteworthy is the fact that BC echogenicity also grows with PD duration, suggesting that the structures within the cisterns, mainly vascular, may not be as inert as previously thought.
An estimated 8% to 20% of healthy people who undergo TCS could have enlarged areas of SN hyperechogenicity, similar to PD patients,3,4 and some of these individuals might have decreased striatal fluorine-18-L-dihydroxyphenylalanine ( 18 F-Dopa) uptake measured by positron emission tomography. 6 Moreover, enlarged SN hyperechogenicity areas have been found to be more prevalent in older people, which is related to motor slowing in the elderly. 29 These data support the theory that SN hyperechogenicity could be a marker for subclinical nigrostriatal alterations and increased susceptibility to PD. 31
The limitations of the present study are related to the study design, the small number of participants, and the lack of interrater reproducibility calculation. Therefore, these results are specific to this cohort of participants. Regardless of these issues, the goal was to present a simple method to overcome subjectivity in TCS analysis and to assess its value in distinguishing PD patients from healthy controls. Future studies are needed to address the limitations and a replication of this method.
Conclusions
A method was posed for the computerized quantification of midbrain structures’ echogenicity already validated for the evaluation of other organs. The main advantage of this method is that it did not rely on visual evaluation alone, with its inherent lack of objectivity. This study uniquely demonstrated that SN GSM, a surrogate of echogenicity, was higher in PD patients, confirming objectively the hyperechogenicity of SN as a stable diagnostic marker of the disease, as it exhibited no correlation with disease duration. Surprisingly, ME GSM correlated with disease duration, perhaps just reflecting the more widespread histopathological process of PD. The GSM method has a potential to serve as a complementary tool to minimize subjectivity in PD diagnosis by sonography and a tool to find new information about changes in echogenicity that could mirror subtle changes in tissue composition.
Footnotes
Declaration of Conflicting Interests
The authors declared no potential conflicts of interest with respect to the research, authorship, and/or publication of this article.
Funding
The authors received no financial support for the research, authorship, and/or publication of this article.