
Abstract
Prostate cancer is a common cause of cancer-related death of men in the United States. The purpose of this review is to compare the validity of transrectal ultrasound–guided systemic biopsy with contrast-enhanced transrectal ultrasound–guided systemic biopsy and transrectal elastography–guided systemic biopsy for the detection of prostate cancer. Adding contrast-enhanced or transrectal elastography core targeting to transrectal ultrasound–guided biopsy is a feasible approach to increase detection rates of higher-grade prostate cancers. Because contrast-enhanced imaging of the prostate is not approved for use in the United States, elastography is the most effective sonographic solution to improve prostate cancer detection with current screening techniques.
The incidence of prostate cancer (PCa) in the United States has declined in the last 15 years, with an annual mortality rate of approximately 30,000, a 3% decrease from 2006 to 2014.1,2 However, it remains the most common malignancy in men and is twice as common in African American men.1,2 Nationally, there are 233,000 new cases each year, which constitutes approximately 14% of all new cancer cases in the United States and 27% of new cancer cases in men.1,2 The detection rate varies by state, which likely reflects regional differences in PCa screening policies. 3
Limitations of Current Screening Methods
There is a suspicion of PCa in men who present with abnormal screening results on a digital rectal examination and/or elevated prostate-specific antigen (PSA). However, these methods have drawbacks as screening tools. PSA screening has an 80% false-positive rate with traditional cutoff values of 2.5 to 4.0 µg/L. 4 The digital rectal examination has only an 18% detection rate. 5 Therefore, men who test positive on one or both of these examinations are referred for a transrectal ultrasound (TRUS)–guided biopsy to detect cancer.
The Gleason score is the simplest method for describing the risk of metastasis based on the findings present in the TRUS biopsy core. The interpreting pathologist provides a score of 2 to 10 based on how advanced the disease is and the PSA level, with the higher Gleason numbers associated with more advanced cancers. Scores <4 are not advanced; scores of 5 to 7 have an intermediate risk; and scores ≥8 indicate advanced disease. 6 When Gleason scores are <6, the probability of advanced disease increases with increasing PSA level, but the risk remains low. 7
The gray-scale TRUS-guided systemic biopsy, 8 first described by Holm et al. in 1981, enables the operator to place the biopsy needle directly into those regions of interest and any suspicious lesions that appear on the sonogram. 9 The procedure has evolved into the current technique, which includes using TRUS guidance to take approximately 10 to 12 core samples from the prostate in a systemic fashion—typically, 2 core samples each from base, mid-, and apical regions on the right and left sides. This technique ensures that there is a uniform separation of the biopsy cores obtained and that the entire gland is sampled, but there is a margin of error because systematic sampling may still miss cancerous lesions.
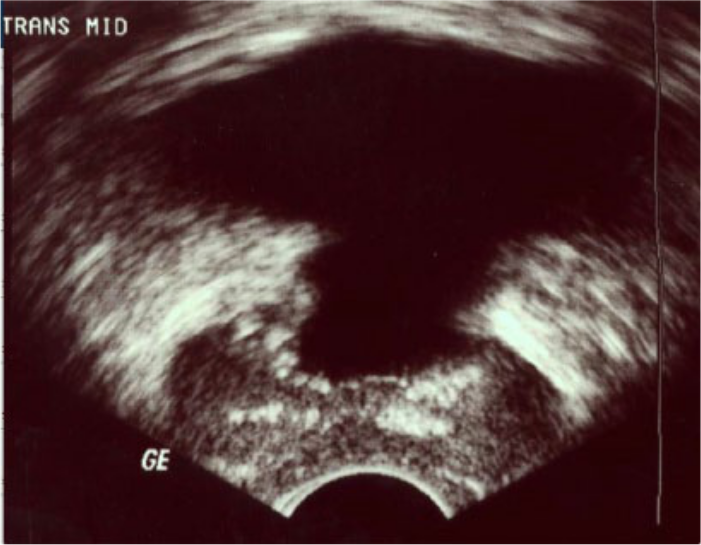
Figures 1 to 5 demonstrate the normal gray-scale appearance of the prostate gland. Historically, prostate tumors have been described sonographically as hypoechoic, although more recent studies have shown that tumors of the prostate are as likely to be isoechoic or hyperechoic. 10 Spajic et al. found that 49% of PCa lesions were isoechoic and 10% were hyperechoic on TRUS with subsequent comparison to histologic findings. 8 Up to 50% of cancers may not be visible at all on gray-scale sonography, and sensitivity and specificity are reported to be 44% and 77%, respectively.11-15 Therefore, gray-scale findings alone are insufficient to detect PCa by sonography.
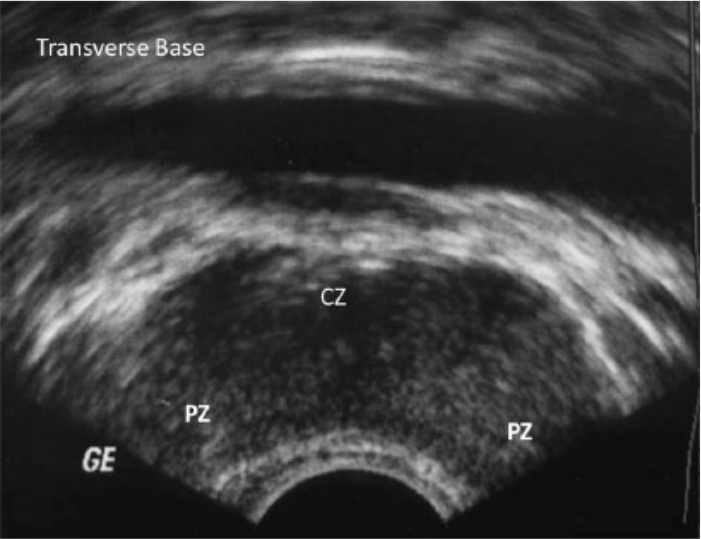
Transverse gray-scale image of the prostate gland taken at the base. CZ, central zone; PZ, peripheral zone.
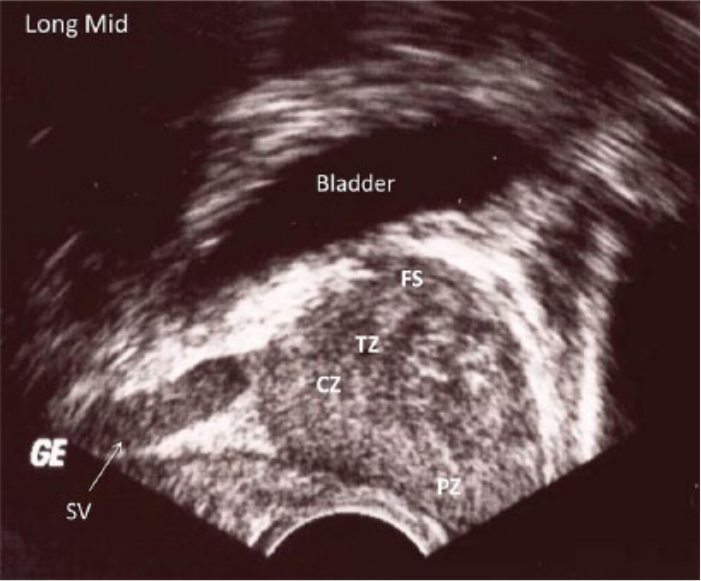
Longitudinal/sagittal gray-scale image of the prostate gland through the midsection. CZ, central zone; FS, fibrous stroma; SV, seminal vesicle; TZ, transitional zone.
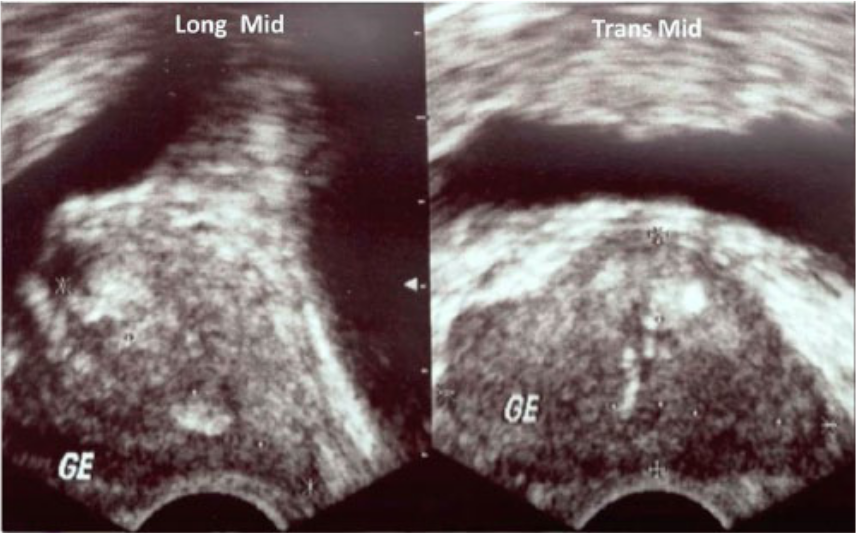
Gray-scale image of the prostate comparing sagittal/longitudinal (left) and transverse (right) images at the midgland, where measurements are taken.
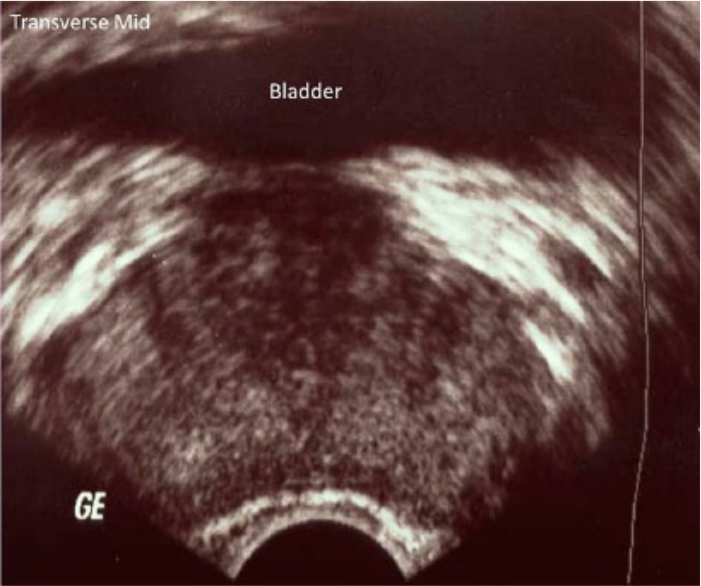
Transverse gray-scale image of the prostate gland in the midsection.
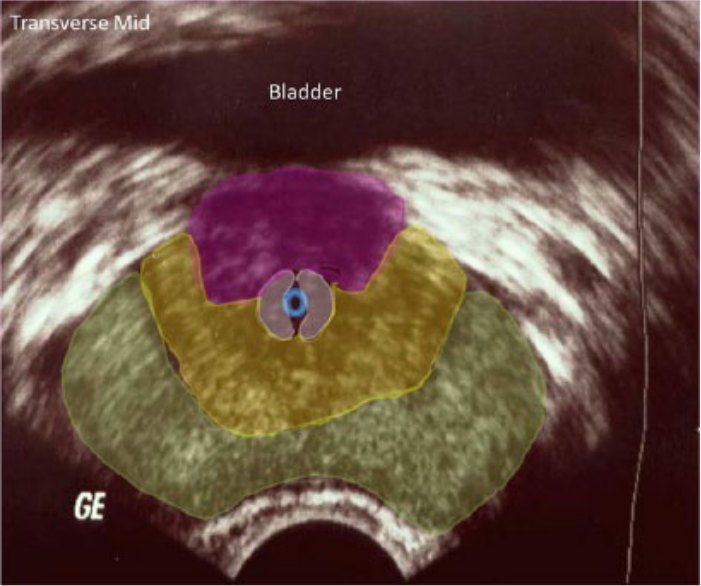
Same image as Figure 4 with color coding superimposed to show the following: green, peripheral zone; yellow, central zone; gray, transitional zone; blue circle, urethra; pink, fibrous stroma.
Prostate tumors typically grow additional blood vessels so small that they are commonly referred to as microvasculature. The nodules in the most advanced stages have the most accumulation of microvasculature. 11 Color and power Doppler have been proposed as techniques that could improve TRUS sensitivity and specificity, due to their ability to identify the hypervascularity associated with tumor growth. 16 Research on the addition of color and power Doppler ranges from improved sensitivity of 77% to 83% and improved specificity of 55% to 77% to no improvements at all.13,17,18 Kuligowska et al. even reported that detection rates with color and power Doppler were worse than with gray-scale alone. 19 They postulated that the microvasculature may be too small for color or power Doppler to detect suspicious lesions; therefore, the addition of color or power Doppler to gray-scale sonography does not improve the detection of PCa. Thus, the TRUS biopsy remains an essential component of PCa screening.
The combination of PSA, digital rectal examination, and TRUS biopsy has long been considered the gold standard for early detection and diagnosis of PCa. However, many suspicious findings on gray-scale turn out to be benign diseases, such as benign prostatic hypertrophy and inflammation, resulting in high false-positive rates for the TRUS biopsy. Autopsy studies have shown sensitivity rates for TRUS biopsies as low as 30%, but the detection rates increase when more core samples are taken. 14 Sensitivities improve to 53% to 58% with an 18-core biopsy sample technique. 20
Biopsies that show negative results will most likely undergo repeat PSA screening and repeat biopsy at a later date. Most commonly, repeat biopsies are done 6 to 12 months later, but the diagnostic yield decreases with each subsequent biopsy.21,22 This process not only delays the PCa diagnosis process but also incurs increased costs and risks for complications.
More recently, the idea of saturation biopsy has been introduced in which 22 to 36 cores may be taken, and the number of samples taken is based on gland volume as well as the distribution of the peripheral zone as it enlarges, under the premise that more samples increase the possibility of cancer detection.20,23 However, saturation biopsy is not standardized concerning how many cores to take or from where to take them, and it does not necessarily improve the detection rate of the dangerous PCa that should be treated. 23 Saturation biopsies do not prove to be superior to an 18-core sample, are not cost-effective, and increase patient morbidity with the increase of additional samples.20,24
Some of the most common complications surrounding prostate biopsies include minor ones of mild hematuria, rectal bleeding, hematospermia, and persistent dysuria. Hematouria and hematospermia occur often, 24% and 45%, respectively. 25 Major complications include vasovagal episodes, severe hematuria, rectal bleeding that requires intervention, infection that requires antibiotic treatment, and/or sepsis.22,26 Approximately 9% of patients can expect to have at least one minor complication from a biopsy, and the complication rates will increase with increasing numbers of samples. 22
Once PCa is detected, treatment options include surveillance, which postpones treatment in favor of repeat imaging and biopsy to gauge tumor growth. If more aggressive treatment options are preferred, the patient may have radiation therapy, brachytherapy, transurethral prostatectomy (Figure 6), and/or radical prostatectomy. These treatments have more side effects than surveillance, including persistent diarrhea, hematochezia, dysuria, urethritis, cystitis, urinary incontinence, and erectile dysfunction. 27 Although surgical procedures may spare erectile function, it remains a problem for about 59% of men who undergo prostatectomy. 27
Gray-scale image of prostate gland following a transurethral radical prostatectomy.
In 2012 the US Preventative Services Task Force recommended discontinuing routine PCa screening in all men, 28 and the Canadian Task Force on Preventative Care followed suit in 2014. 29 The rationale was that the false-positive rate with screening was too high. The reduction in overall mortality from PCa is small at best and insignificant at worst. 28 The harm of overdiagnosis and overtreatment can cause severe morbidity, which outweighs the benefits of screening, given that many of the cancers detected would never grow large enough to cause death.28,29 Because of these new recommendations, the number of new cases of PCa, as well as the number of men undergoing screening, has declined. 30 While the overall reduction in cancer diagnosis is generally viewed as good, it does leave the question of how many aggressive cancers will go undiagnosed. 30
It also is likely that men will continue to ask for PCa screening. 28 Therefore, better screening techniques are needed. The onus is on the medical community to improve the current biopsy technique in such a way that it reduces the number of core samples needed to make the diagnosis while increasing the likelihood that positive cores with higher Gleason scores are detected when disease is present. Further benefit would derive if it were possible to sample only lesions that have a high probability of having a Gleason score ≥7. 31 A test that has high sensitivity, low false-positive results, less invasiveness, and good patient acceptance is the most desirable test. Because sonography is widely accepted for first-line screening, the focus should be to improve its ability to target biopsy cores with high Gleason scores while increasing the PCa detection rate and decreasing the need for repeat biopsy procedures. Elastography and contrast-enhanced (CE) ultrasonic imaging are two areas that may improve the sonographic detection of high-grade PCa over the traditional TRUS biopsy.
CE Imaging
Background
CE imaging includes the use of a gas body contrast agent in the form of a microbubble. In the United States, Food and Drug Administration (FDA)–approved contrast use is restricted to left ventricular opacification, but its use in the prostate gland is widely reported in the literature from Europe and Asia. Following intravenous administration, the circulation distributes the microbubble into the microvasculature of the target tissues, where the microbubbles interact with the transmitted pressure wave, creating both a strong reflection because of impedance mismatches and a harmonic response, which appears as enhancement on the gray-scale image.
Additional hardware is not needed for contrast imaging, but a contrast-specific software package may be required for best optimization. The sonographer should use the lowest acoustic output power consistent with good imaging, with a low mechanical index, to avoid bursting and to prolong the presence of the microbubbles and promote a harmonic response. The best machine settings are often determined by the contrast agent manufacturer. CE imaging has an excellent safety profile and minimally prolongs the examination. 32
Malignant lesions in the prostate present with an early enhancement pattern, occurring approximately 15 seconds after injection. 33 In PCa, the microvasculature of malignant tissues is smaller than typical vessels, making it difficult for traditional color or power Doppler imaging techniques to visualize them; but microbubble contrast has an advantage because of its harmonic interactions and increased reflectivity, and its small size allows for diffuse uptake by the microvasculature, allowing for defined differentiation of the lesion.19,34 Higher-grade tumors are thought to have more microvasculature than low-grade tumors and thus will have more contrast agent uptake. 34
Detection Rate per Patient
The detection rates for TRUS biopsy among the studies reviewed range from 7% to 26%, compared with rates of 24% to 100% for CE TRUS biopsy.31,33,35,36 Sensitivities, specificities, positive predictive values (PPVs), negative predictive values (NPVs), and accuracy rates of TRUS biopsy versus CE TRUS biopsy are shown in Table 1. On a per-patient basis,18,31,33,35-37 the sensitivities of TRUS biopsy are 66% to 78%, compared with 79% to 100% for CE TRUS biopsy. The specificities18,31,33,35-37 are 53% to 69% for TRUS biopsy and 13% to 86% for CE TRUS biopsy. Only Xie et al. 18 reported PPV and NPV for TRUS biopsy alone, at 61% and 72%, respectively; however, for CE TRUS biopsy,18,33,36 PPVs ranged from 48% to 89% and NPVs from 60% to 100%. Zhao et al. 37 reported overall accuracies with TRUS biopsy at 68% and CE TRUS biopsy at 83%, a statistically significant improvement.
Comparison of Conventional TRUS-Guided Biopsy Versus CE TRUS–Guided Biopsy for Prostate Cancer: Based on Patients. a
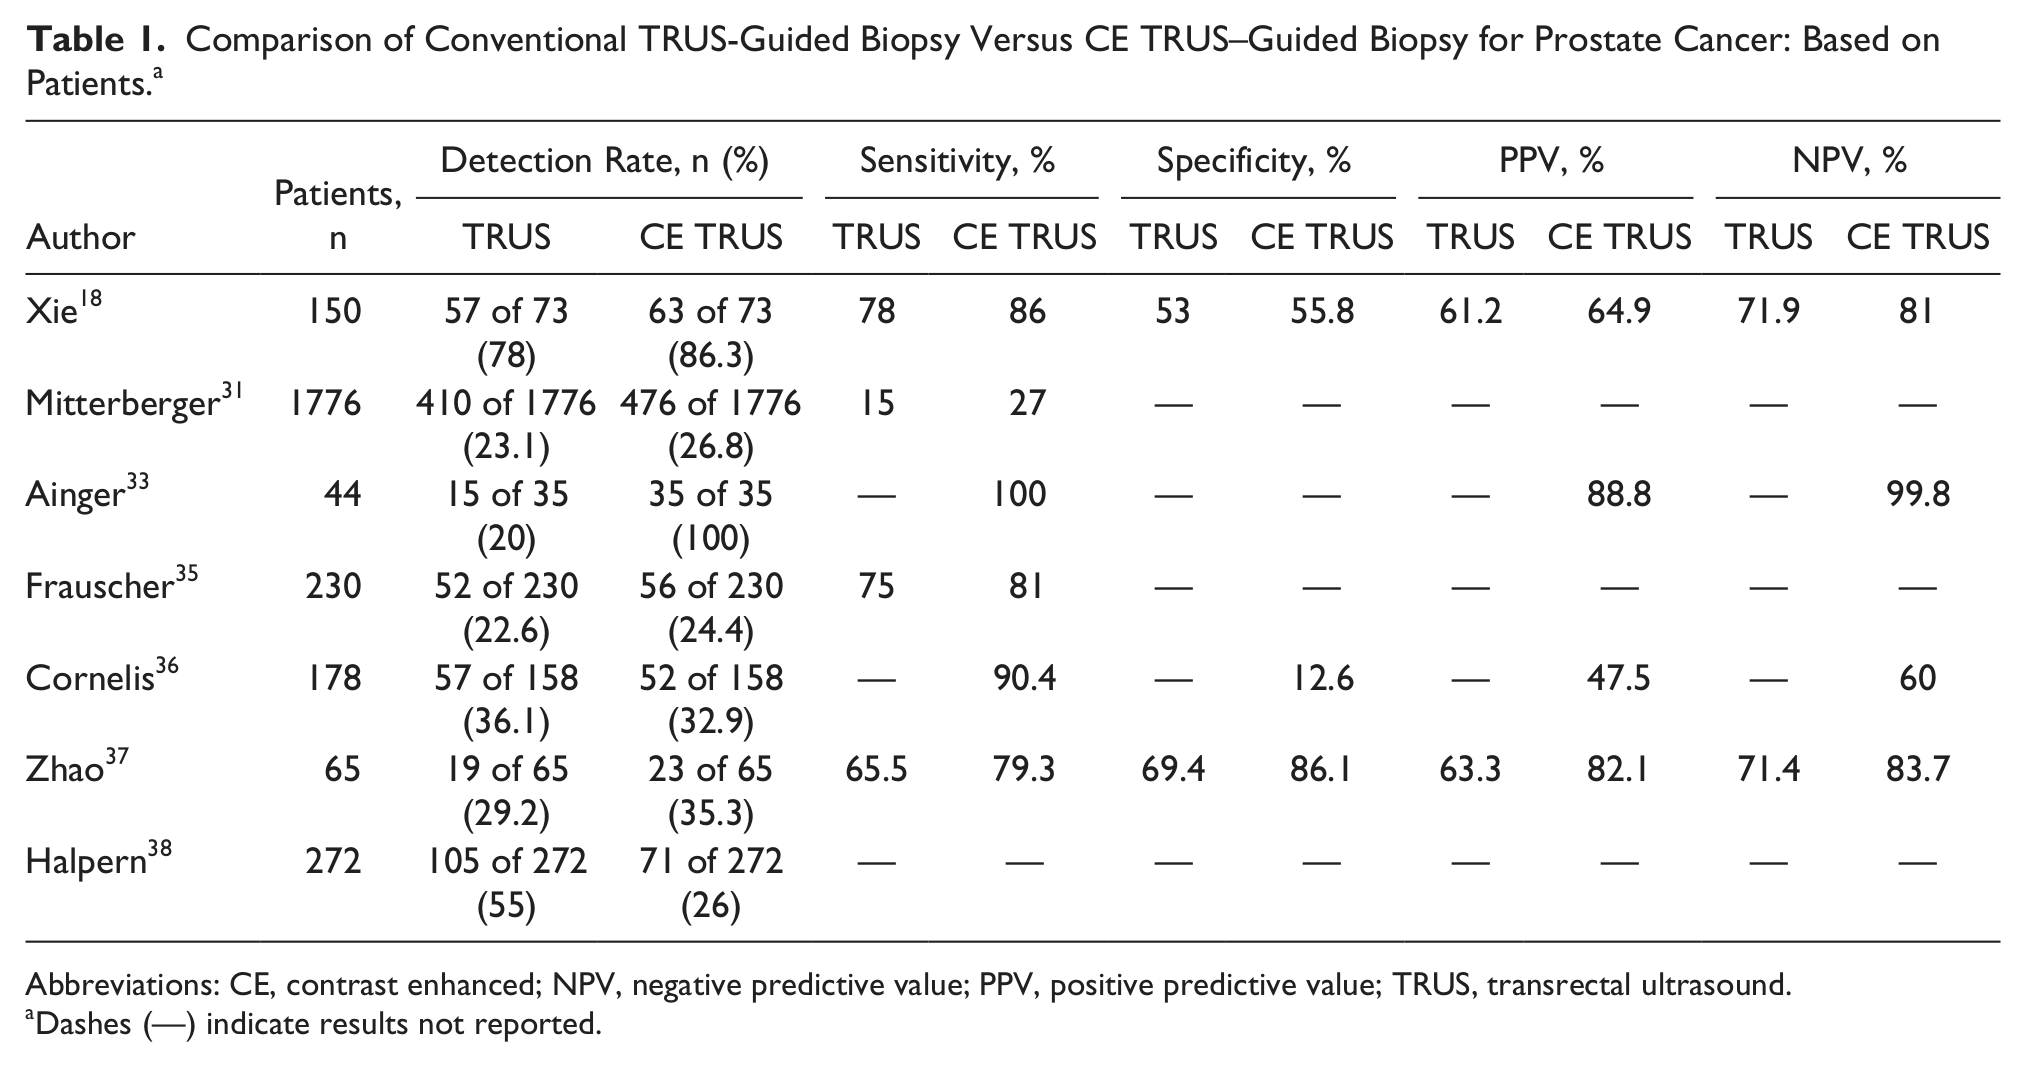
Abbreviations: CE, contrast enhanced; NPV, negative predictive value; PPV, positive predictive value; TRUS, transrectal ultrasound.
Dashes (—) indicate results not reported.
Detection Rate per Core
The results of TRUS biopsy versus CE TRUS biopsy per core are reported in Table 2. On a per-core basis, only Xie et al. calculated sensitivity, specificity, PPV, NPV, and diagnostic accuracy. 18 They found that TRUS CE biopsy 18 had a significantly higher sensitivity at 73% than TRUS biopsy at 51% or power Doppler alone at 48%. Although specificities and PPVs were not statistically different between the 2 modes, NPV was greater for CE TRUS biopsy 18 at 90%, compared with TRUS biopsy at 84% or power Doppler at 83%.
Comparison of Conventional TRUS-Guided Biopsy Versus CE TRUS–Guided Biopsy for Prostate Cancer: Based on Core Samples.
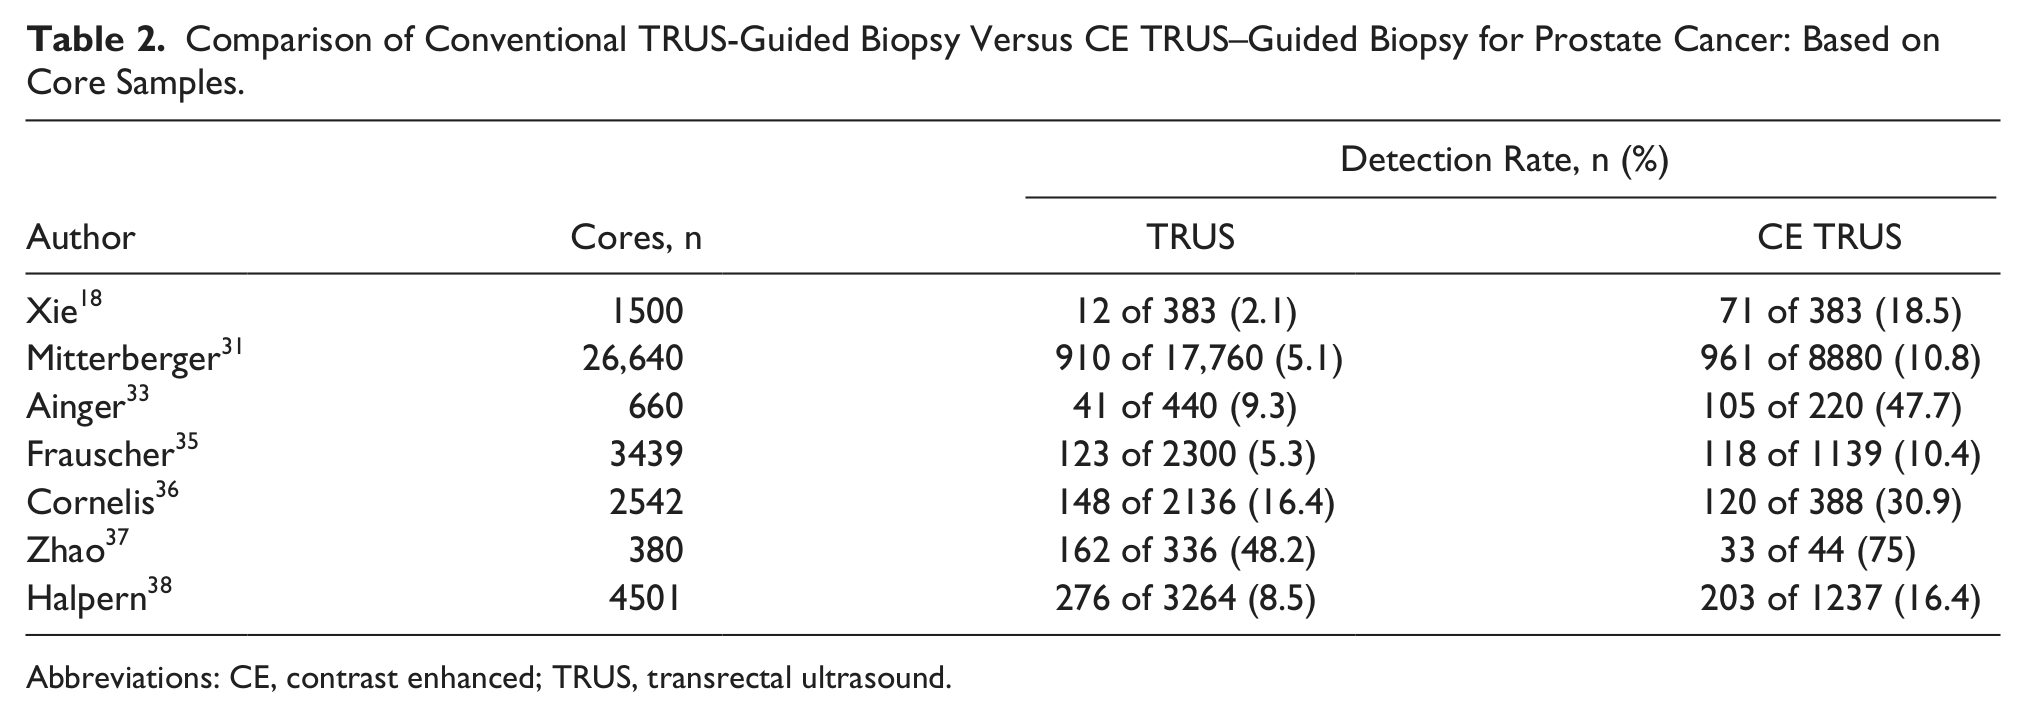
Abbreviations: CE, contrast enhanced; TRUS, transrectal ultrasound.
The overall per-core detection rates range from 2% to 48% for TRUS-guided biopsy and 10% to 75% for CE TRUS–guided biopsy.18,31,33,35-38 In these studies, CE TRUS provided a significant improvement in a per-core detection rate over TRUS biopsy alone, and fewer core samples were taken with CE TRUS.18,31,33,35-38 Xie et al. 18 demonstrated improved diagnostic accuracy with CE TRUS biopsy at 84% over TRUS biopsy at 78% or power Doppler at 78%. Calculated odds ratios indicate that CE TRUS biopsy was at least two times as likely to detect a positive core.35,36 Halpern et al. found that among CE TRUS, color Doppler, gray-scale, harmonic imaging, and power Doppler alone, CE TRUS biopsy was superior to all modes individually and that any mode would benefit from the addition of contrast imaging. 38
Gleason Scores
For studies that compared the Gleason scores between TRUS biopsy and CE TRUS biopsy, Fraushcer et al., Cornelis et al., and Halpern et al. reported statistically significant higher Gleason scores with CE TRUS biopsy.35,36,38 Halpern et al. found that specifically for grade 7, CE TRUS biopsy could detect a higher percentage of positive cores compared with TRUS biopsy. 38 Xie et al. did not report significant findings between the groups, but when they isolated analysis to CE TRUS biopsy, patients who had a negative CE TRUS biopsy had an average Gleason score of 6.3, and those with a positive CE TRUS biopsy had an average Gleason score of 7.1, which was significant. 18 Halpern et al. performed multivariate analysis on the Gleason scores positive for grade ≥7 and found that a combination of gray-scale and CE TRUS had a higher predictive value than any single mode. 38
CE Imaging Effectiveness
Frauscher et al. did not find a significant difference in detection rates between the two modes, and they attributed the results to the fact that they deliberately avoided the transitional zone because of the high occurrence of benign prostatic hypertrophy there, causing them to miss some positive lesions. 35 When statistical analysis was isolated to lesions in the peripheral zone, CE TRUS biopsy had a significantly higher detection rate. 35 Halpern et al. concluded that TRUS biopsy detected more patients with PCa when compared with CE TRUS biopsy; however, there were other important findings that favored the addition of CE TRUS biopsy, such as a higher detection rate for high-grade cancers and a higher detection rate on a per-core basis. 38
Although CE TRUS has the ability to reduce the number of cores needed per biopsy, it does not consistently detect higher Gleason score lesions as compared with TRUS alone. 31 False positives occur when prostatitis and/or benign prostatic hypertrophy is present, as both disease processes present with a similar early enhancement as PCa. 37 Halpern et al. attempted to use drugs that suppress benign disease prior to contrast agent imaging but was not successfully able to keep benign disease from enhancing with the contrast agent. 38
Identification of PCa with contrast agents is best achieved when the disease is in the peripheral zone. The transitional zone generally presents with rapid enhancement, thus making the detection of a rapidly enhancing nodule in that region difficult.18,31,35,37 Additionally, an enlarged transitional zone can compress the peripheral zone, which may impede assessment of the peripheral zone. 31 False-positive rates33,35,37 with CE biopsy range from 2% to 60%. False-negative findings may be attributed to PCa that is small and of low malignancy and therefore does not have sufficient microvasculature to demonstrate an early uptake pattern. 37
Additional limiting factors include that the measurement and evaluation of uptake patterns for contrast agents in cancers are based primarily on data from liver and breast imaging.33,37 There is a need to develop prostate-specific uptake patterns to improve detection rates. The development of tumor-specific microbubbles may also be needed.33,37 It is unclear if bolus injection or slow infusion of the contrast leads to more successful results. Although no additional ultrasound equipment is needed, most systems require a software package to enable the best contrast agent imaging. Finally, successful contrast imaging, like gray-scale imaging, is dependent on the skill and expertise of the operator.
Elastography Imaging
Background
Elastography, also known as strain imaging, can be thought of as a more advanced form of digital palpation. Abnormal tissue—such as that found in PCa, benign prostatic hypertrophy, and chronic inflammation—results in increased cellular density, glandular architecture loss, and decreased tissue elasticity, which may be palpable upon digital rectal examination. 39 The objective in transrectal elastography (TRES) is to obtain a measurement of the degree of tissue distortion upon compression with the transducer and subsequent release of pressure. Cancerous lesions are typically stiffer or more resistant to compression compared with surrounding tissue.
Elastography techniques that apply stress to the tissues include manual compression, vibration elastography, acoustic radiation force generated by an ultrasound pulse, and shear wave velocity. The two main types of elastography used in imaging today are compression/strain and shear wave elastography. Shear wave elastography sends a shear pulse from a specialized transducer to the tissue of interest, which creates tissue propagation measured quantitatively as a velocity; however, it is not yet widely available. 40 Strain elastography creates a qualitative image based on the displacement of the tissue of interest when put under pressure from an outside source.
The most common method for obtaining TRES is to use strain imaging with an end-fire transducer and to manually apply pressure on the prostate gland. 40 Only a few millimeters of displacement is required, and the strain measurement is acquired by comparing the relative movement of the tissue upon compression and release. 40 The quantification of the tissue elasticity is performed in real time, and the examination results are represented through a method of color imaging that is then superimposed over the conventional B-mode image41,42 (Figure 7). A 5-point scoring system (Table 3) is used that incorporates gray-scale appearance by TRUS and the firmness revealed by TRES to display the tissue as a color—ranging from green, which represents the most elastic or compressible, to blue, which represents the stiffest tissue. 42 The more blue the tissue appears, the more likely the lesion is PCa. 42 This classification system has been used as a model for subsequent studies and can be used to guide the systemic biopsy for improved cancer detection, but it is not a standardized guideline. 42
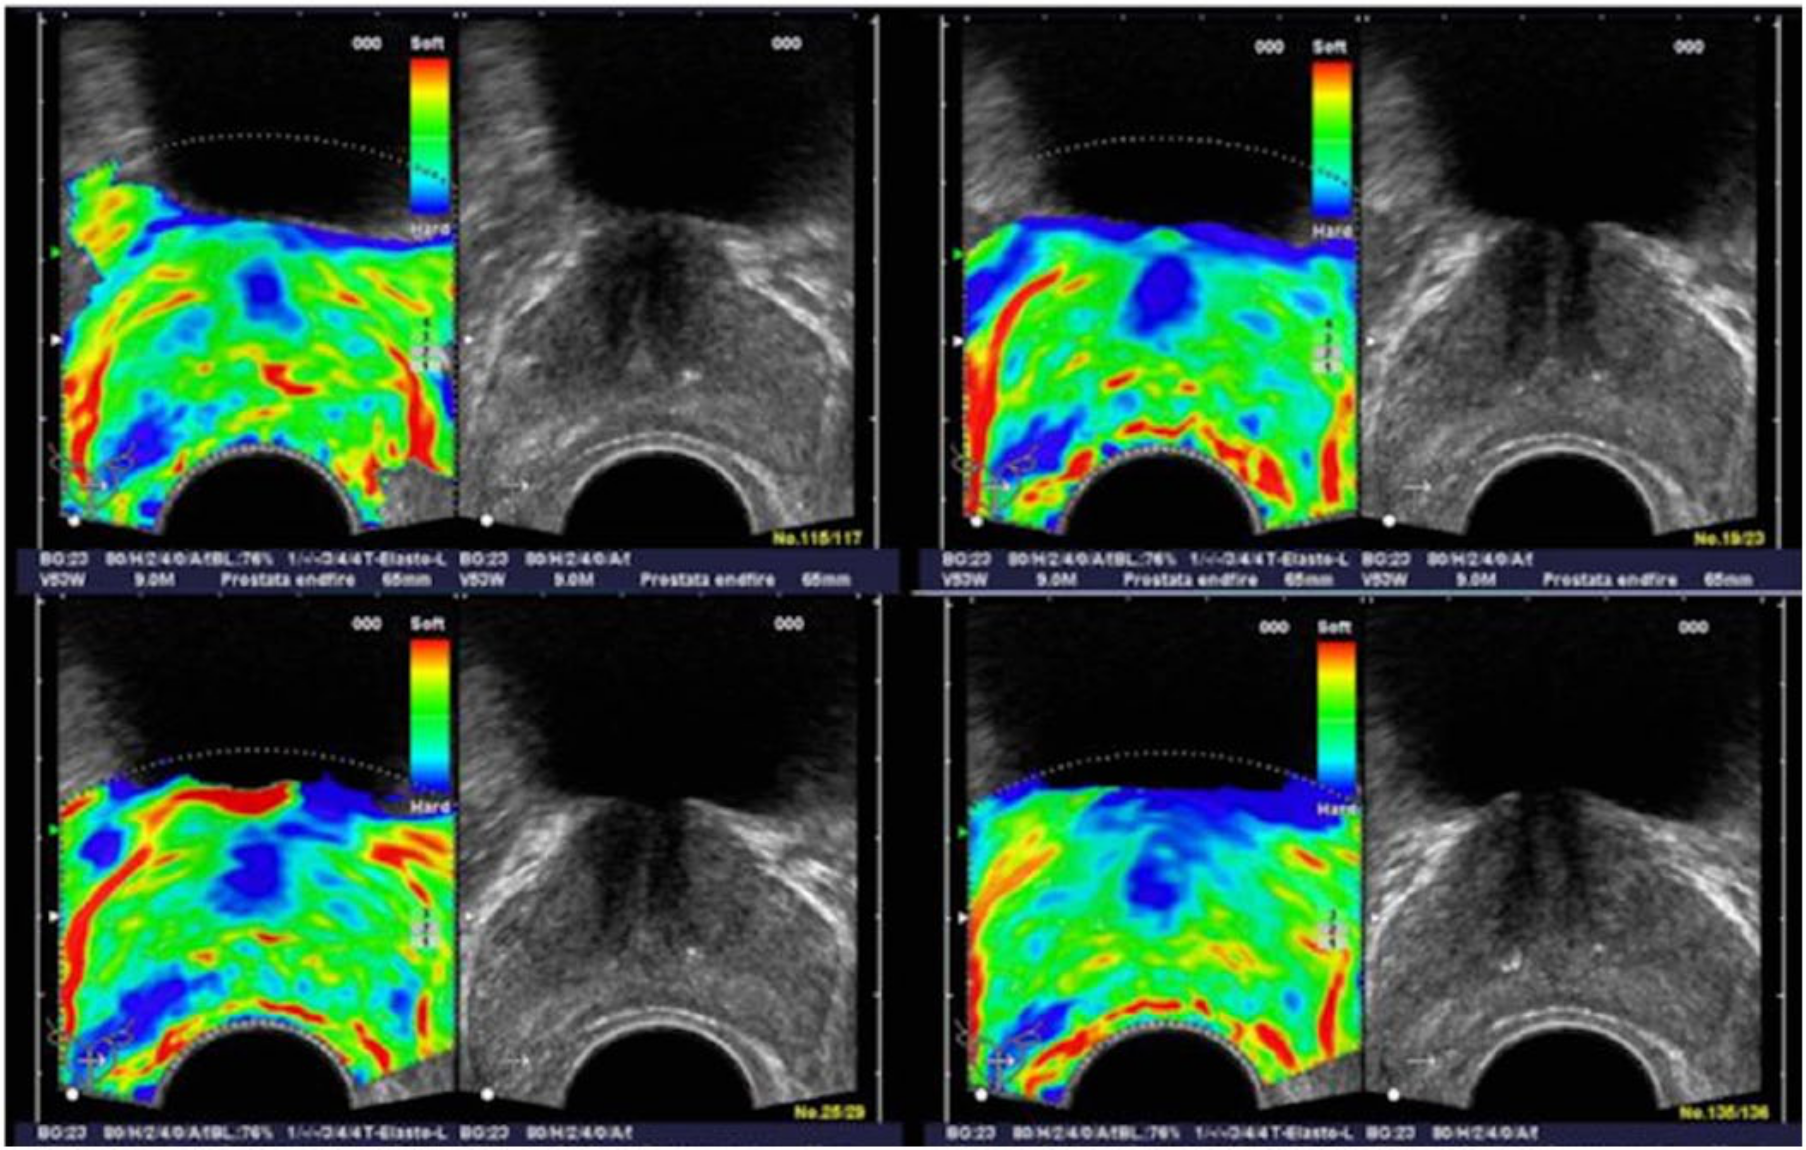
A series of elastographic and corresponding gray-scale images in a patient with histologically confirmed prostate cancer in the right peripheral zone of the prostate. The elastographic examination showed a well-defined stiffer lesion on the patient’s right side (dark blue focal areas, lower left on the images). The peripheral zone on the patient’s left side showed normal stiffness (green). (Reprinted with permission from Elsevier from Pallwein L et al: Comparison of sonoelastography guided biopsy with systemic biopsy: impact on prostate cancer detection. Eur J Radiol 2007;17:2278–2285.)
Elastography Stiffness Scoring System. a
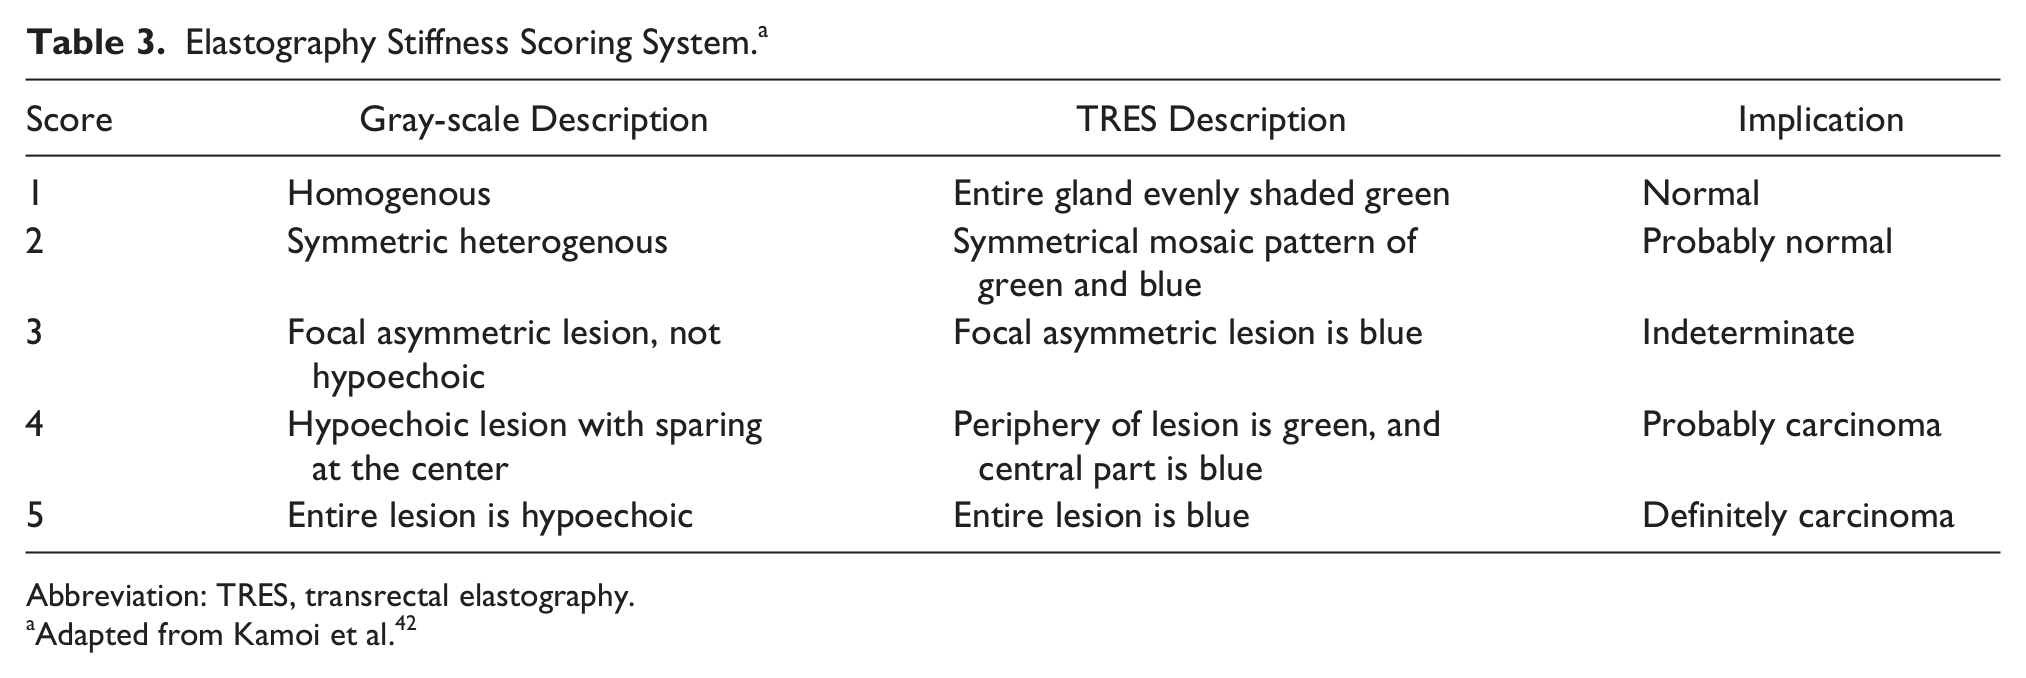
Abbreviation: TRES, transrectal elastography.
Adapted from Kamoi et al. 42
Detection Rate per Patient
Per-patient results for TRUS-guided biopsy compared with TRES-guided biopsy are shown in Table 4. For studies that compared TRUS versus TRES biopsy, sensitivities ranged from 15% to 84% for TRUS and 51% to 92% for TRES.42-52 Specificities ranged from 43% to 92% for TRUS and from 60% to 87% for TRES.42-46,50,51 PPVs ranged from 11% to 70% for TRUS and 13% to 68% for TRES.42-46,48-51 NPVs ranged from 38% to 83% for TRUS and from 46% to 93% for TRES.42-46,48-51 When the modes were used concurrently,42,44,50,53 sensitivities ranged from 62% to 68%, specificities from 68% to 91%, PPV 50% to 53%, and NPV 79% to 86%. Zhang et al. 53 noted that the combination of both TRUS and TRES biopsy showed a decreased sensitivity and NPV—79% and 85%, respectively—compared with TRES alone: 89% and 85%, respectively. The specificity, PPV, and overall accuracy increased when the modes were combined. 53 Diagnosis rates for TRUS biopsy alone varied from 19% to 69%, whereas diagnosis rates for TRES alone ranged from 21% to 50%.44,45,47-49,51
Per-Patient Validity of Conventional TRUS-Guided Biopsy Results Versus TRES-Guided Biopsy Results for Prostate Cancer. a
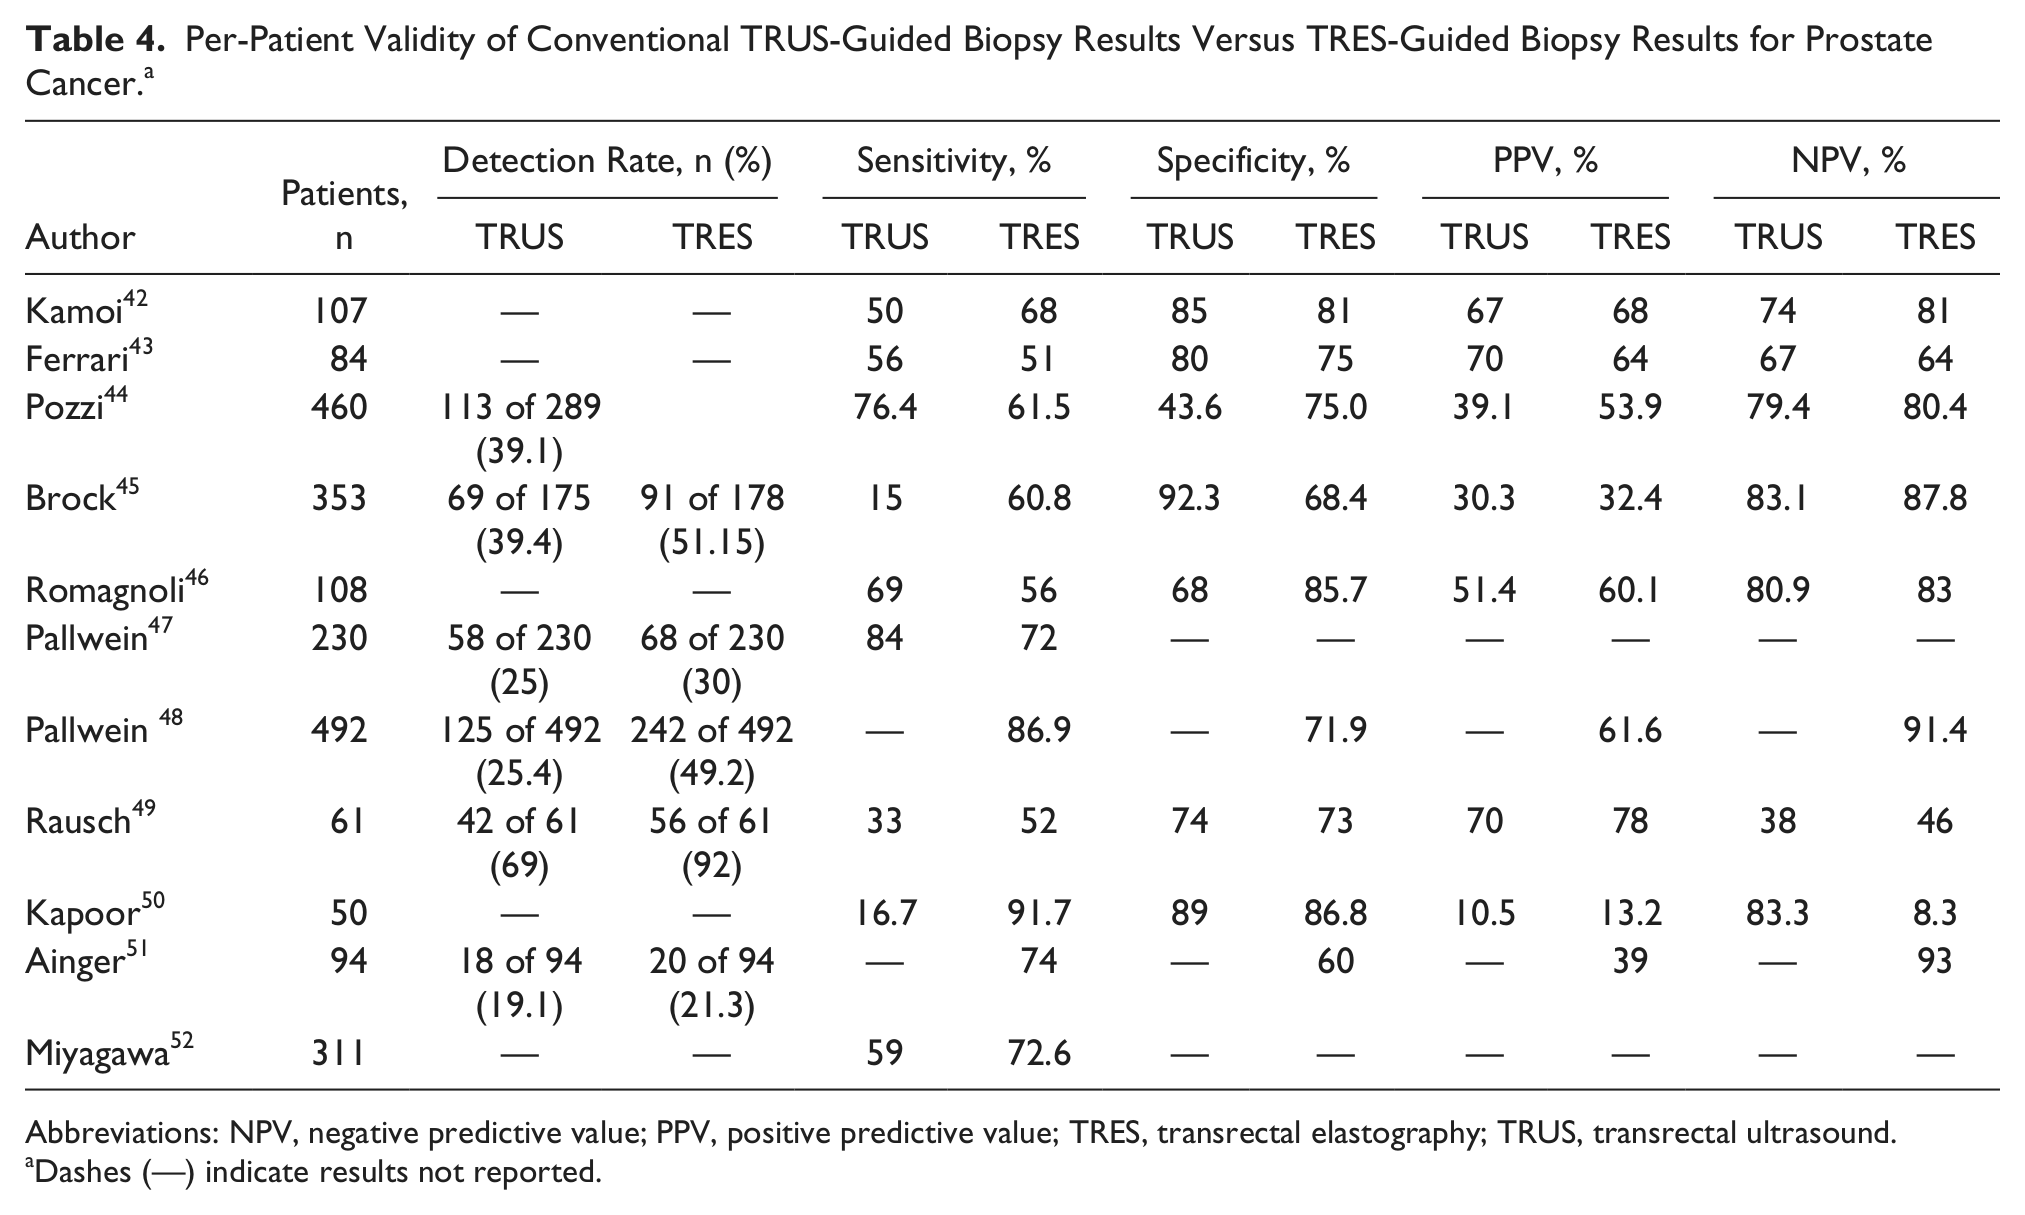
Abbreviations: NPV, negative predictive value; PPV, positive predictive value; TRES, transrectal elastography; TRUS, transrectal ultrasound.
Dashes (—) indicate results not reported.
When Pozzi et al. refined their analysis by calculating the validity for physicians who were more experienced, the sensitivity improved from 80% to 91%, thus demonstrating that operator skill can influence the reliability of the examination. 44 Although the specificity 44 declined from 65% to 57% and PPV had virtually no change, NPV improved from 87% to a 93%. Pallwein et al. found that the best sensitivities and specificities for TRES biopsy occur when it is used to biopsy the peripheral zone but that the sensitivities and specificities are lower for other regions. 48 When biopsy is attempted in other areas, such as the midgland or the apex, TRES biopsy is significantly more likely to identify suspicious lesions over TRUS. 48
Detection Rate per Core
The results of the studies that reviewed validity of TRUS versus TRES biopsy on a per-core basis are shown in Table 5. On a per-core basis, the sensitivities of TRUS biopsy range from 16% to 33%, compared with 25% to 74% for TRES biopsy.11,49-51 The specificities11,43,49-51 for TRUS biopsy range from 74% to 100%, compared with 60% to 100% for TRES biopsy. The reported PPV for TRUS biopsy11,42,43,49 ranged from 26% to 70%, compared with 20% to 78% for TRES.11,42,43,49,51 NPVs ranged from 38% to 88% for TRUS biopsy and from 46% to 93% for TRES.11,42,43,49,51 When per-core detection rates are compared, TRES biopsy has a significantly higher detection rate,11,47,49-51 ranging from 13% to 66% versus 5% to 36% for TRUS alone.11,47,49,50 The odds ratios ranged from 1.82 to 4.7 in favor of TRES biopsy.11,51 Furthermore, TRES biopsy had a higher PCa detection rate while obtaining fewer sample cores than TRUS.45,47
Per-Core Validity of Conventional TRUS-Guided Biopsy Results Versus TRES-Guided Biopsy Results for Prostate Cancer. a
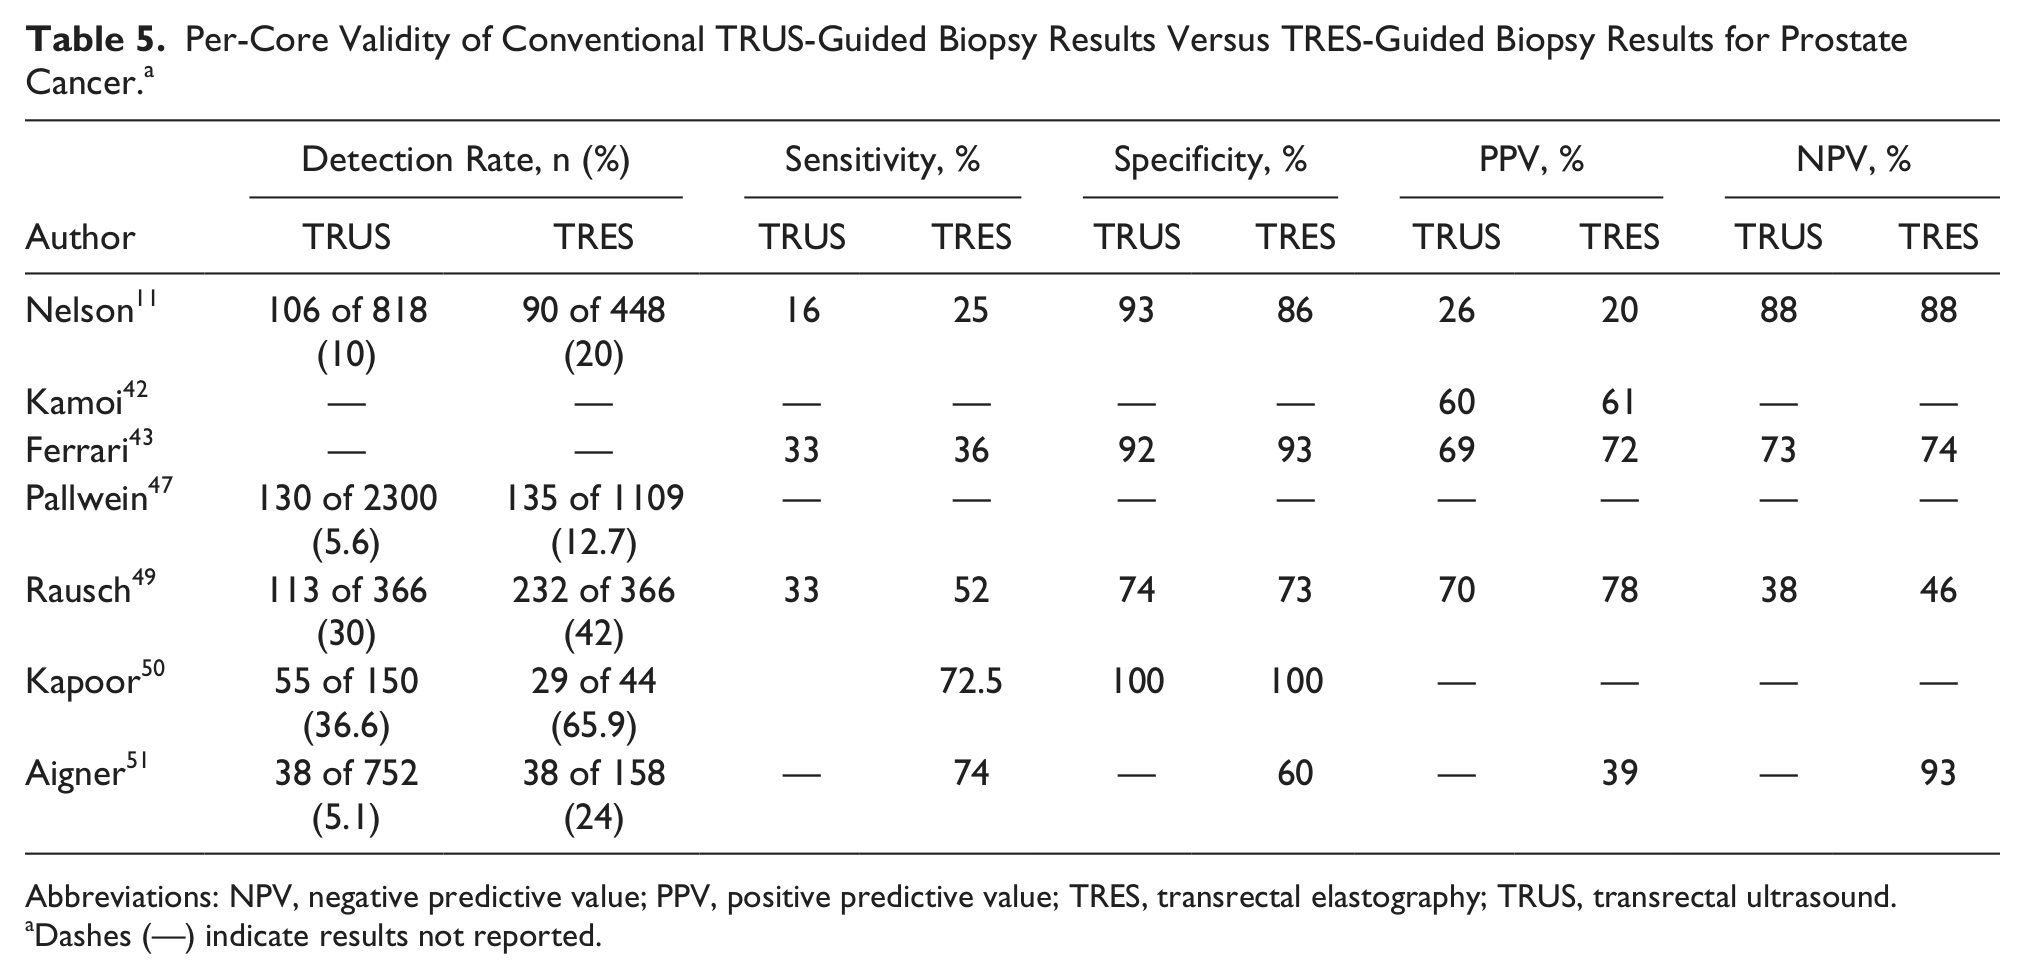
Abbreviations: NPV, negative predictive value; PPV, positive predictive value; TRES, transrectal elastography; TRUS, transrectal ultrasound.
Dashes (—) indicate results not reported.
Gleason Score
Brock et al., Pallwein et al., and Ainger et al. did not detect significant differences in the Gleason scores between the TRUS and TRES biopsy groups; however, TRES biopsy has shown to be accurate for Gleason scores ≥7.45,47,51 The TRES biopsy sensitivity41,42,47,51 ranged from 78% to 100% in detecting PCa with Gleason grade ≥7 and from 86% to 100% for grade 9. Although TRUS biopsy had higher odds ratios for detecting higher-grade cancer as compared with TRES biopsy, regardless of Gleason scores, the trend is that the odds ratio for TRES biopsy increases as the Gleason scores increases. 11
TRES Effectiveness
Difficulties with TRES biopsy include the inability to compress the central and transitional zones, and tumors that are deeper than 5 cm or are located in the lateral portion of the sonographic image may not be adequately assessed. 48 A stiffness artifact can occur laterally, requiring skillful transducer manipulation to overcome it.41-43,48 The end-fire transducer may not provide for the best compression technique, but it is the most commonly used transducer format in prostate imaging. The examiner may need up to 6 months of training to learn the appropriate compression techniques, although shear wave technology could overcome some of the operator-dependent nature of TRES. 42
Calcifications, inflammation, and hypertrophy all demonstrate increased tissue stiffness, which leads to high rates of false-positive findings.41,47,48,51 The sensitivity of TRES decreases as the prostate size increases. 53 Smaller lesions (<5 mm) may not be seen by TRES, where the false-negative rates were as high as 40% in the studies reviewed, and elastography techniques do not provide a solution when PCa lesions are not visible by gray-scale or color Doppler.11,43,47,51 Finally, certain classes of PCa, such as mucinous, transitional cell, and carcinoid, are known to have more compliance and may not show positive elastographic findings. 42 Reported research results are inconsistent in whether TRES detected PCa with higher Gleason scores, and no researcher concluded that TRES alone could replace the systematic TRUS biopsy. All researchers agreed that TRES, as an addition to the TRUS biopsy, could improve the detection rates of cancer while reducing the cores needed.41-53
Discussion
In absence of a true meta-analysis of the available literature, it is difficult to determine if TRES biopsy or CE TRUS biopsy is quantitatively better at detecting PCa. The sensitivities, specificities, PPVs, NPVs, and accuracy ranges are comparable between the two techniques. In studies that compared TRUS with CE TRUS, the standard TRUS had diagnosis rates no higher than 26%, whereas CE TRUS had diagnosis rates as high as 100%; furthermore, the CE TRUS study with the lowest detection rate (24%) was comparable to the highest detection rates reported in TRUS.33,35 Sensitivities for CE TRUS18,33 are as high as 100% when compared with the highest reported sensitivity with TRUS, at 78%. The PPVs and NPVs appeared to be higher with CE TRUS, with the highest at 89% for PPV and 100% for NPV. 33 The highest sensitivity (100%) and highest NPV (99%) for CE TRUS demonstrate that CE TRUS meets the criteria as a test with improved ability to detect PCa while minimizing the number of false positives; it also shows a definite improvement over the traditional TRUS biopsy. 33
In studies that compared TRUS with TRES, the highest achieved TRUS sensitivity was 84%, and the highest achieved TRES sensitivity47,50 was 92%. However, in terms of specificities, TRUS achieved the highest specificity at 93%, compared with 87% for TRES.45,50 The highest achieved PPV was 68% for TRES and 70% for TRUS, whereas the highest NPV was 93% for TRES compared with 83% for TRUS.42,43,45,51 Although TRUS performs better in specificity and PPV, TRES performs better in sensitivity and NPV, indicating that TRES will have fewer false-positive findings and so meets the criteria for a test that could reduce the number of false-positive findings.
The highest CE TRUS sensitivity was 100%, compared with 92% for TRES, and the second-highest CE TRUS sensitivity was 90%, compared with 87% for TRES.33,36,48,50 Specificities were closer for the two modes, with the highest reported at 86% for CE TRUS and 87% for TRES.50,52 CE TRUS 33 reported the highest PPV at 89%, and the highest reported for TRES 42 was 68%. The highest reported NPV was 100% for CE TRUS, compared with 93% for TRES.33,42 Although it appears that CE TRUS achieves higher overall validity, especially in sensitivity and NPV, a research study designed to compare the two methods is required to ascertain whether one is superior to the other.
For studies that compared the Gleason scores, the TRUS versus CE TRUS results were split, with similar numbers of studies finding differences and no differences.18,31,33,36,38 The TRUS versus TRES findings had a similar split, with three studies finding no difference and two finding a difference.11,42,43,47 However, among the TRES groups that found no statistical difference in Gleason scores, two studies reported 100% detection rate for grades ≥7.47,51 Neither method as a stand-alone technique can replace the TRUS systemic biopsy, but the addition of either technique to the TRUS biopsy appears to improve PCa detection rates, especially for those cancers that are grade ≥7.
The primary barrier preventing CE TRUS from becoming routine practice in the United States is the lack of FDA approval for contrast agent use in general sonography. Lack of familiarity with the technique and the learning curve associated with it could impede its widespread acceptance should contrast agents be approved for this purpose. Some of the barriers that prevent TRES from becoming routine practice are the lack of consistent reproducibility and an agreed-upon standard on how to quantify the stiffness of the tissue, particularly when benign disease is present. While elastography is available for use in the United States, it is unclear how many practices are routinely using it, as there is a cost associated with adding the software to existing equipment. Operator expertise may affect the ability to obtain accurate results, and it is unclear how many sonographers or sonologists are currently skilled in the technique.
Conclusion
Imaging of the prostate gland has many limitations, and no one technique has been shown to be consistently superior. Both TRES and CE TRUS are less effective when benign disease is present, but the available evidence suggests that the addition of either technique can improve the standardized TRUS biopsy, yielding detection of higher-grade cancers with fewer core samples. Given the lack of FDA approval for contrast agent sonographic imaging of the prostate, elastography appears at present to be the most viable complementary sonographic screening technique available in the United States. Its addition to the current TRUS-guided biopsy has been shown to improve the detection of high-grade PCa in conjunction with the current screening methods.
Footnotes
Declaration of Conflicting Interests
The authors declared no potential conflicts of interest with respect to the research, authorship, and/or publication of this article.
Funding
The authors received no financial support for the research, authorship, and/or publication of this article.