
Abstract
A prospective cohort of 47 symptomatic patients who reported for nerve conduction studies and 44 asymptomatic controls was examined with sonography to evaluate the median nerve. Doppler studies of the median nerve were collected with handheld sonography equipment and a 12-MHz linear broadband transducer. Strict inclusion criteria were established for assessing 435 waveforms from 166 wrists. Two sonographers agreed that 245 waveforms met the a priori criteria and analyzed the corresponding data. Spectral Doppler waveforms provided direct quantitative and qualitative data for comparison with indirect provocative testing results. These Doppler data were compared between the recruitment groups. No statistical difference existed in waveforms between the groups (P < .05). Trending of the overall data indicated that as the number of positive provocative tests increased, the mean peak systolic velocity within the carpal tunnel (mid) also increased, whereas the proximal mean peak systolic velocity decreased. However, by using multiple provocative tests as an indirect comparative measure, researchers may find mean peak spectral velocity at the carpal tunnel inlet a helpful direct measure in identifying patients with carpal tunnel syndrome.
Median mononeuropathy (MMN) of the wrist, also known as carpal tunnel syndrome (CTS), is the most common nerve compression disorder of the upper extremity. CTS has been reported to affect 1% of the general population and 5% of those working in vocations that require repetitive movements of the hand and wrist. 1 A retrospective study of 8224 Washington state workers’ compensation cases provided evidence that those patients diagnosed with CTS, followed by surgery, had a shorter disability period. 2 This large cohort study underscores the importance of early detection and intervention.
The carpal tunnel is a space in the wrist that is created by the transverse ligament superiorly and the carpal bones inferiorly. In the distal forearm, the median nerve joins with the common flexor tendons of the fingers, traveling together into the carpal tunnel. The median nerve innervates the palmer portion of the lateral hand, digits I to III, and a portion of digit IV. Narrowing of the space within the tunnel can cause compression on the median nerve, leading to entrapment neuropathy of the median nerve. 3 In addition to idiopathic compression, CTS can also be caused by several other systemic diseases such as rheumatoid arthritis, hyperthyroidism, acromegaly, and diabetes mellitus. 3 Early CTS symptoms, including tingling in the thumb and index finger, are often noticed at night due to clenching of the hands and wrists during sleep. These symptoms increase and begin to occur during the day, with eventual loss of motor function in the hand as the condition becomes chronic.
Obtaining a more direct assessment of the median nerve would require being able to document physiologic changes occurring within the median nerve. In the acute phase of nerve compression, inflammation and associated hyperemia occur around the nerve. However, these subtle changes can go unnoticed by the patient. 4 Inflammatory changes result in swelling of the nerve and concomitant microtrauma as the nerve repetitively moves through a constricted space. Long-term insult to the nerve begins to diminish the perineural blood supply, causing the tissue to shrink and become fibrotic.
Blood pressure cuffs were used to indirectly measure volume changes in the upper extremity. 5 Volume changes in the limbs of 10 patients were compared to ratings of discomfort between affected and unaffected extremities. Discomfort was statistically greater in the limb with CTS symptoms and volumes that were enlarged. This indirect vascular change was attributed to increased vascularity due to the onset of inflammation surrounding the nerve.
The first direct measure of perineural vascular flow in the median nerve used a noncontact laser Doppler flow meter. Measurements were taken within the median nerve of eight CTS patients proximal to, in the midregion of, and distal to the transverse carpal ligament. 6 In these eight patients with CTS symptoms, diminished perineural vascular flow was recorded presurgery, and increased flow was restored after carpal tunnel release surgery.
More recently, power Doppler has been used to determine the level of inflammation around the nerve. One study compared power Doppler images from 26 patients with systemic lupus erythematosus to a matched control group. 7 In contrast to the previous study, which used a flow meter to identify decreased flow due to CTS, the researchers detected inflammation using power Doppler in 9.6% of the patient group while providing no evidence of change in the control group. 7 Similar to lupus, leprosy is a disease with graded effects on swelling within the peripheral nerves. Sonographic evaluation was completed on the median nerves of 20 patients with leprosy and 30 healthy, age-matched volunteers. 8 In patients with leprosy, nerves demonstrated increased color Doppler displays in the endo/perineurium. After completion of all sonographic image analysis, 25% of enlarged median nerves were solely selected based on the color Doppler data. These Doppler data were highly correlated with nerves that were judged to be clinically enlarged versus smaller, healthy control nerves. 8
Archived images from 206 wrists of 151 patients who presented with CTS symptoms further support the use of color Doppler for detecting inflammation in a patient population. 9 Color Doppler images, obtained with a 7- to 15-MHz transducer and a pulse repetition frequency (PRF) of 0.8 KHz, were categorized as demonstrating either vascular flow or no vascular flow. Hypervascular activity within the median nerve was 95% sensitive and 91% accurate for diagnosing CTS, with a positive predictive value of 94%. 9 This is the only study that has provided an adequate sample for the generalization of Doppler data; however, this study was a retrospective analysis, and therefore validity and reliability of measures are suspect. Furthermore, even though depicted in sample images, no quantitative measurement of the vascular flow was recorded or analyzed.
Quantitative data have been collected via a needle sensor inserted directly into the median nerve. Pre- and postmeasures of blood flow were taken using Doppler in 15 patients with CTS at the time of surgical release of the transverse carpal ligament. 10 Provocative tests (Tinel’s and Phalen’s) were conducted on all patients to determine the amount of flexion that exacerbated symptoms. These degrees of flexion were used during surgery to position the patients for recording vascular flow rates, both prior to and following surgical release. Increased flexion resulted in dramatic drops in blood flow rates within the nerve. Likewise, releasing the compression of the transverse carpal ligament from the median nerve increased the blood flow rate detected within the median nerve, regardless of flexion. This study raises important questions about the mechanism that may trigger vascular compression versus inflammation and increased perineural vascular flow within the median nerve in patients with CTS.
Development of the right combination of indirect and direct measures of the median nerve could expedite diagnosis and treatment of CTS. Although providing preliminary understanding of possible pathology, previous research on the use of Doppler as a direct measure is limited because of small and convenient samples, lack of high-quality prospective design, and limited quantitative data. This has led to conflicting evidence and lack of understanding of the pathophysiology between hypervascularization due to inflammation and decreased flow due to compression in CTS. To build on previous research, the following questions were evaluated to better understand the utility of spectral Doppler as a direct quantitative measure in CTS diagnostics: (1) Can spectral Doppler waveform analysis be used to detect differences in intraneural median nerve vascular flow of symptomatic and asymptomatic subjects? (2) How does this direct measure relate to indirect clinical provocative testing in determining CTS?
Materials and Methods
Data analyzed in this study was collected as a subset of a larger prospective study of patients who were being evaluated for carpal tunnel release surgery and asymptomatic volunteers who served as controls. The overall study was approved by The Ohio State University Institutional Review Board, and all participants provided written consent to participate in this research.
All the participants were scanned with one Logiq i hand-carried sonographic unit (GE Healthcare, Milwaukee, Wisconsin). A 12-MHz broadband linear transducer was used for all the sonograms, and an optimized preset program for gray scale and Doppler was developed to ensure that each study was of comparable technical quality. The dynamic range was set at 72 dB, and CrossBeam beam focusing was used on all cases.
Quality control (QC) was performed bimonthly using a tissue-mimicking phantom. Measurements were taken to ensure accuracy in maximum penetration, axial resolution, and lateral resolution. Technical factors, such as frequency (12 MHz), power output (100%), and B-mode gain (66) remained constant during the QC testing to ensure reproducibility of measurement and image uniformity. QC data were collected and evaluated by the same sonographer (K.R.V.) to reduce measurement error.
The laboratory protocol for scanning the carpal tunnel region was piloted and has been previously described by the authors, as well as Bianchi and Martinoli 4 and Roll and Evans. 11 Spectral Doppler waveforms were collected throughout the entire carpal tunnel region. Boundaries of the region were defined by anatomic landmarks. The region proximal to the carpal tunnel inlet was identified as the region immediately proximal to the distal edge of the radius. The mid–carpal tunnel region included the area anterior to the lunate and capitate bones. The distal carpal tunnel outlet was identified as the area of the median nerve immediately distal to the capitate bone. Images were collected by two researchers (K.D.E., S.C.R.) with training in scanning of the median nerve. The spectral waveforms were generated based on the power Doppler streaks that appeared within the median nerve. The pixels, indicating low volume flow, were interrogated without angle correction, as these vessels were too small to gauge their direction. Angle correction is only possible when a discernable vessel is seen, which is similar to obtaining velocity measurement in a transcranial Doppler examination.
All Doppler waveforms collected were reviewed by a pair of sonographers (K.D.E., K.R.V.). These evaluators were blinded to subject group designation, nerve conduction results, provocative testing results, and gray-scale sonographic study results. Every duplex waveform was reviewed based on a priori inclusion criteria. Consensus by the evaluators was needed to proceed with the evaluation. The criteria were as follows:
Must have at least three cardiac cycles in the sample
Must have the spectral Doppler gate positioned within the median nerve
Must have more than some pulsatility, which would mean that the waveform has consistent positive deflections throughout the spectral segment
Must have an optimized gray-scale image
Must have more signal than noise in the spectral waveform tracing
The peak systolic and end diastolic velocity for every included waveform was recorded by automatic trace. In waveforms in which automatic trace did not accurately capture systolic peaks, the trace was manually corrected. The morphology of each included waveform sample was evaluated as low, moderate, or high pulsatility, as outlined by Zwiebel and Pellerito. 12 When multiple values were recorded at the same anatomical location within the nerve of one participant, the arithmetic average was calculated for peak systolic and end diastolic velocities for use in subject-level analysis.
Provocative testing of participants, as completed in clinical practice, was conducted to obtain an indirect measure of CTS symptoms (Figure 1). Sensory dysfunction, perceived as increased numbness, tingling, and discomfort in the distribution of the median nerve of the hand, is a positive indication for CTS for each of these tests. The Tinel sign is elicited by delivering light taps over the carpal tunnel of the hand/wrist. The Phalen maneuver requires that the participant hold both wrists in a fully flexed position for 20 to 30 seconds. Durkin’s test involves the participant holding the wrist palmar side up while the examiner applies pressure directly over the carpal tunnel region for 15 to 20 seconds. Although these tests rely on the person’s ability to self-report symptoms accurately, this is a standard diagnostic screening of CTS, and studies have shown a high correlation between these clinical tests and a positive diagnosis. 13
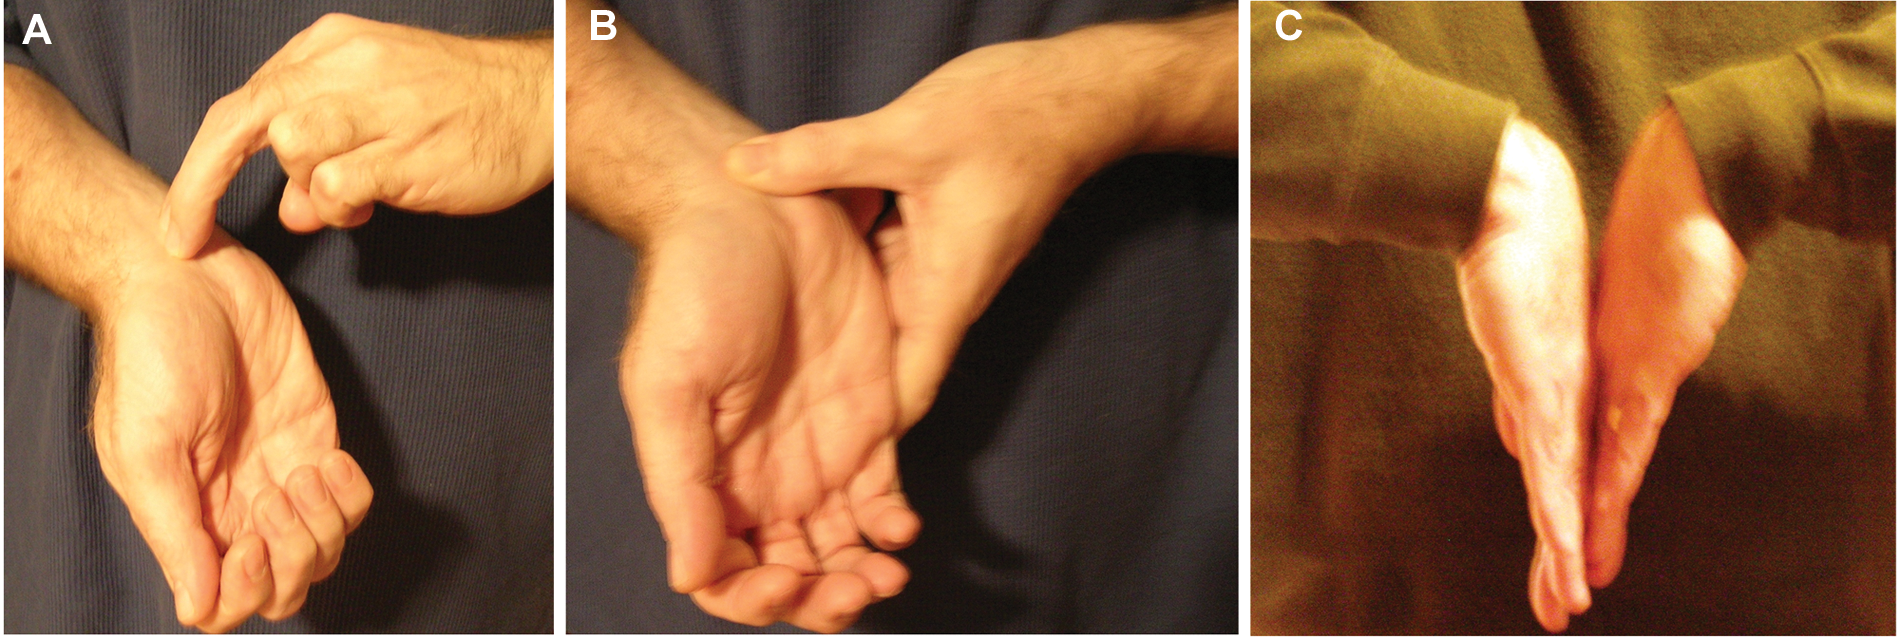
Provocative tests executed in a primary care office to screen for carpal tunnel syndrome (CTS). (a) Tinel’s test is positive after tapping over the wrist crease elicits tingling in the hand and fingers. (b) Durkin’s test is positive when pressure on the carpal tunnel for 20 to 30 seconds causes symptoms in the median nerve distribution in the hand and fingers. (c) Phalen’s maneuver is positive when tingling in the first three fingers is elicited by placing the back of the hands together with both wrists flexed for 20 to 30 seconds.
SPSS version 17.0 (SPSS, Inc, an IBM Company, Chicago, Illinois) was used to generate descriptive and comparative statistics for demographic information, provocative test results, quantitative/qualitative waveform data, and Doppler averages. The number of valid waveforms obtained in each region was counted, and frequencies were compared between regions and between groups. Mean systolic peak and end diastolic velocities were calculated within each region for both groups. Chi-square and Student t test were used to evaluate differences between the symptomatic and asymptomatic groups on all demographic variables, provocative test results, and Doppler data (P < .05). Systolic peak velocities were evaluated based on the number of positive provocative tests across all participants, and best-fit trend lines were applied to describe the data.
Results
Descriptive Results of the Participants
Of the 95 participants who were recruited and consented for participation in this study, images were retained on 47 symptomatic participants and 44 asymptomatic (91) participants. Bilateral wrists were scanned in all participants, with the exception of those who had a history of previous wrist fractures, surgeries, carpal tunnel releases, or other diagnoses that may contribute to median nerve pathology unrelated to idiopathic CTS. Images from 83 wrists in both groups (166 total) were included within the study. Statistical differences (P < .05) were noted in the demographic data between the symptomatic and asymptomatic groups based on age, body mass index, and symptom duration. The groups did not differ by gender or hand dominance. Descriptive information is presented in Table 1.
Descriptive Information Generated for Research Participants Segregated by Group
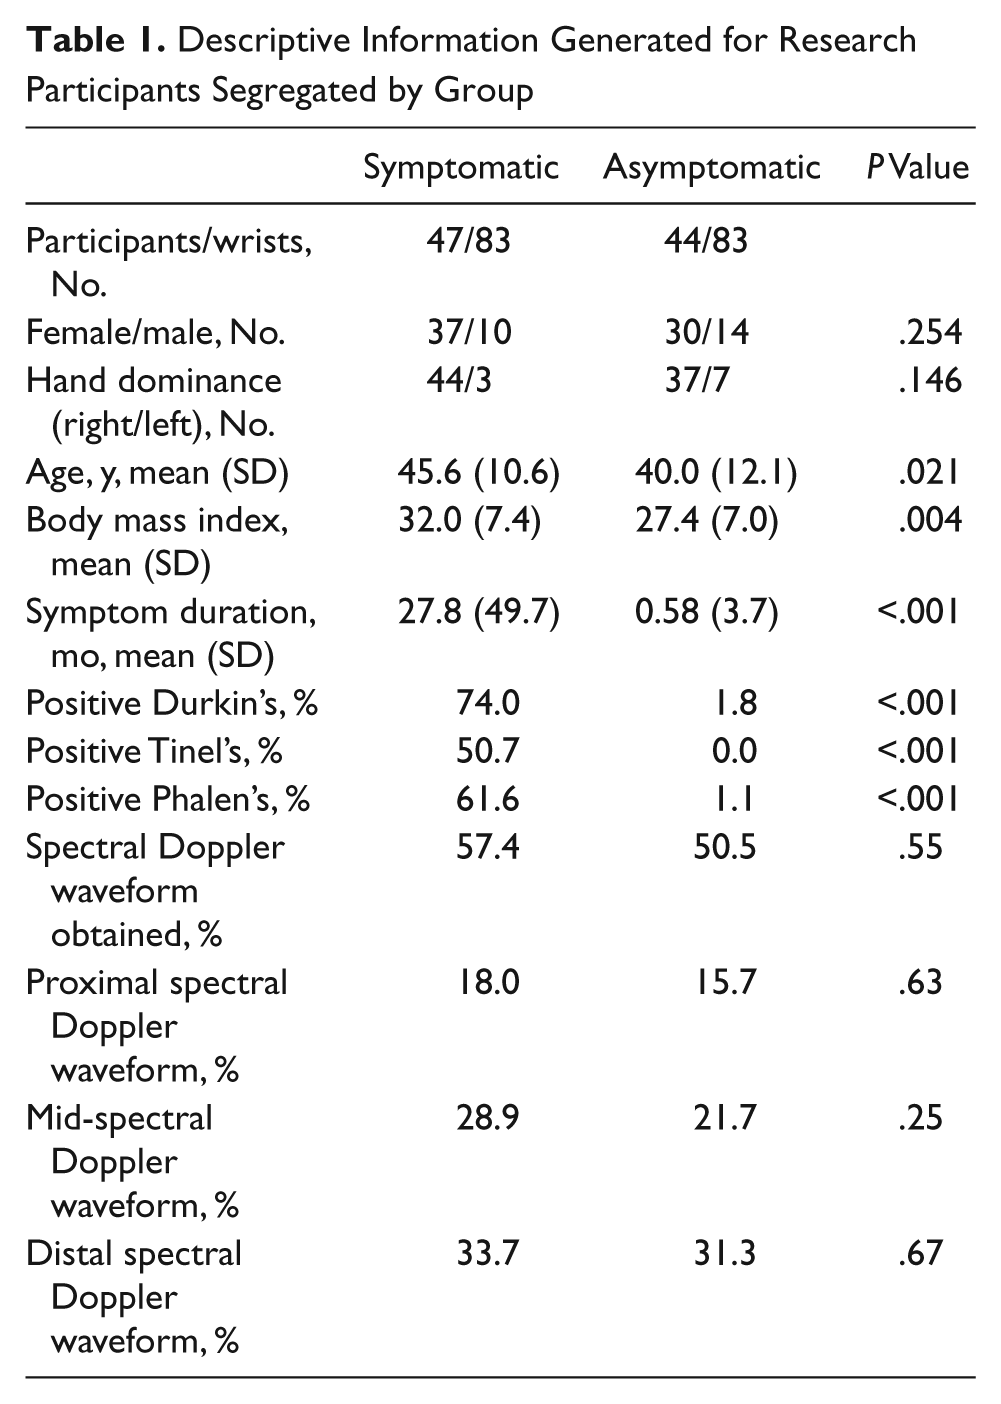
Provocative testing results were reported at the subject level, which allowed for each test to be recorded individually (Phalen’s, Tinel’s and Durkin’s). In the symptomatic group, 61.6% were positive for Phalen’s test, 50.7% were positive for Tinel’s test, and 74% were positive for Durkin’s test. In the control group, one individual was positive for Phalen’s and Durkin’s tests, and none were positive for Tinel’s test. To obtain the maximum benefit for providing these provocative tests as an indicator of CTS, 1 point was given for each positive test. The distribution of participants based on provocative testing results is displayed in Figure 2.
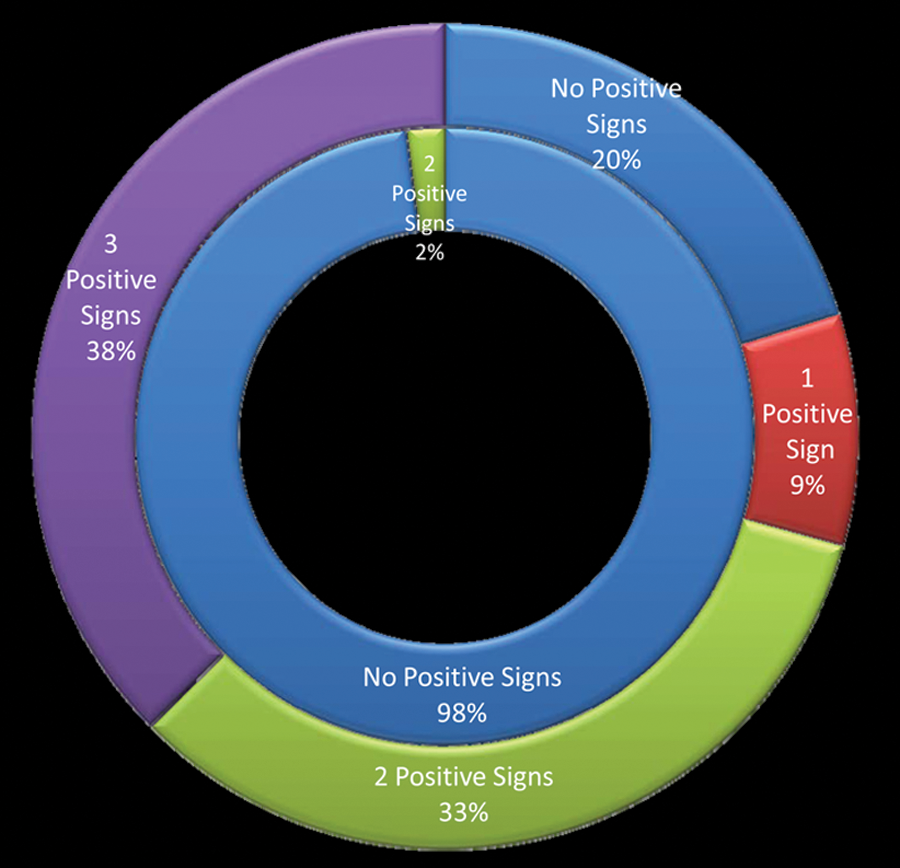
Distribution of symptomatic patients (outer ring) and asymptomatic controls (inner ring) by number of positive provocative tests.
Inclusion of Waveforms
Retrospective analysis using a priori criteria was completed on 435 spectral waveforms. Each inclusion criterion was applied to all the waveforms, and this resulted in the elimination of 119 waveforms. A flow diagram is provided to describe the inclusion process (Figure 3). Although a waveform would be disqualified by any one exclusion criterion, in some cases a sample waveform had more than one error and therefore was dismissed for multiple reasons. Therefore, because criteria in excluding waveforms for analysis are not mutually exclusive, the sum of all individual exclusions is greater than the total number of waveforms excluded. Problems were noted in waveforms that appeared to have been taken without evidence of power Doppler on the saved image and showed no evidence of flow within the spectral gate. Because these issues were noted during the review, an additional 71 waveforms were subtracted from the 245 formative waveforms retained. Removing these 71 waveforms, which did not appear to be clearly taken within the nerve, provided a summative collection of 174 waveforms to analyze.
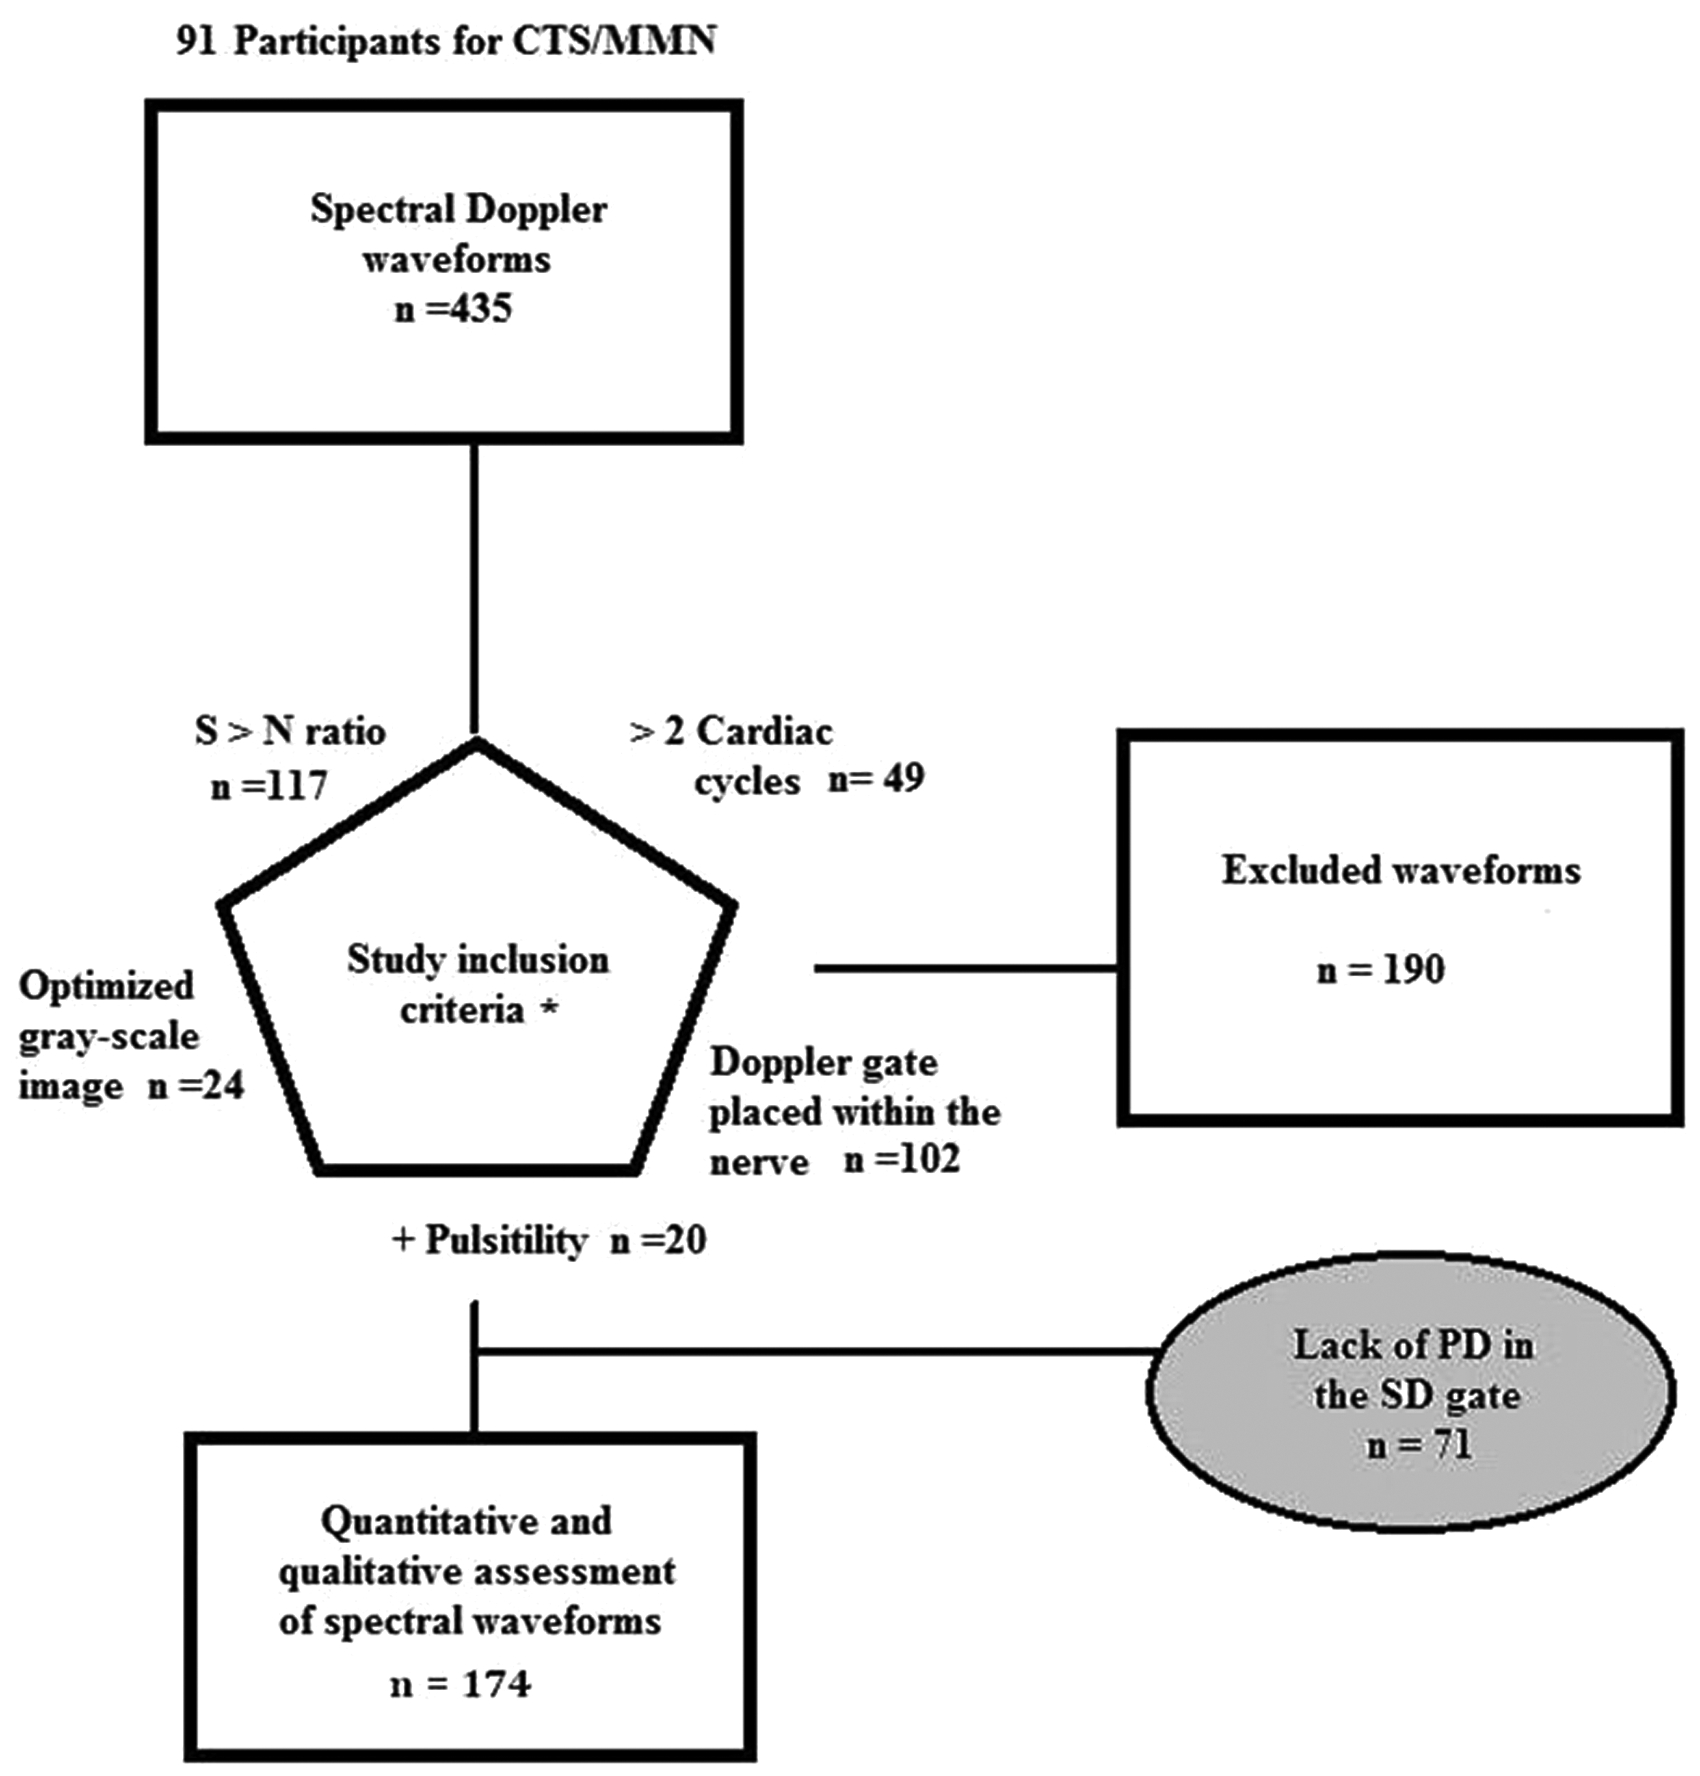
Flowchart for inclusion and assessment of Doppler waveform morphology and quantitative data points. CTS, carpal tunnel syndrome; MMN, median mononeuropathy; PD, power Doppler; SD, spectral Doppler; S > N, signal to noise. *Criteria are not mutually exclusive, with some waveforms failing multiple criteria; numbers following each criterion indicate the count of waveforms that did not meet that inclusion criterion.
Descriptive Results of Waveforms
A total of 245 acceptable spectral waveforms were retained for analysis from both symptomatic and asymptomatic participants. The mean (SD) peak systolic velocity for the included waveforms was 4.42 (2.15) cm/s (range, 1.22–14.31 cm/s), and the mean (SD) end-diastolic velocity for the included waveforms was 0.65 (0.62) cm/s (0–3.38 cm/s). Within the included waveforms, 97.6% demonstrated both spectral broadening and forward flow into diastole. For power Doppler, the mean pulse repetition frequency (PRF) was 0.46 KHz, and the mean overall gain was 20.35 dB. Spectral Doppler PRF mean was 1.87 KHz, and the average overall gain was 20.78 dB.
At the proximal location, 56 waveforms were recorded, with a mean (SD) peak spectral velocity of 4.44 (2.03) cm/s and a mean (SD) end-diastolic velocity of 0.78 (0.54) cm/s. At the midlocation, 87 waveforms were recorded, with a mean (SD) peak spectral velocity of 4.75 (2.22) cm/s and a mean (SD) end-diastolic velocity of 0.72 (0.72) cm/s. At the distal location, 102 waveforms were recorded, with a mean (SD) peak spectral velocity of 4.13 (2.12) cm/s and a mean (SD) end-diastolic velocity of 0.52 (0.56) cm/s. All waveforms were characterized as moderate, regardless of the portion of the nerve that was examined. Examples of the waveforms collected at the anatomical locations indicated can be reviewed in Figure 4a–c.
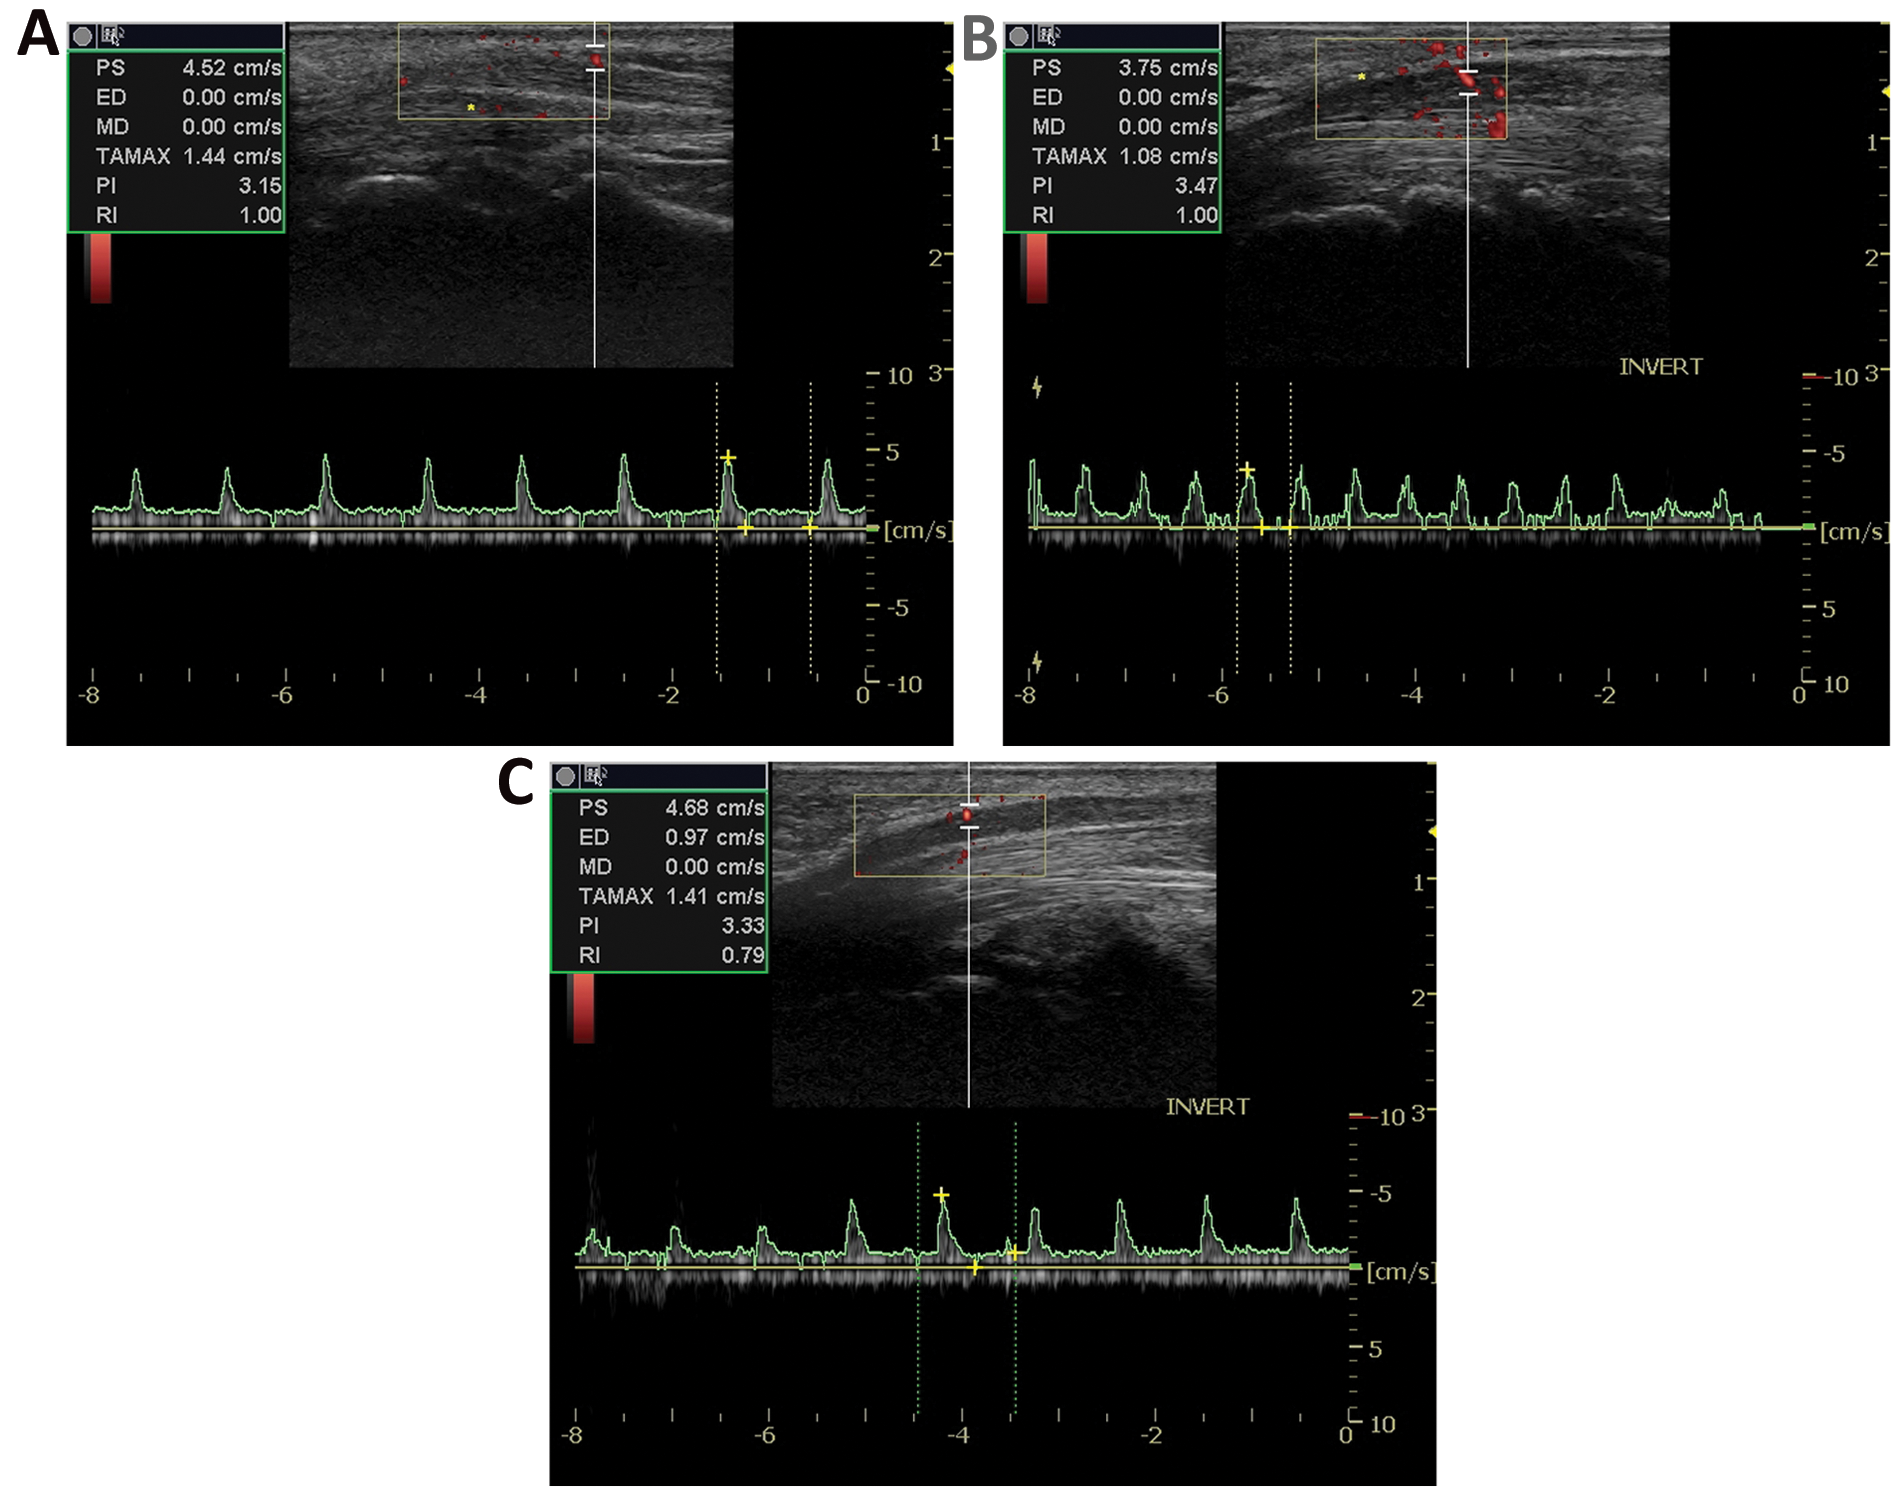
(a) Sample duplex examination of a carpal tunnel syndrome (CTS) participant with spectral tracing in the proximal portion of the median nerve (positioned above the wrist crease). (b) Sample duplex examination of a CTS participant with spectral tracing in the midportion of the median nerve (positioned at the wrist crease). (c) Sample duplex examination of a CTS participant with spectral tracing in the distal portion of the median nerve (positioned below the wrist crease).
Comparison of Waveforms Between Groups
In symptomatic patients, waveforms were retained in the proximal region in 15 participants, in the midregion in 24 participants, and in the distal region in 28 participants. In comparison, waveforms in asymptomatic controls were collected in the proximal, mid, and distal regions of 13, 18, and 26 participants, respectively. Although no statistical differences were noted between the frequencies of waveforms collected in the two groups using chi-square analysis, acceptable waveforms were most consistently identified in the distal region in both groups (see Table 1).
The mean (SD) peak systolic velocity collected distally from the symptomatic participants was 3.34 (0.94) cm/s, with a mean (SD) diastolic velocity of 0.79 (0.58) cm/s. This can be compared to a mean (SD) peak systolic velocity taken distally from the asymptomatic participants, which was 4.50 (1.64) cm/s, with a mean (SD) diastolic velocity of 0.81 (0.55).
Comparison of Waveforms to Provocative Testing Results
Vascularity recorded within the median nerve, using Doppler, at various locations was grouped by summated scores based on all the provocative tests provided across the entire subject sample. The mean peak systolic velocity was graphed for provocative testing categorization (Figure 5). Polynomial trending was used to create a curved line that could graph the velocity data in each region. A trend line is most reliable when its R2 value is at or near 1.0. 14 A good fit was found for the trend lines generated for the proximal (R2 = 0.87) and midregions (R2 = 0.83). As the number of positive provocative tests increased, the mean peak systolic velocity within the carpal tunnel (mid) also increased, whereas the proximal mean peak systolic velocity decreased. No identifiable linear, logarithmic, or polynomial trend could be established in velocity data from the distal region (R2 = 0.01). Because of the poorly distributed and small sample size across the four categories, no statistical analysis could be completed to determine if differences existed, by region, among the categories.
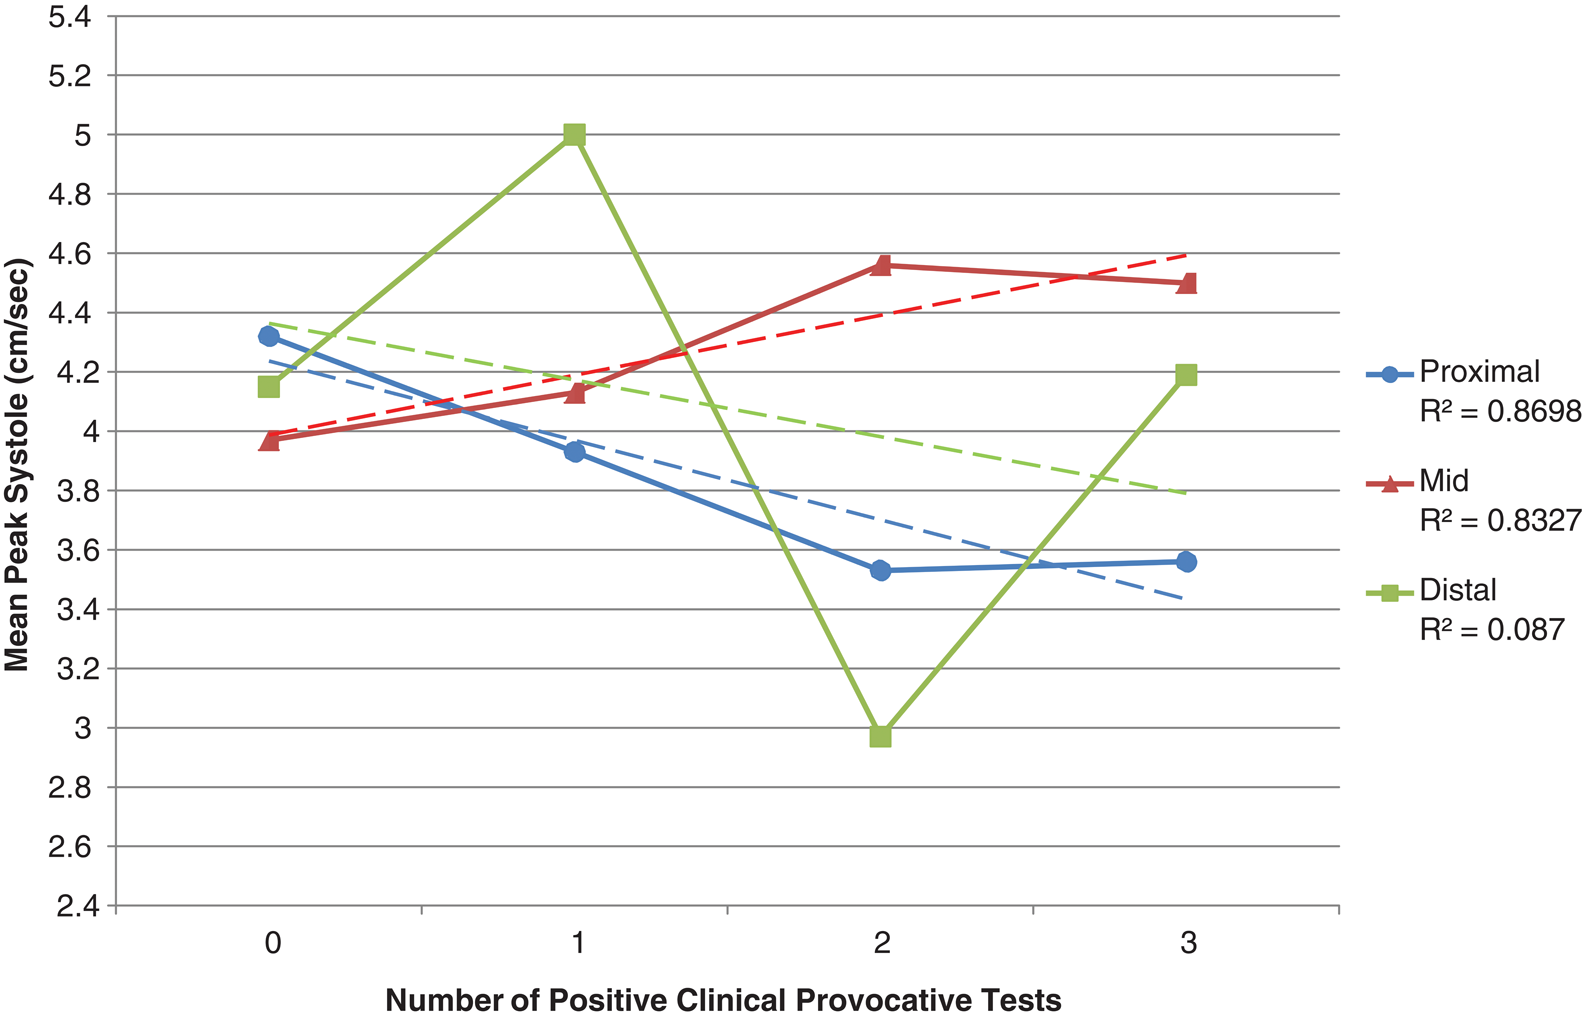
Mean spectral peak systolic measures for each location relative to the carpal tunnel by summation of positive provocative test results with linear trending (dashed line).
Discussion
This study represents the first attempt to use spectral Doppler measurements to screen for CTS. Although this study was unable to definitely provide direct evidence that spectral Doppler waveforms were sensitive enough to detect a difference between symptomatic and asymptomatic patients for CTS, a rigorous methodology for exploring intraneural vascular flow with power and spectral Doppler was established. In addition, the data indicate possible trends when comparing blood flow using Doppler to clinical screening tools. Measuring vascularity has the potential to detect inflammation and the acute stage of this entrapment neuropathy. Hyperemia within the median nerve could further result in swelling of the nerve, and continued entrapment could cut off the blood supply. As blood flow diminishes, the nerve would become ischemic and shrink in size. Continued exploration, comparing blood flow using Doppler and quantitative assessment of resulting waveforms, could develop a diagnostic gold standard for diagnosing CTS.
The relief of compression in the carpal tunnel has been shown to restore intraneural vascular flow 5 ; therefore, it continues to be important to explore a noninvasive, direct measure of vascular flow within the nerve. Magnetic resonance imaging (MRI) and sonography have been used to demonstrate the tendons, geometry of the median nerve, and retinacular bulge, but direct measures of the blood flow within the median nerve have been subjective at best. Several publications9,13,15 have provided images of spectral waveforms reportedly taken within the median nerve. However, no protocol for obtaining these waveforms was provided, and no criterion was reported to ensure that blood flow measurements using Doppler were taken within the median nerve instead of in the surrounding tissues. Mallouhi et al. 9 and Akcar et al. 16 successfully collected Doppler tracings within the carpal tunnel; however, these study reports lacked the detail necessary to replicate their results. The present study provides a detailed methodology for recording blood flow using Doppler, as well as a rigorous process for evaluating the validity of the waveforms for statistical analysis. This methodology for rigorously assessing intraneural blood flow with spectral waveforms is an important translational system that could affect clinical practice.
The second research question was the comparison of spectral waveforms captured within the median nerve, as well as the relationship of these direct measures to provocative testing results. A major pitfall in using provocative testing as the sole diagnostic tool is its low sensitivity for CTS.17,18 However, the use of provocative testing has demonstrated a high sensitivity to detecting tenosynovitis rather than CTS. 19
The current study may indicate some trends, but the lack of a clear directional relationship between Doppler and provocative testing reaffirms that these indirect tests may not be acceptable as a comparative diagnostic assessment. The data seem to indicate similarity in velocities across all regions for those individuals with no positive provocative test, although there was variability in the range of velocities. The distribution of the sample did not allow for statistical comparison of these differences, but the increasing and decreasing linear trends noted indicate that continued evaluation of blood flow velocities using Doppler is warranted.
A more reliable, continuous, quantitative variable would provide better statistical power to evaluate the relationship of Doppler measures to median nerve pathology. El Miedany et al. 19 advocate that nerve conduction studies (NCSs) should be considered the gold standard for CTS diagnosis. NCSs provide a direct measure of nerve pathology by recording velocity and amplitude of electrical impulses traveling through the nerve. NCS is considered the clinical gold standard for assessing physiologic changes that occur with CTS. 20 The continuous nature of NCS data would allow for more rigorous inferential statistics.
Limitations
This study is primarily limited by the retrospective design; however, because the collection of spectral waveforms within the median nerve is an innovative methodology, the protocol needs to be carefully designed for prospective research. Prospective data collection has great appeal, but methods must be scrutinized to avoid problems with internal consistency across the study data. With further testing, the methods introduced in this study could have important impact on the clinical practice of musculoskeletal sonography. In addition, although a large sample of adequate waveforms was generated in this study, the inclusion criteria demonstrated the difficulty in obtaining acceptable samples. Caution is given to the lack of angle correction inherent to the evaluation of intraneural vascular flow. For this reason, absolute velocity data were gathered, and this would not allow for further calculations such as ratios or indices. The reduced sample size, along with poor distribution, limited the statistical power and effect of the data analysis for this study. A final limitation to this study was the inability to document the duration of the patients’ symptoms, making it difficult to determine the stage of their development of the disorder. Continued collection of vascularity using Doppler from patients and matched control participants would strengthen the research design and improve the ability to generalize results.
Conclusions
This study evaluates a well-developed and refined musculoskeletal spectral protocol with a rigorous methodology for evaluating waveforms collected within the median nerve. It also demonstrated the feasibility of detecting vascular differences in various regions of the carpal tunnel with spectral Doppler. Last, this study highlighted the problems associated with using provocative testing for the assessment of CTS. A need exists to provide diagnostics for patients reporting CTS symptoms, and therefore further research is needed that uses a prospective design and a quantitative gold standard (i.e., NCS). Previous literature suggests that combining gray-scale sonographic dimensions of the nerve, Doppler for intravascular flow, and NCS could provide an increased level of sensitivity to detect CTS. Development of standard screening protocols for CTS needs to be explored and developed to increase diagnostic accuracy. Higher levels of research evidence are still needed to determine what combination of diagnostic tests should be recommended to clinicians.
Footnotes
Acknowledgements
The authors thank Brian R. Keller, BA, for assistance with manuscript preparation.
The authors declared no potential conflicts of interest with respect to the authorship and/or publication of this article.
The authors disclosed receipt of the following financial support for the research and/or authorship of this article: The authors thank GE Healthcare, Inc for its support of this research. Biostatistical support was provided by funds from The Ohio State University Center for Clinical and Translational Science.