
Abstract
A city’s capacity to withstand and recover from seismic events plays a crucial role in safeguarding the well-being of its residents. While numerous studies have investigated the recovery cost and time of buildings following earthquakes, the effects of soil and foundation have often been overlooked despite their known influence on seismic performance. This study addresses this gap by examining the possibility of optimizing the foundation size for low-rise concentrically braced frame (CBF) buildings, considering repair cost and recovery time as key performance indicators. For this purpose, one-, two-, and three-story steel buildings located in Vancouver, Canada, with X-bracing systems, are designed for two typical site classes, one representing stiff soil conditions near the site class C/D boundary, and the other soft soil conditions near the site class D/E boundary. Monte Carlo simulation is employed to incorporate uncertainties in the material properties, gravity loads, seismic demand, and the inherent damping of the structure. Nonlinear response history analyses are conducted at the design-level intensity using OpenSees. The foundation size, including footings that satisfy US design requirements as well as Canadian capacity-protected (CP) and not capacity-protected (NCP) options, is treated as the decision variable. The results indicate that the footing size significantly influences the seismic response mode of low-rise buildings, with peak floor acceleration emerging as the most influential engineering demand parameter affecting both repair cost and recovery time. The findings suggest that while the footing size has a negligible impact on the functional recovery time of buildings on soft soil, larger footings on stiff soil may result in extended recovery times. Although the performance difference between footing sizes is often small, the increase in cost for larger footings can be significant. Therefore, this study indicates that NCP footings (i.e. rocking foundations) may be the more advantageous choice for short-period CBF buildings.
Keywords
Introduction
The capacity of a community to maintain functional building structures in the aftermath of a significant earthquake is essential for the recovery process, helping to resume business operations, achieve community resilience, and reduce the overall economic impact of earthquakes (SPUR), 2012. To enhance the seismic resilience of communities, research efforts have been directed toward developing seismic design guidelines that exceed current code requirements (Burton et al., 2018; Molina Hutt et al., 2022a). One example is the Performance-Based Earthquake Engineering (PBEE) methodology, a probabilistic framework that provides decision-makers with quantitative performance metrics such as repair cost, repair time, and casualties (FEMA, 2018). While much of the research has concentrated on repair costs (e.g. Hwang and Lignos, 2017a; Moammer et al., 2020; Ramirez and Miranda, 2012), fewer studies (e.g. Aljawhari et al., 2023; Almufti and Willford, 2013; Costa et al., 2021) have emphasized the importance of accounting for repair time when evaluating building performance.
Several frameworks have been developed to assess building downtime following a seismic event. Among the most prominent is the FEMA P-58 (2018) methodology, developed by the Applied Technology Council (ATC), which evaluates the performance of individual buildings using metrics such as repair cost, repair time, and casualties. Almufti and Willford (2013) extended this approach with the REDi rating system, designed to achieve seismic resilience beyond standard code requirements by factoring in repair delay time and utility disruption when estimating building downtime. Terzic et al. (2021) further refined the FEMA P-58 methodology by incorporating delay time and introducing a more adaptable repair schedule and workforce allocation based on the extent and severity of damage. Molina Hutt et al. (2022b) improved the REDi system by refining repair sequencing and worker allocation, as well as introducing new recovery states. In addition, Burton et al. (2018) and Costa et al. (2021) proposed frameworks for regional performance assessment, evaluating the seismic performance of entire building portfolios.
Several studies have explored building recovery time (e.g. Mohammadgholibeyki et al., 2023a, 2023b; Terzic and Kolozvari, 2022). Mohammadgholibeyki et al. (2023a) specifically investigated the impact of utility systems disruption on building downtime by incorporating this factor into the framework introduced by Cook et al. (2022). Their study, conducted on a five-story reinforced concrete frame-wall office building, concluded that disruption of utility systems has little to no effect on the recoccupancy time of the buildings. In a related study using the same framework, Mohammadgholibeyki et al. (2023b) investigated how seismic retrofitting could enhance post-earthquake recovery time. Molina Hutt et al. (2022a) examined strategies to reduce downtime of tall buildings through the application of more stringent drift limits during design. Terzic and Kolozvari (2022) evaluated the functional recovery of a tall concrete building located in a high-seismicity region, identifying the structural subsystem as the primary factor influencing post-earthquake functionality in tall buildings.
Despite these research efforts, the influence of soil condition and footing size on building performance, particularly regarding recovery time, has not yet been studied. The design of a building’s footing can vary from having no capacity design (denoted as “US” in alignment with current US code provisions) to including capacity design to account for the expected superstructure overstrength (denoted as “CAN-CP” in alignment with current Canadian provisions for type CP foundations). As a result, CAN-CP footings are considerably larger than their US counterparts (Madani et al., 2024a, 2024b, 2025). This study investigates the performance of low-rise concentrically braced frame (CBF) buildings designed per the Canadian National Building Code (NBC 2020, National Research Council of Canada, 2020) and steel design standard (CSA, 2019a) in terms of repair cost and recovery time, considering soil, and foundation effects. Two site classes representative of class C/D boundary (stiff soil) and class D/E boundary (soft soil) are used to analyze the impact of soil effects. Incremental record-wise Latin Hypercube Sampling (iLHS) (Vamvatsikos, 2014), using a set of 60 ground motions, is employed to capture uncertainty in both random and decision variables. Nonlinear response history analysis is performed to investigate the response of the buildings. Using these results, this study explores the impact of footing size on the factors influencing delay time, recovery time, and repair cost, aiming to recommend a preferred footing size for low-rise CBF buildings.
Archetype buildings
Superstructure design
The short-period commercial CBF buildings in this study had one, two, and three stories and had X-braced perimeter frames to resist lateral loads in the east-west (E-W) direction. In all cases, seismic loads governed the frame design. These archetypes were designed following the NBC (2020) and CSA S16 (2019a) requirements considering seismic category SC4 and normal importance (IE = 1.0). The buildings had a ductility modification factor (Rd) of 3.0 and an overstrength modification factor (Ro) of 1.3 and were located on Site Class D soil (Vs30 = 180–360 m/s). Since the fundamental period of the buildings fell within the plateau of the design spectrum, they shared the same seismic coefficient. The NBC 2020 equivalent static force procedure was used to determine the base shear for each building. Figure 1 shows the plan view of all buildings, along with the elevation view of the two-story archetype. To satisfy the slenderness ratio requirements of CSA S16:19, two SFRS frames were implemented on each side of the buildings in the E-W direction. The N-S direction was not considered in this study. Design gravity loads and selected seismic information are also included.
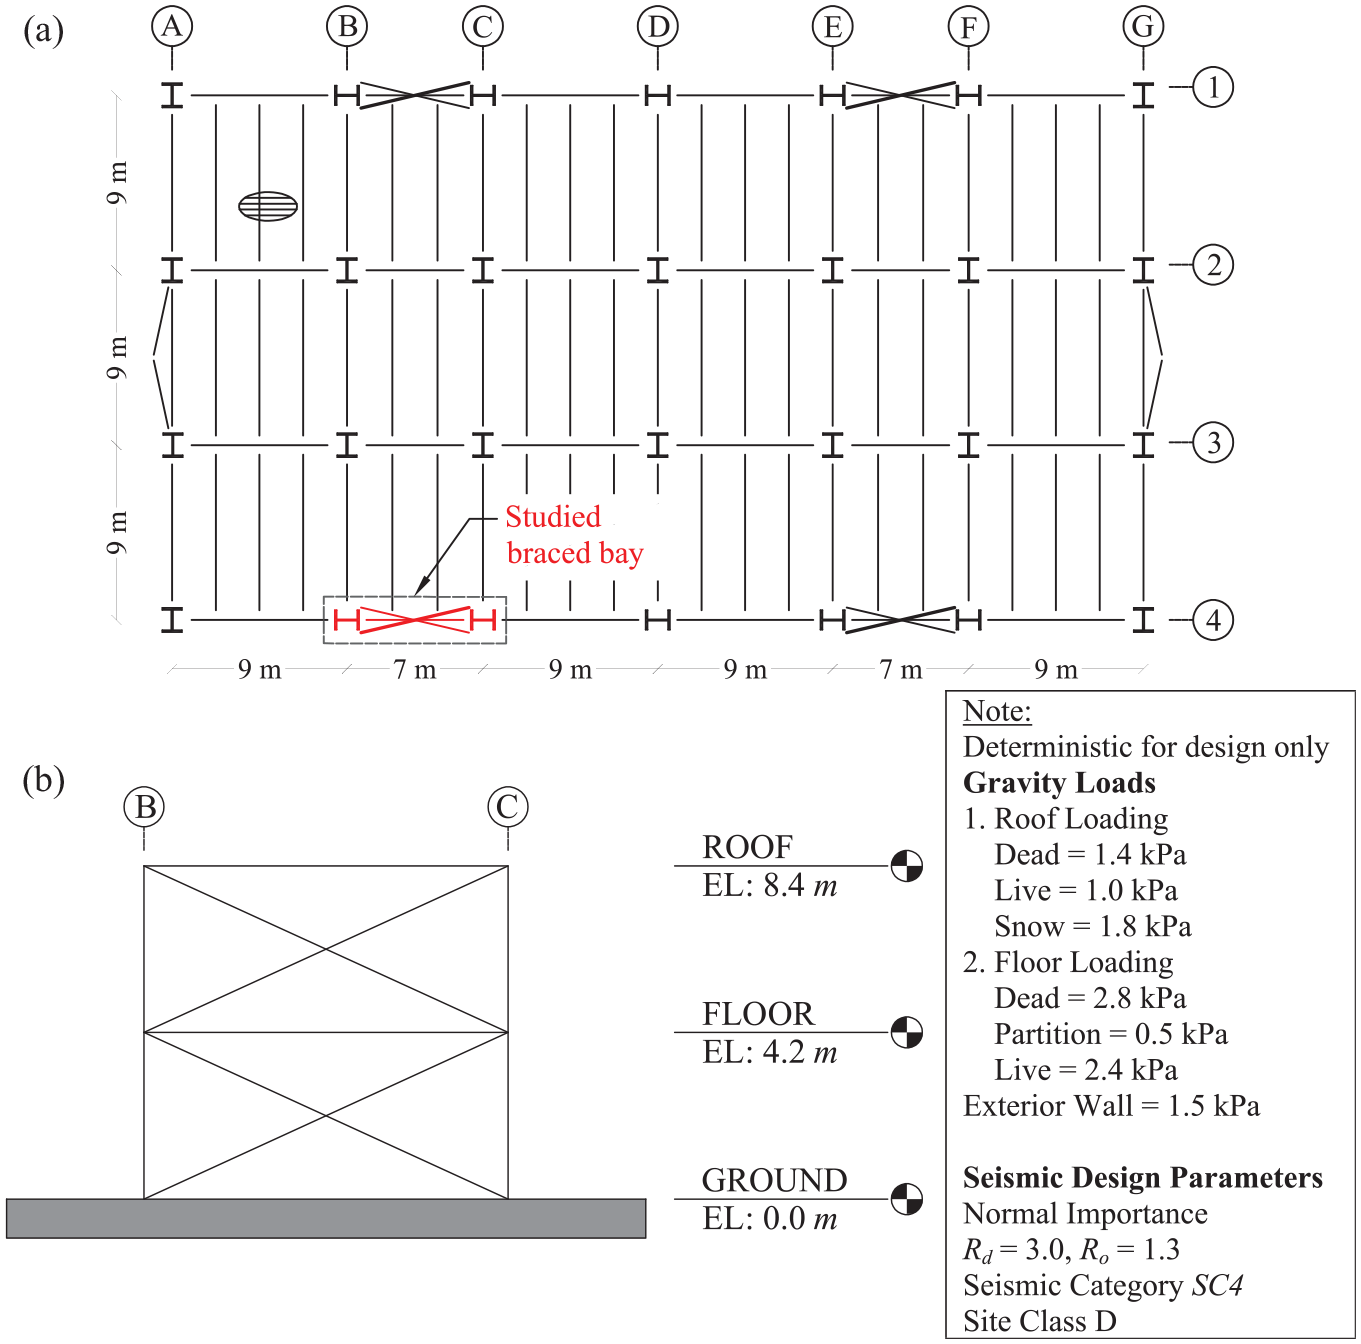
(a) Typical plan view of all archetype buildings and (b) elevation view of the two-story buildings.
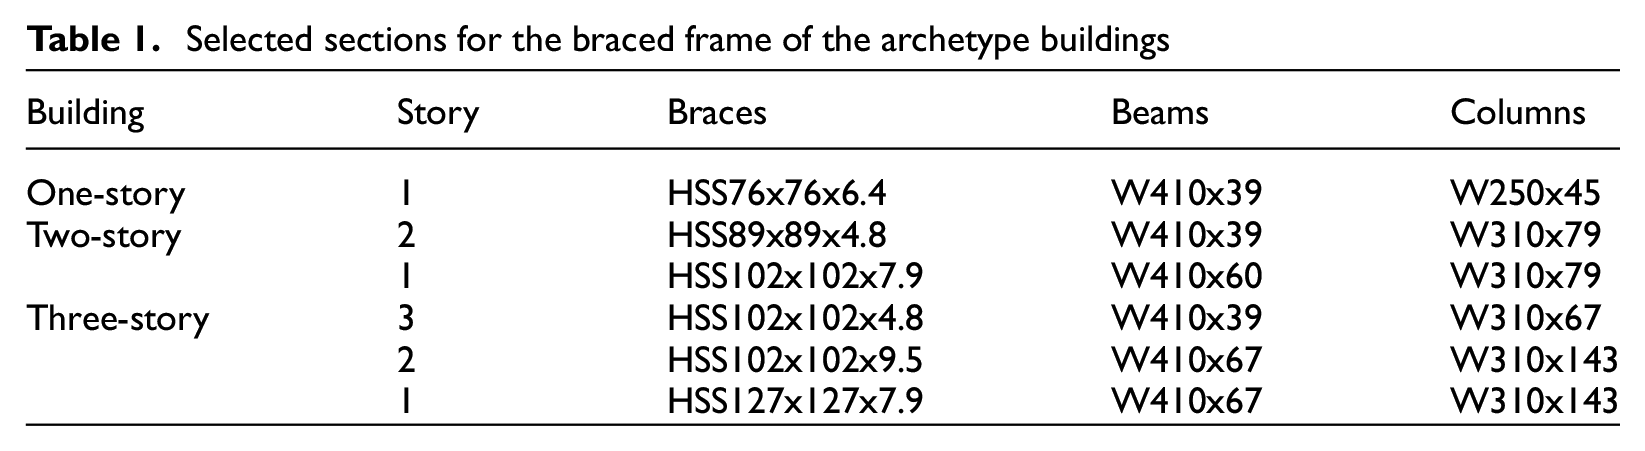
The tension-compression braces were designed to achieve a demand-to-capacity ratio (DCR) as close to 1.0 as possible. When two sections had a DCR within 0.05 of each other, the section with the smaller gross area was selected to minimize the size of gusset plates, beams, and columns, leading to a more economical design. In all cases, design forces for protected elements did not exceed the CSA S16:19 limit corresponding to forces calculated considering RdRo = 1.3. Gravity framing components were also designed following the same design standard. Table 1 shows the final section selection for the braced frames studied.
Selected sections for the braced frame of the archetype buildings
Foundation design
This study considers two Class D locations based on shear wave velocity (Vs30) per NBC 2020—one near the Class C/D boundary (stiff soil) and the other near the Class D/E boundary (soft soil). The deterministic soil properties used in the footings design are listed in Table 2. Footing size was a decision variable, ranging from US footing to CAN-CP footing, with Canadian not capacity-protected (CAN-NCP) footing as an intermediate option.
Deterministic soil properties used for designing the footings
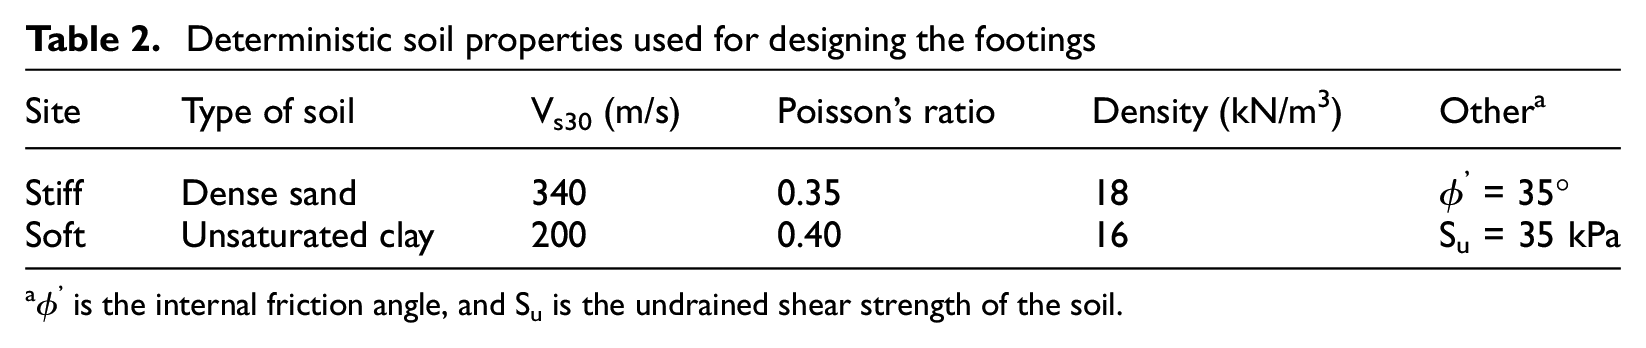
ϕ’ is the internal friction angle, and Su is the undrained shear strength of the soil.
US footings, which are not required to develop the capacity of the braces, were sized based on the seismic overturning moment determined using the NBC 2020 equivalent lateral force (ELF) procedure, with a 25% reduction applied as per ASCE 7 (2022) provisions. The allowable bearing pressures used in design were 144 kPa and 72 kPa for the stiff and soft soil, respectively (IBC, 2021; Wichman et al., 2022). CAN-CP footings, in accordance with CSA A23.3 (2019b), were designed for the probable capacity of yielding braces and the factored gravity loads. In contrast, CAN-NCP footings were designed for the factored gravity loads and the greater of either 75% of the braces’ nominal moment capacity or the overturning moment at RdRo = 2.0, as specified by CSA A23.3. For both CAN-CP and CAN-NCP footings, the designed moment does not need to exceed the overturning moment associated with RdRo = 1.0. For Canadian footings, the overall building drifts, including increases due to foundation rotations, were also checked. Rotation contributions were approximated as suggested in the commentary of CSA A23.3 (Cement Association of Canada, 2017). As shown in Table 3, the Canadian footings were consistently larger than US footings, requiring 1.5 to 6.9 times more concrete compared to their US counterparts.
Footing sizes for all archetype buildings
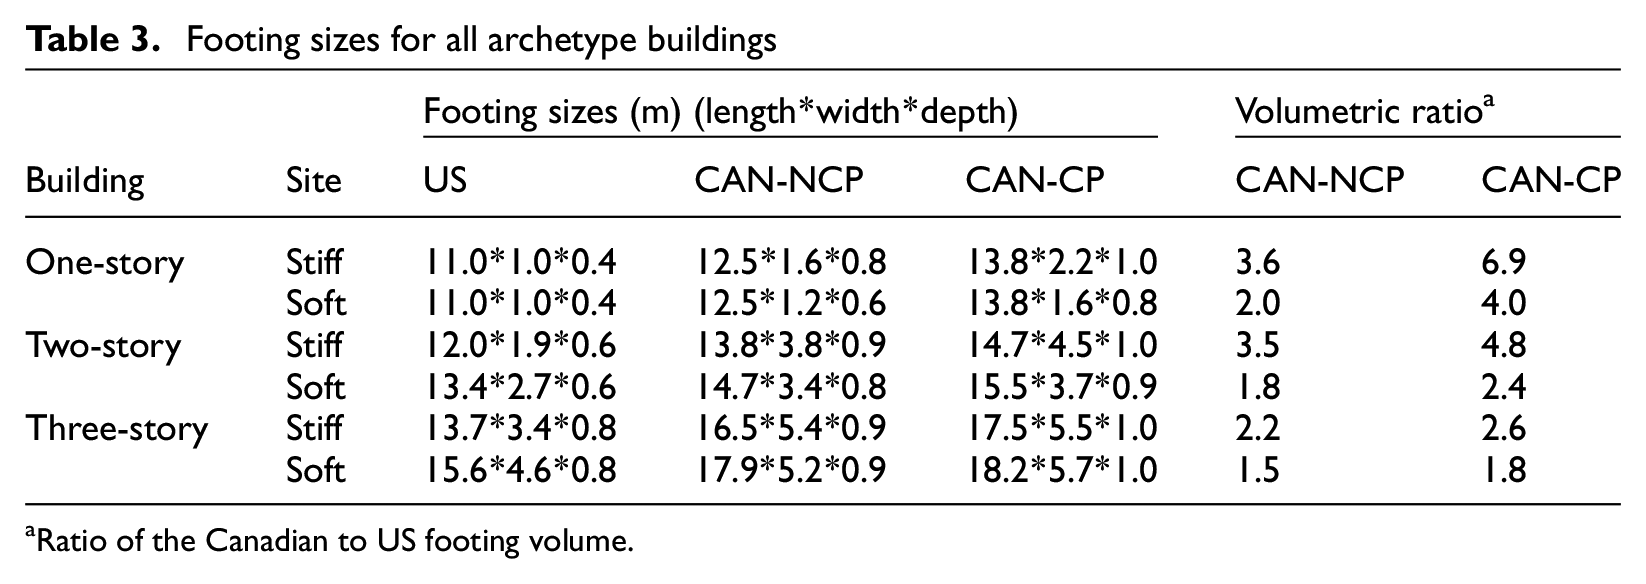
Ratio of the Canadian to US footing volume.
Building modeling
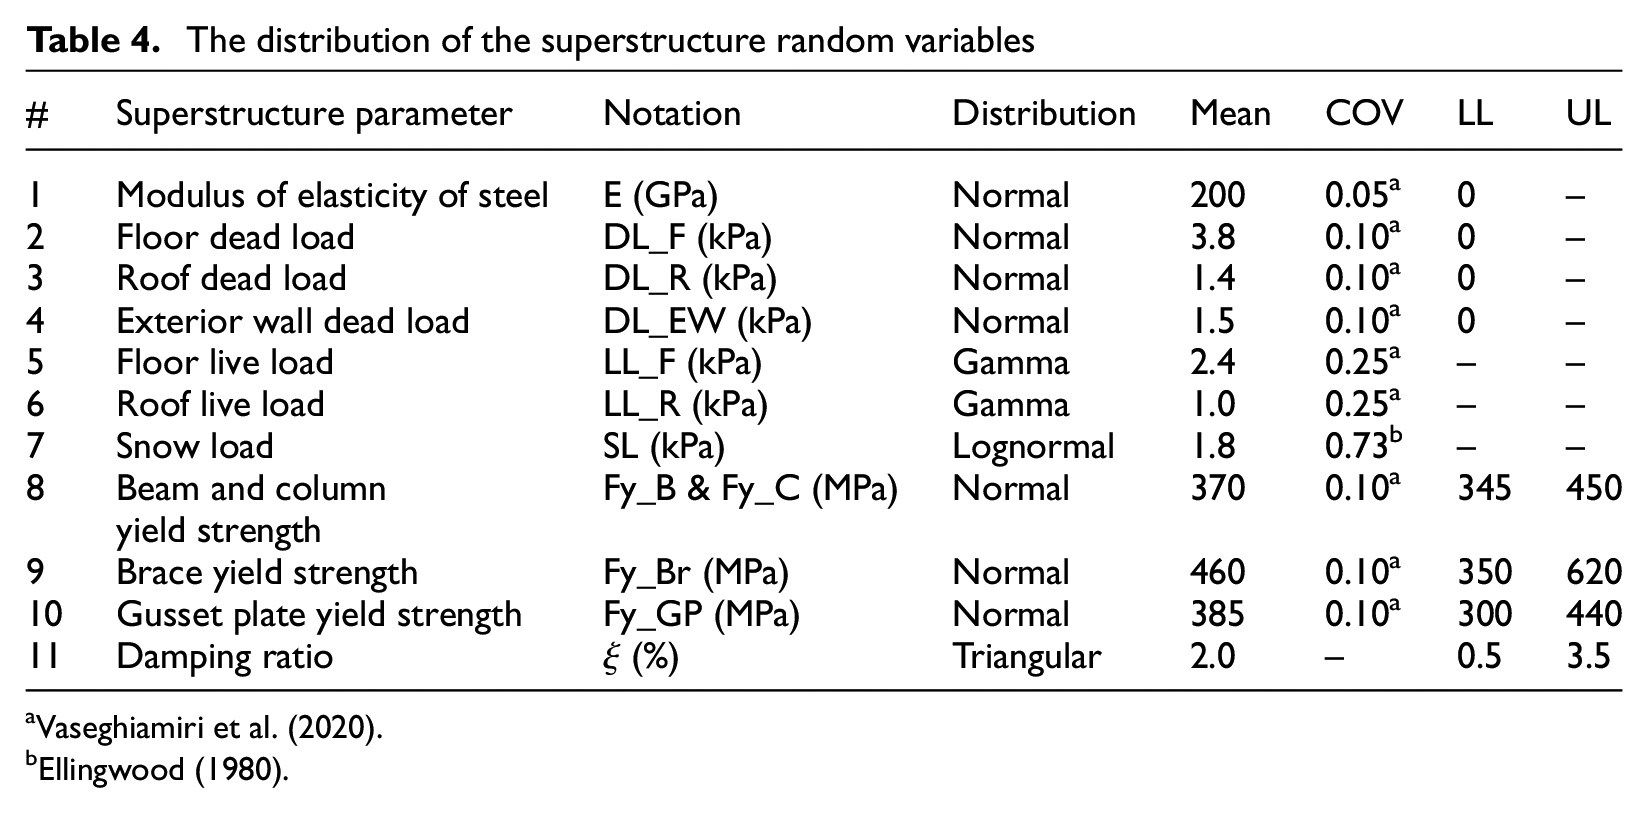
A 2D analytical model was developed in OpenSees (McKenna et al., 2000) to study the archetype buildings. One of the SFRS frames (colored in red in Figure 1) in the E-W direction, along with the influence of all elements tributary to this frame, was studied here. The seismic mass was calculated per NBC 2020, using 1.0D + 0.25 S, where D is the dead load, and S is the snow load. Gravity loads and structural properties were considered random variables, making their byproducts (e.g. seismic mass) also random. Table 4 lists the random variables used in the model, along with their respective distributions. The lower limit (LL) and upper limit (UL) were used as cut-off points for variables to prevent the selection of unacceptable values. The selected coefficient of variation (COV) for the parameters is referenced in this table. The mean, LL, and UL were chosen to comply with the requirements of NBC 2020. Furthermore, the distribution of the damping ratio is based on engineering judgment.
The distribution of the superstructure random variables
The second-order and gravity framing effects were incorporated as recommended by Elkady and Lignos (2015), using the collective strength and stiffness of the columns. Rayleigh damping, proportional to the mass and committed (tangent) stiffness matrices, was specified to account for the inherent damping of the buildings (Mohsenzadeh and Wiebe, 2018). The damping ratio was modeled using a triangular distribution with values of 0.5% (lower limit), 2% (peak), and 3.5% (upper limit).
Figure 2 summarizes the modeling assumptions for both the superstructure and the substructure. Validation of the numerical model is discussed elsewhere (Madani, 2024). The braces were modeled following Sen et al. (2019), with 16 displacement-based beam-column sub-elements and four integration points for each sub-element. An initial out-of-straightness of 0.2% was assigned to the braces. The cross-section of the square HSS braces was discretized into 128 fibers using the Steel02 material, with 1% kinematic strain hardening (R0 of 15, cR1 of 0.925, and cR2 of 0.15). The post-buckling response and the potential brace fracture were considered by tracking the strain range of fibers, as suggested by Sen et al. (2019). Gusset plate connections were modeled in accordance with Hsiao et al. (2012). One nonlinear in-plane rotational spring was attached to each end of the brace, with the Steel02 material assigned to these springs to simulate the connection response, using strength and stiffness properties derived from the gusset plate geometry.
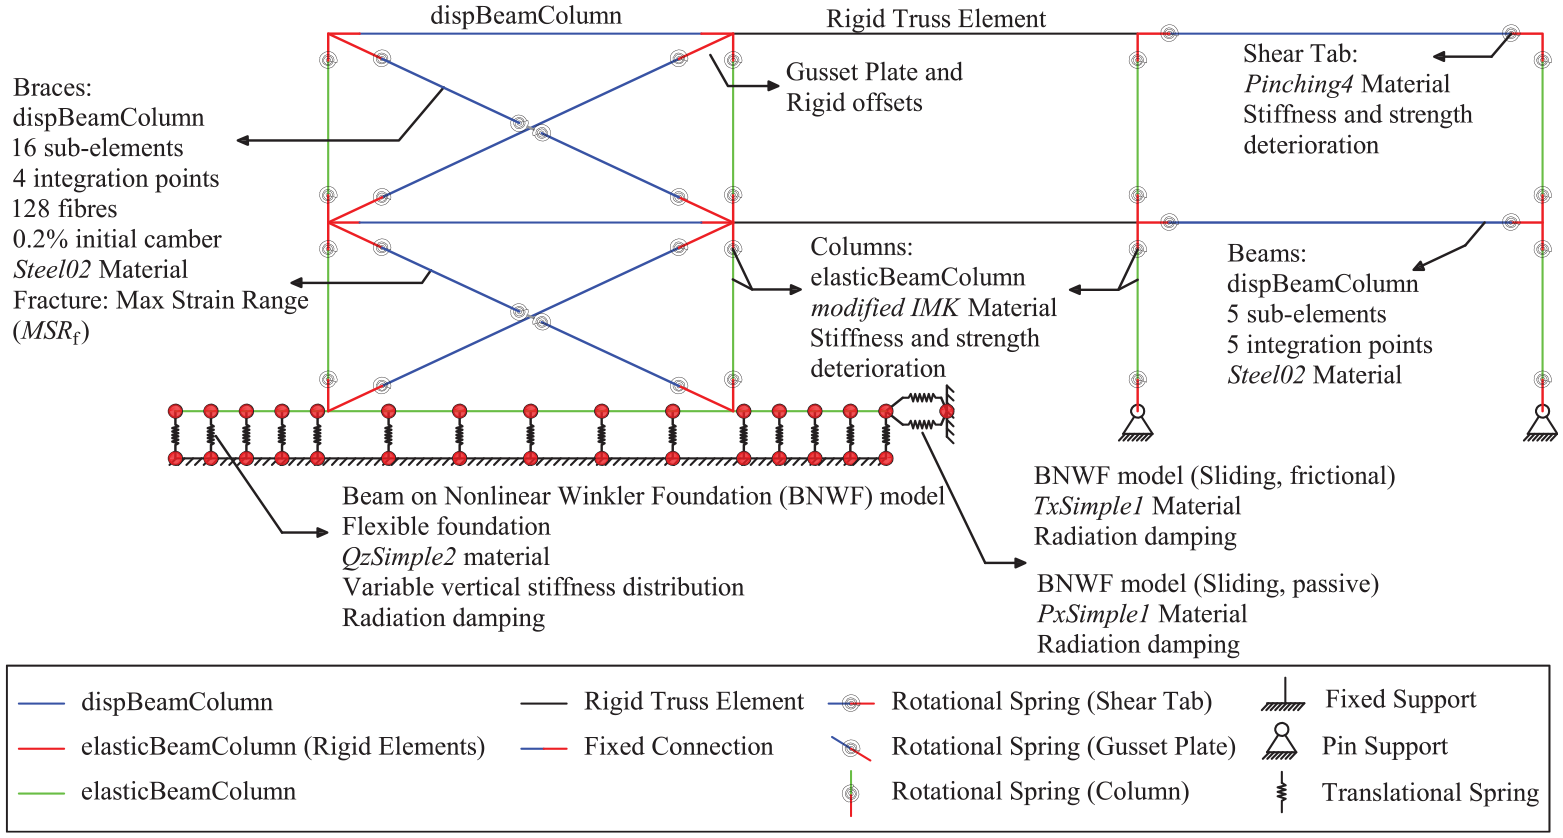
Numerical model of CBF buildings, considering the gravity framing effects and soil-foundation-structure interaction.
The beams of all archetypes were modeled using five displacement-based beam-column elements, each with five integration points. The Steel02 material was used as the constitutive model for the beam elements. The columns were modeled as continuous over the full height of these low-rise frames using a concentrated plasticity approach, where an elastic beam-column element was connected to a nonlinear rotational spring at each end. The modified Ibarra–Medina–Krawinkler (IMK) model (Lignos and Krawinkler, 2011) was assigned to the end springs to simulate the column behavior. Model parameters for modified IMK were determined according to the National Institute of Standards and Technology (NIST) (2017) GCR 17–917-46v2 guideline and Lignos et al. (2019). The shear-tab connections of gravity framing were modeled following the approach proposed by Liu and Astaneh-Asl (2004), with parameters derived from Elkady and Lignos (2015). Since the base plates were designed for the capacity of the SFRS and are expected to remain elastic under the applied demand, they were not explicitly modeled in this study.
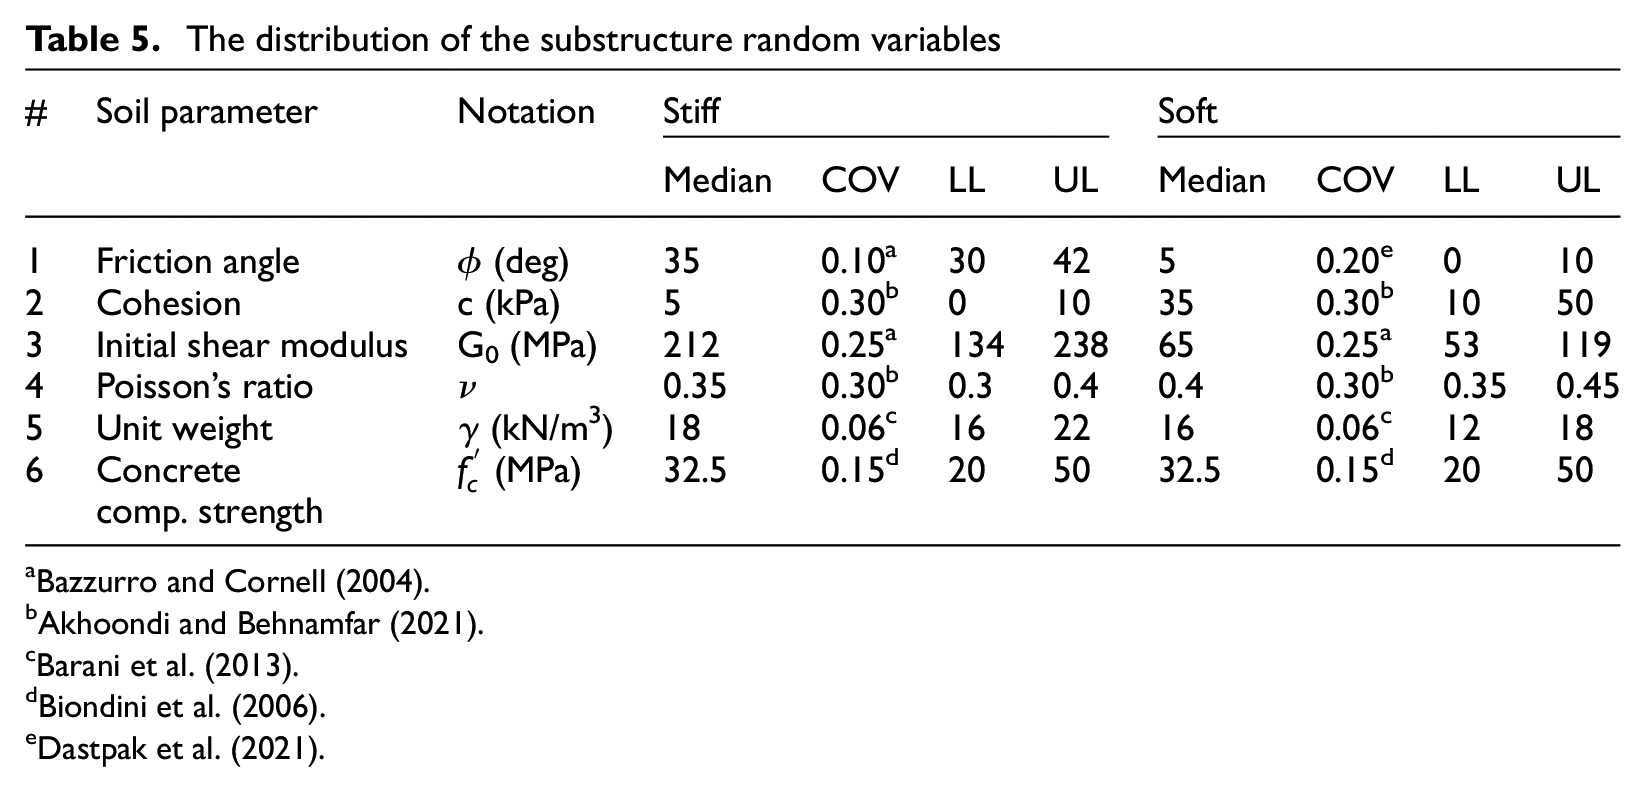
The soil and foundation of the archetype buildings were modeled using the Beam on Nonlinear Winkler Foundation (BNWF) method. Elastic beam-column elements represented the foundation, while a series of vertical nonlinear springs with QzSimple2 material captured the vertical settlement and rocking of the footings. In addition, two horizontal zero-length nonlinear springs, with TxSimple1 and PxSimple1 materials, were employed to simulate the frictional and passive sliding behavior of the soil surrounding the foundation. The substructure modeling followed the guidelines of Gajan et al. (2008) and Harden et al. (2005). Soil properties, including strength and stiffness, were determined using NIST GCR 12-917-21 (2012), FEMA P-2139-4 (2020a), and FEMA P-2091 (2020b). These properties were also treated as random variables with a lognormal distribution. Table 5 provides details on the parameters and their distributions. The selected COV for the parameters is referenced in this table. The mean, LL, and UL were determined based on the soil mechanical properties reported by Kulhawy and Mayne (1990) and supplemented with engineering judgment. Foundation size was considered a decision variable with uniform distribution, directly correlating the three footing dimensions. The US footing size was used as the lower bound, while the CAN-CP footing size served as the upper bound.
The distribution of the substructure random variables
Ground motion selection
In this study, a single set of 60 ground motion records was selected for both buildings on stiff and soft soils to represent the local seismic activity and match the soil conditions (e.g. Vs30 = 180–360 m/s) at building sites. The seismic hazard in Vancouver is primarily driven by three sources: crustal, subduction in-slab, and subduction interface events (Tremblay et al., 2015). Ground motions for crustal events were selected from the NGA-West2 database (Ancheta et al., 2014), while subduction-related motions were sourced from the K-NET, KiK-net (2019), and CESMD (2023) databases. These records were scaled to match the design spectrum for Vancouver City Hall following the method proposed by Baker and Lee (2018), with scaling factors ranging from 0.5 to 4.0. The selection and scaling process was carried out over the period range of 0.0–1.0 seconds. The final scaled records, along with the median spectrum and NBC design spectrum, are illustrated in Figure 3.
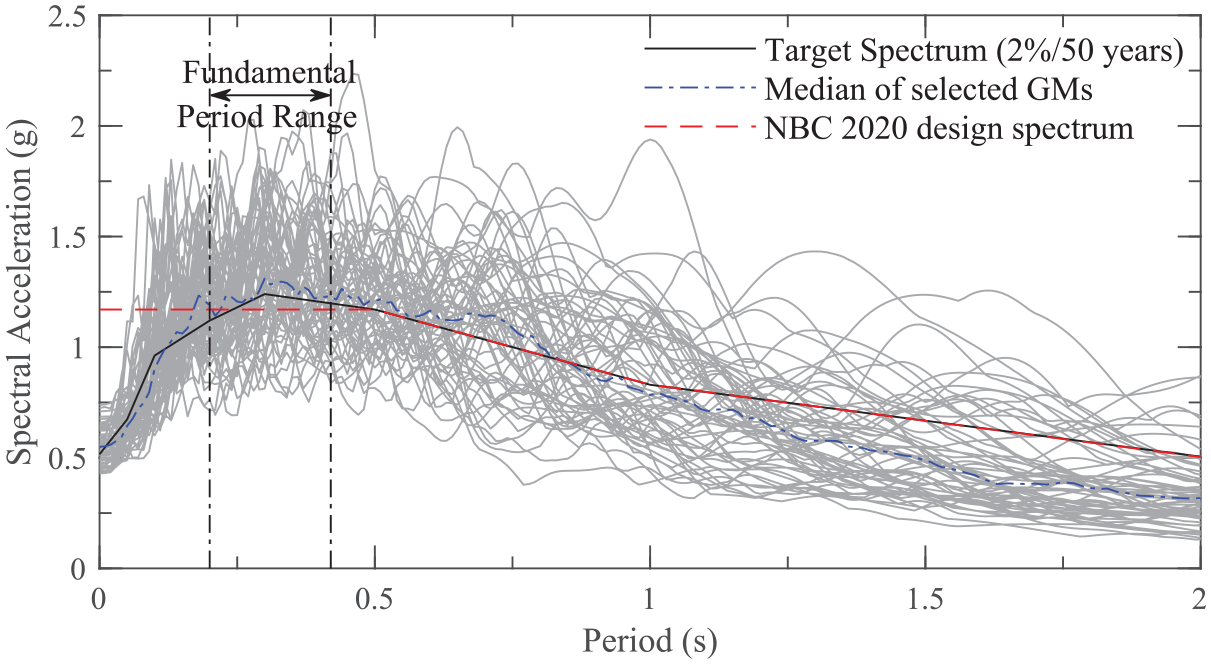
Selected ground motions scaled to match the design spectrum.
ILHS
To account for the uncertainty in both random and decision variables, iLHS (Vamvatsikos, 2014) was employed. Unlike conventional Monte Carlo simulations, which typically use a complete record suite for analyzing each model sample at a given intensity, the iLHS method applies LHS to both the structural properties and seismic input simultaneously. This increases efficiency (Kazantzi et al., 2014) by treating ground motions as a uniformly distributed random variable in the process. Furthermore, iLHS simplifies the challenge of determining the appropriate sample size, a common issue with typical LHS methods. Instead of trial-and-error attempts that waste samples or overestimate the sample size to achieve accuracy, iLHS intuitively identifies a reasonable sample size from the outset (Vamvatsikos, 2014). Unlike Incremental Dynamic Analysis (IDA), which involves scaling ground motions to multiple intensity levels, iLHS directly samples seismic records and structural properties at their design intensities. This approach improves computational efficiency, particularly in studies focused on building performance at a specific intensity level rather than across a range of hazard intensities.
This approach starts with a small number of samples, doubling the sample size with each generation. In this study, as by Kazantzi et al. (2014), the process started with an initial set of 10 samples, followed by additional sets of 10, 20, 40, 80, and 160 samples, forming a proper Latin hypercube. This iterative procedure, with six generations and a total of 320 samples, ensures the desired tolerance for changes in the output of interest, specifically peak drift and acceleration. The total number of samples using this method is significantly lower than in the typical application of LHS. Minimal changes in distribution parameters between the fourth and fifth generations further indicate that the number of samples is sufficient for a stable characterization of the expected response.
Economic loss assessment
The repair costs for the buildings after design-level (DE) earthquakes are estimated using the methodology outlined in FEMA P-58 (2018). The loss assessment was conducted through the Python package Pelicun (Zsarnoczay and Kourehpaz, 2021), which requires engineering demand parameters (EDPs) obtained from NLRHA, including drifts and accelerations, along with the fragility database, repair cost, and repair time functions of building components as inputs. A building is considered collapsed if it experienced a story drift ratio (SDR) of 10%, where this drift comes from the combined influence of the braced frame deformations (including modeled brace fracture at drifts much less than 10%) and foundation rotation and sliding. Buildings with excessive residual SDR are deemed irreparable and must be demolished and replaced. The probability of requiring demolition, conditioned on the maximum residual SDR, follows a lognormal distribution with a median of 1.5% and a logarithmic standard deviation of 0.3 (Hwang and Lignos, 2017a). The number of structural components is determined from the structural design, while the Normative Quantity Estimation Tool (FEMA, 2018) is utilized to determine the quantity of non-structural components.
At a given value of an EDP, fragility functions provide the likelihood of a component exceeding a certain damage state. For each realization, a random EDP value is generated from the distribution fitted to the peak structural response parameters, and these values are applied to the fragility functions to estimate the probable damage states of building components. The total repair cost for each realization is then calculated as the sum of repair costs for all component groups, accounting for economies of scale and efficiencies in construction operations (FEMA, 2018). If a building collapses or requires demolition, the repair cost is taken as the building’s replacement cost.
This study assumes that soil failure leads to total building loss. However, in all cases analyzed, when the soil under the footing reached a critical state, the building was already identified as being in a collapsed state or needing demolition based on the previously outlined criteria. As a result, it was unnecessary to account for the costs of replacing or strengthening the soil in the loss assessment. In these instances, the repair cost was treated as equivalent to the building replacement cost. The outputs from Pelicun, such as the repair cost matrix, repair time matrix, and damage state matrix, serve as inputs to the recovery time framework used in this study, as discussed below.
Building recovery framework
The framework proposed by Molina Hutt et al. (2022b) is used here to estimate the building downtime. This framework builds on existing FEMA P-58 (2018) methodology and is implemented through an open-source Python package called TREADS (Tool for Recovery Estimation And Downtime Simulation of buildings). Using the outputs from Pelicun, including the extent of component damage and repair time, this framework estimates the recovery time in five key steps.
First, the post-earthquake condition of the building is identified based on the extent of damage, considering five different recovery states as detailed in the following section. Next, the factors that delay the start of repairing the damaged components, also called impeding factors (Almufti and Willford, 2014), are evaluated as they are significant contributors to the overall downtime of buildings. In the third step, the time required to repair the building to reach the desired recovery state is estimated, independent of the delays from impeding factors. The repair time is influenced by the undertaken repair sequence and worker allocation. In the fourth and fifth steps, the framework calculates the downtime at the story level and then aggregates these results to estimate the downtime for the entire building.
Recovery states
The framework applied in this study identifies five recovery states that describe a building’s post-earthquake functionality, ranging from stability to full recovery. The stability recovery state (#5) represents a post-earthquake condition where, despite significant structural and non-structural damage, the risk of collapse and falling debris is minimal. If the damage exceeds the threshold for this state, the building is deemed unstable. In such cases, safety measures like establishing a safety cordon around the building may be necessary until repairs can be made to restore stability and mitigate the risk of falling debris (Molina Hutt et al., 2022b). The next recovery state is shelter-in-place (#4), which allows residents to remain in their homes after an earthquake while repairs are underway to restore the building to normal condition. This state assumes lenient habitability criteria, focusing on ensuring residents’ safety (SPUR, 2012).
Reoccupancy (#3) is a more stringent condition than shelter-in-place, requiring that the building envelope, fire-protection system, interior partitions, elevators, and plumbing are fully functional before residents can return (Almufti and Willford, 2013). Functional recovery (#2) represents a state where the building can perform its pre-earthquake function, although some cosmetic repairs may still be pending (EERI, 2019). For this state, operational utility systems are essential (Mohammadgholibeyki et al., 2023a). Finally, full recovery (#1) is the state where the building is fully restored to its pre-earthquake condition. Since the repairs required to move from functional recovery to full recovery are often minor, building owners may choose to defer these repairs (Molina Hutt et al., 2022b). In this study, five repair classes, numbered from 1 to 5, correspond to recovery states ranging from full recovery to stability. For instance, a component with a repair class of 2 has been damaged in a way that impedes achieving functional recovery.
Impeding factor delays
Achieving the recovery states described above is often delayed by various factors that hinder the initiation of the repair work, significantly affecting building downtime. These factors, known as impeding factors, have been identified through insights from past earthquakes. The framework proposed by Molina Hutt et al. (2022b) categorizes impeding factors into six distinct groups, which are summarized in the following paragraphs. The median and logarithmic standard deviation of the log-normally distributed duration of these impeding factors, with the exception of stabilization, is provided in Table 6. The duration of stabilization is assumed to be the same as that of the structural components and curtain walls in the study by Molina Hutt et al. (2022b), with details provided in the Supplementary Material.
Median and dispersion of lognormally distributed impeding factors (from Molina Hutt et al. (2022b))
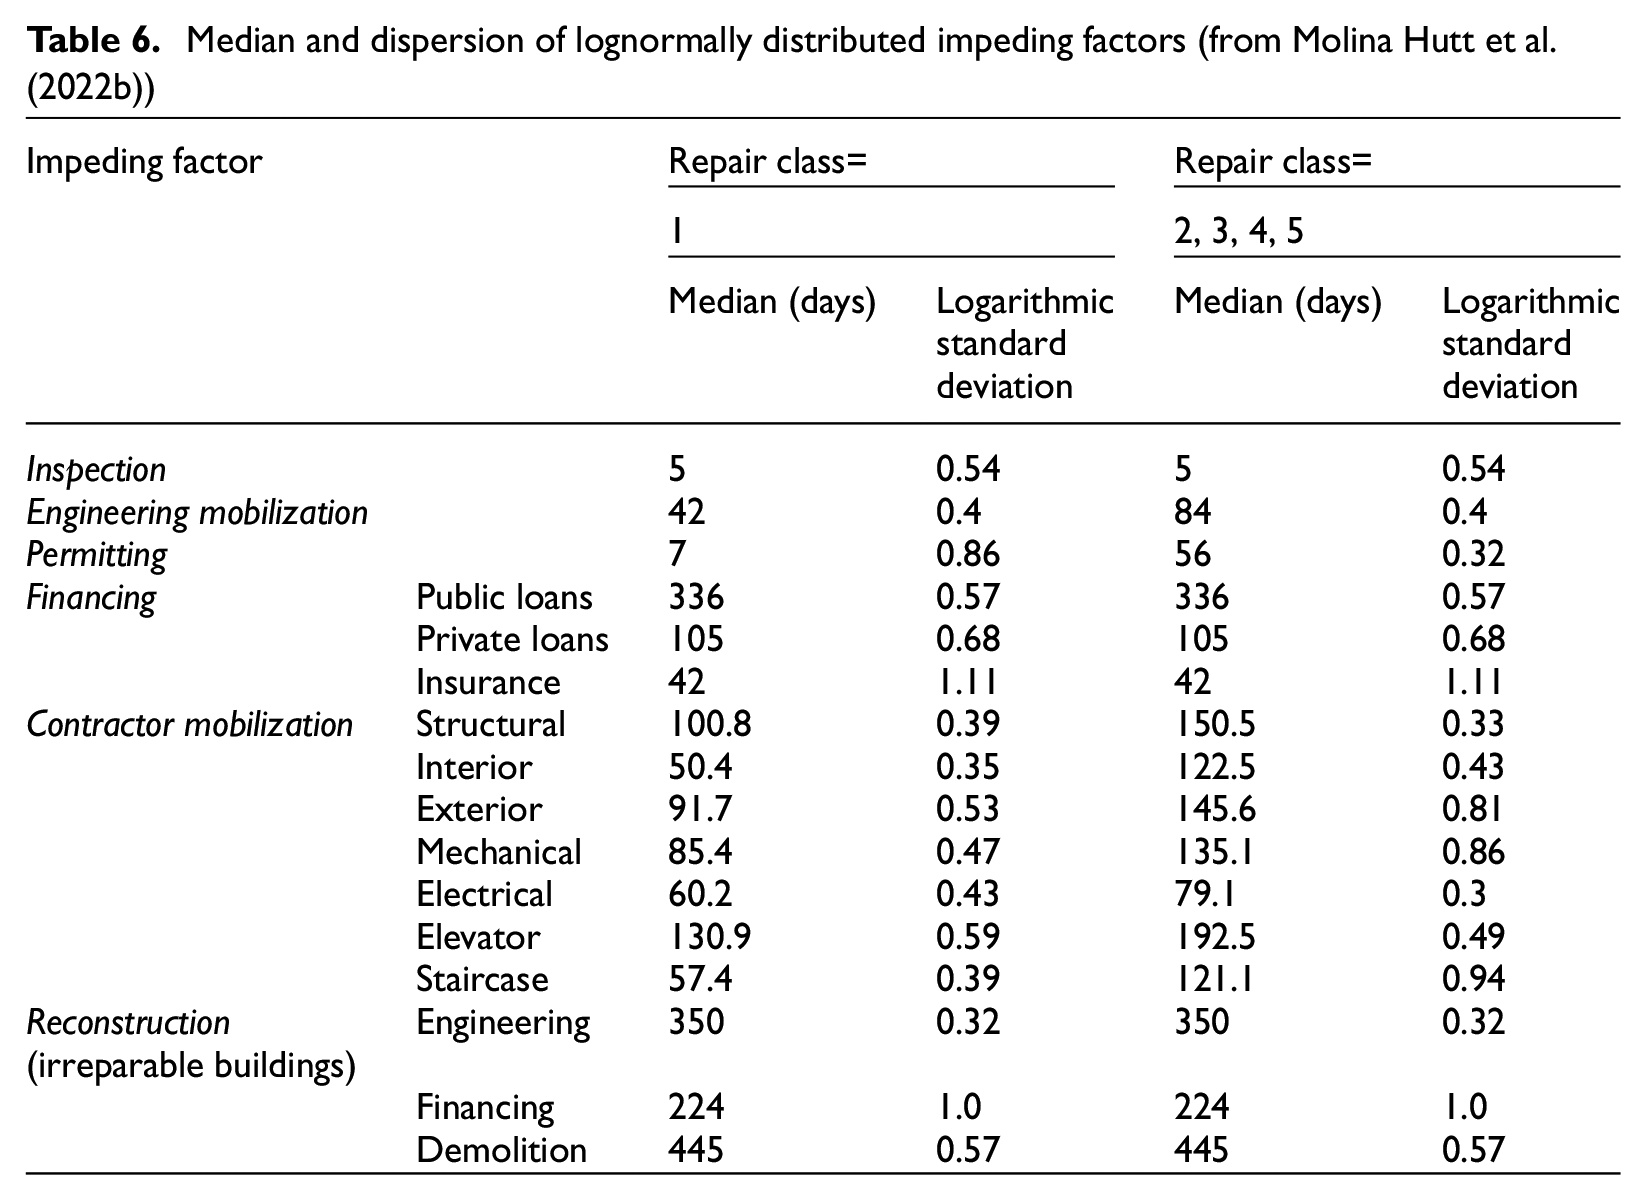
The first impeding factor, inspection delay time, refers to the time required to inspect a damaged building after an earthquake. This time is zero if no damage has occurred. Stabilization is another potential source of delay; if damage to the building components compromises the safety of workers, stabilization must be done before repairs can start. Engineering mobilization represents the time needed to assemble a team of engineers to assess structural damage and, if necessary, devise a repair strategy (Almufti and Willford, 2013). Once the repair strategy is drafted, it must undergo review and approval by local building authorities, which introduces permitting delay. The framework employed in this study adopts weighting the expected delay time based on the extent of damage (repair class) experienced by the structural components (Molina Hutt et al., 2022b).
The financing delay represents the time required to secure the funds for repairs. This study uses the financing algorithm proposed by Costa et al. (2021). Here, we assume that the funding source for repairs is uncertain. Therefore, we analyze the socioeconomic characteristics of Vancouver City to identify potential sources of funding. According to the latest survey (Statistics Canada, 2023), 13.2% of the city’s population falls into the low-income category, and 55% of homeowners have earthquake insurance (Nadarajah, 2017). Based on these data, it was assumed that 14% of building owners would rely on public loans, 55% on insurance payouts, and the remaining 31% on private loans. Although these figures pertain to homeowners (residential buildings), they were applied in this study featuring office buildings due to the lack of more specific data. Further analysis confirmed that this assumption did not significantly affect the overall results. The contractor mobilization delay refers to the time needed to locate contractors, conduct the bidding process, acquire materials and equipment, and assemble the necessary workforce. Following Paul et al. (2018), this study assumes that the duration of mobilization depends on the extent of damage to building components in each repair sequence (defined in the next section).
The impeding delay time is not simply the sum of all impeding factors mentioned above; instead, many of these factors are considered to occur concurrently. As shown in Figure 4, there are two possible scenarios after inspection. In the first scenario, the building has sustained damage but remains repairable. In this scenario, the impeding delay for repair sequence i encompasses the inspection delay time and the greater of either stabilization, engineering and permitting, financing, or contractor mobilization for that sequence. In the second scenario, the building has collapsed, partially collapsed, or has excessive residual drift that necessitates demolition (i.e. reconstruction delay). For this scenario, the impeding delay time includes the inspection delay and the longest duration among engineering, financing, or demolition. The distribution function parameters of these factors are provided in Table 6.
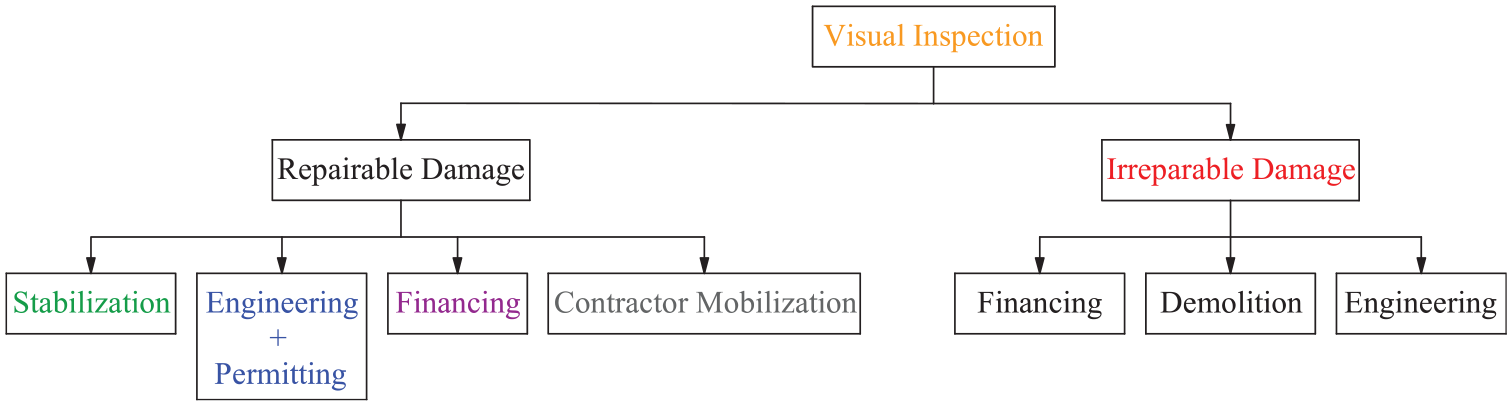
Impeding factors delay sequence.
Building repair time
To reach the desired recovery state, the next step, after accounting for the impeding factor delays, is to repair the damaged components of the building. Estimating the time required for these repairs depends on several factors, including the repair sequence, repair path, repair phase, and the allocation of workers to each repair sequence (Molina Hutt et al., 2022b). The repair sequence categorizes building components into seven groups: RS1 for structural components, RS2 for interior components such as Heating, Ventilation, and Air Conditioning (HVAC) systems and wall partitions, RS3 for exterior walls like curtain walls, RS4 for mechanical components, RS5 for electrical components, and RS6 and RS7 for elevator and staircase repairs, respectively (Molina Hutt et al., 2022b).
The repair path comprises one or more repair sequences to define the sequence in which repairs will be carried out within the building. Each repair path is independent and can be executed concurrently with others, as illustrated in Figure 5. Based on observations from past seismic events, Molina Hutt et al. (2022b) suggest that contractors carry out the repairs on multiple floors concurrently. A repair phase is denoted as a collective set of floors scheduled for simultaneous repair. Another key factor impacting repair time is the size of the labor force. The allocation of workers to repair damaged components is influenced by (1) the number of damaged components, (2) the floor area, (3) the contractor’s resource availability, and (4) site-specific constraints. To prevent overcrowding, the number of workers assigned to a particular repair path on a given floor is limited by the floor area (FEMA, 2018). The maximum number of workers allowed on-site across all repair paths is set according to the gross area of the building, as specified in the REDi guidelines (Almufti and Willford, 2013).
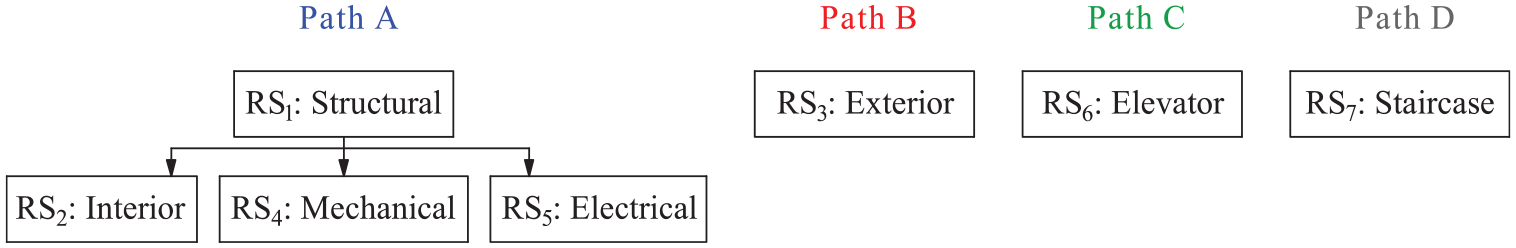
Sequencing of repairs in each repair path.
Nonlinear response history analysis results
The performance indicators considered in this study, including repair cost and recovery time, are influenced by EDPs such as drift and peak floor acceleration (PFA) that arise from various deformation patterns. Therefore, this section explores how footing size (the decision variable) affects these EDPs. While this study focuses on overall building performance in terms of EDPs, repair costs, and recovery time, the structural response of the braced frame directly affects these parameters and can be inferred from EDPs such as the story drift in the CBF.
Figure 6 illustrates the effects of the footing size as the sole decision variable on the contributors to total story drift (SDR-Tot) at the design level across all archetypes. The total story drift (full height of the bar) comprises the braced frame deflection relative to the foundation (SDR-CBF), as well as additional deformations caused by rigid-body motion during foundation rotation and sliding. For better readability, the data samples are grouped into 60 bins.
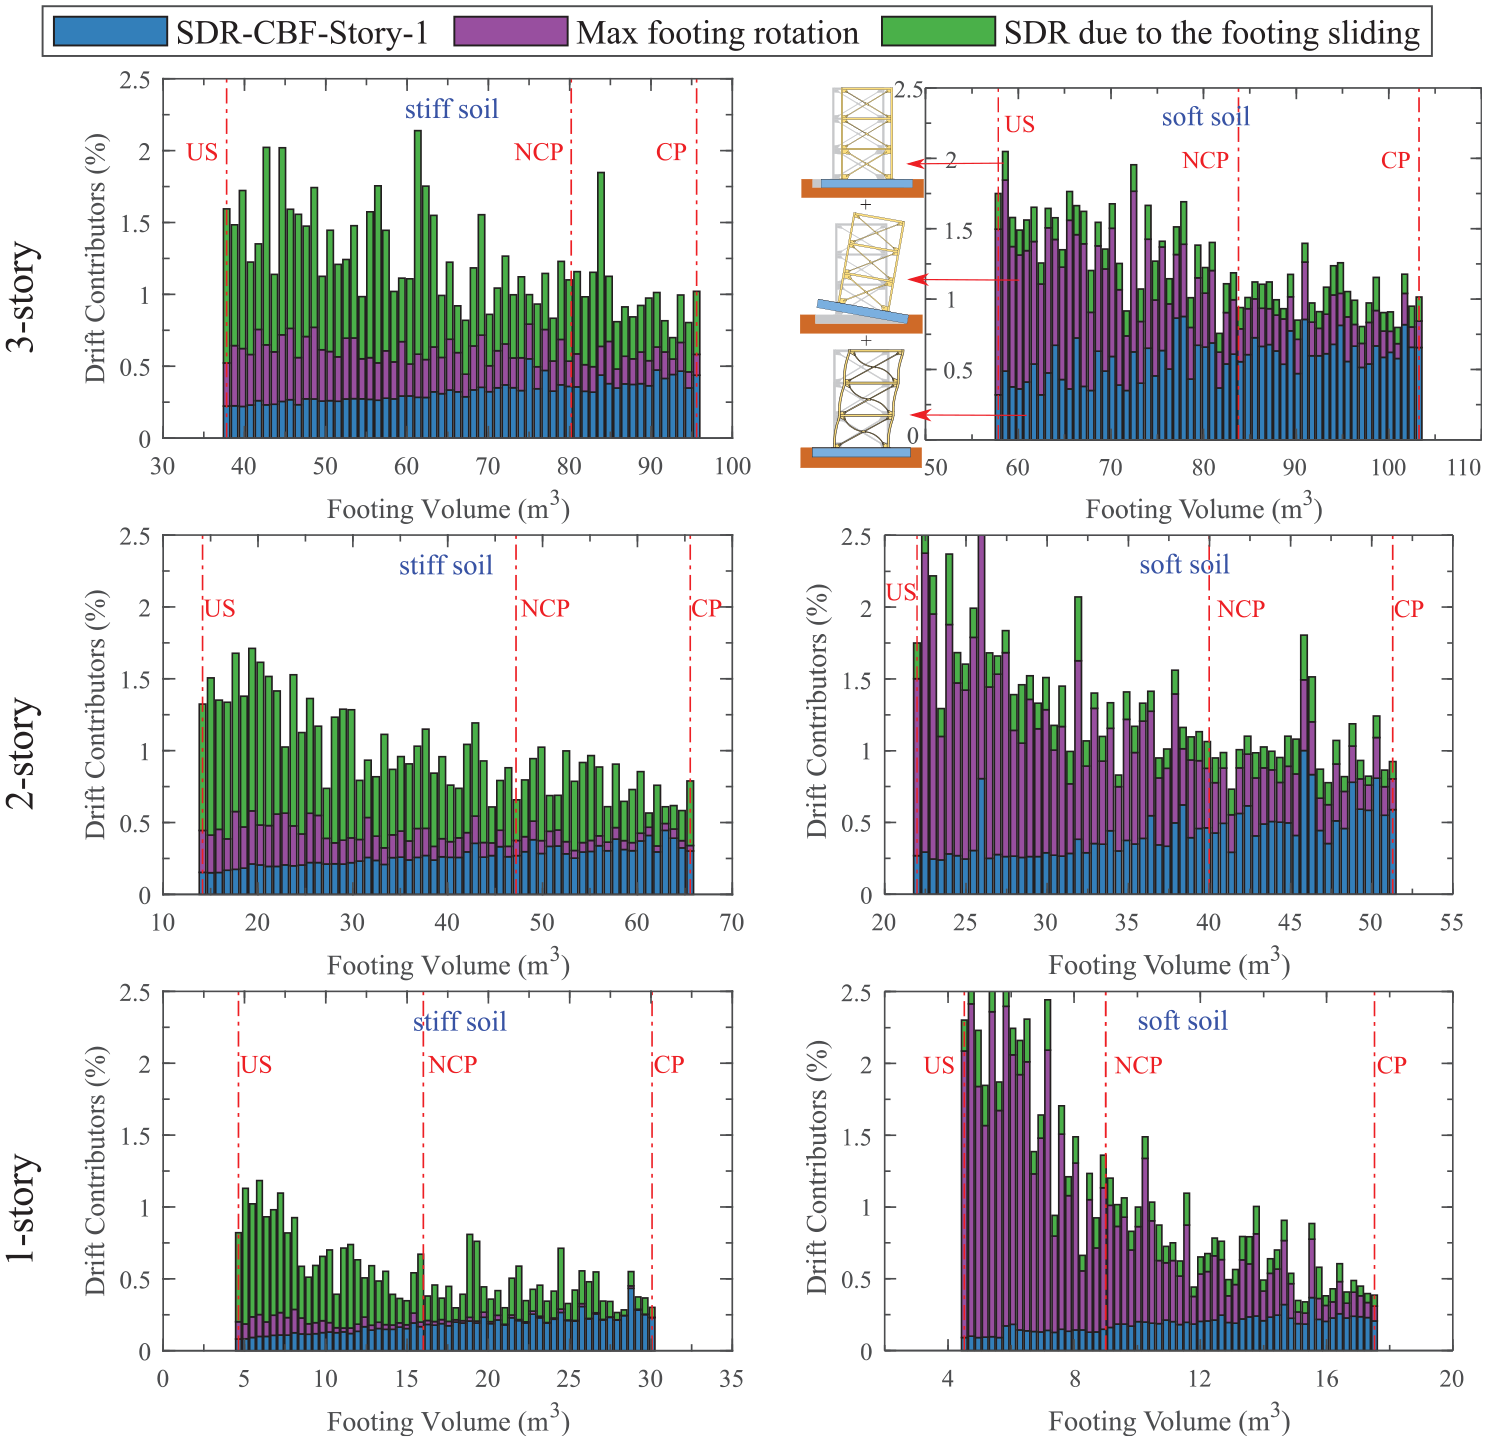
Impact of footing size on the contributors to story drift ratio of the buildings at the design level.
Figure 6 suggests that footing size significantly affects the mode of response for low-rise buildings. Increasing the footing size reduces the maximum footing movement for both soil types (e.g. a 60% reduction in sliding and a 70% reduction in rotation from US to CAN-CP for the three-story building on stiff soil) while increasing the frame deformations (e.g. a 130% increase from US to CAN-CP for the same building). This observation agrees with the principles of the capacity design approach, where the footing is designed to remain elastic, concentrating inelastic deformations primarily in the superstructure. A comparison of deformation components for buildings on stiff soil with US footings reveals that SDR-CBF is relatively small, while footing sliding contributes most to total drift. Conversely, buildings with CAN-CP footings show an opposite trend. These figures further indicate that transitioning from NCP to CP footings results in only minor changes to the drift contributors. In addition, several samples of buildings with small footings (e.g. US) on both stiff and soft soils have a total drift that exceeds the NBC drift limit of 2.5%.
Figure 6 also indicates that for buildings on stiff soil, SDR-Tot decreases as footing size increases (e.g. 40% from US to CAN-CP for the three-story building), a trend also observed in buildings on soft soil (e.g. 50% from US to CAN-CP for the three-story building). However, as discussed earlier, SDR-CBF increases with larger footing sizes. This finding highlights the importance of evaluating both SDR parameters separately for the braced frame and gravity framing components when conducting a loss assessment. Additional results not shown here (Madani, 2024) reveal a high dispersion in footing sliding and rotation data for buildings with small footings, showing that the soil and foundation are the major contributors to drift and energy dissipation, and uncertainty in their random variables is causing the significant variance in EDPs. In contrast, the dispersion of SDR-CBF data is greatest in buildings with larger footings, suggesting that the superstructure plays a more significant role in drift and energy dissipation in these cases. Here, the uncertainty in the superstructure’s random variables is the main factor contributing to the variation in SDR-CBF data.
Figure 7 shows the effect of footing volume, which serves as the decision variable, on the PFA across all archetypes at the design level. Each dot in this figure represents the outcome of the model for a specific set of values for each variable selected using the iLHS method. The best linear fit to the data samples is presented to emphasize the overall trend in each case, which is the focus of this article more than a statistical analysis of these trends. As the footing size increases, the PFA generally rises (e.g. a 50% increase from US to CAN-CP for the one-story on stiff soil). However, the slope of the fitted trend line varies depending on the type of soil and building height, with footing size having the most pronounced effect on shorter buildings and those on stiffer soil. Although not shown, the trend in roof PFA for two- and three-story buildings closely mirrors that of their first story.
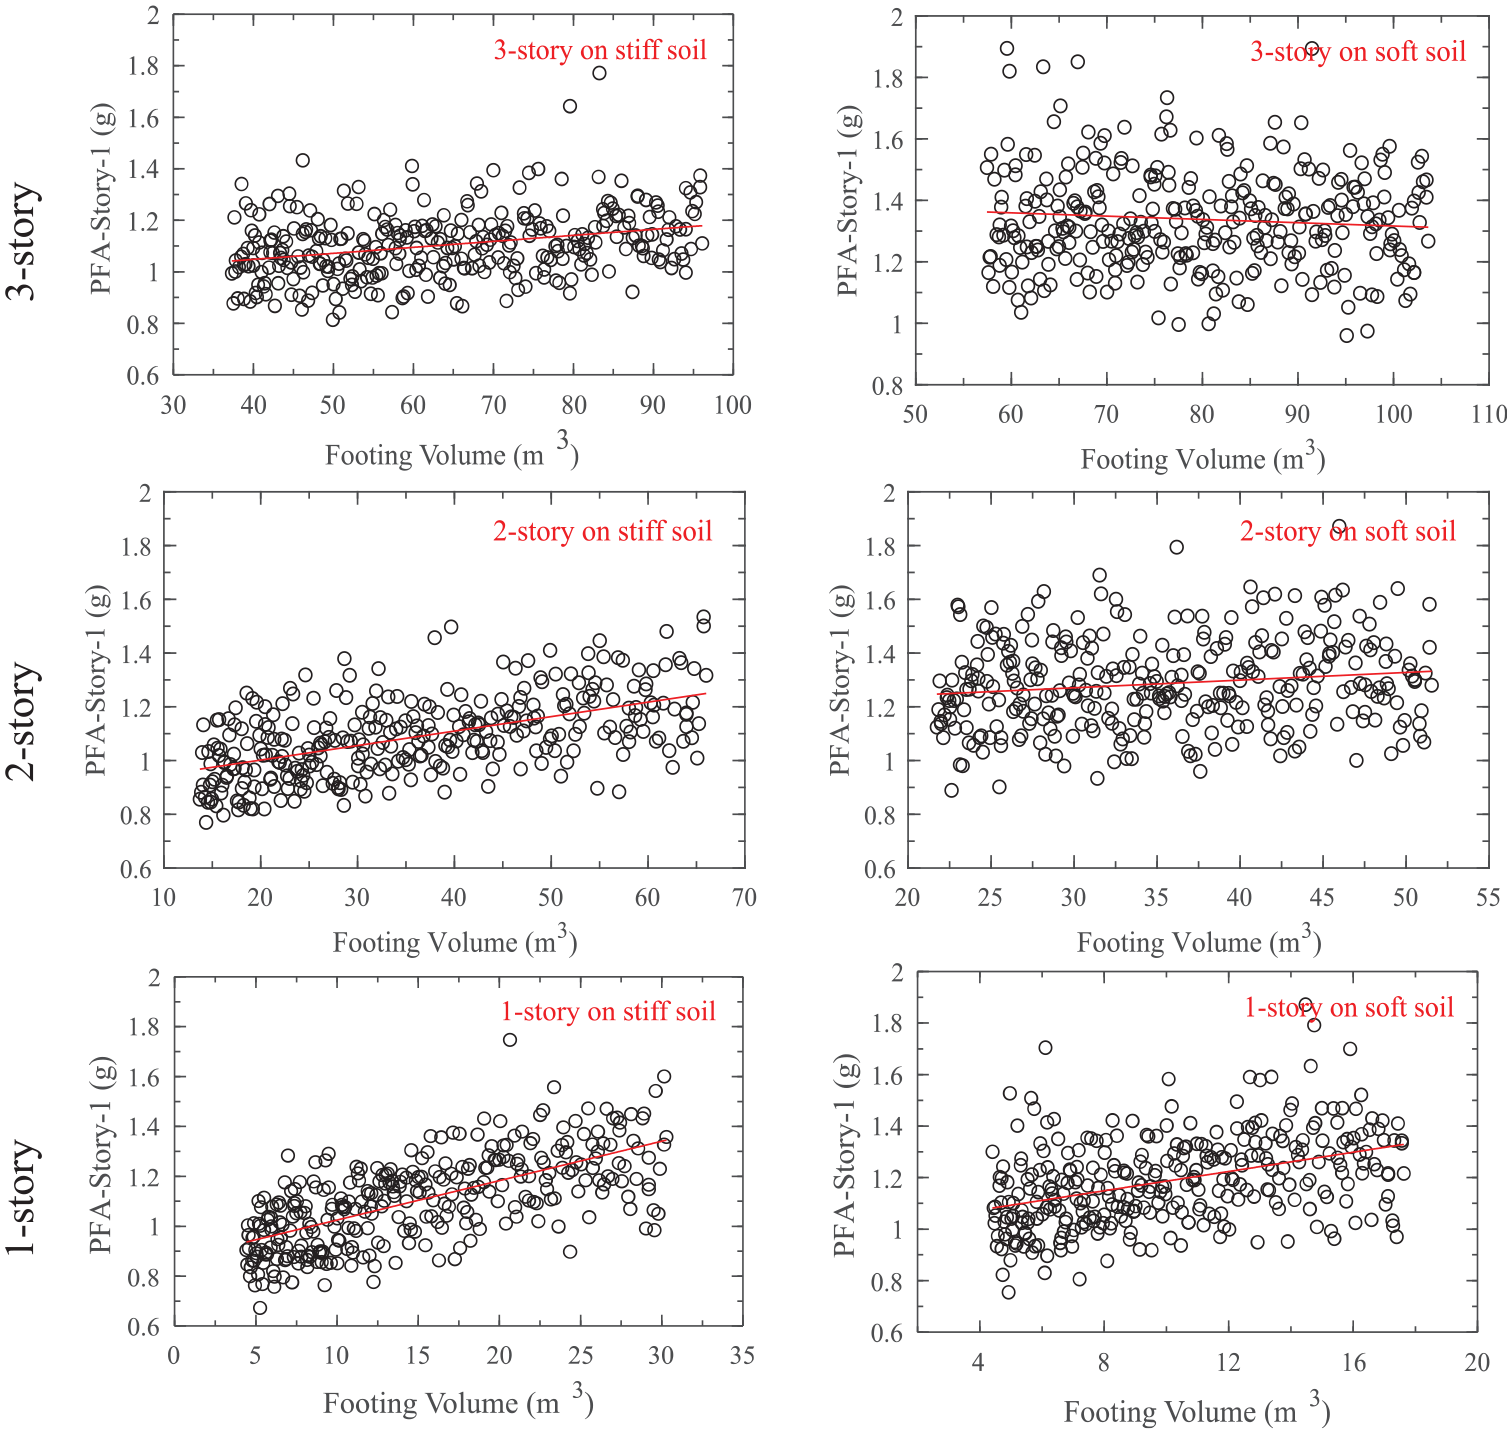
Impact of footing size on the peak floor acceleration at the first story of the buildings at the design level.
Loss assessment
Figure 8 illustrates the effects of footing size on the contributors to the repair cost of the archetype buildings. The repair costs, normalized by buildings’ replacement costs, are divided into the following categories: losses due to building collapse, losses from demolition due to excessive residual drift, and costs associated with structural and non-structural repairs. The non-structural repair costs are further classified into acceleration-sensitive and drift-sensitive losses. For better readability, the data samples are grouped into 60 bins. Since the buildings were analyzed under design-level seismic events, as expected, no instances of collapse were observed, meaning that collapse does not contribute to the repair cost of any of the buildings. As shown in this figure, buildings on stiff soil incur smaller repair costs compared to those on soft soil. This is consistent with the higher stiffness and strength of stiff soil, which reduces damage and associated repair costs.
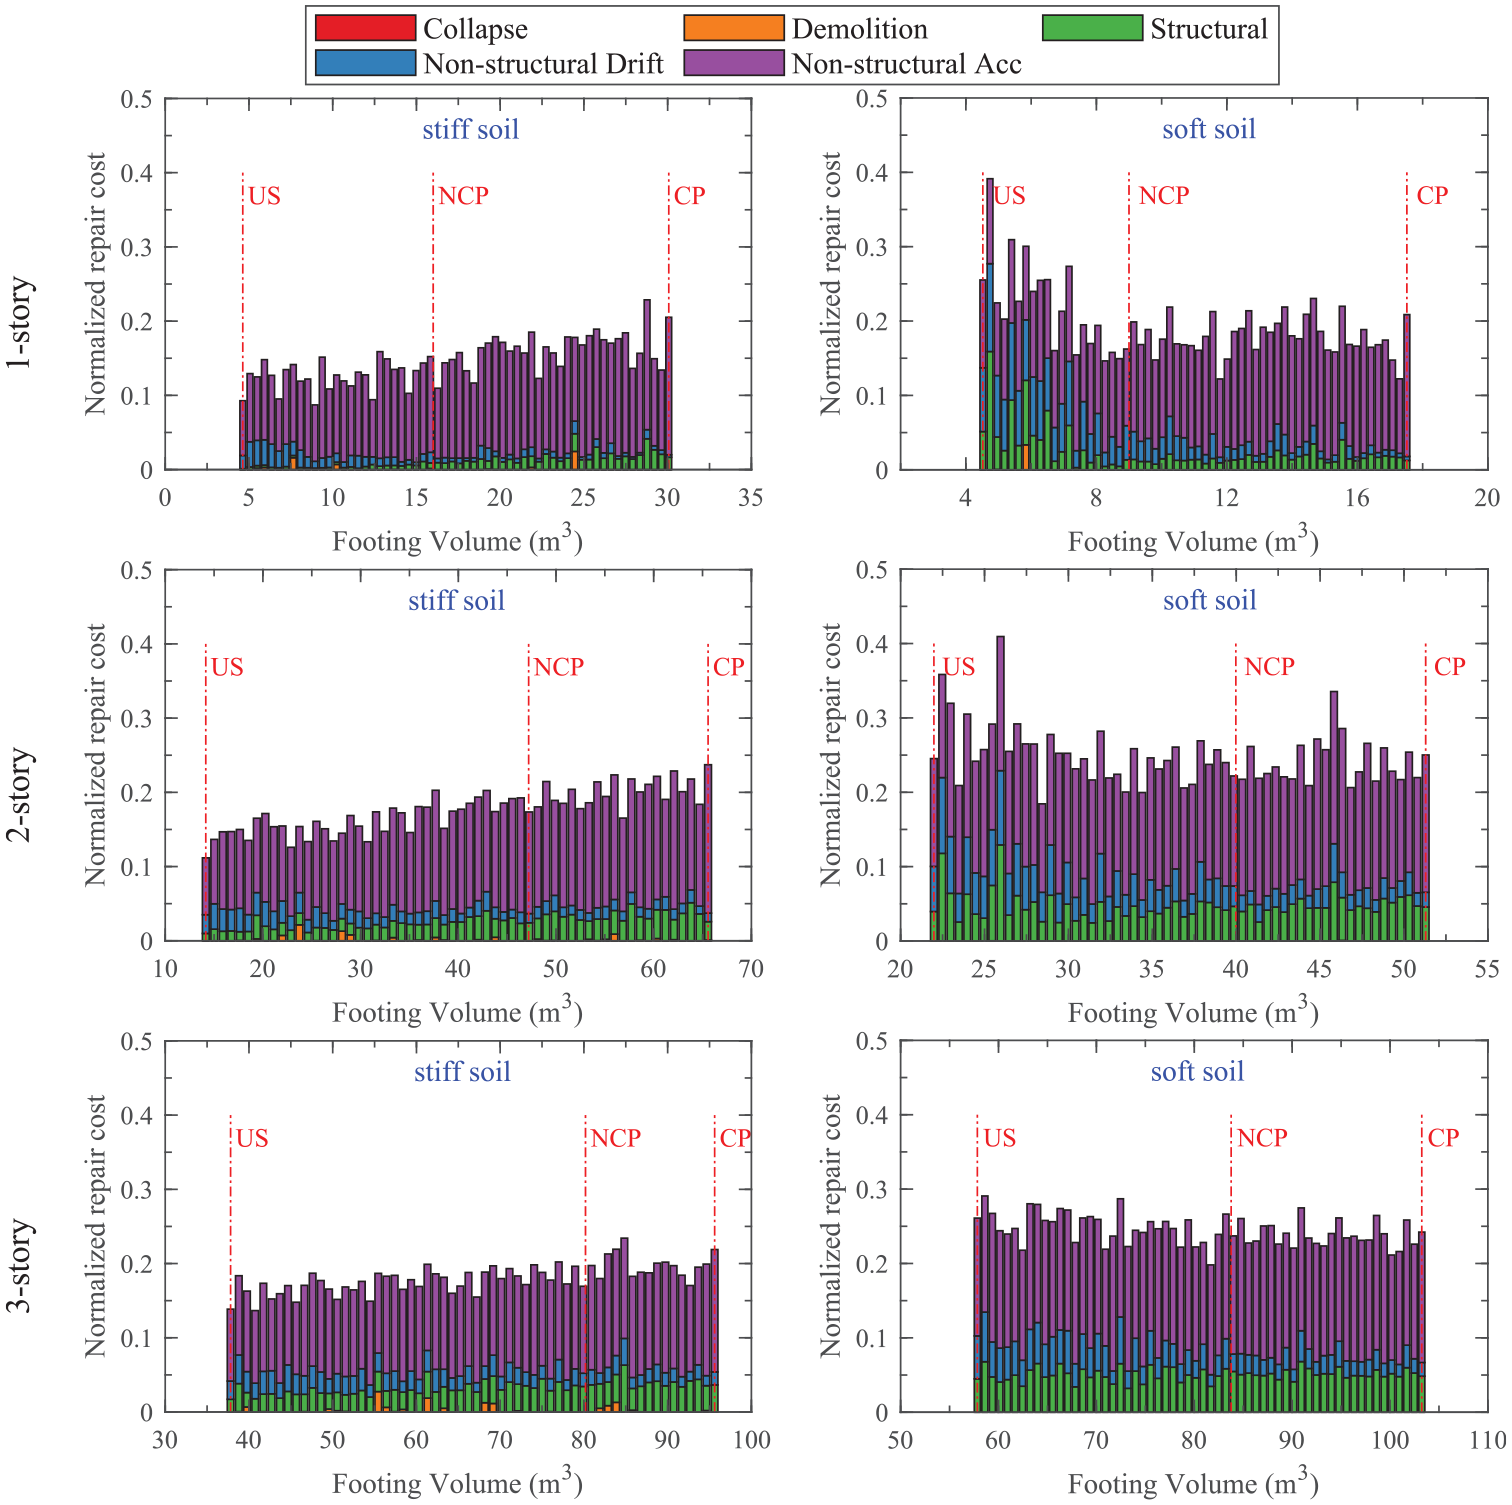
Impact of footing size on the expected repair cost of all archetype buildings at design level.
The primary contributor to the repair cost of buildings on stiff soil and those on soft soil with large footings (e.g. CAN-CP footings) is the damage to non-structural acceleration-sensitive components. This observation is consistent with findings from previous studies on fixed-base buildings (Hwang and Lignos, 2017a, 2017b; Madani, 2024). As shown in Figure 8, reducing the footing size from CAN-CP to US increases the expected repair cost by about 50% for the 1-story building on soft soil, while there is no significant change in expected repair costs for taller buildings on soft soil. However, for footings larger than CAN-NCP, the changes in repair cost are negligible. In contrast, for buildings on stiff soil, reducing the footing size leads to a decrease in repair cost (e.g. a 30% reduction from CAN-CP to US for the two-story building). This is due to reduced damage to acceleration-sensitive non-structural components as the footing becomes smaller. The contribution of drift-sensitive components to overall repair cost is relatively small for all buildings on stiff soil and for buildings on soft soil with large footings. However, for buildings on soft soil with smaller footings (e.g. US footings), especially for shorter buildings, non-structural drift-sensitive components have a more significant impact on repair costs. This suggests that using larger footings can help mitigate the adverse effects of excessive drift in these buildings.
As shown in Figure 8, the variability in repair costs due to drift-sensitive components is more pronounced for smaller footings compared to larger ones, corroborating the trends in SDR-Tot observed in Figure 6. The gradual changes in the acceleration-sensitive repair cost are also in agreement with the variation in PFA across different footing sizes, as depicted in Figure 7. Moreover, the total repair cost for buildings on soft soil is more dispersed than for those on stiff soil. For buildings on soft soil, Figure 8 indicates that when footing size exceeds that of CAN-NCP footing, the variability in repair cost remains essentially unchanged as footing size increases. The contribution of demolition cost is generally minimal for all buildings studied at the design seismic intensity.
To investigate whether similar trends can be expected at lower shaking intensities, a similar analysis process was conducted with the ground motion scaling factors reduced by 50%. Figure 9 demonstrates that the trends observed at the DE level are maintained at the 0.5 × DE level, using the two-story building on stiff soil as an example. At both intensity levels, non-structural acceleration-sensitive components are the primary contributors to repair costs. At this reduced intensity, the result is that decreasing the footing size from CAN-CP to US leads to a 70% decrease in repair costs. The contribution of drift-sensitive components to the total repair cost remains minimal at both intensities. As expected, repair costs at 0.5×DE are noticeably lower than those at the DE intensity.
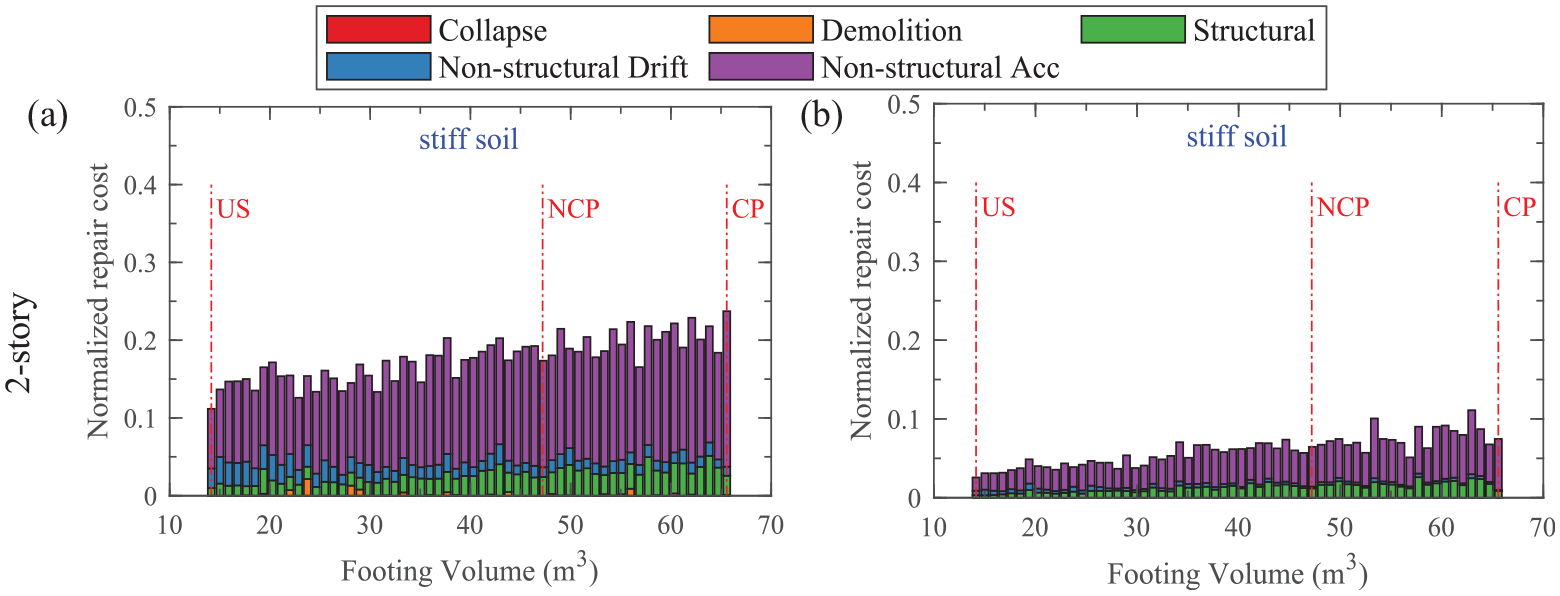
Impact of footing size on the expected repair cost of the two-story building on stiff soil at(a) design level and (b) half the design level.
Recovery time assessment
Impeding factors delay time
Figure 10 illustrates the impeding factor delay times for all archetype buildings. As previously discussed, the total delay time for a repairable building is calculated by adding the inspection time to the longest duration among the other delay factor times (Figure 4). This delay time is added to the repair sequence time to calculate the repair path downtime, and the longest repair path downtime represents the total building downtime. The delay times shown here represent the median of each of the delay factors for each sample (320 samples in total for each building, where each sample involves numerous realizations in Pelicun and TREADS as discussed above). In general, contractor mobilization delay is the primary delay time.
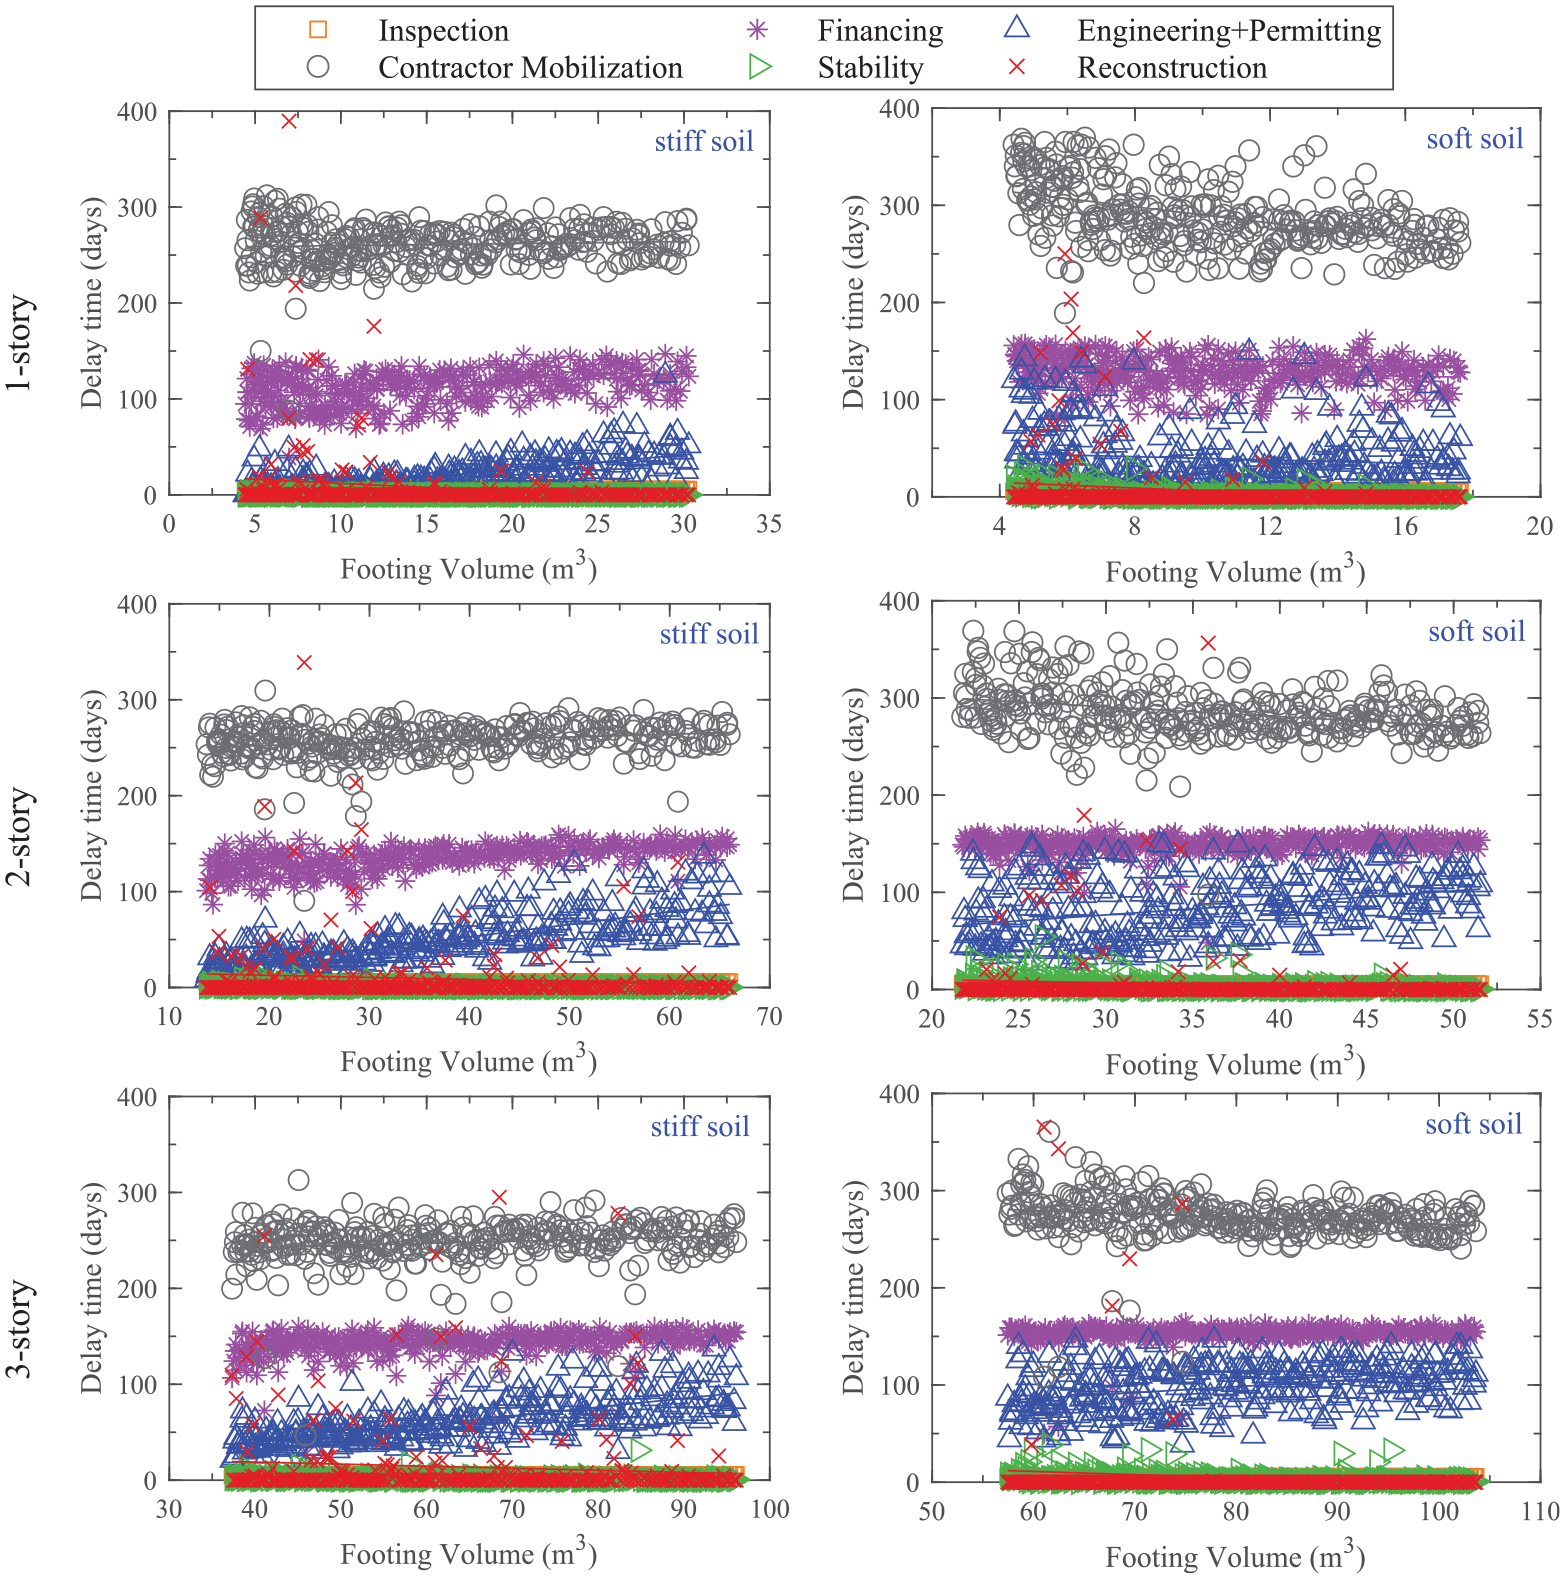
Impact of footing size on the delay time of all archetype buildings.
The impact of footing size on the delay time is minimal across all archetypes, although there is a slight variation in the contractor mobilization delay time for buildings on both stiff and soft soil. For buildings on stiff soil, this variation reflects the trend observed in PFA (Figure 7), where an increase in footing size results in an increase in delay time (e.g. a 10% increase from US to CAN-CP for the 1-story building). However, this effect becomes less pronounced as building height increases (e.g. 5% from US to CAN-CP for the three-story building), and the variability in delay times decreases for taller buildings. For buildings on soft soil, contractor mobilization delay time shows a decrease with increasing footing volume (e.g. 15% from US to CAN-CP for the one-story building), corresponding to the trend in SDR (Figure 6), indicating that this delay is affected by both PFA and SDR. The minimal change in delay time with varying footing sizes suggests that these changes do not significantly alter the repair class of the building components, and thus, the delay time remains relatively constant. Variations in other impeding factors do not affect the total delay time, as they consistently resolve more quickly. A few data points in Figure 10 suggest that some buildings require replacement, which is consistent with the loss assessment results presented in Figure 8; in these rare cases, reconstruction results in a long delay time.
Recovery time
The recovery time is calculated by adding the delay time to the time required to repair building components. As discussed earlier, this time corresponds to the maximum duration needed for repair paths (Path A to Path D, see Figure 5). Figure 11 illustrates the time needed to complete each of these paths for each data sample to achieve functional recovery. There is minimal overlap between the downtimes of Path A and Path D, with Path A consistently having the longest duration. Since these repair paths proceed concurrently, the recovery time is always governed by the repair Path A, which is why the recovery time is not presented separately in Figure 11.
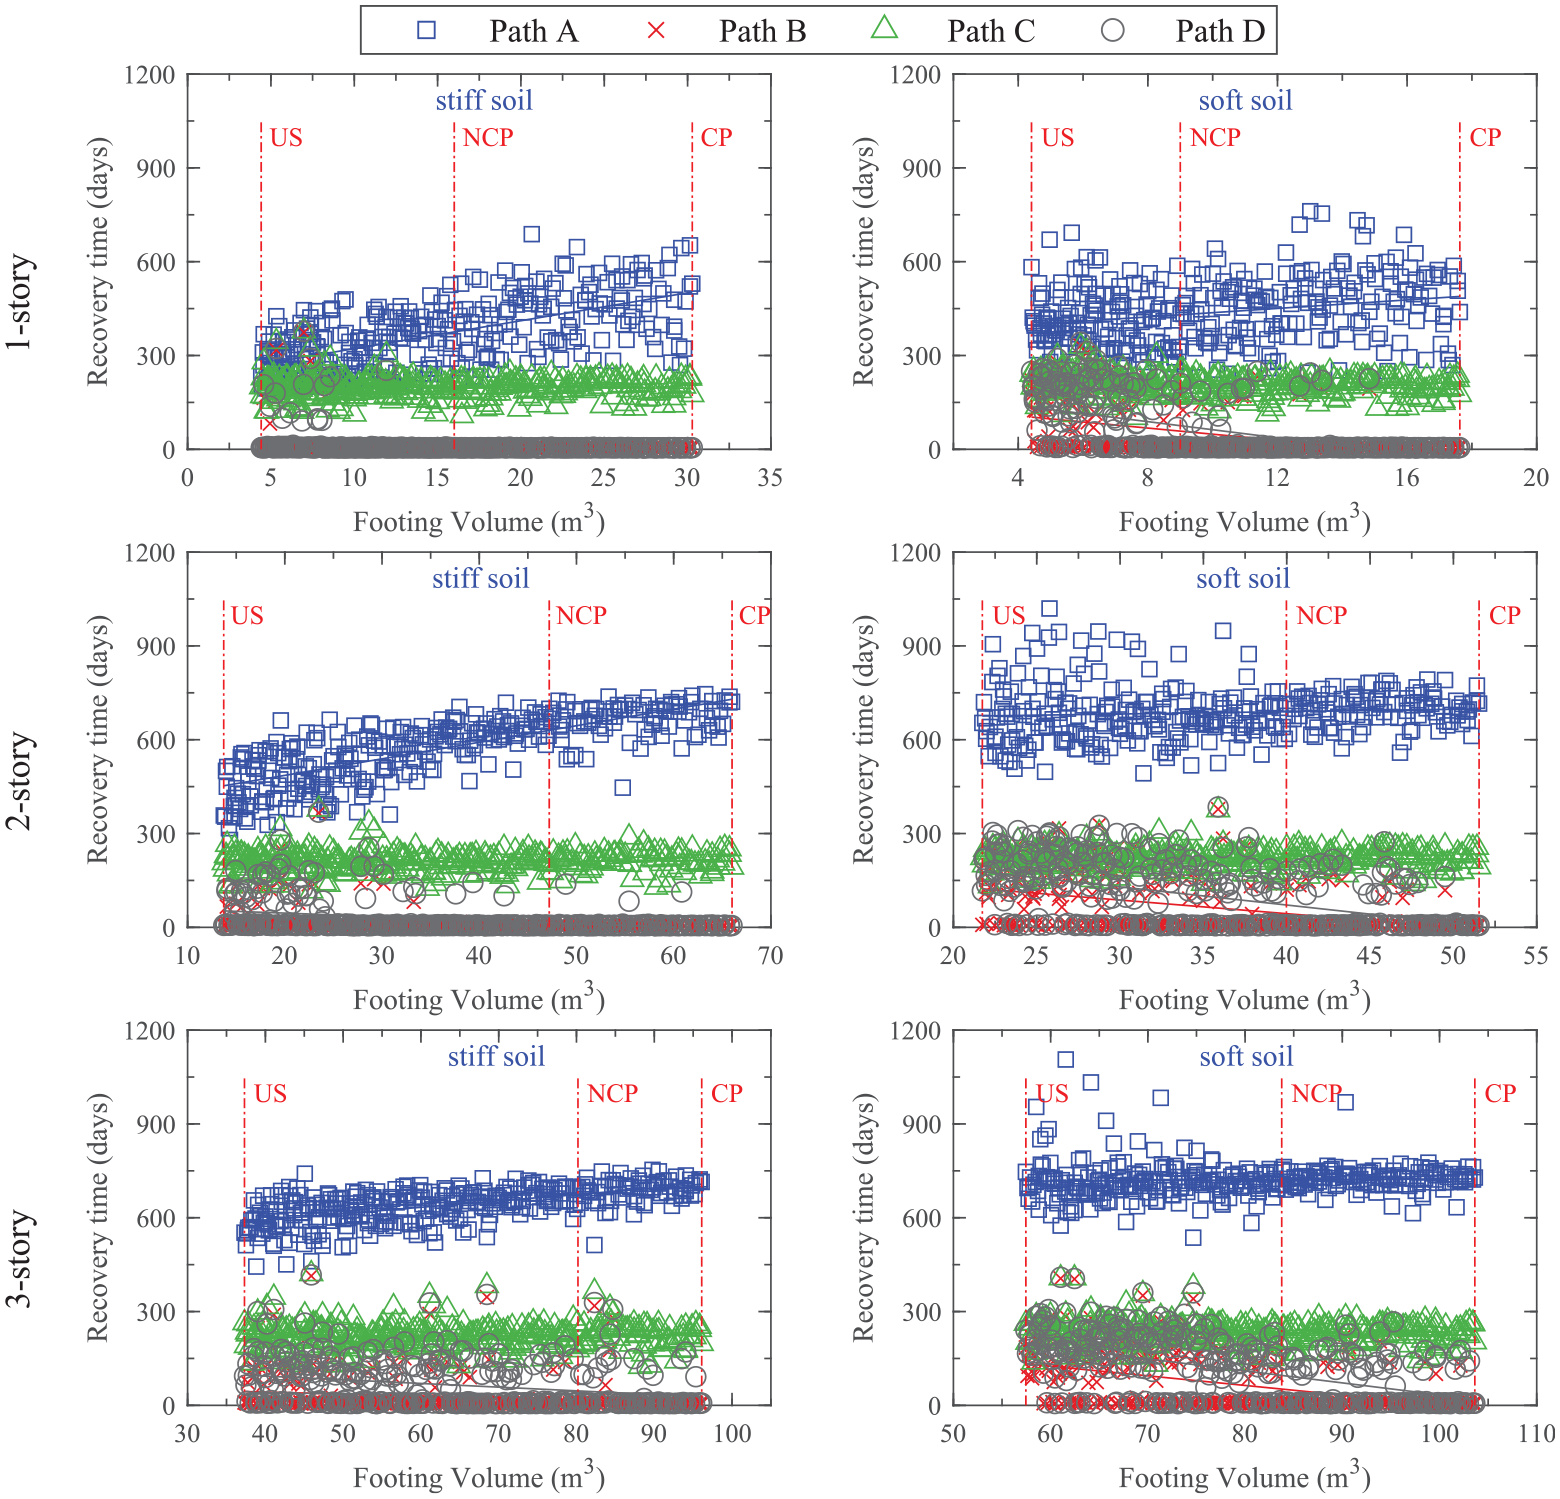
Impact of footing size on the recovery time of all archetype buildings.
Figure 11 also shows that buildings on soft soil generally have longer recovery times compared to those on stiff soil, consistent with the loss assessment results in Figure 8. For example, the one-story building on soft soil with large footings has an average loss ratio of 0.2 (Figure 8) and an average recovery time of 500 days (Figure 11). This finding aligns with the research by Almufti and Willford (2014), which suggests that a building with a normalized financial loss ratio of 0.2, requires approximately 17 months (510 days) to achieve functional recovery. Furthermore, as building height increases, the effect of the soil type on recovery time diminishes, likely due to reduced soil-structure interaction.
The results for other repair paths from Figure 11 are analyzed here to clarify the effects of footing size on each path. In repair Path B, which involves repairs to the building envelope, the recovery time is influenced by the SDR since exterior facades are drift-sensitive components. As buildings on soft soil experience higher drifts compared to those on stiff soil (see Figure 6), they require more time for Path B repairs. Moreover, buildings with larger footings have shorter recovery times for Path B when compared to those with large footings (e.g. an 80% reduction from US to CAN-CP for the three-story building) because of the higher SDR. For taller buildings, recovery time increases further, as a larger surface of exterior walls requires repairs. Path C involves elevator repairs, which have a fragility based on peak ground acceleration (PGA). Since PGA is not influenced by the building design, Path C recovery time shows little variation across different building heights and soil types. In contrast, Path D, which involves staircase repairs, is affected by drift, resulting in a pattern similar to that observed for Path B.
Figures 8 and 11 show that as the footing size increases for buildings on soft soil, the uncertainty of SDR, repair cost, and recovery time decreases. For buildings on soft soil, recovery time remains largely consistent across different footing sizes despite very large variations in footing volume and associated cost (with CAN-CP footing volumes up to 4.0 times US footing volumes). These findings, along with the observation that repair cost decreases only until footing sizes reach about CAN-NCP, suggest that a footing size near CAN-NCP is preferred for short-period buildings on soft soil. Similarly, increasing the footing size for buildings on stiff soil decreases the uncertainty in SDR, repair cost, and recovery time, except for the recovery time of the 1-story building on stiff soil. However, smaller-sized footings, such as those compliant with US standards, often result in SDR limit violation without significantly reducing repair cost. This undermines the potential benefit of shorter recovery times for buildings with smaller footings. Consequently, increasing the footing size from US to CAN-NCP improves the certainty of outcomes, while increasing the footing size further from CAN-NCP to CAN-CP appears to be unnecessary, as CAN-CP foundations have a volume of 1.2 to 1.9 times the volume of CAN-NCP foundations for the considered cases.
Concluding remarks
This article investigated the impact of footing size on the seismic performance of low-rise CBF archetype buildings, focusing on repair cost and recovery time. The study considered one-, two-, and three-story archetypes located in Vancouver, Canada, classified as a seismic category SC4 and situated on site class D soil. The buildings were designed according to the Canadian building code (NBC 2020, National Research Council of Canada, 2020) and steel design standard (CSA S16:19) using deterministic design values. Subsequently, uncertainty in material properties (including soil, concrete, and steel), gravity loads, seismic demand (set of 60 ground motion records), and inherent damping were addressed through iLHS in the analysis. The footing size was treated as a decision variable, ranging from a US-sized footing to a Canadian capacity-protected (CP) footing. To evaluate the influence of soil condition on the seismic response, two site conditions were considered: one near the site class C/D boundary (stiff soil) and the other near the site class D/E boundary (soft soil). The seismic performance of the archetypes was studied using OpenSees simulations under design-level earthquakes. The Pelicun package was employed for the loss assessment, providing detailed repair costs, while the TREADS package was used to estimate the time for the buildings to reach functional recovery. The main findings of this study are summarized below.
Increasing the footing size leads to greater internal frame deflection (SDR-CBF) while reducing footing rotation and sliding, which ultimately decreases the total drift (SDR-Tot). This behavior is consistent with the principles of the capacity design approach. In addition, enlarging the footings tends to increase the PFA, particularly in buildings on stiff soil.
Non-structural acceleration-sensitive components are the primary contributors to repair cost for the buildings studied at the design-level earthquake, followed by non-structural drift-sensitive components.
For buildings on soft soil, footing size has little impact on average recovery time. However, for buildings on stiff soil, larger footings tend to result in slightly longer recovery times, particularly for shorter buildings, mainly due to the increased values of PFA.
For the low-rise CBF buildings studied, contractor mobilization is expected to be the most significant source of delay, followed by financing. Moreover, the repair sequence involving interior component repairs is a key factor in determining the recovery time for these buildings.
For buildings on soft soil subjected to design-level intensity ground motions, the uncertainty of SDR, repair cost, and recovery time decreases as footing size increases. However, the expected recovery time remains largely unaffected by changes in footing size. In addition, while repair costs decrease with larger footings, this trend only continues up to about the CAN-NCP footing size. Given that larger footings, such as CAN-CP, are significantly more expensive (1.2–2.0 times the volume of CAN-NCP), these findings suggest that a footing size near CAN-NCP (formerly known as a rocking foundation) is preferable for short-period buildings on soft soil.
For buildings on stiff soil at the design-level intensity, similar to buildings on soft soil, increasing footing size is associated with reduced uncertainty in SDR, repair cost, and recovery time. Smaller footings may have shorter average recovery times, but this benefit is diminished by frequent violations of SDR limits and the lack of significant change in repair costs for small footings relative to larger footings. Therefore, while increasing the footing size from US to CAN-NCP improves the certainty of the outcomes, further increasing it beyond CAN-NCP appears unnecessary, as CAN-CP footings have 1.2–1.9 times the volume of CAN-NCP footings. Thus, as with buildings on soft soil, a footing size near CAN-NCP appears to be preferred for short-period buildings on stiff soil.
The conclusions of this study remain robust in the presence of uncertainties, demonstrating that the overall performance of the buildings is consistent even when considering the expected differences between design and as-built properties of the soil and the structure.
This study has several limitations. First, it examines only Canadian-designed buildings with CBFs as lateral force-resisting systems. Future research could expand the scope to include buildings designed according to other codes or those featuring different lateral force-resisting systems. In addition, the BNWF model used to simulate soil and foundation behavior does not account for the coupled effect of sliding and bearing strength, which may impact the accuracy of the results. Finally, future research could extend this work by incorporating long-term maintenance and operational costs, as well as potential savings from improved building resilience associated with different footing sizes and configurations. A more comprehensive assessment of these factors would offer a clearer understanding of the long-term economic benefits of various foundation designs over the building’s life span.
Supplemental Material
sj-pdf-1-eqs-10.1177_87552930251349854 – Supplemental material for Functional recovery time of low-rise concentrically braced frame buildings
Supplemental material, sj-pdf-1-eqs-10.1177_87552930251349854 for Functional recovery time of low-rise concentrically braced frame buildings by Hamid M. Madani, Lydell Wiebe, Peijun Guo and Sanda Koboevic in Earthquake Spectra
Footnotes
Acknowledgements
The authors also thank Andy Metten and Trevor Whitney (Bush, Bohlman & Partners LLP, Vancouver) for their contribution to design issues.
Declaration of conflicting interests
The author(s) declared no potential conflicts of interest with respect to the research, authorship, and/or publication of this article.
Funding
The author(s) disclosed receipt of the following financial support for the research, authorship, and/or publication of this article: The authors acknowledge with gratitude the financial support of the Canadian Institute of Steel Construction (CISC) and the Natural Sciences and Engineering Research Council of Canada (NSERC).
Data and Resources
Supplemental material
Supplemental material for this article is available online.
References
Supplementary Material
Please find the following supplemental material available below.
For Open Access articles published under a Creative Commons License, all supplemental material carries the same license as the article it is associated with.
For non-Open Access articles published, all supplemental material carries a non-exclusive license, and permission requests for re-use of supplemental material or any part of supplemental material shall be sent directly to the copyright owner as specified in the copyright notice associated with the article.