
Abstract
Current regional seismic risk modeling approaches predominantly emphasize direct financial loss as the primary measure of earthquake impact. Integrating recovery time into these models can better support decisions toward community resilience and a shift toward more people-centered and equitable disaster risk modeling. Although advanced probabilistic models for estimating recovery times of individual buildings are becoming more common, regional-scale quantification for community-level simulations remains overly simplified, often relying on low-fidelity approaches without the explicit consideration of key underlying drivers of recovery. This study proposes a methodological approach to improve recovery time consequence models in regional simulations by leveraging high-fidelity, building-specific recovery simulations. We employ downtime fragility functions and consequence models to characterize key elements of the recovery process, such as impeding factor delays and repair times. This approach provides a probabilistic estimation of post-earthquake recovery time to achieve two distinct recovery states, that is, shelter-in-place and functional recovery. The proposed methodology enables a more efficient quantification of recovery time at the building portfolio scale by leveraging simulation-based recovery time consequence models that could be seamlessly integrated into regional risk assessments. The proposed consequence models are trained based on 50,000 TREADS (Tool for Recovery Estimation And Downtime Simulation) recovery simulation results of modern high-rise (8–24 stories) reinforced concrete shear wall buildings at various ground-shaking intensity levels and applied, for illustrative purposes, to a portfolio of 218 buildings across Metro Vancouver, BC, under a magnitude-9 Cascadia subduction zone earthquake.
Keywords
Introduction
The performance-based earthquake engineering (PBEE) framework, as proposed by Cornell and Krawinkler (2000) and further elaborated by Moehle and Deierlein (2004), is now practically implemented in the Federal Emergency Management Agency (FEMA) P-58 methodology (FEMA, 2018). Such implementation facilitates probabilistic seismic performance assessments for individual buildings by deriving various decision variables or loss measures, such as repair cost. Quantifying the economic impacts of earthquakes can inform planners, policymakers, and other end users about underlying risks and potential risk mitigation strategies (e.g. Gentile et al., 2022). Nevertheless, assessing post-disaster recovery of the built environment is vital for quantifying (and eventually enhancing) community resilience, which in turn can inform more equitable recovery planning decisions (Galasso and Opabola, 2024). Proper quantification of building recovery within the built environment is essential and, when combined with household socioeconomic factors, can provide a deeper understanding of inequities in recovery across neighborhoods in a region (Costa et al., 2021). To this end, researchers have attempted to quantify post-earthquake recovery times by developing high-fidelity models to account for repair time as well as delays incurred prior to the start of repairs, that is, impeding factor (IF) delays (e.g. Almufti and Willford, 2013; Cook et al., 2022; Molina Hutt et al., 2022b; Terzic et al., 2021).
While the original PBEE framework and resulting recovery models were developed for individual buildings, extending it to a regional scale is essential to help bridge the gap between a single structure’s performance assessment and a community’s seismic resilience (Krawinkler and Deierlein, 2014). The PBEE framework enables building-specific component-level probabilistic risk assessments, that is, high-fidelity risk modeling. However, simplifications are necessary for a more efficient seismic risk assessment on a regional scale. The challenges at a regional scale can often be associated with limited computational resources and insufficient detailed exposure information (Papadopoulos et al., 2024), as well as excessive levels of uncertainty in vulnerability modeling (Silva, 2016). As a result, regional risk models generally employ a single, generic building archetype (or index building) for each building type (i.e. a specific building class) within a given building portfolio. This archetype represents the average (or modal) characteristics of that class. This approach contrasts with the detailed (i.e. building-specific) structural and nonstructural inventories used in the building-specific PBEE framework. The extension of the original PBEE framework to a regional scale can be further facilitated by employing simplified structural models for response simulations, as well as low-fidelity damage and consequence models, that is, building-level rather than component-level fragility and consequence models (e.g. Heresi and Miranda, 2023). Such models have been implemented in well-established, state-of-practice seismic risk assessment computational tools such as Hazus (FEMA, 2020) and OpenQuake (Silva et al., 2014). Although these tools have provided consequence models for recovery time, they oversimplify recovery and, often, provide deterministic values per damage state (DS) without accounting for key underlying drivers of recovery, that is, IF delays and repair time. To address this limitation and provide more informed estimates of recovery time by building upon individual building-level FEMA P-58 analyses, Burton et al. (2016) introduced a framework to perform a probabilistic evaluation of the post-earthquake recovery of buildings. Their framework defines discrete limit states linked to various functionality levels. While the work offers valuable insights into regional-scale recovery analyses by means of event trees for different limit states, it does not provide guidance on obtaining the underlying data required to implement their framework, deriving downtime fragility functions, that is, the probability of exceeding a building-level limit state as a function of earthquake-induced ground motion intensity, or computing repair time and IF delays, which could limit its adoption in regional risk assessments.
In this study, we propose a methodological approach to improve the recovery time consequence models by leveraging high-fidelity building-specific recovery simulations. The improved consequence models correspond to statistical distributions derived to characterize IF delays and building repair time, which are combined with exceedance probabilities obtained from downtime fragility functions to provide a probabilistic estimation of recovery time. This approach facilitates a more efficient recovery assessment of building portfolios across a broad spectrum of ground motion intensity levels, eliminating the need for time-consuming high-fidelity simulations. To illustrate the development procedure for the proposed methodology to derive the recovery time consequence models, we leverage detailed building-specific recovery simulations obtained from the Python-based implementation of Tool for Recovery Estimation And Downtime Simulation (TREADS) (Kourehpaz, 2022) as proposed by Molina Hutt et al. (2022b). The TREADS results are produced for a portfolio of modern high-rise reinforced concrete shear wall (RCSW) archetypes comprising 8, 12, 16, 20, and 24 stories subjected to ground motion records at five different hazard levels with a mean return period of 100, 475, 975, 2475, and 4975 years. Finally, the adoption of the proposed methodology in a regional risk assessment is demonstrated, considering a portfolio of 218 modern high-rise RCSW buildings in Metro Vancouver, BC, Canada subjected to 30 physics-based ground motion simulations of magnitude-9 (M9) Cascadia megathrust interface earthquakes.
Methodology
This section describes the methodology for deriving downtime fragility functions and the proposed recovery time consequence models to facilitate post-earthquake probabilistic recovery assessments for building portfolios. Figure 1 illustrates the key steps of the proposed methodology, which leverages high-fidelity building-specific recovery simulations (built up on conventional PBEE assessments). According to the PBEE framework, for a given building class represented by a given building archetype, a computational (structural) model is developed to perform nonlinear structural analyses under a given ground motion intensity level. Using the engineering demand parameters obtained from response simulations in conjunction with component-level fragility functions, a damage analysis is performed. The resulting damage information is then translated into losses using the corresponding consequence functions. Using damage and loss analysis (in terms of component repair times) results, high-fidelity recovery simulations are performed by accounting for various construction constraints (e.g. repair sequencing and worker allocation) and the contribution from IF delays (Step 1). These are the generic procedures to obtain inputs specified in Step 1. Any computational tool for nonlinear response analysis (e.g. OpenSees (McKenna, 2016), LS-DYNA (LSTC, 2019)), loss analysis (e.g. PELICUN (Zsarnóczay and Deierlein, 2020; Zsarnoczay and Kourehpaz, 2021), SP3 (2019)), and recovery analysis (e.g. TREADS (Kourehpaz, 2022), ATC-138 (FEMA, 2021), F-Rec (Terzic et al., 2021)) can be used in Step 1 in order to produce the data required for the subsequent steps. Building recovery realizations obtained in Step 1 are used to derive building class-level downtime fragility functions for desired limit states (Step 2A). These functions link the ground-shaking intensity to the probability of exceeding various post-earthquake limit states, enabling a probabilistic evaluation of building performance. The desired limit states entail target recovery states, as well as irreparable damage (IrD) and collapse (if applicable), both of which could be regarded as non-recoverable states requiring full building replacement. Deriving downtime fragility functions is crucial for assessing the contributions of negligible damage, repairable damage, IrD, and collapse to the overall recovery time at a desired recovery state. It should be noted that the definitions and terminology of limit states may vary across recovery time assessment frameworks (e.g. TREADS, ATC-138). Although our methodology can be applied to derive downtime fragility functions for any recovery state, it is crucial to clearly define the physical meaning of the recovery states adopted.
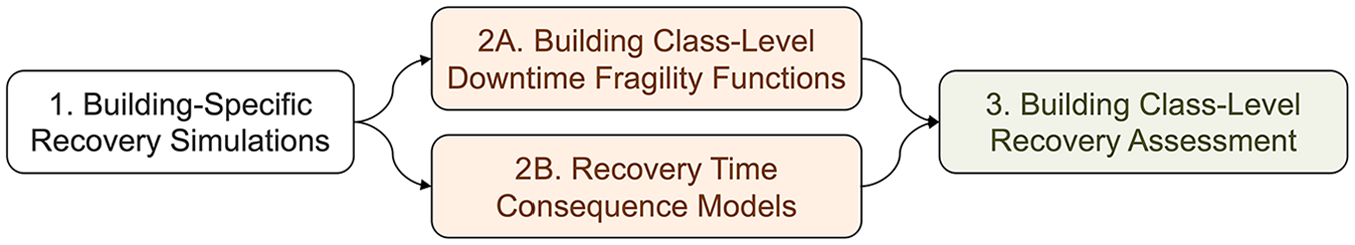
Methodology for deriving the proposed recovery time consequence models for a given building class.
Step 2B includes recovery time consequence models, which provide statistical distributions of inspection time for negligible damage, repair time/IF delays for repairable damage, and replacement time for IrD or collapse realizations. For negligible damage and IrD or collapse realizations, simple lognormal distributions are assumed, consistent with findings from past earthquake events in the literature (Almufti and Willford, 2013; Marquis et al., 2017). For repairable damage realizations, at a given ground motion intensity level, statistical distributions are derived distinctively for IF delays and repair times for each recovery state considered, using ground motion intensity as the model input. To determine the best fit across various statistical distributions, the root mean squared error (RMSE) is employed as the evaluation metric. RMSE is a statistical measure that quantifies the discrepancy between observed data (represented by the high-fidelity recovery estimates) and model predictions, with lower RMSE values indicating a better model fit (Li, 2010). While RMSE is used to compare the fitting error across various probability distributions, maximum likelihood estimation (MLE), as outlined by Baker (2015), is employed to estimate the parameters of the fitted distributions, consistent with the assumptions used to derive the parameters of downtime fragility functions. Per the MLE methodology, the parameters of the assumed distribution are determined by maximizing the likelihood function, ensuring that the resulting distribution best explains the observed (i.e. high-fidelity simulation) data. To mitigate estimation bias, k-fold cross-validation (Cawley and Talbot, 2010) is also employed, which partitions the original dataset into training and test sets.
In cases where no limit state is exceeded, that is, instances of negligible damage, the total recovery time is taken as the inspection time, which is typically relatively short and can occur within a few days. By aggregating realizations of negligible damage, repairable damage, IrD, and collapse (Step 2B), per their percentage contribution to the total recovery time derived from downtime fragility functions (Step 2A), a full probabilistic distribution of a building’s recovery time for a given building class could be generated for a desired recovery state under a given ground motion intensity (Step 3). The process of transitioning from individual building outcomes (Step 1) to building classes (Step 3) requires generating recovery simulations across a wide range of ground motion intensities and building characteristics (i.e. height) within a desired building class to develop robust consequence models. The workflow outlined in Figure 1 would be repeated for each building class to develop recovery consequence models specific to that class. Building class-level recovery estimates across all classes could then be aggregated to generate a recovery trajectory for an entire building portfolio, enabling its application in regional risk assessment, once recovery time consequence models are developed for all building classes. In summary, Step 1 outlines the input data required for training, Step 2 describes the development process of recovery time consequence models for one building class, and Step 3 demonstrates a potential application of the proposed methodology to building portfolios.
Illustrative implementation of the proposed methodology
To demonstrate the implementation of the methodology presented in the previous section, we use case-study archetypes along with specific computational tools employed for each step outlined in Figure 1. The following sections provide detailed information on the simulation results of the high-fidelity recovery analyses (Step 1), as well as the derivation of downtime fragility functions (Step 2A) and recovery time consequence models (Step 2B).
Database of seismic performance assessments
The dataset used to illustrate the implementation of the proposed methodology comprises a set of modern residential high-rise RCSW archetypes with 8, 12, 16, 20, and 24 stories. These archetypes were designed by Marafi et al. (2020a) for a case-study location in the Pacific Northwest (47.60° N, −122.30° W) to satisfy the minimum seismic design requirements of the ASCE 7-16 standard (ASCE, 2016). Their design had a maximum drift limit of 2%under the design basis earthquake, and a 1.0 flexural demand-to-capacity ratio at the base of the walls. Marafi et al. (2020a) developed the archetypes as special RCSWs in compliance with ACI 318-14 (ACI, 2014) requirements, considering a seismic force-reduction factor (R) of 6 and employing a modal response spectrum analysis procedure. The archetype buildings have a typical floor size of 30.5 m × 30.5 m (100 ft × 100 ft), with a story height of 3.05 m (10 ft). Each archetype’s lateral force-resisting system includes a symmetrical central core with two C-shaped walls, coupled in one direction and cantilevered in the opposite direction.
A multiple stripe analysis (MSA) procedure (Jalayer and Cornell, 2009) was adopted by Marafi et al. (2020a) to evaluate the structural response of the archetypes subjected to ground motion records representing 100-, 475-, 975-, 2475-, and 4975-year intensity levels according to the 2014 National Seismic Hazard Model (NSHM) (Petersen et al., 2014) for the considered location. Marafi et al. (2020a) performed a nonlinear response analysis for all structural models in OpenSees (McKenna, 2016). They performed response analyses in the cantilevered direction of the buildings only; thus, the impacts of torsion and bidirectional loading on structural response were not taken into account. A conditional mean spectrum (CMS) was utilized to characterize the anticipated demand, considering the target Spectral Acceleration (SA) at the fundamental period of each archetype. The target CMS for each return period was determined based on a site-specific probabilistic seismic hazard analysis. At each hazard level, 100 ground motion records were selected to account for the contribution from three types of seismic source mechanisms, that is, crustal, intraslab, and interface. The acceleration time histories were scaled to match the mean of the site-specific target spectrum (Jayaram et al., 2011). Additional information on the modeling strategy and ground motion selection process can be found in Marafi et al. (2019, 2020b). The building performance models for the archetype buildings, developed by Kourehpaz et al. (2021), include an exhaustive list of structural and nonstructural components such as shear walls, slab-column connections, façade, fitouts, elevators, and Mechanical, Electrical, and Plumbing (MEP) systems. Utilizing the response simulation results (i.e. engineering demand parameters) and a comprehensive inventory of structural and nonstructural components, as well as the corresponding component-level fragility and vulnerability functions, damage and loss assessments are performed using PELICUN (Zsarnóczay and Deierlein, 2020; Zsarnoczay and Kourehpaz, 2021), that is, an open-source loss estimation tool developed by the SimCenter (the Natural Hazards Engineering Research Infrastructure (NHERI) program’s computational modeling and simulation center) that implements the FEMA P-58 methodology. The dataset comprises 50,000 data points, representing five archetype buildings assessed across five intensity levels, with 2000 Monte Carlo simulations per case derived from PELICUN to account for the uncertainties influencing the seismic performance of the building archetypes.
TREADS analysis (Step 1)
TREADS is an open-source software package (Kourehpaz, 2022) for the probabilistic evaluation of a building’s temporal recovery trajectory. It enables high-fidelity recovery time or downtime simulations using detailed component-level damage and loss information. This tool implements the recovery time estimation framework developed by Molina Hutt et al. (2022b). TREADS assessments are carried out using FEMA P-58 damage and loss assessment results obtained from PELICUN, along with component repair class, floor repair phasing, and sequencing assumptions, as outlined in Blowes et al. (2023). For instance, building repairs are assumed to happen concurrently on every two or three floors. TREADS estimates earthquake-induced downtime to achieve various recovery states, such as shelter-in-place (SiP) and functional recovery (FR). A building’s ability to continue serving its primary function after an earthquake, even if all necessary repairs are not yet complete, is referred to as FR. In contrast, the SiP recovery state allows for relaxed post-earthquake habitability standards, allowing significant nonstructural damage and some structural damage, provided that occupant safety is maintained. According to TREADS, the FR recovery state only allows cosmetic damage and is hindered by damage to any structural, exterior façade, elevator, staircase, or interior components (e.g. water piping and Heating, Ventilation, and Air-Conditioning (HVAC) systems). On the other hand, in the SiP recovery state, a more significant extent of damage is anticipated, and, for example, SiP can be hindered if the number of damaged structural and staircase components at moderate to high damage levels exceeds 50% of the total number of components on every story. These represent current default assumptions in TREADS, which can be easily updated based on a user’s needs. More details about these assumptions can be found in Molina Hutt et al. (2022b). In addition, Kourehpaz et al. (2025) provides insight into key parameters that could significantly impact SiP and FR estimates, which can serve as a useful starting point for users looking to revisit specific assumptions.
In estimating the total recovery time, this methodology considers delays caused by IFs, as well as the building’s repair time. The building’s repair time is calculated by aggregating component repair times, considering detailed repair phasing, sequencing, and labor allocation schemes. TREADS uses consequence functions for components exceeding a certain repair class, associated with FR and SiP, to compute the component’s repair time. The concept of a repair class was first introduced in the REDi guidelines (Almufti and Willford, 2013), which is employed to identify the necessary repairs needed to achieve a specific recovery state. Each DS in each building component is assigned a repair class to represent whether the extent of damage would hinder achieving a target recovery state. For instance, all components assigned a repair class of two or higher hinder FR, and those assigned four or higher hinder SiP. The concept of a repair class is, in a way, an implicit fault tree (similar to what is used by other recovery time estimation methods, e.g. ATC-138) to determine whether the extent and criticality of damage to certain building components hinders recovery. Those systems are then flagged as needed (or not) to achieve a certain recovery state. The IF delays encompass a range of potential (external) factors that could delay the commencement of repair activities. These factors encompass activities related to building inspection, engineering, permitting, financing, stabilization (applicable when the building is deemed unstable), and contractor mobilization associated with various component groups, including structural, interior, exterior, MEP, elevator, and staircase. In instances where damage is minimal, and no recovery state is hindered, that is, negligible damage cases, the total recovery time is taken as the inspection time, which follows a lognormal distribution with a median of five days and a dispersion of 0.54, as outlined in the REDi guidelines.
TREADS also accounts for building replacement scenarios due to IrD and collapse. The probability of IrD is calculated based on residual drifts using the methodology outlined in FEMA P-58. The contribution of collapse instances to the total recovery time can also be accounted for in TREADS assessments by using collapse probabilities derived from the building’s collapse fragility function. In the event of IrD or collapse, the recovery time is taken as the building’s total replacement time, which includes reconstruction time and delays due to engineering, financing, and demolition activities. The reconstruction time is assumed to be two weeks per story for residential buildings, regardless of the structural system, which is consistent with the range considered in past studies (e.g. Du et al., 2021; Jarrett et al., 2015; Molina Hutt et al., 2019). The reconstruction delays are primarily determined by the demolition time, which follows a lognormal distribution with a median of 445 days and a dispersion of 0.57, obtained based on empirical data on multi-story concrete buildings from the 2011 Christchurch earthquake (Marquis et al., 2017). These are the baseline assumptions currently used in TREADS, but could be adjusted based on region-specific and empirical data. A summary of ground motion intensity measures, story drift ratios, expected repair costs, expected repair times, and recovery times for all building archetypes across all hazard levels is provided in Electronic Supplement I.
Downtime fragility function derivation (Step 2a)
Building class-level downtime fragility functions based on post-earthquake usability status, that is, SiP and FR, are derived by lumping together analysis results of modern high-rise (eight to 24 stories) RCSW buildings. For the shaking intensity range considered in this study, collapse cases are not observed, as the probability of collapse is negligible for the modern, code-compliant buildings examined (Kourehpaz et al., 2021). To enable the use of consistent fragility functions for a building class representing buildings of different heights and, as a result, different fundamental periods (T1), the average spectral acceleration (AvgSA) is used as a ground motion intensity measure. AvgSA is computed by calculating the geometric mean of the ground motion SA across the range 0.2 T1 to 2 T1. Here, T1 is taken as the fundamental period associated with the average height of the archetype buildings in the dataset, where the average height corresponds to a 16-story archetype building with a T1 of 3.5 s. This enables consistent damage and fragility characterization across buildings within a class. AvgSA accounts for spectral shape effects and is considered a more efficient and sufficient intensity measure than SA at a single fundamental period for characterizing seismic damage across a building class, as commonly assumed in conventional regional risk assessment frameworks (e.g. Eads et al., 2015; Minas and Galasso, 2019). While SA(T1) would require careful record selection and may lead to significant site-to-site variability in seismic loss, AvgSA can mitigate the site-dependence effects of ground motion record selection on seismic risk estimates for building portfolios as outlined by Kohrangi et al. (2017). Their findings also suggest that using AvgSA results in smaller ground motion scale factors in the conditional spectrum method compared to using SA(T1), which can enhance fidelity while preserving hazard consistency.
In Figure 2, downtime fragility functions are derived by fitting a cumulative lognormal distribution to the data (the probability of exceeding FR or SiP immediately post-earthquake and of experiencing IrD as a function of AvgSA, which can enhance fidelity while preserving hazard consistency) using the MLE procedure. At a given ground motion intensity level, the exceedance probability obtained from the downtime fragility functions represents the percentage of realizations where components are tagged with a certain repair class that hinders achieving the corresponding recovery state. In addition, the exceedance probabilities of recovery states are treated as indicators of a building’s robustness, i.e. the likelihood of a building not achieving a target recovery state immediately after an earthquake (Molina Hutt et al., 2022b). Figure 2 also compares the downtime fragility functions and the building class-level fragility functions for different DSs obtained for RCSWs as a function of story drift ratios as outlined in Appendix C, Volume 1 of FEMA P-58. DS1 is derived based on a story drift ratio threshold of 1%, corresponding to scenarios where moderate nonstructural damage may be observed. DS2 is based on a story drift ratio threshold of 2.2%, which may lead to significant nonstructural damage and moderate structural damage, such as concrete spalling at some locations and diagonal cracks on shear wall surfaces. The figure shows that the SiP downtime fragility function aligns well with the DS1 fragility function. Given that building DS functions are commonly included in regional risk models, this finding suggests that the DS1 fragility function could potentially be used as a proxy for the SiP downtime fragility function. By definition, the building condition in SiP is characterized by moderate structural and nonstructural damage that poses no safety threat to residents, making it loosely comparable to the definition of DS1. However, similar analyses should be conducted for building portfolios from other regions and construction eras with other structural materials, lateral-load resisting systems, and heights to generalize this conclusion.
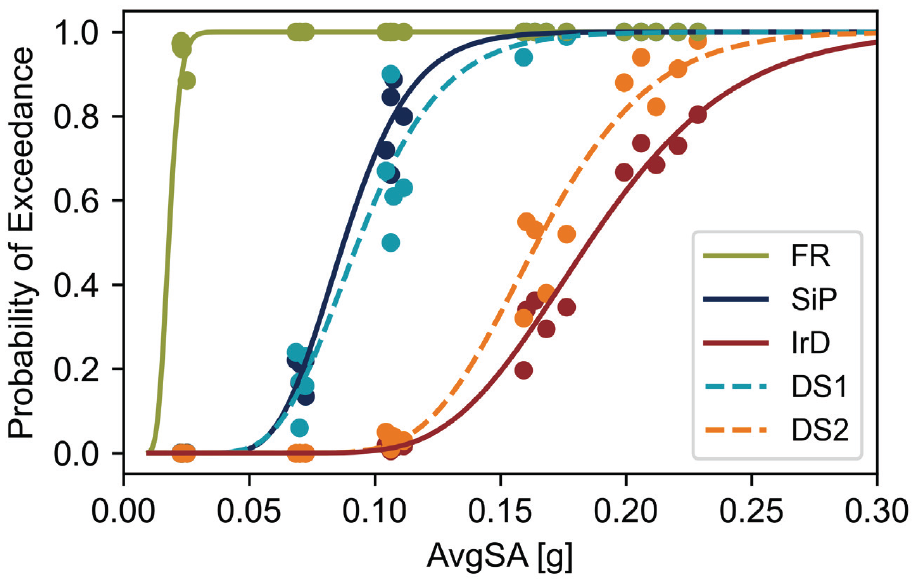
Downtime and damage fragility functions for modern high-rise reinforced concrete shear wall buildings derived based on analysis results of eight- to 24-story archetypes. FR, functional recovery; SiP, shelter-in-place; IrD, irreparable damage; DS, damage state; AvgSA, average spectral acceleration.
While a lognormal cumulative distribution is also used to derive the FR fragility function, the fitted function resembles a step function, where the exceedance probability is 1.0 for almost all ground motion intensities. This can be partially attributed to certain assumptions within the TREADS framework, which hinder the FR state even under low-ground motion shaking intensities. The primary contributing factor to such a high exceedance probability is related to the assumption that damage to any elevator or utility system components (e.g. water piping and HVAC) on each floor of the building can hinder the FR state. As a result, exploring alternative probability distributions for this recovery state could be beneficial in providing a more realistic representation of the underlying trend, given the absence of data points in the lower tail of the curve. For instance, zero-inflated probability distributions have demonstrated desirable performance in the seismic vulnerability modeling of building portfolios (Bessason et al., 2020). In our case, a Zero-inflated Poisson distribution (Lambert, 1992) could be a viable option to model the probability of non-exceedance of the FR recovery state since it accounts for frequent zero-valued observations; however, the detailed examination of the most appropriate distribution for the FR recovery state is beyond the scope of this study.
Consequence model development (Step 2b)
A series of probabilistic models are explored to estimate the distribution of building repair times and IF delays as a function of ground motion intensity level by leveraging high-fidelity recovery simulation results obtained from TREADS. According to the TREADS framework, the repair time and IF delays are treated as indicators of a building’s rapidity, that is, the probability of not achieving a target recovery state within a specified time frame. The probabilistic models considered in this study encompass various distributions, including normal, lognormal, exponential, Weibull, gamma, log-gamma, t, beta, and generalized extreme value (GEV). The optimal model is determined based on the minimum RMSE attained. A Python code used to generate probabilistic models is provided in Electronic Supplement II.
Since the consequences are very distinct from one hazard level to another (and only a small number of discrete hazard levels are available due to using the MSA procedure for demand estimation), the fitting process is performed separately for each intensity level and recovery state, using 10,000 simulation data points. This approach provides greater flexibility in capturing the unique characteristics of the consequences at each intensity level, as fitting a single distribution to the entire dataset as a function of ground motion intensity did not yield a suitable distribution among the parametric models evaluated in this study. We initially considered fitting a single parametric distribution to recovery time; however, since the recovery time distribution did not consistently conform to a unique or conventional parametric form across hazard levels, we chose not to pursue this approach. The results indicate that, on average, among the parametric models considered in this study, beta and GEV distributions are the optimal models for repair time and IF delays, respectively. While other distributions may be more suitable in some cases, for simplicity, we adopt a single distribution for IF delays and another for repair time, applicable across all hazard levels and both recovery states; however, this assumption can be easily refined if further adjustment is desired. The primary reason for this is to achieve a good tradeoff between the accuracy and simplicity of the models and their applicability in regional risk assessments. The selection of beta distribution for repair time was also suggested by Aljawhari et al. (2023) as the optimal choice. In their study, they leveraged FEMA P-58 high-fidelity seismic performance assessment results to derive statistical models for global (i.e. building-level) repair times as a function of building-level DSs. Figure 3 illustrates the repair time distribution across eight- to 24-story archetypes under the 975-year hazard level. The figure also illustrates the fitted beta distributions for both recovery states, namely, FR and SiP. Similarly, Figure 4 presents the distribution of IF delays, along with the fitted GEV functions.
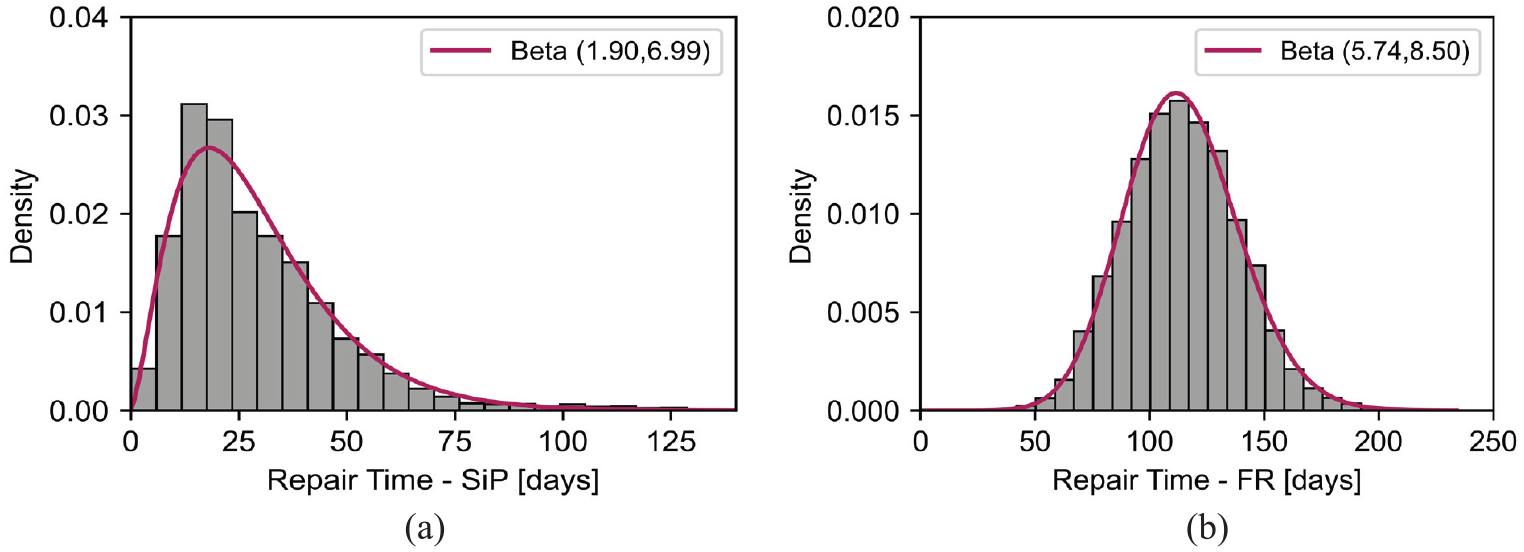
Distribution of repair times along with the fitted beta distribution across the building heights considered under the 975-year hazard level: (a) shelter-in-place (SiP) and (b) functional recovery (FR).
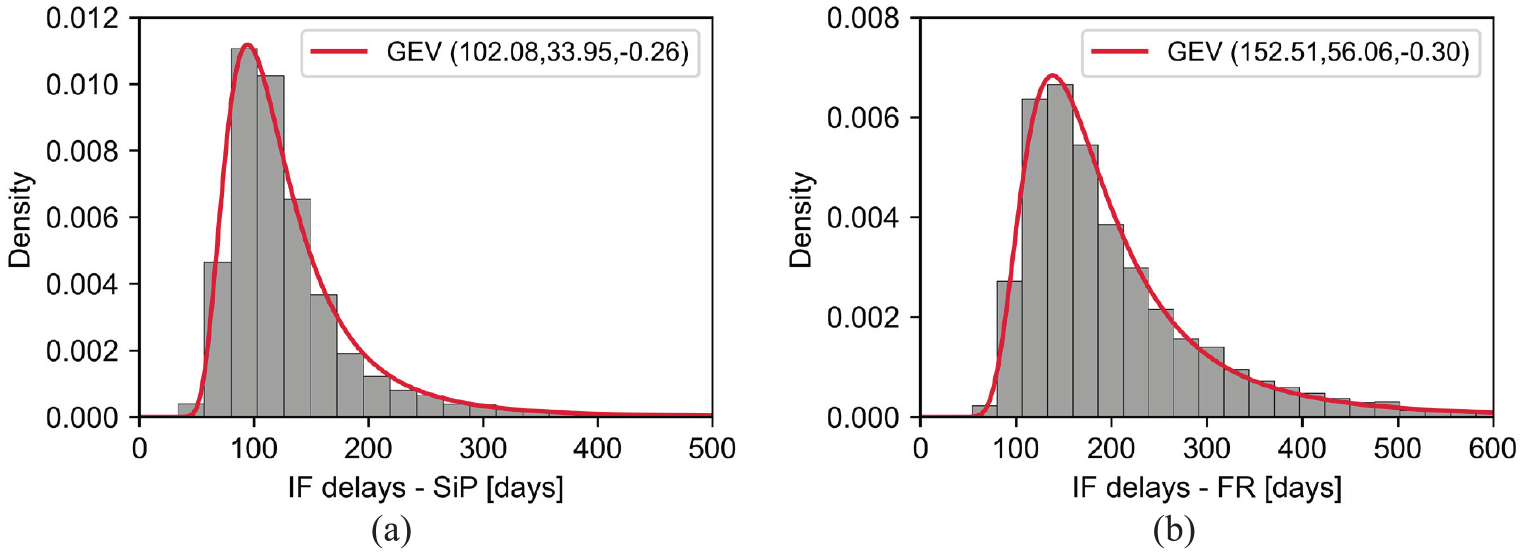
Distribution of impeding factor (IF) delays along with the fitted generalized extreme value (GEV) distribution across the building heights considered under the 975-year hazard level for (a) shelter-in-place (SiP) and (b) functional recovery (FR).
Since the simulation results are derived from five distinct ground motion intensity stripes, the probability distribution parameters are exclusively determined at those five specific hazard levels, that is, hazard levels with mean return periods of 100, 475, 975, 2475, and 4975 years. Logarithmic extrapolation between adjacent mean return periods is employed to estimate probability distribution parameters at intermediate hazard levels or ground motion intensities (e.g. Iervolino et al., 2010). For ground motion intensities that fall outside the range of the known data (e.g. below the 100-year return period or above the 4975-year return period), the parameters are set to be the same as those at the nearest known data points: the 100-year return period values for lower intensities and the 4975-year return period values for higher intensities. Tables 1 and 2 summarize the distribution parameters derived when all buildings are lumped together for IF delays and repair times, respectively, for FR and SiP recovery states. In Table 1, a negative ξ in the GEV distributions indicates that the IF delay distributions are always left-skewed across all hazard levels, and therefore, they correspond to the Weibull distribution family. Also, the larger σ at higher hazard levels indicates an increased scale factor relative to the lower hazard levels. In Table 2, comparing shape parameters α and β across different hazard levels reveals that their values become more similar as the hazard level increases. As a result, at higher hazard levels, the beta distribution tends to be more symmetric with a higher standard deviation. In contrast, at lower hazard levels, the distribution is heavily left-skewed with a much lower standard deviation. This can be attributed to greater uncertainty at higher hazard levels, due to more extensive damage.
Impeding factor (IF) delays probability distribution parameters a for shelter-in-place (SiP) and functional recovery (FR)
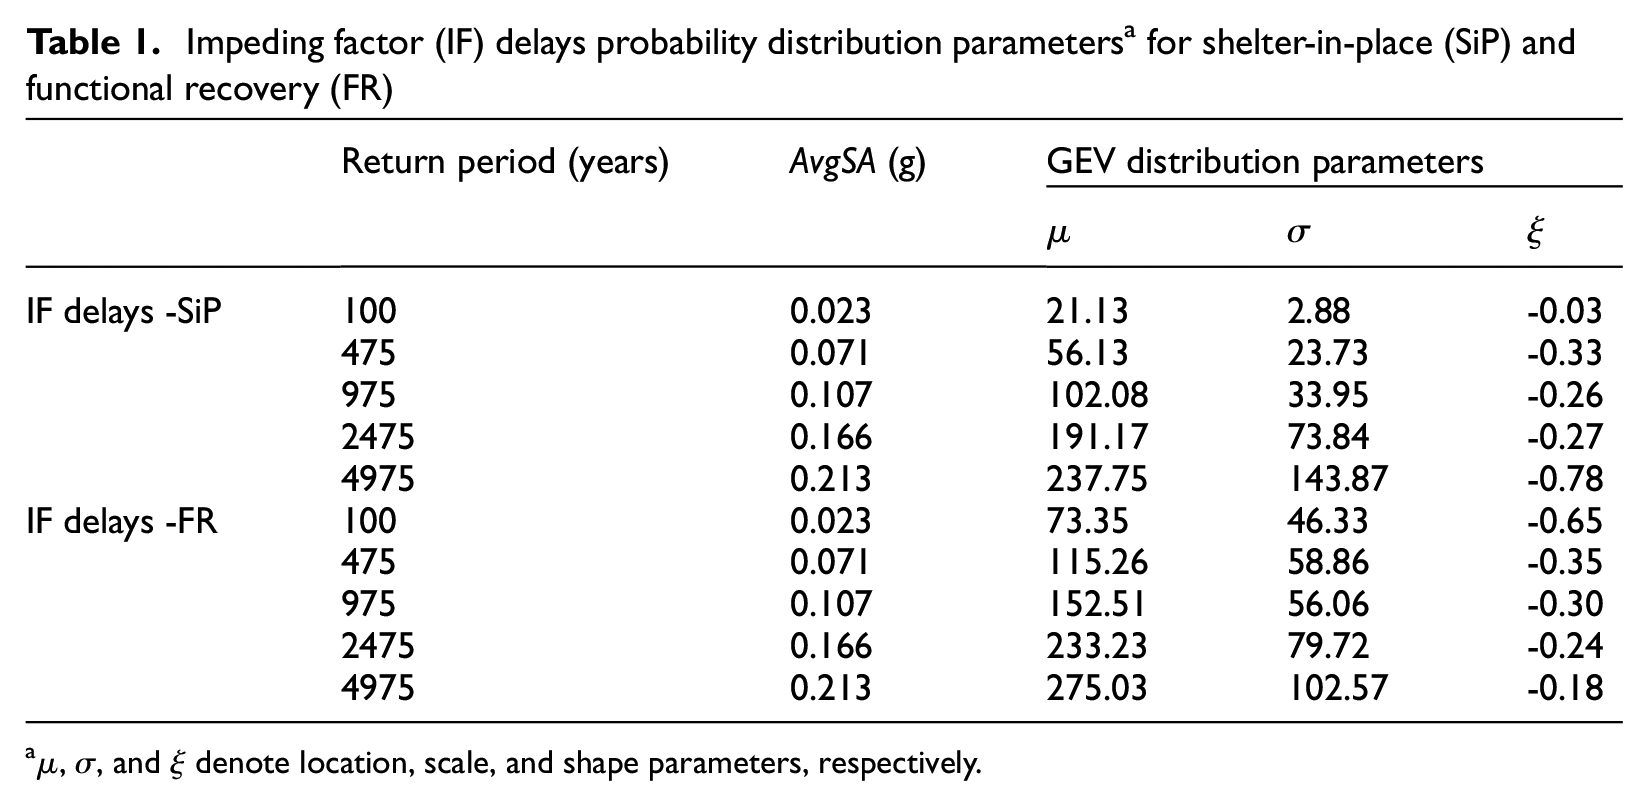
µ, σ, and ξ denote location, scale, and shape parameters, respectively.
Repair time probability distribution parameters a for shelter-in-place (SiP) and functional recovery (FR)
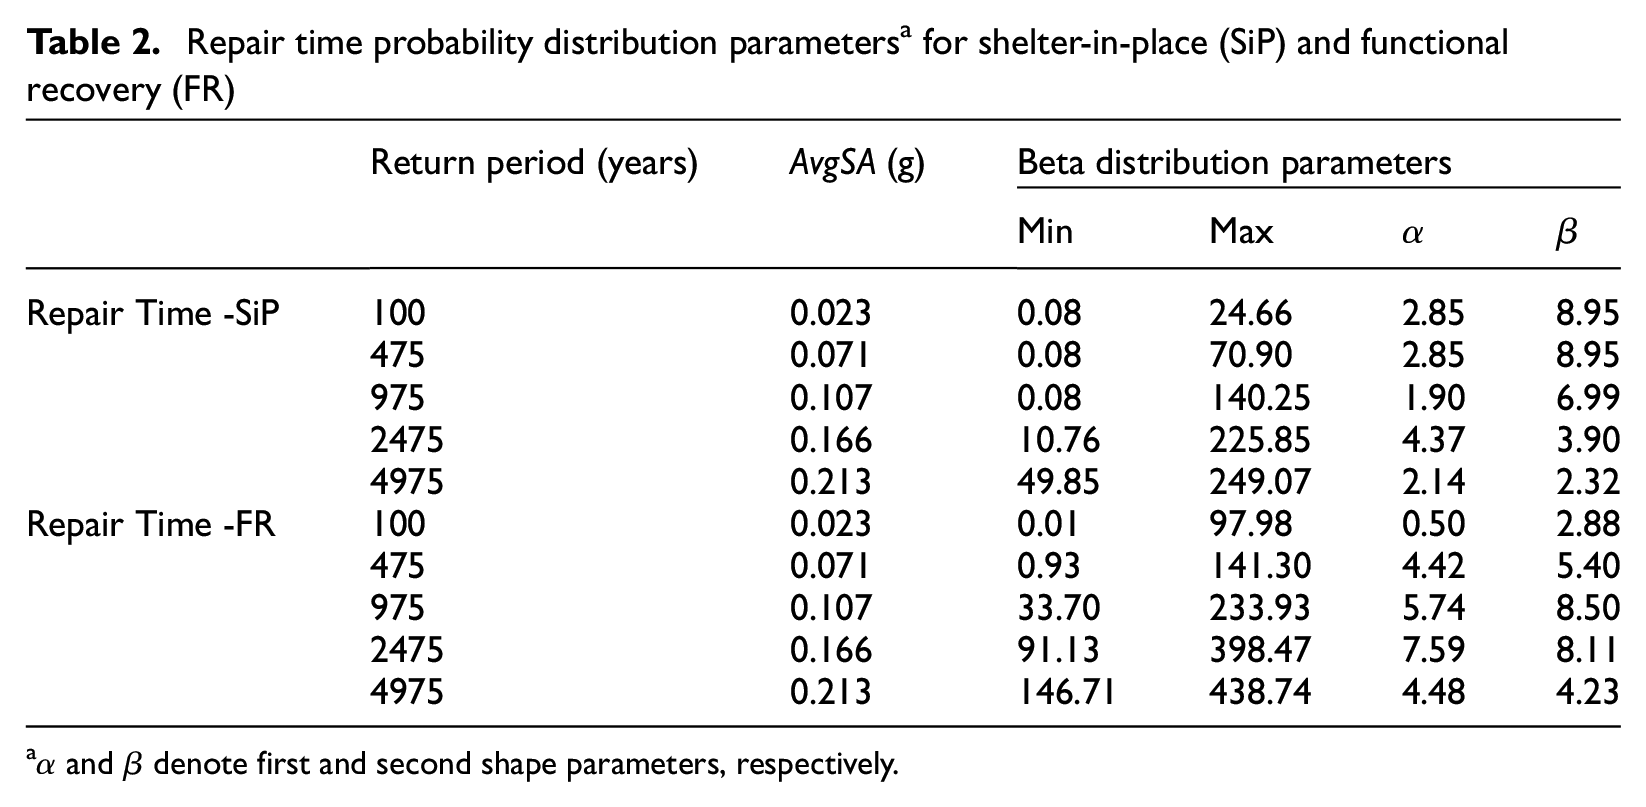
α and β denote first and second shape parameters, respectively.
The vulnerability-type functions for repair time and IF delays are derived by computing the AvgSA (ranging from 0.023 g to 0.123 g) associated with each return period. Figure 5 illustrates these vulnerability functions along with the probability distributions fitted at each hazard level for repair time and IF delays for both SiP and FR recovery states. The figure also indicates the mean values for the repair time and IF delay estimates, with a logarithmic interpolation shown as a dashed line. The figure demonstrates that the uncertainty associated with IF delays for both recovery states at all hazard levels is significant. The IF delays considered in TREADS are less sensitive to hazard intensity and can be triggered by even minor damage. There are various components of IF delays that contribute to the significant uncertainties observed in these repair estimates. Although IF delay estimates above 500 days are rare, they can still be observed. For example, at the 2475-year hazard level (AvgSA = 0.166 g), 95% of IF delays for SiP and FR fall below 530 and 590 days, respectively. At the 475-year hazard level (AvgSA = 0.071 g), although the uncertainty remains substantial, the 95th percentile values of IF delays for SiP and FR are 180 and 410 days, respectively. As a result, Figure 5c and d exclusively illustrates the IF delay distributions up to the 95th percentile.
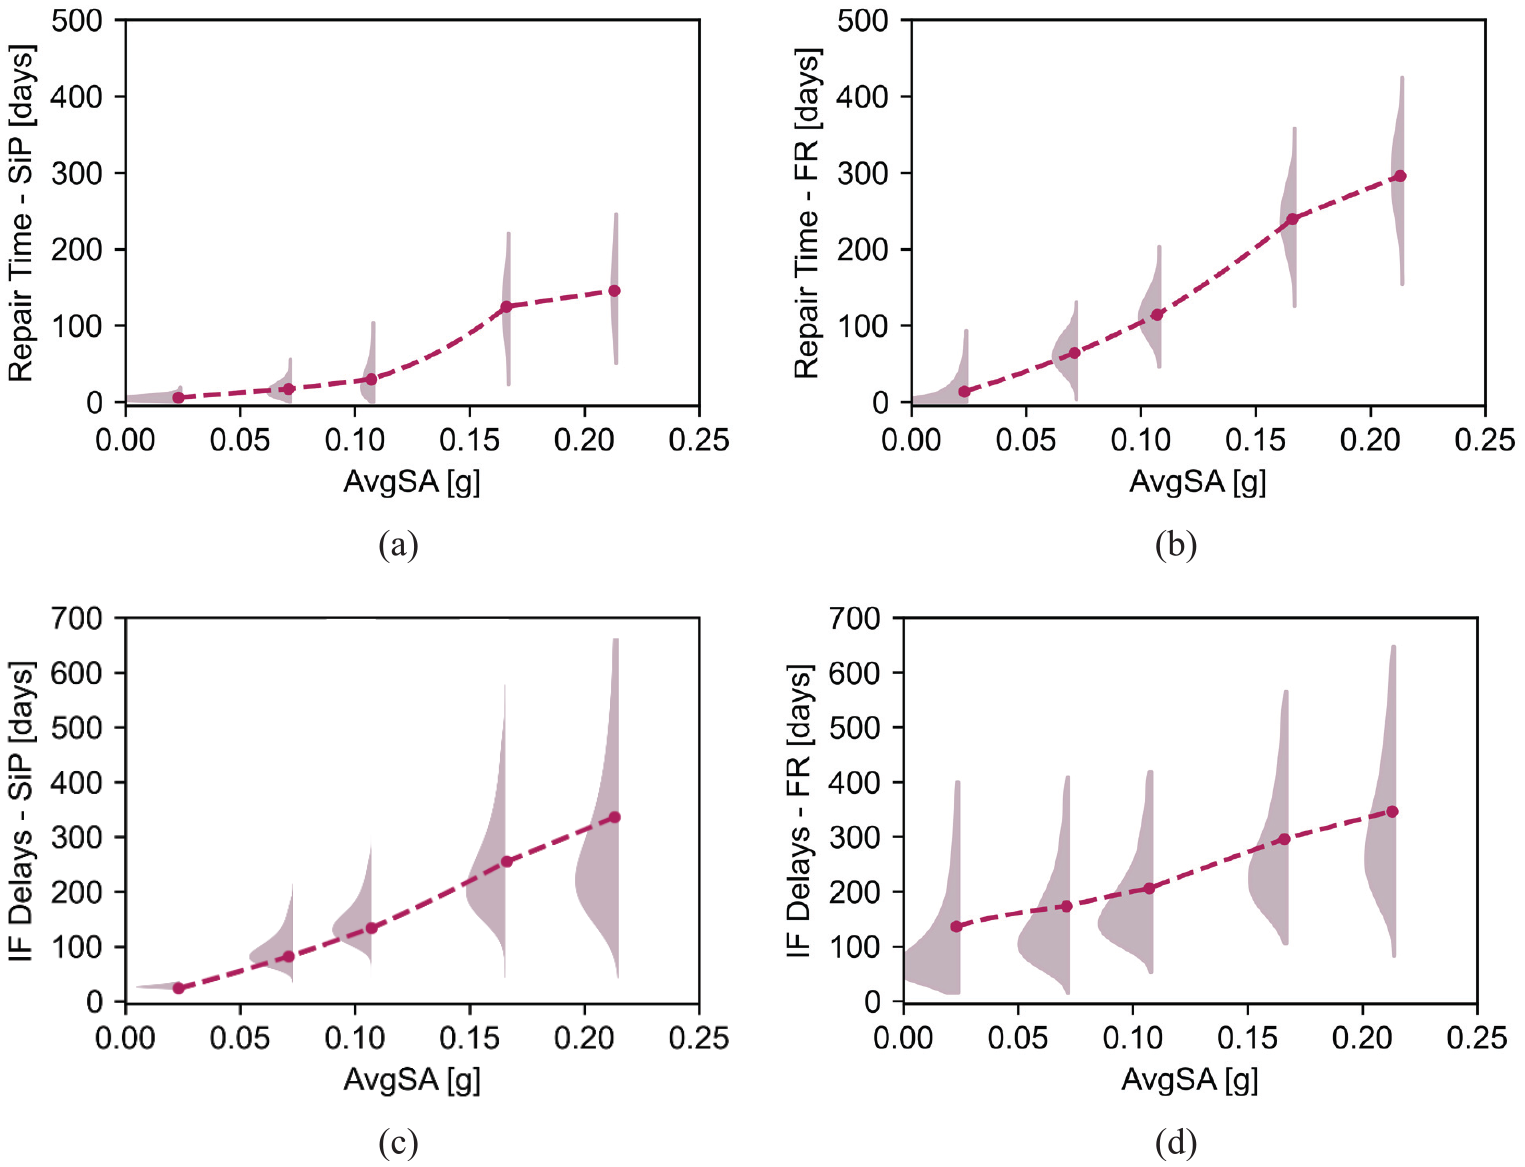
Fitted probability distributions and mean estimates for (a) repair time for shelter-in-place (SiP), (b) repair time for functional recovery (FR), (c) impeding factor (IF) delays for SiP, and (d) IF delays for FR across the building heights considered. AvgSA, average spectral acceleration.
Performance assessment of the recovery time predictive model (Step 3)
To assess the performance of the predictive model per the proposed methodology against high-fidelity recovery estimates, we carry out five-fold cross-validation by partitioning the original dataset into training and test sets five times. In each fold, various permutations of building heights are evaluated. Specifically, one building height (e.g. eight-story) is excluded to be used as the test set, while the remaining heights (e.g. 12, 16, 20, and 24 stories) are used for training. To measure the predictive performance of the models, we use the mean and the coefficient of variation (CoV) as the metrics to compare predictions against observations (i.e. TREADS results). We also follow a similar procedure to evaluate predictive performance on the test set within each fold to ensure the effectiveness of the predictive models. Figure 6 presents a comparison of the average across five folds for the mean recovery time and the CoV against TREADS estimates at all hazard levels for the SiP and FR recovery states. The mean recovery times at five hazard levels are computed as a weighted average of the probabilistic model predictions for repairable cases (including negligible damage cases) and replacement time for IrD cases. The results demonstrate that the predictive model estimates are within 10% of the TREADS estimates in all cases except for the CoV of functional recovery time at the 100-year hazard level. At the 100-year hazard level, the repair time cannot be modeled with a single probability distribution, and alternative mixture probability distributions may be more appropriate. However, exploring such models is beyond the scope of this study. Thus, the predictive model does not provide adequate predictive performance and leads to significant discrepancies compared to the TREADS estimates.
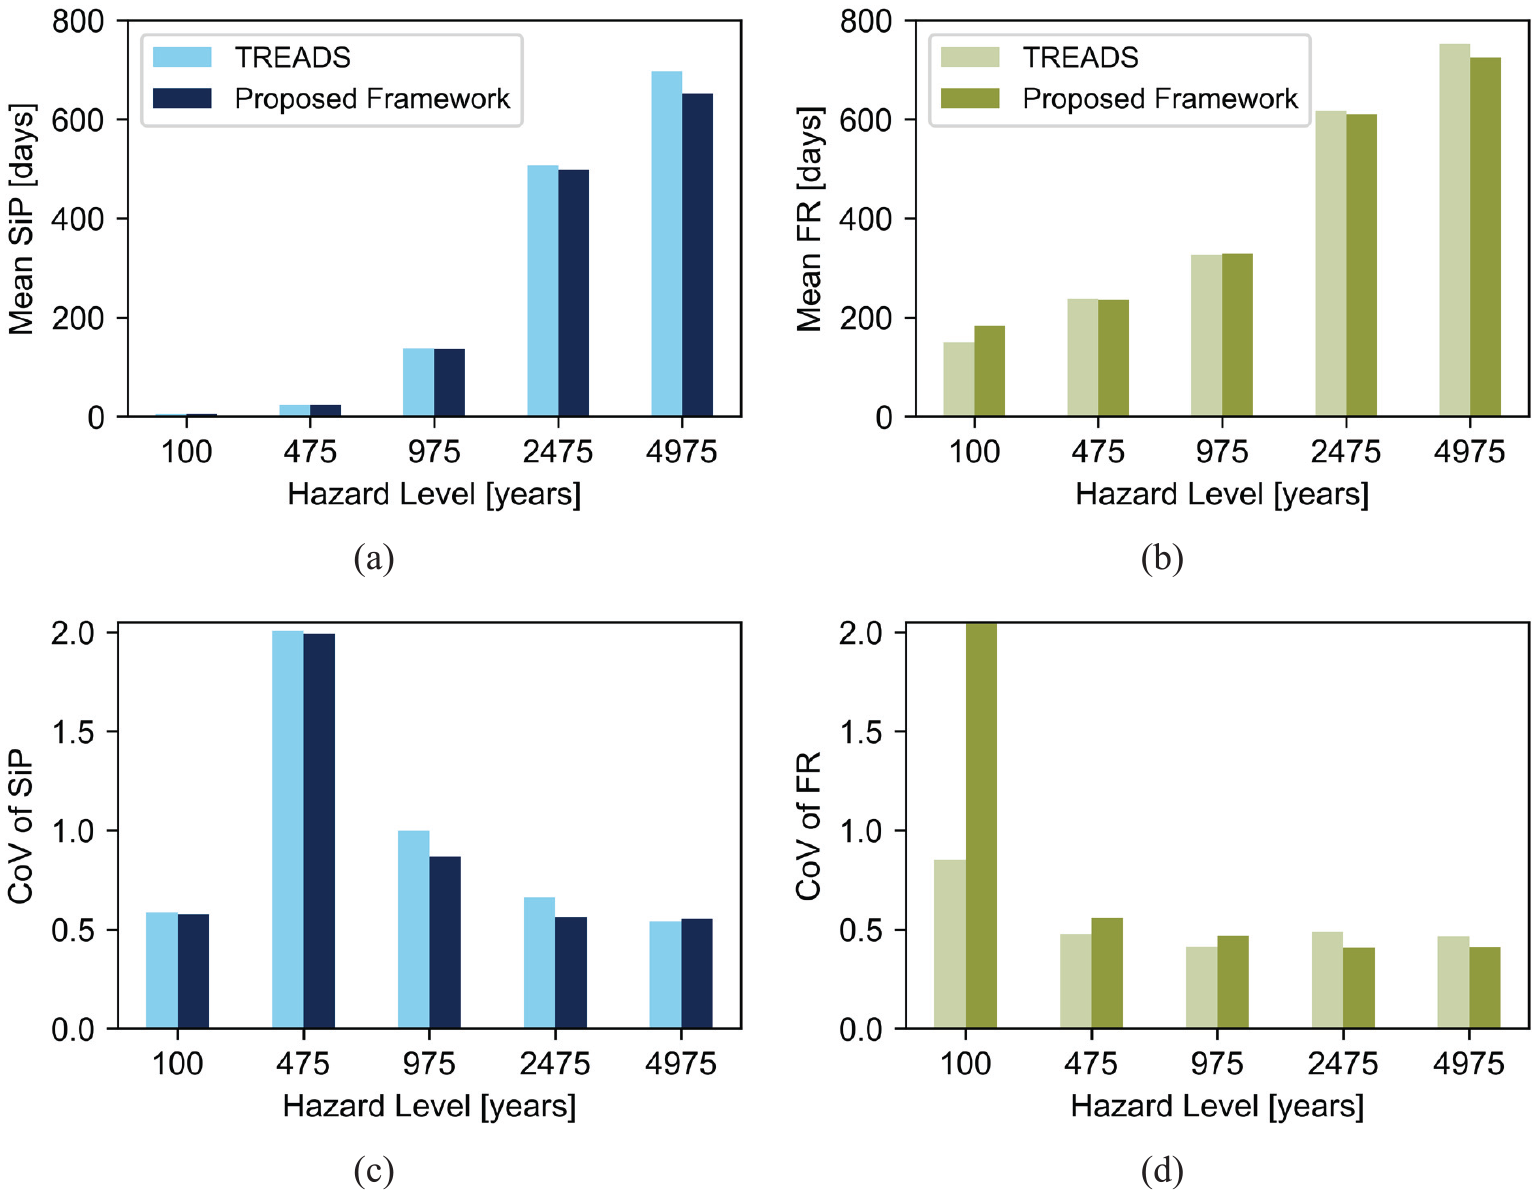
Comparison of estimates obtained from the proposed methodology and TREADS averaged across fivefolds: (a) mean recovery times for shelter-in-place (SiP), (b) mean recovery times for functional recovery (FR), (c) coefficient of variation (CoV) for SiP, and (d) CoV for FR.
Application for regional seismic risk assessment
To showcase its applicability in regional seismic risk assessments, the proposed methodology—utilizing the trained models from previous sections— is implemented in a portfolio of modern high-rise RCSW buildings (equivalent to the C2H building class) in Metro Vancouver, BC subjected to 30 scenarios of simulated magnitude-9 (M9) Cascadia subduction zone (CSZ) earthquakes generated by Frankel et al. (2018). The portfolio comprises 218 RCSW buildings, ranging from eight to 24 stories, constructed after 2005 across various municipalities in Metro Vancouver (Emporwis, 2018). The building portfolio includes every height within the prescribed range; however, we have intentionally focused only on buildings up to 24 stories to remain consistent with the original training dataset and avoid the issue of extrapolation beyond the training set, that is, generalizability, which may lead to poor predictive performance (e.g. Kourehpaz and Molina Hutt, 2022; Zaker Esteghamati et al., 2025). According to Canada’s national seismic risk model, buildings constructed after 2005 are assigned to the high-code (HC) seismic design level (Hobbs et al., 2023). Figure 7 displays the locations of the case-study modern high-rise RCSW buildings and the nearest stations where M9 CSZ earthquakes are simulated. Although these buildings are designed according to US design standards for a site in Seattle, WA, both the National Building Code of Canada (NBCC, 2020) and ASCE 7-16 seismic provisions aim to provide sufficient strength and ductility to ensure life safety under extreme earthquake events (DeVall, 2003; Eksir Monfared et al., 2021). Both US and Canadian design standards share similar goals; however, there may be some differences in the seismic performance of buildings designed under these codes. Although this is a limitation, it is not a concern for our regional case study, as the main objective is to illustrate the application of the methodology.
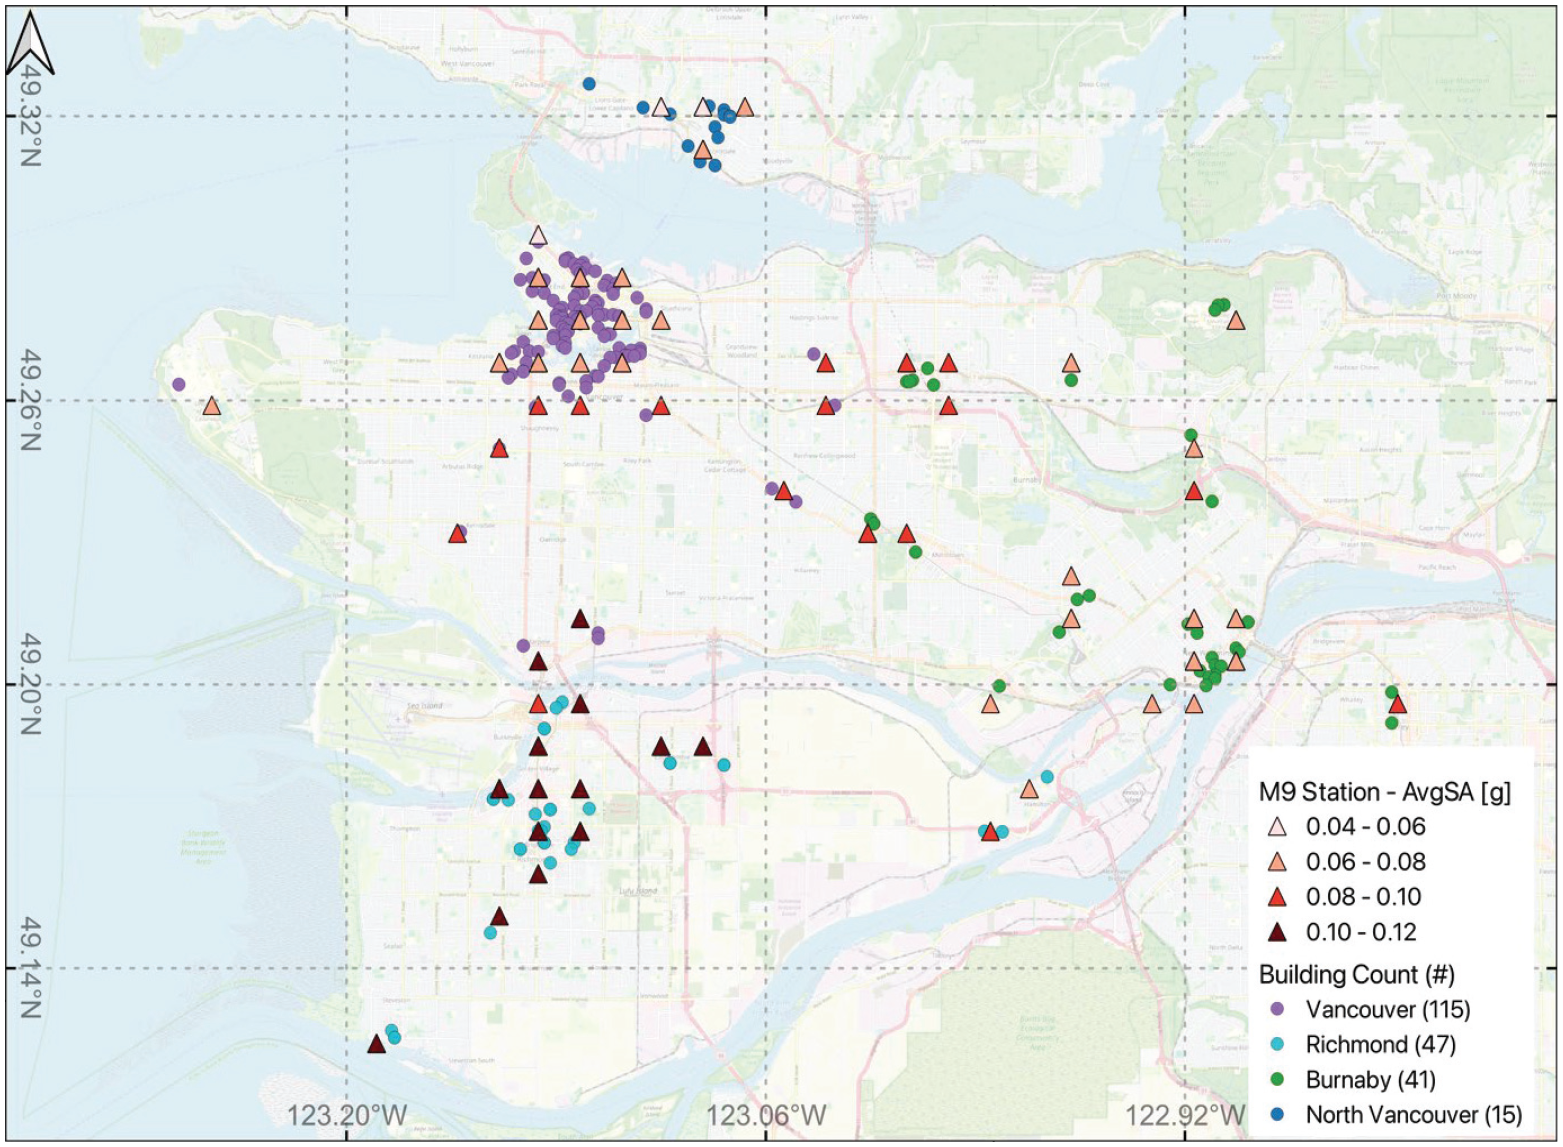
Locations of modern high-rise reinforced concrete shear wall buildings and nearest stations for simulated magnitude-9 (M9) Cascadia subduction zone earthquakes in four Metro Vancouver cities.
To quantify the recovery time for each building across Metro Vancouver, the proposed methodology—trained on the dataset of archetype buildings discussed in the previous section—is applied here. Per this procedure, the AvgSA for each building is calculated at the nearest M9 station. Using the downtime fragility functions derived previously, we determine the percentage of realizations resulting in negligible, irreparable, and repairable damage. For negligible damage and IrD cases, recovery times are estimated by sampling from the lognormal distributions outlined in the TREADS assumptions. For the repairable damage scenarios, the recovery time for both recovery states, that is, SiP and FR, is calculated by adding the IF delays to the repair time estimates derived from the proposed probabilistic models, which follow GEV and beta probability distributions (refer back to Table 1 and 2), respectively.
The expected FR and SiP times are computed for each building under the 30 scenarios of the M9 CSZ interface earthquake by generating 10,000 realizations of building recovery times for each scenario. Figure 8 illustrates the median recovery time in the region as a function of the percentage of buildings recovered. The figure highlights the significant uncertainty in recovery time estimates across different M9 earthquakes, as they represent 30 scenarios of a full CSZ rupture with variations in rupture characteristics, such as hypocenter location and inland extent of the rupture plane (Frankel et al., 2018). For example, the median FR time of the building portfolio can range from approximately 100 to 600 days. The estimates for the median scenario, shown in bold, are approximately 160 days to achieve SiP and 300 days to achieve FR across all buildings in the region. It is important to note that these recovery trajectories assume that repair activities for all buildings at all sites can commence simultaneously and proceed in parallel, with damage and consequences across buildings considered independent. However, this may be an optimistic scenario as post-earthquake regional resource constraints could limit the available repair workforce (Blagojević et al., 2023). In addition, the recovery trajectories would be affected by the number of workers allocated to each building or by the repair phasing assumptions within each building, which would require retraining probabilistic models using updated TREADS recovery simulations. A Python code used to carry out recovery analysis for the case-study building portfolio, along with the input dataset, is provided in Electronic Supplement III.
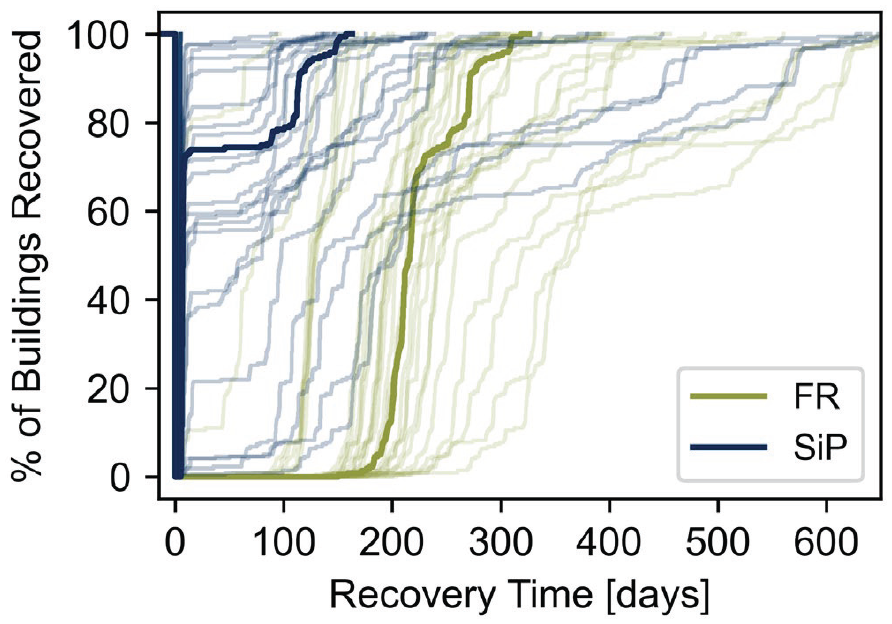
Functional recovery (FR) and shelter-in-place (SiP) recovery times for the building portfolio considered under 30 simulated magnitude-9 (M9) Cascadia subduction zone earthquake scenarios. Bold lines indicate the recovery time for the median M9 scenario.
The M9 CSZ earthquakes considered in this study are characterized by damaging spectral shapes and long durations. Furthermore, all the locations considered are basin or basin-edge sites, resulting in further amplification of ground motions shaking. The SA of the median M9 CSZ earthquake scenario considered, at long periods (greater than 1 s), lies between the 975- and 2475-year probabilistic seismic hazard estimates (Eksir Monfared et al., 2021; Kakoty et al., 2021, 2023) These factors help explain the long recovery times observed in the results. Past studies have reported similar results. For instance, Cook et al. (2024) applied the ATC-138 methodology to estimate re-occupancy time (comparable to our SiP state) and FR time for modern high-rise concrete frame buildings subjected to the 975-year intensity level. Their analysis found that for buildings designed in Los Angeles, CA, re-occupancy and FR times were approximately five and nine months, respectively, while for buildings in Seattle, WA, the estimated times were five and eight months, respectively. Terzic and Kolozvari (2022) used F-Rec to assess the recovery of a modern high-rise reinforced core wall building in Los Angeles, CA, finding FR times ranging from eight to 13 months under design-basis earthquakes and 12 to 16 months under maximum considered earthquakes. Molina Hutt et al. (2022a) applied REDi to assess the recovery of a modern 42-story RCSW residential building in San Francisco, CA, where they estimated functional recovery times of over six months under the design earthquake and over 12 months under the risk-targeted maximum considered earthquake. The lengthy recovery time estimates are also consistent with real-world catastrophic earthquake events. For instance, after the 1994 Northridge earthquake, the mean re-occupancy time of yellow-tagged multi-family residential buildings in Los Angeles, CA, exceeded 24 months (Comerio and Blecher, 2010). While we benchmark our results against past studies, the primary objective of this section is not to provide the absolute recovery time estimates. Instead, the focus is on the methodology, which can be effectively applied to regional assessments, with the underlying models continuously refined and validated using empirical data from both historical and future earthquakes.
To better understand the risk across the region, Figure 9 illustrates the breakdown of median recovery times to achieve FR and SiP for the median M9 scenario across four cities, again assuming that repair activities for all buildings can commence simultaneously and proceed in parallel. The median scenario is defined as the scenario that results in the median SiP time for the building portfolio. The figure shows that Richmond has the longest recovery times for both SiP and FR. This is due to its higher basin depth compared to other cities (e.g. 3–4 km in Richmond vs 1–2 km in Vancouver), which amplifies ground motion intensities, especially for periods greater than 1 s. For example, in the median M9 scenario, the mean of AvgSA across sites ranges from approximately 0.04 g in North Vancouver to 0.12 g in Richmond. The figure also demonstrates that the recovery trajectories for Vancouver and Burnaby are quite similar, except at higher percentages of portfolio recovery (above 90%), where Vancouver surpasses Burnaby. This behavior is attributed to several buildings within the city of Vancouver that are in the vicinity of Richmond, which experience higher SAs due to greater basin depths.
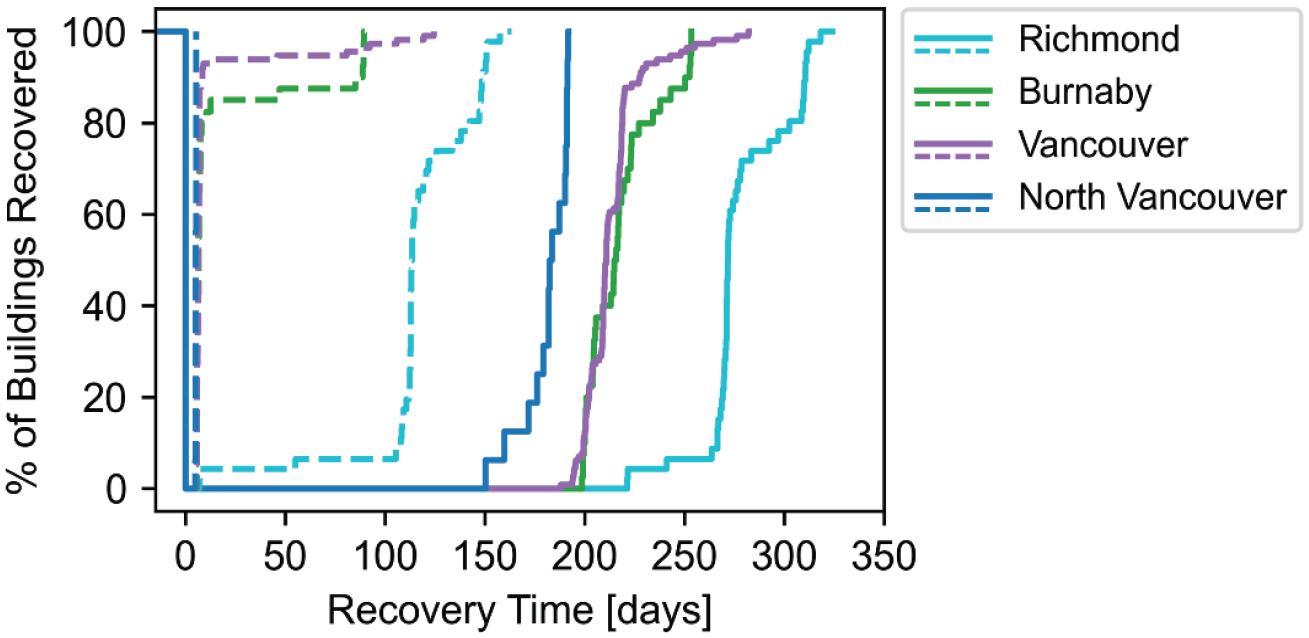
Median SiP (dashed lines) and FR (solid lines) times as a function of the percentage of buildings recovered across four cities in the region. SiP, shelter-in-place; FR, functional recovery.
Although this figure shows the recovery of cities exclusively from a physical damage perspective by explicit consideration of modern high-rise RCSW buildings, disaster recovery is complex and influenced by other factors, such as household demographics and other socioeconomic factors, which also affect disaster-induced short and long-term population displacements (Paul et al., 2024). The results of this section can be used to provide insights into the people-centered decision-making process (Cremen et al., 2022) for disaster risk assessments. For instance, in scenarios where an evacuation order is enforced by authorities (e.g. Gerber, 2010), the SiP time can be used to represent the duration of the evacuation order, which can be combined with the population characteristics of the city to provide deeper insights into the consequences of a disaster. Furthermore, these results can inform decisions on pre-event retrofits and policies or help prioritize repairs across the region after an earthquake. For instance, from a policymaker’s perspective, pre-event actions and policy decisions (with a particular focus on prioritizing vulnerable communities) to expedite recovery could include offering affordable and effective public insurance schemes. Although Richmond may appear to be the most critical and should be the first city to recover, a multi-criteria decision-making process could be adopted to account for various recovery drivers (e.g. access to healthcare facilities and socioeconomic factors) and inform decision-making for resource allocation (e.g. Gentile and Galasso, 2021; Opabola and Galasso, 2024). Since the results are presented only for modern high-rise buildings, a broader consideration of the people-centered decision-making procedure should also include buildings of varying construction ages and heights in the analysis.
Conclusion
This article presented a methodology to enhance recovery time consequence models for application in building portfolio recovery analyses by leveraging high-fidelity building-specific recovery simulations. The proposed methodology accounted for a contribution from negligible, repairable, and irreparable damage instances and estimated recovery time at two distinct recovery states: shelter-in-place and functional recovery. An application of the proposed approach employed the high-fidelity recovery simulation results obtained from TREADS to develop (a) building class-level downtime fragility functions; and (b) statistical models (i.e. probability distributions) for repair time and impeding factor (IF) delays. For negligible and irreparable damage cases, the building inspection and replacement times were computed using the corresponding lognormal cumulative distributions stated in TREADS. To showcase the application of the proposed methodology, a portfolio of modern high-rise (eight to 24 stories) reinforced concrete shear wall (RCSW) buildings was employed. These buildings were subjected to ground motion records representing earthquake return periods of 100 to 4975 years, as per the 2014 US national seismic hazard model for a site in the Pacific Northwest. Finally, the methodology was implemented in a portfolio of modern high-rise RCSW buildings across Metro Vancouver, BC, subjected to 30 simulated ground motions of magnitude-9 Cascadia subduction zone interface earthquakes.
For the portfolio of modern high-rise RCSW buildings considered in this study, the optimal probabilistic models for repair time and IF delays were the beta and GEV distributions, respectively. Using the proposed model, the expected recovery time and CoV estimates were within 10% of the TREADS results across all hazard levels, except at the 100-year hazard level, for both recovery states. At the 100-year hazard level, the repair time for functional recovery could not be adequately represented by a single probability distribution, and thus, resulted in a significant discrepancy in the coefficient of variation compared to the TREADS results. Future studies could explore the use of mixture probability distributions for this scenario, as they may provide a more suitable alternative. In addition, future studies could also revisit the assumptions of what damage states in what components trigger function loss. While recommendations for potential probability distributions for repair time and IF delays were provided, this study does not claim to have identified the most appropriate probability distribution in all cases. Instead, the emphasis was on the proposed methodology, which was generic and could be extended to building portfolios with various structural materials, systems, heights, geographic locations, and construction eras. In addition, the probability distributions proposed in this study do not account for correlations between IF delays, and future studies could explore multivariate probability distribution models to capture these correlations at a regional scale. Although PELICUN and TREADS were used for building loss and recovery assessments, the methodology is generic and could leverage other computational tools to obtain the input required for developing recovery time consequence models.
This article highlighted the potential benefits of utilizing simulation-based enhanced recovery time consequence models for efficient quantification of recovery in building portfolios. While the proposed consequence models could be seamlessly integrated into regional seismic risk assessments, the regional-scale application demonstrated in this study is limited to a class of modern high-rise RCSW buildings up to 24 stories. Given the prevalence of buildings significantly taller than 24 stories in major metropolitan areas such as Metro Vancouver, risk models should ideally be expanded to explicitly account for super high-rise building types to better reflect their distinct behavior under a new building class with revised height ranges. The extension to a comprehensive regional-scale assessment is contingent on a database of high-fidelity recovery simulations of a broader range of building types (e.g. steel braced frame, light frame wood). Although constructing this database can be computationally intensive, once established, it enables efficient regional-scale recovery assessments for large building portfolios under various ground motion intensities. The regional recovery time estimates provided herein should not be viewed as definitive metrics, but rather, the approach used to derive them can be considered a robust framework for improving regional recovery time assessments. These estimates could be continuously improved as additional empirical data becomes available to improve high-fidelity building-specific recovery simulations, such as those provided by TREADS.
The key benefit of our proposed approach over existing models for recovery time (e.g. those specified in Hazus) is its calibration using high-fidelity simulations, explicit consideration of key drivers of recovery time, such as IF delays and repair times, and its ability to distinguish between different recovery states such as functional recovery and shelter-in-place. Furthermore, the proposed methodology can facilitate the development of regional-level risk mitigation strategies (e.g. a city-wide expedited post-earthquake permitting process) explicitly targeting IF delays and repair times by adjusting assumptions within high-fidelity simulations and modifying the resulting consequence models based on specific mitigation goals. To streamline the development of such strategies, future research could explore potential surrogate models for recovery time that account for variability in building features within a building class (e.g. structural characteristics and height), regional supply-demand constraints (e.g. availability of workers), and various components of IF delays (e.g. financing and contractor mobilization). Although the enhanced recovery time consequence models derived from the proposed methodology are valuable for regional recovery assessments, they cannot replace high-fidelity simulations when the goal is to investigate the underlying drivers controlling the recovery time or to design/implement building-specific resilience-enhancing policies and decisions, particularly for single, high-importance buildings.
Footnotes
Declaration of conflicting interests
The author(s) declared no potential conflicts of interest with respect to the research, authorship, and/or publication of this article.
Funding
The author(s) disclosed receipt of the following financial support for the research, authorship, and/or publication of this article: This research was funded by Canada’s Natural Sciences and Engineering Research Council under Discovery Grant No. RGPIN-2019-04599, as well as Alliance Grant ALLRP 567555-2021. This research was also partly supported by the European Union’s Horizon Europe project “Multi-hazard and risk-informed system for Enhanced local and regional Disaster risk management (MEDiate)” under grant agreement no. 101074075 (UKRI reference number: 10049469—Horizon Europe Guarantee).
Data and resources
The electronic supplement compiled as a companion to this paper can be found in the GitHub repository at ![]() . The electronic supplement includes the following:
. The electronic supplement includes the following:
(I): Summary of results for hazard, structural, loss, and recovery analyses
(II): Model development procedure
(III): Implementation procedure for a case-study regional risk assessment