
Abstract
Observations from past earthquakes have highlighted the structural damage and significant residual deformations experienced by ductile steel seismic force-resisting systems (SFRSs), such as special moment resisting frames (SMRFs), special concentrically braced frames (SCBFs), and buckling-restrained braced frames (BRBFs). To mitigate these challenges, controlled rocking braced frames (CRBFs) have emerged as a promising low-damage alternative SFRS. However, concerns have been raised about whether the reduction in structural damage with CRBFs may come at the cost of increased acceleration demands and associated nonstructural damage. This study offers a comprehensive investigation of such trade-offs by analyzing three buildings of different heights, each designed with the three ductile SFRSs identified above and with CRBFs. After examining the structural response at different earthquake intensities, the focus of the paper is on earthquake-induced economic losses. Among the considered SFRSs, greater total expected annual losses (EAL) are observed in the SMRF and SCBF buildings, primarily due to demolition losses and repairable losses, including repairs of structural and nonstructural components. The total EAL is lower for the BRBFs and lowest for the CRBFs, with the losses in the BRBF buildings primarily attributed to demolition loss, considered as irreparable loss, while the losses in the CRBF buildings are mainly due to acceleration-sensitive nonstructural components, considered as reparable loss. To provide a more detailed comparison, cost-effectiveness analyses are also performed, indicating that a modest cost premium for CRBFs is justified to reduce earthquake economic costs over the building lifetime.
Keywords
Introduction
Although significant progress has been made in seismic design provisions for building safety, as evidenced by the reduced number of new and retrofitted building collapses after extreme earthquakes (Okazaki et al., 2013; Westenenk et al., 2012), the socioeconomic impact of earthquakes is still a major concern. Observations of the aftermath of past earthquakes have revealed that excessive residual drifts (Rosenblueth and Meli, 1986) and damage to structural and nonstructural components (Dhakal, 2010; Miranda et al., 2012; Perrone et al., 2019) can lead to buildings being demolished or requiring extensive repairs, both of which are expensive and cause downtime and business interruptions that compound the direct economic losses (Hwang and Lignos, 2017a) and impede the ability of cities to recover from a disaster. Therefore, a performance-based earthquake engineering framework has been developed to evaluate earthquake-induced losses (Cornell and Krawinkler, 2000; FEMA P-58-1, 2018), allowing engineers and other stakeholders to assess potential consequences and, therefore, make more efficient design and retrofit decisions.
Three common ductile steel seismic force-resisting systems (SFRSs) used worldwide to resist earthquake loads are special moment resisting frames (SMRFs), special concentrically braced frames (SCBFs), and buckling-restrained braced frames (BRBFs). SMRFs and SCBFs are historically common and thus have been the subjects of numerous research studies focusing on their seismic performance, behavior, and seismic loss assessment. Over the past 20 years, BRBFs have gained popularity due to their ability to provide high-energy dissipation by effectively restraining buckling in the braces. Ramirez and Miranda (2012) noted that building demolition may become a controlling seismic loss parameter for buildings with typical SFRSs due to large residual drifts. The residual story drifts in SMRFs can be attributed to the plastic hinging in SMRFs, resulting in irrecoverable inelastic deformations in the beams (Erochko et al., 2011), particularly for mid- to high-rise SMRFs that are susceptible to P-delta effects (Elkady and Lignos, 2014; Hwang and Lignos, 2017a). SCBFs can experience concentrated plastic deformations due to the asymmetric hysteretic behavior of their braces that may lead to the development of local story collapse mechanisms (Hwang and Lignos, 2017b), resulting in significant residual story deformations or even structural collapse (Tremblay et al., 1995, 1996). BRBFs can experience an average peak residual drift ratio ranging from 0.8% to 2.0% following a design earthquake (DE) (Erochko et al., 2011) due to their full hysteresis (Asgarkhani et al., 2020). In addition, it was found that for this system, while the maximum drift demands were almost unaffected by the strain hardening ratio, even a slight variation in this ratio could greatly increase the residual drift of BRBFs (Mahdavipour and Deylami, 2014).
Controlled rocking braced frames (CRBFs) have been developed as a lateral force-resisting system to mitigate structural damage during earthquakes at and beyond design levels (Eatherton et al., 2014; Roke et al., 2010; Steele and Wiebe, 2021; Wiebe et al., 2013). Unlike more traditional ductile SFRSs, CRBFs benefit from uplift mechanisms, while post-tensioned tendons and the frame weight provide a restoring force that allows the system to self-center after an earthquake. Additionally, energy-dissipating devices are typically employed to reduce displacement demands. Figure 1 illustrates the conceptual behavior of a CRBF. Collapse assessment studies conducted on CRBFs demonstrate that these structures have a low probability of collapse and minimal damage to their steel components (Rahgozar et al., 2016; Steele and Wiebe, 2017, 2021). Additionally, Wiebe and Christopoulos (Wiebe and Christopoulos, 2015) indicated that buildings designed with CRBFs exhibit minimal residual drifts, even under the most severe ground motions at the maximum considered earthquake (MCE) level. However, the research conducted by Buccella et al. (2021) revealed that higher mode effects can result in higher acceleration demands in CRBFs compared to BRBFs, particularly in the form of peaks in the floor spectra near the modal periods of the buildings.
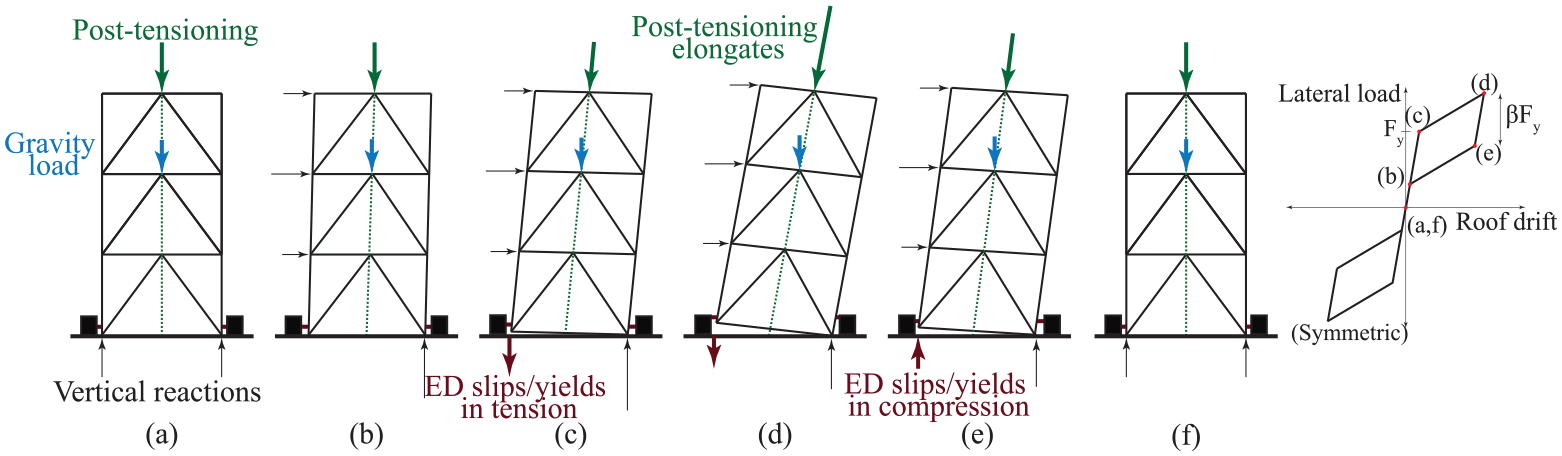
CRBF hysteretic response.
Over the past decade, several studies have used seismic loss assessment to evaluate the performance of various ductile SFRSs (Ghasemof et al., 2022; Molina Hutt et al., 2019; Ramirez et al., 2012). Hwang and Lignos investigated the impact of modeling and design assumptions on the earthquake-induced losses of buildings with SMRFs (Hwang and Lignos, 2017a) and SCBFs (Hwang and Lignos, 2017b). They discussed that neglecting the contribution of the composite floor and gravity framing system in the analytical building model may lead to an overestimation of the loss due to demolition and collapse in buildings. Also, although they considered only three acceleration-sensitive nonstructural components (suspended ceiling, elevator, and sprinklers) for seismic loss assessments, they found that the repair costs of these components account for more than half of the total expected annual losses. Others have compared the cost-benefit evaluation of SCBFs and CRBFs (Dyanati et al., 2017; Huang et al., 2018), including potentially higher construction costs for CRBFs. These studies found that for the archetype six- and eight-story buildings that were considered, CRBFs had less total annual loss than SCBFs, whereas the ten-story buildings with SCBFs had less total annual loss than those with CRBFs. Also, damage to acceleration-sensitive nonstructural components was identified as the major source of loss for the considered CRBF buildings. Hu and Zhu (2023) introduced hybrid self-centering braced frames with shape memory alloy-based braces and viscous dampers that not only can achieve better performance in reducing seismic annual loss than BRBFs and SCBFs but also demonstrate comparable performance in controlling peak floor accelerations (PFAs) to that of BRBFs and less than SCBFs.
Although there are studies that assess the structural performance of each of these individual steel systems and a few papers that include seismic loss assessment, there is a lack of research that systematically compares all four steel SFRSs described above. In addition, the emergence of self-centering systems, such as CRBFs, raises questions for building owners and stakeholders about whether such systems will indeed reduce overall seismic costs, particularly in light of potentially higher acceleration-related losses. To address this research gap, the four SFRSs discussed above are designed according to the 2016 standards and codes, and loss assessments are performed on all example structures using current damage fragility functions. The SFRSs are compared, first by considering their expected losses given a seismic intensity and then by considering the expected annual losses. Moreover, nonstructural components with a major impact on seismic losses are identified to highlight areas for future research in minimizing such losses. Finally, the net present value of the total cost over an assumed 50-year building life span is computed to evaluate the cost-effectiveness of investing in seismic performance upgrades for a range of return rates and construction costs.
Design of prototype buildings
Three different heights of steel-framed office buildings were each designed using four different SFRSs—namely SMRFs, SCBFs, BRBFs, and CRBFs. The design site for the buildings was assumed to be site class D (stiff soil) and in a seismically active area with mapped short-period and 1-second spectral accelerations of Ss = 1.5 g and S1 = 0.5 g, respectively (ASCE/SEI 7-16, 2016). The typical floor plan for the buildings is shown in Figure 2. Each story of the buildings is 4.57 m high, with a total seismic weight of 10,200 kN and 6,430 kN for each floor and roof, respectively. Four-bay moment frames were positioned along the exterior of the buildings in a symmetric plan configuration for the SMRF designs (Figure 2a), while for the braced frames, two frames were used in each direction for the three-story buildings and four for the six-story and 12-story buildings (Figure 2b). None of the frame members in the SFRSs were designed or modeled to carry any tributary gravity loads. The CRBFs were designed to be 90% of the bay width to fit between two gravity columns. The CRBF was decoupled from the gravity framing, ensuring that uplifting does not affect the floor system and vertical accelerations are not transferred to the floor system (Steele and Wiebe, 2020). In all cases, members were selected to avoid overdesign by maximizing the utilization ratio.
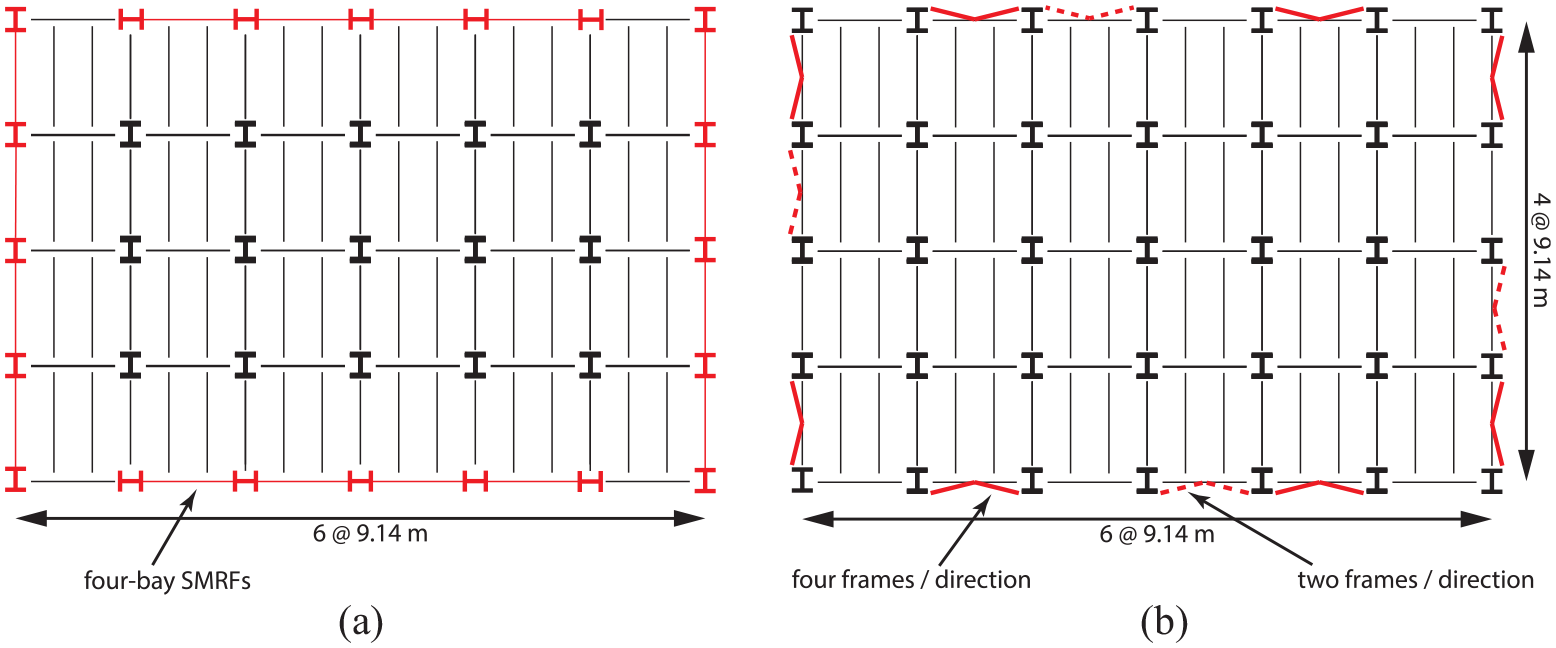
Floor plan of the building with location of SFRSs: (a) SMRFs and (b) braced frames.
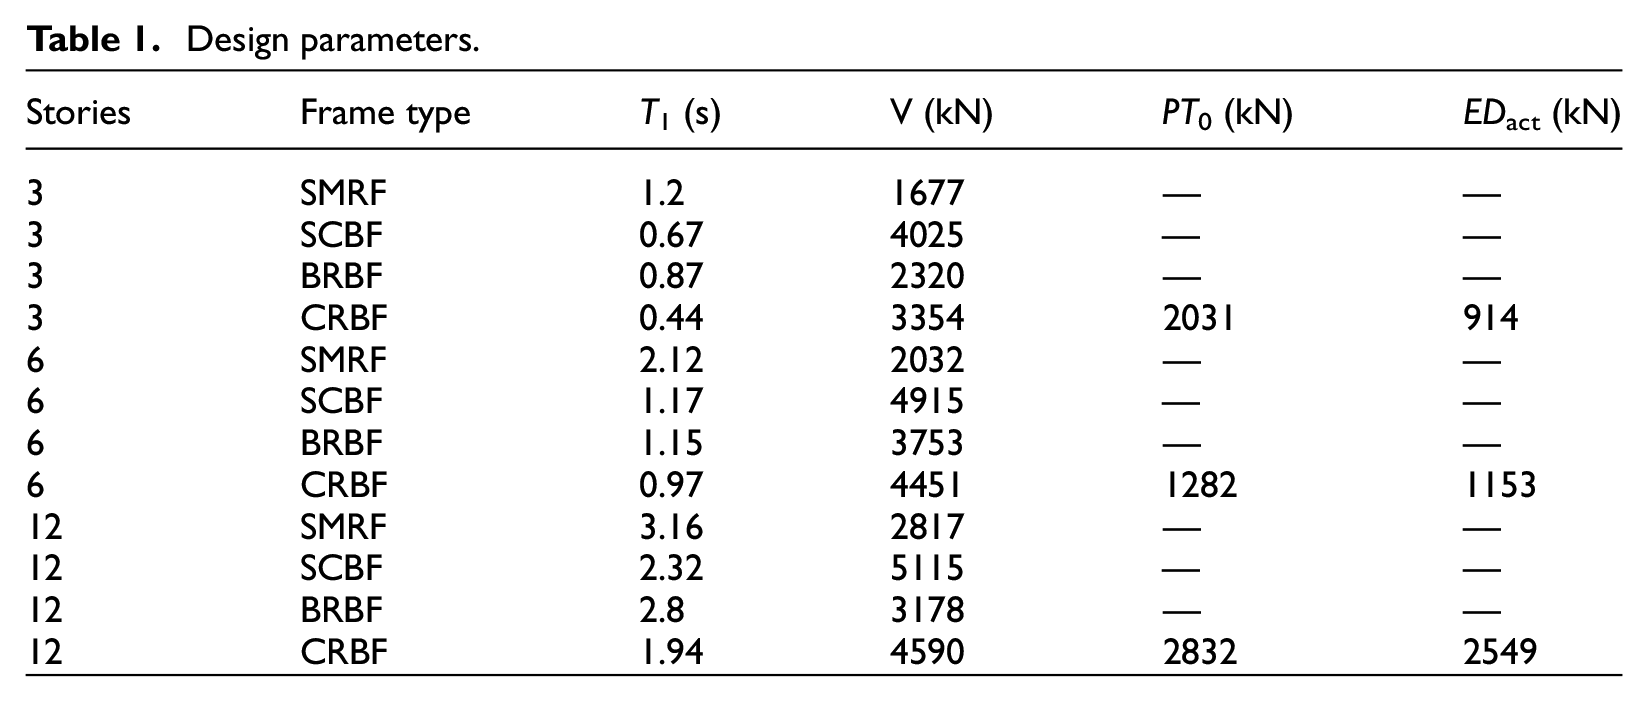
The SMRFs were designed with reduced beam sections (RBS) per ANSI/AISC 358-16 (2016). The equivalent lateral force method of ASCE/SEI 7-16 (2016) was used with a response modification factor (R) of 8 to find the demands on the SMRF members. Also, steel beam and column sections were designed using ANSI/AISC 360-16 (2016) with a yield strength of 345 MPa and were proportioned to satisfy the requirements specified in ANSI/AISC 341-16 (2016). For the SMRFs, while the strength criteria were satisfied, the drift criteria according to ASCE/SEI 7-16 (2016) controlled the design, resulting in the selection of larger sections, especially for columns, to reduce the story drifts. Welded doubler plates were designed using AISC 360-16 to fulfill the panel zone strength criteria. Table 1 provides a summary of the fundamental period based on modal analysis, T, and the base shear, V, and Table 2 provides all designed members for the SMRFs.
Design parameters.
Section sizes.
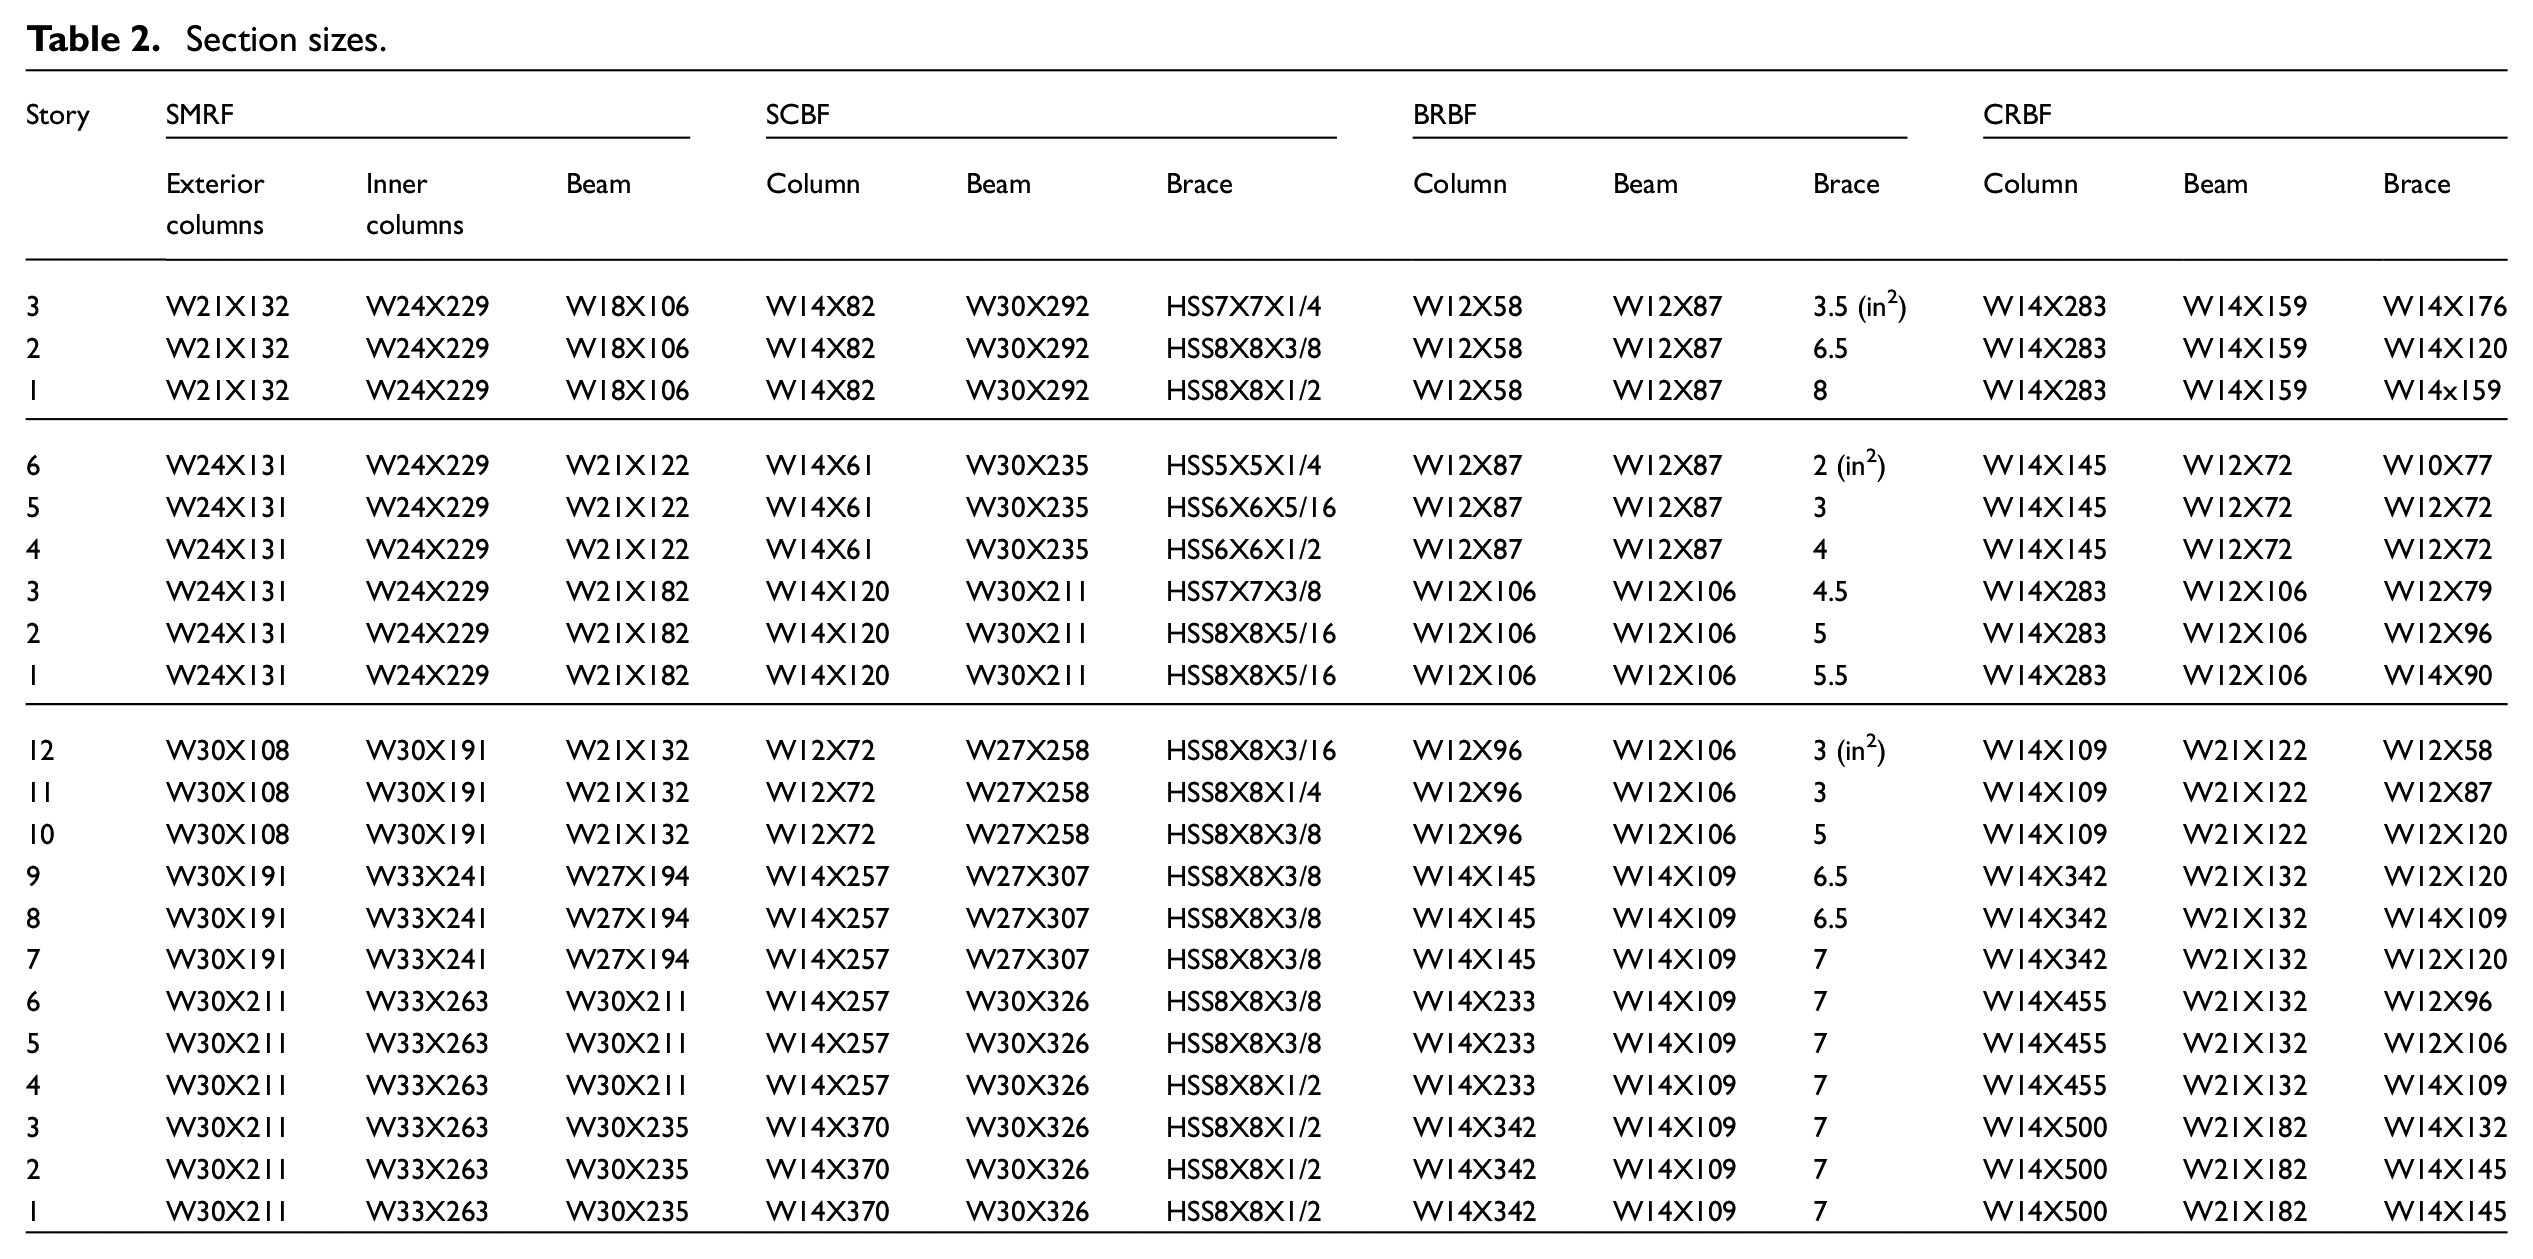
The equivalent lateral force method of ASCE/SEI 7-16 (2016) and the capacity design procedure provided in ANSI/AISC 341-16 (2016) were used to design the steel members of SCBFs and BRBFs, with R of 6 and 8, respectively. All members of the SCBFs, and the beams and columns of the BRBFs, were designed based on AISC 360-16 with a yield strength of 345 MPa, while a yield strength of 290 MPa was assumed for the core area of buckling-restrained braces (BRBs). For the SCBFs and BRBFs, braces were assumed to be pinned to the beam-column connections, and the effective length of the braces was assumed to be 70% of the work-point-to-work-point length of braces. The regression equations suggested by Saxey and Daniels (2014) were used to estimate the strain hardening and compressive strength adjustment factors for the BRBs, assuming that braces reached their probable tensile or compressive force at a strain experienced by the brace cores at the target design drift of 1.5%. For the SCBFs and BRBFs, drift criteria were evaluated in accordance with ASCE/SEI 7-16 (2016) but did not govern the design. All designed members for the SCBFs and BRBFs are summarized in Table 2, and their initial periods and base shears are summarized in Table 1.
The design of CRBFs followed a two-step procedure by Wiebe and Christopoulos (2015), which involved designing the base rocking joints with post-tensioning (PT) and energy dissipation (ED) to control over-rotation and limit displacements and capacity designing all steel members to withstand the forces induced by rocking, including higher-mode forces. To determine the required base overturning moment resistance, the equivalent lateral force approach (ASCE/SEI 7-16, 2016) was used with R = 8, as suggested by several studies (Eatherton et al., 2014; Ma et al., 2010; Roke et al., 2010). For the CRBFs, the drift criteria were evaluated using the regression equation developed by Zhang et al. (2018), but they did not control the design. Frictional energy dissipation elements were specified at the base of either side of the CRBFs’ columns. To ensure a self-centering behavior, the hysteretic ED ratio (β), which is defined as the ratio of the height of the CRBFs’ flag-shaped hysteresis to the linear limit, should be less than one (Steele and Wiebe, 2021), so β (as defined in Figure 1) of 0.9 was targeted in this study. The energy dissipation activation force, EDac, was determined by multiplying the design overturning moment resistance by β and dividing by twice the horizontal distance from the rocking toe to the ED.
The PT prestress was selected as 50% of the ultimate stress of PT to ensure the PT would remain elastic up to at least 2.5% base rotation. One set of PT in the center of the frame and two sets of PT aligned with each column were respectively anchored at the roof of the three-story and six-story CRBFs. For the 12-story CRBF, two sets of PT were anchored to the frame’s side columns on the sixth floor. The dynamic capacity design procedure developed by Steele and Wiebe (2016) was used to design the steel frame members of the CRBFs. This procedure combines the forces from frame rocking to the ultimate base rotation with higher-mode vibration forces that are computed using modal analysis using a truncated spectrum at the MCE level. A yield strength of 345 MPa was assumed for all steel members of the CRBFs. Additionally, the gusset plates between the braces and the beam-column connections were capacity designed based on the capacity of the braces. The initial period, T, initial post-tensioning force, PT0, and EDact are summarized in Table 1, and all designed steel members for the CRBFs are summarized in Table 2.
Seismic hazard and ground motion selection
The Los Angeles Bulk Mail Center (33.996°N, 118.162°W) was selected as representative of the site conditions used to design the SFRSs. The seismic hazard curves for the chosen site were retrieved from the USGS website (https://earthquake.usgs.gov/hazards/interactive/, last accessed 17 October 2022). The suite of far-field ground motion records suggested by FEMA P695 (2009) was employed for the time-history analyses. The selected ground motions were first normalized by their respective peak ground velocity and then were scaled to minimize the geometric mean differences between the MCE spectrum and the median acceleration spectrum of the records over a range based on the periods of the buildings. This range extended from 0.2 times the first fundamental period of the fixed-base CRBF building to 2.0 times the first fundamental period of the BRBF building for each set of buildings of the same height designed with different SFRSs. This was implemented so that the four separate SFRSs for each height would all use a consistent scaled ground motion suite. The upper limit of the scaling range was set using the period of the BRBFs instead of the SMRFs to minimize any unnecessary overshooting over the low period range, considering the large range in periods for the different SFRSs. Figure 3 shows the scaled records for the set of three-story buildings along with the median of the suite and the MCE spectrum. The performance of each building was evaluated by multiple-stripe analyses (MSA) (Baker, 2015) with six different intensity stripes: 0.25, 0.5, and 1 times the DE, and 1, 1.5, and 2 times the MCE.
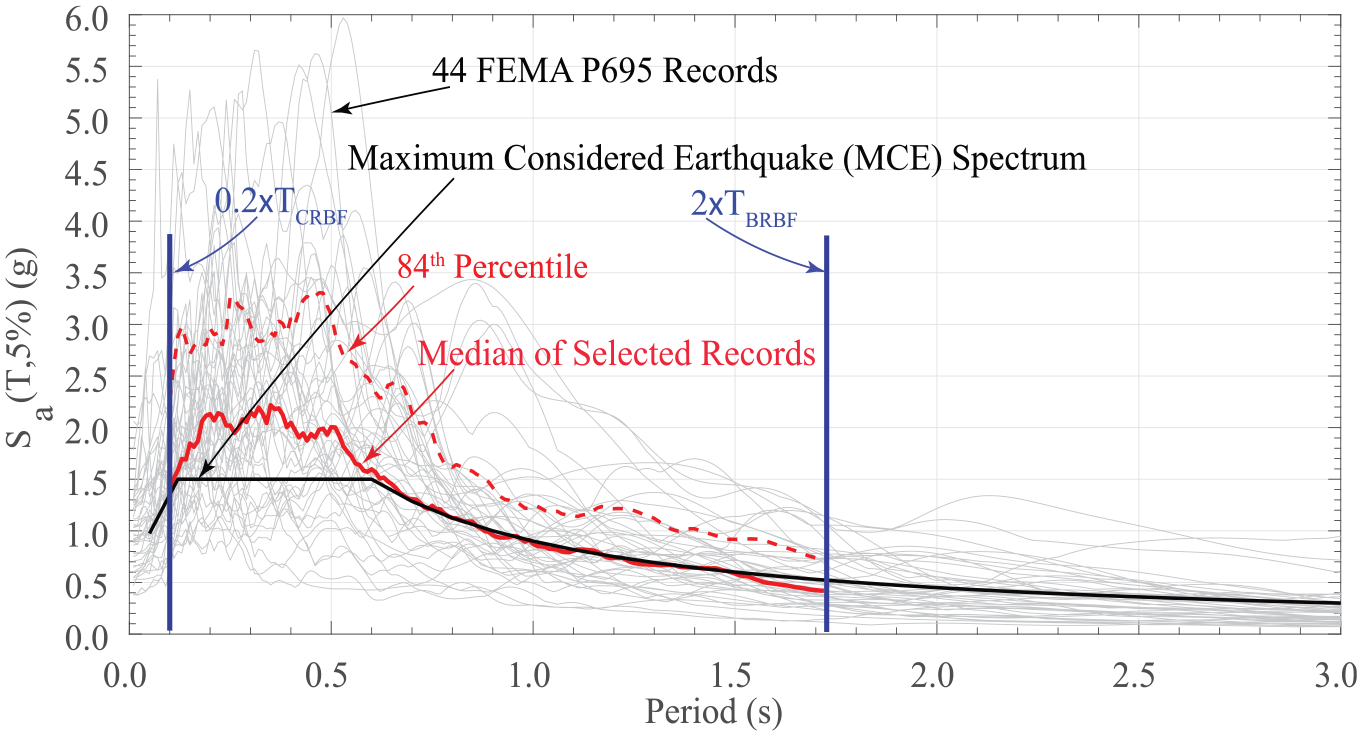
Scaling of the selected suite of ground motions for the three-story buildings.
Modeling of the example structures
OpenSees (Pacific Earthquake Engineering Research Centre [PEER], 2021) was used to perform the MSA on the designed buildings. Figure 4 depicts schematics of the numerical models developed for the three-story SFRSs; similar models were developed for the six- and twelve-story designs. The SMRFs, SCBFs, and BRBFs were simulated in a 2D plane, whereas the CRBFs were simulated in 3D for consistency with other models developed by Steele and Wiebe (2021).
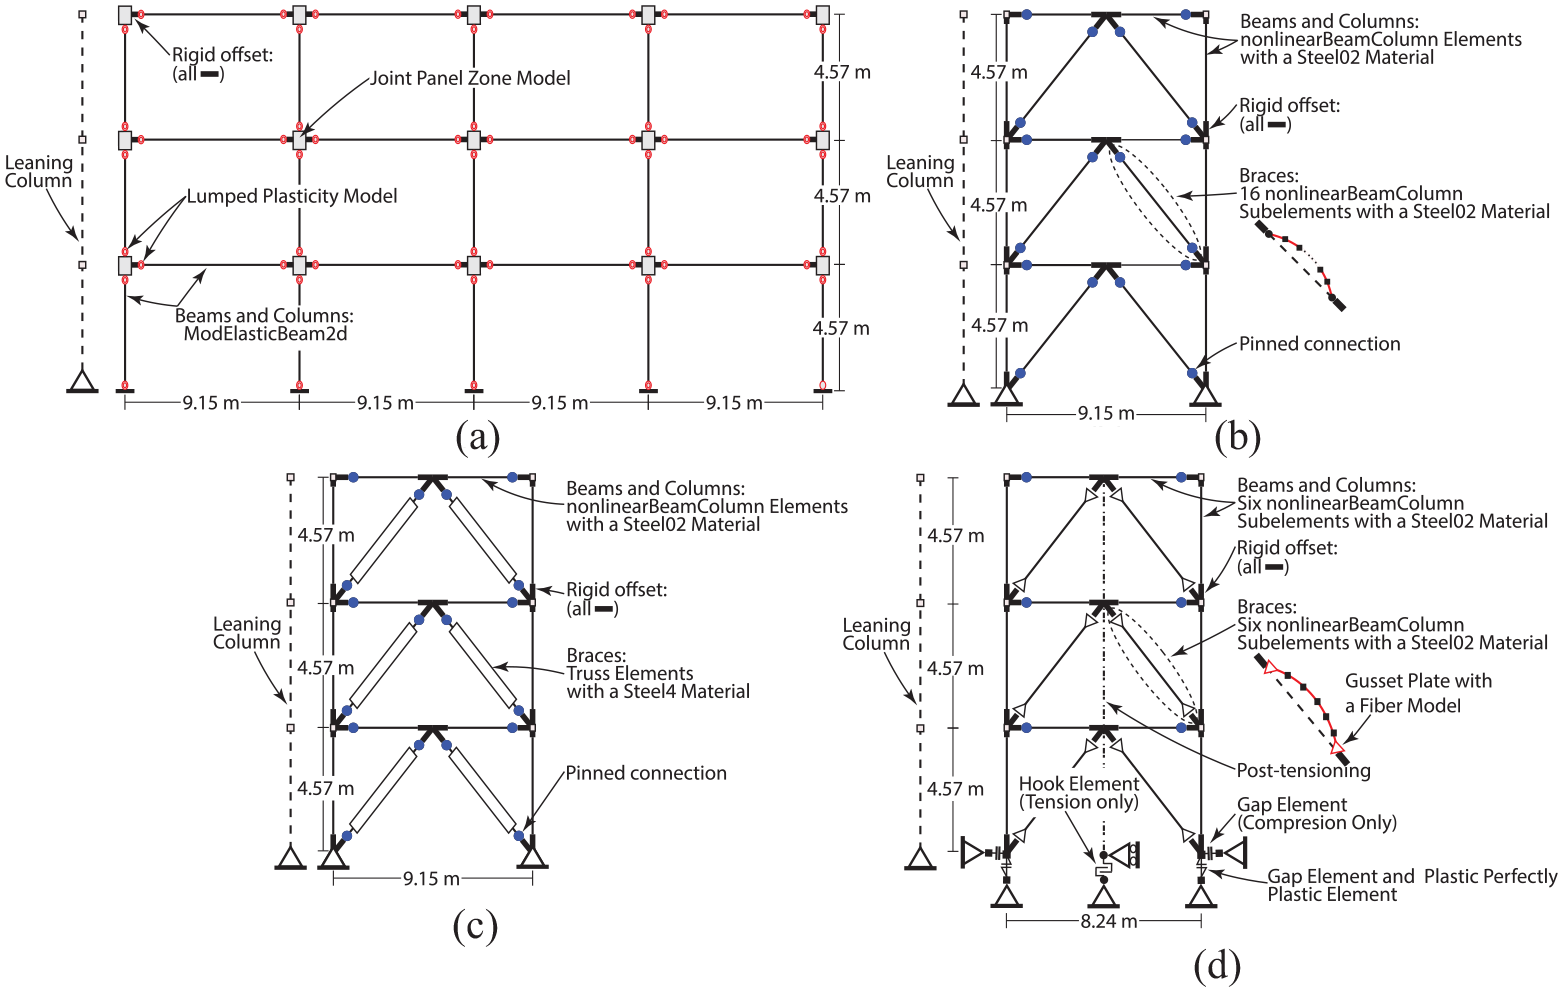
Schematics of the numerical models for the SFRSs: (a) SMRF, (b) SCBF, (c) BRBF, and (d) CRBF.
The SMRF (Figure 4a) members were idealized using elastic beam-column elements with stiffness modifiers (ModElasticBeam2d), which were developed to prevent unrealistic damping forces caused by stiffness-proportional damping (Zareian and Medina, 2010), and concentrated plasticity flexural hinges at their ends. The modified Ibarra-Medina-Krawinkler deterioration model (Ibarra et al., 2005) was adopted to model cyclic deterioration in flexural strength and stiffness of the beams and columns. In addition, the beam hinges were modeled following Lignos and Krawinkler (2011) and column hinges were modeled following Lignos et al. (2019). The panel zones were modeled as recommended elsewhere (Skiadopoulos et al., 2021).
For the SCBFs (Figure 4b), nonlinear fiber beam-column elements with ten integration points were employed to capture the distributed inelastic plasticity behavior along the beams and columns. The buckling response of braces was modeled using sixteen fiber nonlinear beam-column elements following (Hsiao et al., 2012), with initial geometric imperfection equal to 0.001 of the effective length. In addition, each fiber was assigned a uniaxial Giuffre-Menegotto-Pinto steel material (Steel02) with brace yield strength and kinematic and isotropic strain hardening properties. Fracture due to low cycle fatigue was modeled for all members using the recommendations of Karamanci and Lignos (2014). Also, the model considered the effect of rigid offsets on frame stiffness and assumed pin-ended connections for the brace members.
The braces of the BRBFs were modeled using nonlinear truss elements with a Steel4 uniaxial material. The parameters of this model followed recommendations by Zsarnóczay (2013), which were calibrated based on large-scale experimental data from BRBs and that reflect the behavior of BRBs, including the Bauschinger effect and asymmetries in the tension and compression behavior. All other aspects of the BRBF models (Figure 4c) were modeled as explained for the SCBFs.
The CRBFs (Figure 4d) were modeled as recommended by Steele and Wiebe (2017). Gap elements in the vertical direction were considered to allow CRBFs to uplift due to rocking, and gap elements in the horizontal direction transferred the base shear to the rigid foundation. These gap elements were modeled using a much larger stiffness than the first-story column axial stiffness and in parallel with an elastic spring of negligible stiffness, which improves the models’ numerical stability. All frame members were modeled with six fiber nonlinear beam-column sub-elements using 10 integration points each and initial geometric imperfection of L/1000 considering the Steel02 material and a low cycle fatigue model (Uriz and Mahin, 2004, 2008) for each fiber. Additionally, the effect of gusset plates at the ends of the braces was modeled using fiber nonlinear beam-column elements, as described by Uriz and Mahin (2008). Because the CRBF was designed not to carry tributary gravity loads, the impact with the foundation during rocking was not expected to generate significant acceleration spikes that would affect the demands on CRBF columns or on acceleration-sensitive, nonstructural components (Buccella et al., 2021; Wiebe et al., 2013). The frictional energy dissipation elements were modeled using truss elements with an elastic perfectly plastic material model whose yield force equals the specified EDact. The PT was included as co-rotational truss elements using a multilinear material model, with properties recommended by Ma et al. (2010), prestressed using an initial stress material with a force equal to the defined PT0. Also, hook elements were added in series with the PT elements to prevent compression from developing in the PT.
All four types of SFRSs incorporated a leaning column in their models to account for P-delta effects from the building’s gravity frames. The tributary seismic mass of each floor was concentrated at the nodes of the leaning columns, which were laterally constrained to the frames’ first joints on each floor. The inherent damping of all SFRSs was modeled using 5% Rayleigh damping based on the first and third fixed-base periods. For the braced frames, to avoid artificial damping when the structure yields, the stiffness proportional damping was considered with 20% of the initial-stiffness matrix and 80% of the committed tangent-stiffness matrix (Charney, 2008; Steele and Wiebe, 2017), while constant stiffness proportional damping was based on the initial-stiffness matrix for the SMRFs.
The importance of gravity framing and slab composite action on the seismic performance of buildings has been emphasized in past studies (Elkady and Lignos, 2014; Flores et al., 2014; Gupta and Krawinkler, 1999; Hwang and Lignos, 2017a, 2017b; Ji et al., 2009). In this study, however, gravity framing was not modeled in order to focus on the differences between SFRSs, recognizing that gravity framing is not designed to resist lateral loads and, therefore, can vary significantly between designs. Similarly, this study followed the recommendations of ATC 72-1 (PEER/ATC-72-1, 2010) and ASCE 41-17 (ASCE/SEI 41-17, 2017), which do not require the inclusion of slab effects when calculating the effective stiffness and strength of SFRS components.
Construction cost and loss assessment
The construction cost and replacement cost of buildings with SMRFs and SCBFs were assumed to be $2691 per m2 ($250 per ft2) (Hwang and Lignos, 2017a) and $1884 per m2 ($175 per ft2) (Hwang and Lignos, 2017b) based on 2013 U.S. dollars, respectively. The replacement cost of BRBF buildings was estimated to be the same as for the SCBF buildings. The CRBF buildings’ replacement cost was assumed to be 2% more than SCBF buildings (i.e., $1922 per m2), justified by the postconstruction cost evaluation of past real-world projects such as the Casa Adelante nine-story housing project, which had only a 0.25% additional construction cost compared to conventionally designed buildings (Aher et al., 2020).These replacement costs were taken as the loss associated with both building collapse and the demolition of irreparable buildings. Building demolition loss was assessed conditioned on the maximum residual story drift ratio from all of the stories using a lognormal distribution, defined by a median of 0.015 radians and a logarithmic standard deviation of 0.3 as used by Ramirez and Miranda (Ramirez and Miranda, 2012). Any potential demolition due to residual axial shortening of deep columns in SMRFs (Elkady et al., 2020) was not considered.
To calculate the earthquake-induced losses for the buildings in line with the FEMA P58-1 probabilistic loss estimating methodology (FEMA P-58-1, 2018), damage fragility functions and repair cost consequence functions for both structural and nonstructural components are required. For the seismic losses associated with structural components, the FEMA P58-3 (2018) library was the main reference for damage fragility functions and repair cost consequence functions. There are two categories of structural component costing: per connection and per bay basis. For three-story buildings with various SFRSs, Table 3 shows an example of the considered structural components and their quantities; the appended letter or number at the end of the mentioned group components’ IDs denotes the specific component in each group depending on the size of the structural elements. The repair cost on a per connection basis includes the steel column base plates and welded column splices, for which group components with IDs of B1031.011 and B1031.021 were used, respectively. The components with repair cost on a per bay basis were selected as follows: (i) SMRFs: post-Northridge RBS connection with beam one side (B1035.00) and both sides (B1035.01) of column; (ii) SCBFs: special chevron braced frame with hollow structural section (HSS) braces designed with the American Institute of Steel Construction (AISC) minimum standard (B1033.021); (iii) BRBFs: chevron steel buckling restrained brace (B1033.101); (iv) CRBFs: special chevron braced frame with wide flange braces designed with balanced design criteria (B1033.001). B1033.001 was used because it is a component group with higher repair costs at lower story drift ratios relative to other special chevron braced frames with wide flange bracing components. However, the engineering demand parameter (EDP) used as an input to this fragility curve was modified because the story drift for the CRBFs involves both a deformation of the frame itself and an additional rigid body deformation brought on by the rocking behavior. Accordingly, the maximum compression deformation of the braces was employed instead of story drift in the damage fragility functions of the B1033.001 component group (Banihashemi and Wiebe, 2022). Damage to the beams and columns was not considered because they had been capacity designed. Because the CRBFs were designed to be decoupled from the gravity framing system, no damage to the slabs due to the uplift of the CRBFs was expected or modeled. To consider damage to the post-tensioning, if the PT strain was greater than the yield strain of 0.83% (Ma et al., 2010), it was assumed that replacement of the PT strands and the accompanying connected equipment in the CRBFs would be required. The cost of such a replacement was estimated to be $8 per kilogram (kg) of steel strands according to DYWIDAG Systems International (2020) in 2020 U.S. dollars. The frictional energy dissipation elements in the CRBFs were assumed to be designed with sufficiently large displacement capacity that it would not be damaged before the building collapsed.
Summary of considered structural components and their quantities for the three-story building.
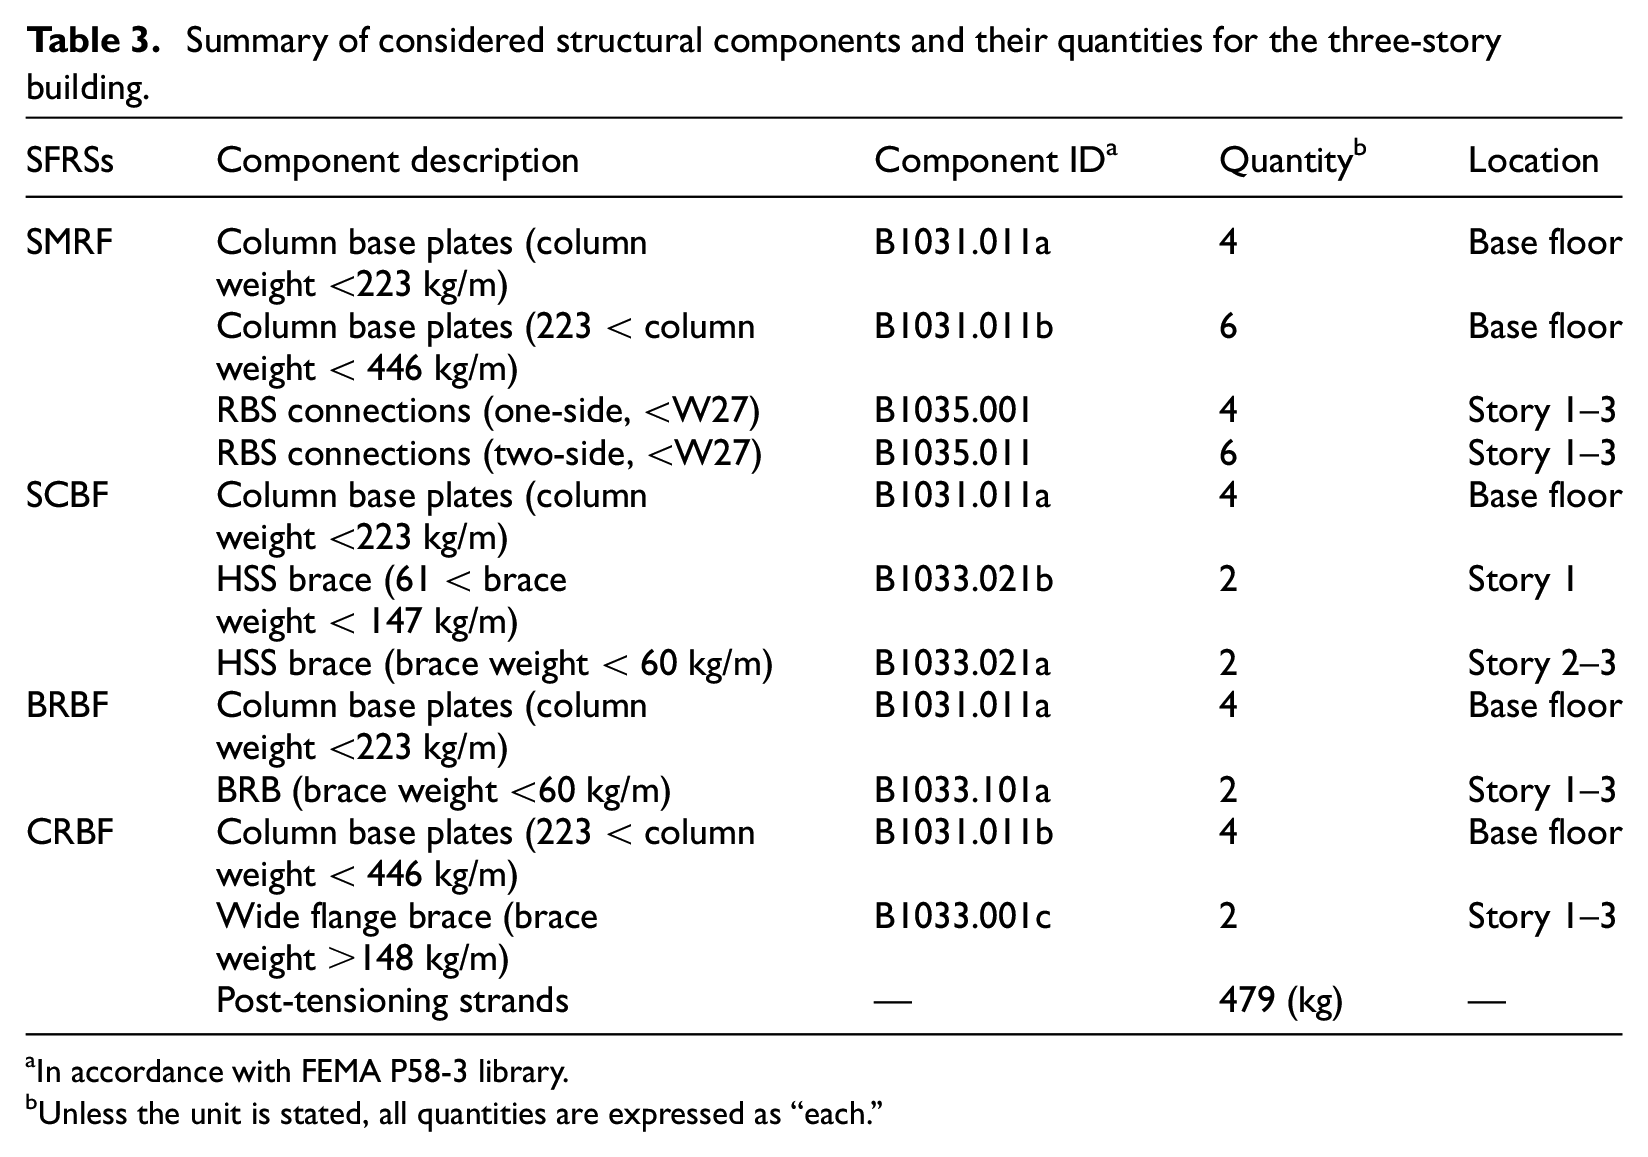
In accordance with FEMA P58-3 library.
Unless the unit is stated, all quantities are expressed as “each.”
Table 4 lists the 21 nonstructural components, including acceleration-sensitive and drift-sensitive components, that were included in the seismic loss assessment, along with their quantities assigned to each floor of the three-story building. Nonstructural component quantities were allocated to each floor using the FEMA P-58 normative quantity estimation tool (FEMA P-58-3, 2018), and estimated quantities were rounded up to the next whole number. The same nonstructural components and quantities were also considered for the six- and 12-story buildings, but the quantities of the components denoted by an asterisk vary depending on the number of floors. The damage fragility functions were primarily adopted from FEMA P58-3 (2018) and other identified nonstructural research findings, as indicated in Table 4. Also, repair cost consequence functions provided by FEMA P58-3 were employed to evaluate loss due to nonstructural components. All anchorages and bracing for types of equipment that require them were assumed to be designed such that they would not be damaged before the equipment failure; thus, they were not considered for the loss assessment.
Summary of considered nonstructural components and their quantities for the three-story building.
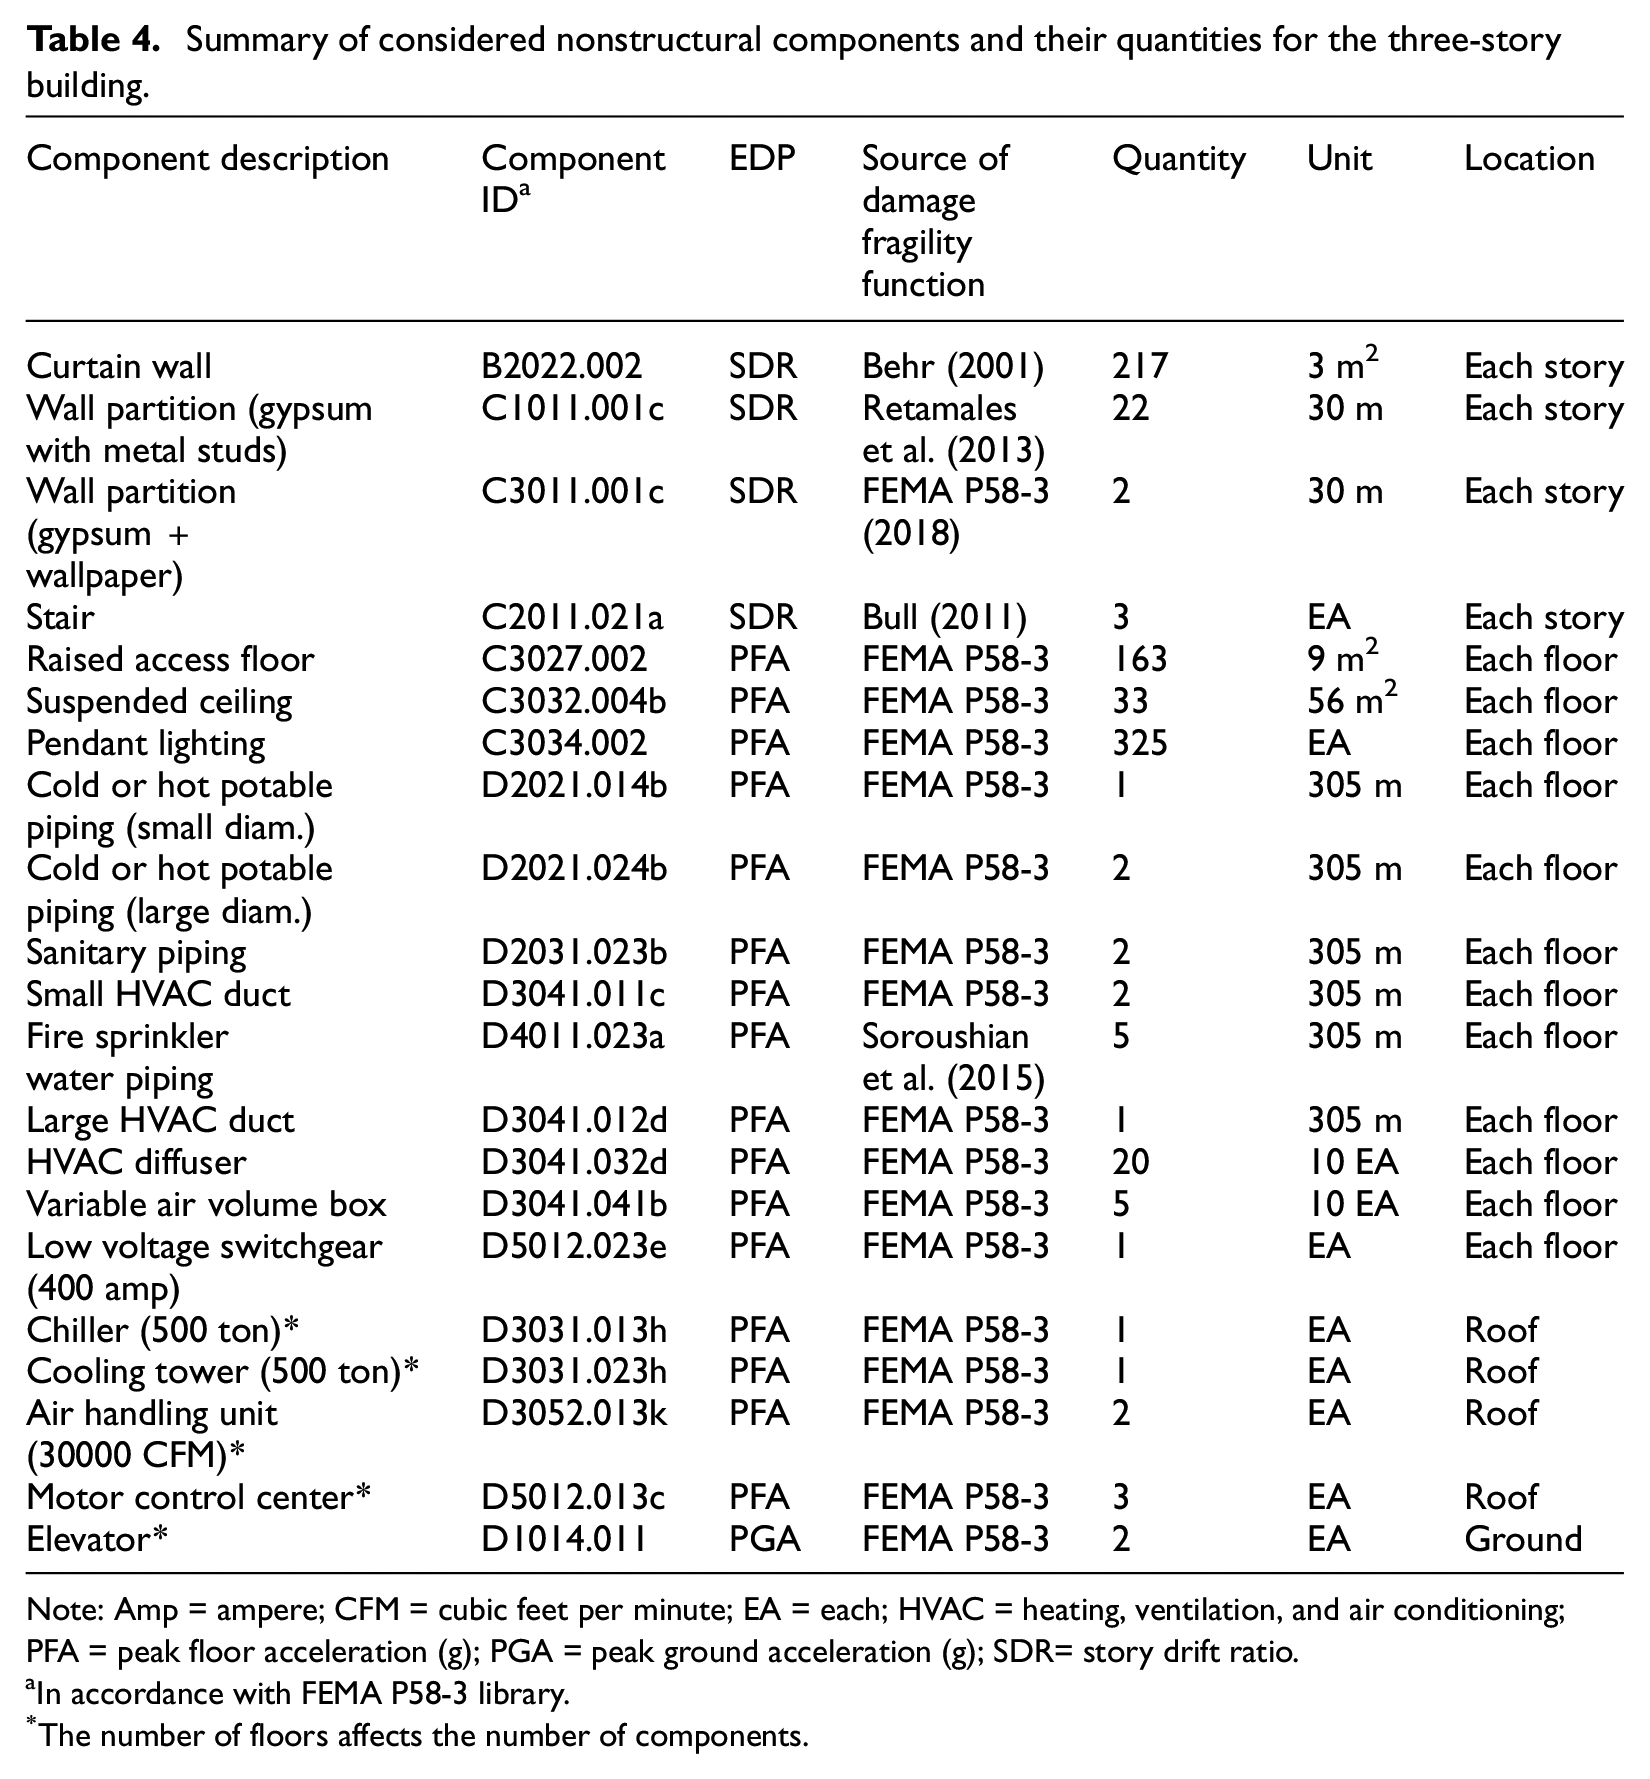
Note: Amp = ampere; CFM = cubic feet per minute; EA = each; HVAC = heating, ventilation, and air conditioning; PFA = peak floor acceleration (g); PGA = peak ground acceleration (g); SDR= story drift ratio.
In accordance with FEMA P58-3 library.
The number of floors affects the number of components.
Since 2011 serves as the reference year for costs in the FEMA P58-3 consequence functions, all anticipated costs that were not in 2011 were scaled to a 2011-equivalent value using data from the RSMeans historical cost index (RSMeans, 2020). The Pelicun software (Zsarnóczay, 2019), which was developed based on the FEMA P58 methodology by the Computational Modelling and Simulation Center (SimCenter), was used to conduct the seismic loss analyses.
Structural performance
As a representative example, Figure 5 depicts the time history of the roof drift and roof acceleration responses for the three-story SFRSs, as well as the column uplift of the CRBF, during the first component of the Northridge (Canyon Country) ground at the DE level. For this scaled ground motion, all SFRSs experience a roof drift larger than 1% between 4 s and 10 s, and yielding or buckling in the braces of the BRBF and SCBF leads to a residual drift larger than 0.6%. In contrast, the SMRF exhibits a smaller residual drift, and the CRBF shows no residual drift. During this period, the roof acceleration response reveals that while the SMRF exhibits slightly higher demand levels compared to SCBF and BRBF, the instants of column impact and uplift in the CRBF result in local peak responses, which is distinct from findings in other studies (Buccella et al., 2021; Wiebe et al., 2013). These peaks also appear to be influenced by higher mode effects similar to those identified by Buccella et al. (2021).
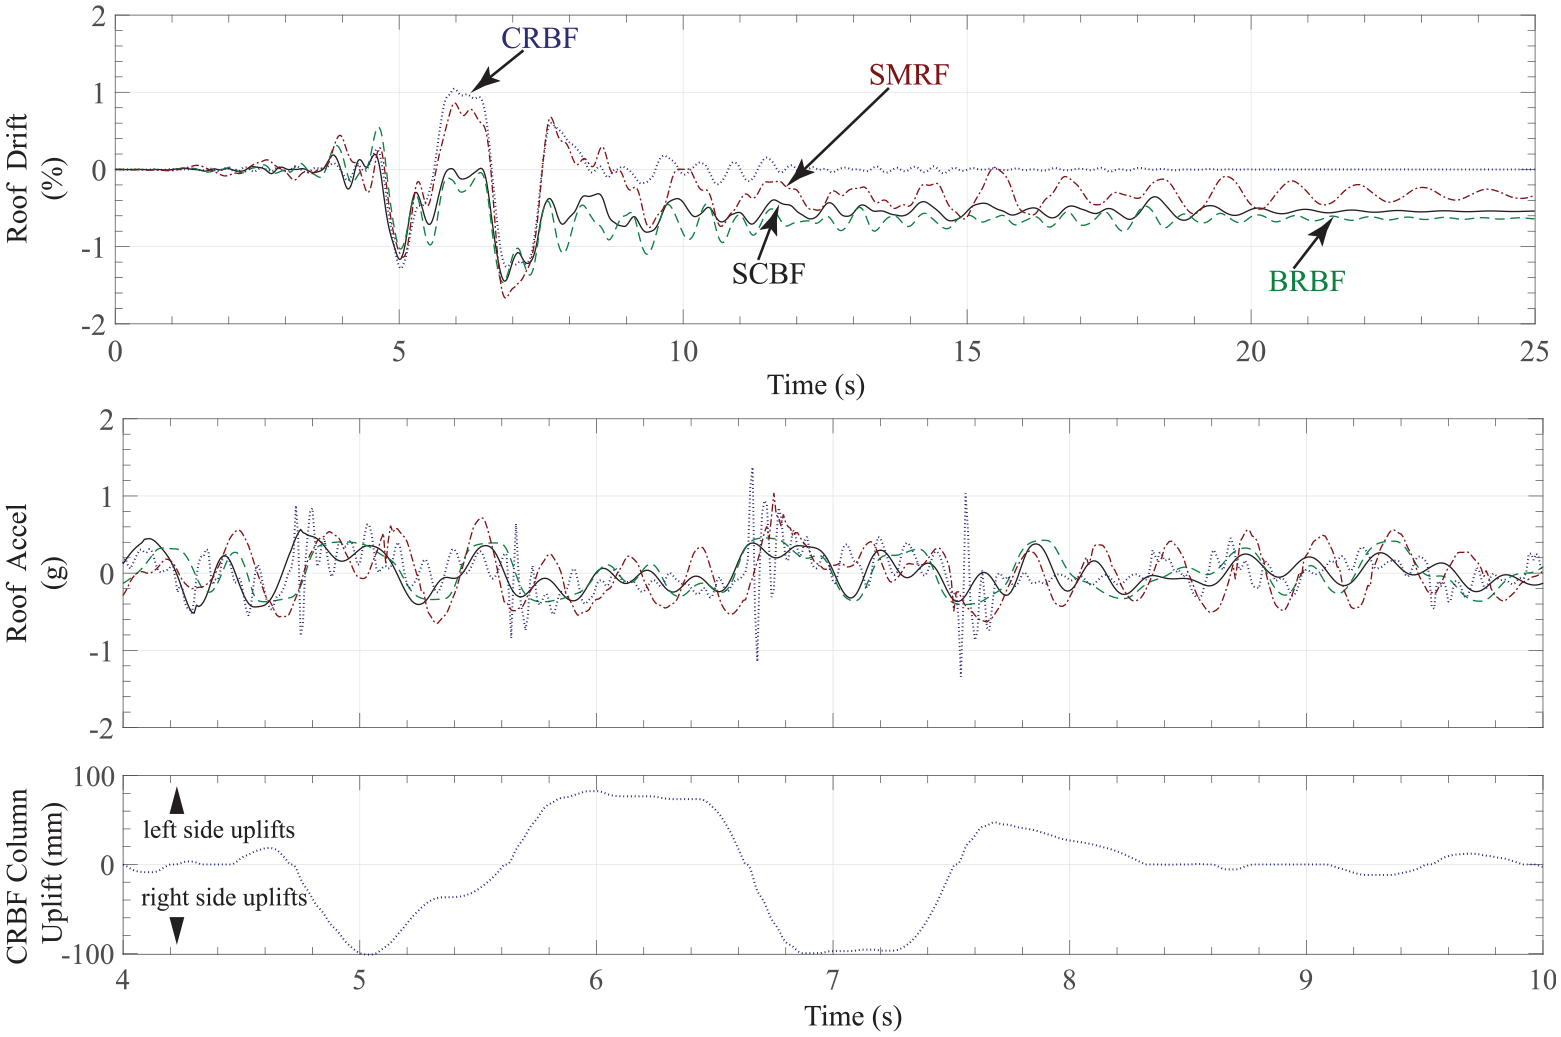
Three-story buildings: roof drift, roof acceleration, and CRBF column uplift during the first component of the Northridge (Canyon Country) ground motion at the DE level.
Figure 6 illustrates the hysteretic response of the beam and column in the first story of the SMRF, as well as the hysteretic response of the brace in the first story of the other SFRSs, for the three-story buildings under the same scaled ground motion. For the SMRF, most nonlinearity effects are attributed to the beam due to the design principle of having strong columns and weak beams. Additionally, while the braces of the SCBF and BRBF experience buckling and yielding, respectively, the braces of the CRBF remain linear due to the implementation of capacity design principles.
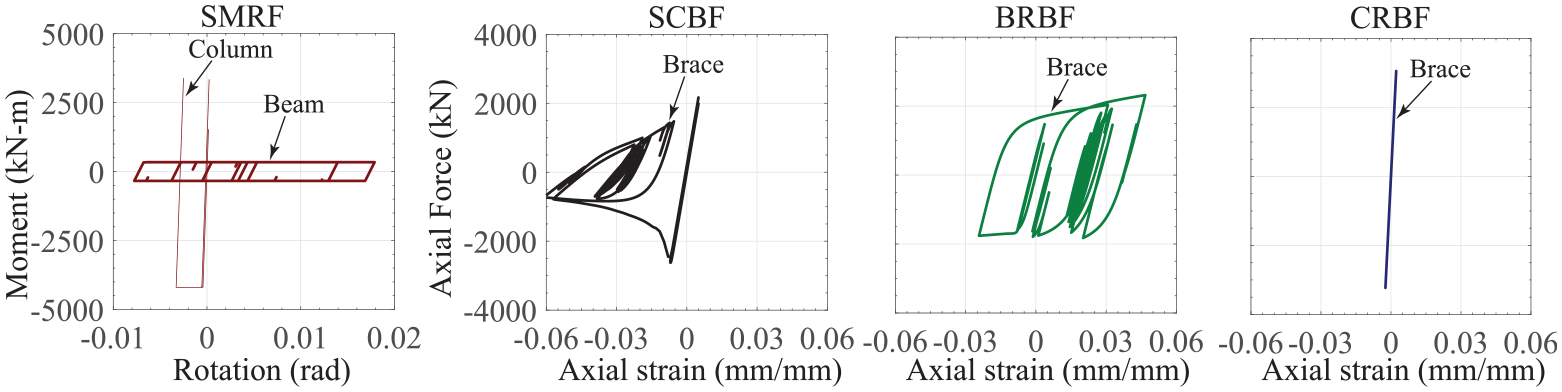
Three-story buildings during the first component of the Northridge (Canyon Country) ground motion scaled to DE level: hysteretic response of the first story beam and interior column base of the SMRF, and the hysteretic response of the first-story left brace of other SFRSs.
Figure 7 shows the median peak story drift ratios (SDRs), peak floor accelerations (PFAs), and residual story drift ratios (RSDRs) at the DE level for all considered SFRSs. The SMRF and SCBF have the largest and smallest drifts, respectively, among the three-story SFRSs. Additionally, the drifts of the CRBF are nearly constant over the height of the building, indicating that the rocking mode dominates the displacements of the CRBFs (Buccella et al., 2021). Similar outcomes can be seen for taller structures, although the differences in drifts for the various SFRSs become less evident, and the higher mode effects are more pronounced. Comparing the PFAs shows that SMRFs have higher demands than other SFRSs, and CRBFs experience large demands on the roof. Also, the buckling and yielding of the lower story braces in the SCBFs and BRBFs prevent large PFAs for higher floors. Comparing residual drifts among the three-story SFRSs highlights the distinctive behavior of the CRBF, which exhibits no residual drifts due to its self-centering mechanism, contrasting with the other three SFRSs that demonstrate residual drifts, particularly at lower stories. This trend holds in taller buildings, where CRBFs exhibit minimal residual drifts, while the SCBFs, BRBFs, and six-story SMRFs have higher residual drifts on lower stories. However, the 12-story SMRF experiences increasing residual drifts at higher stories.
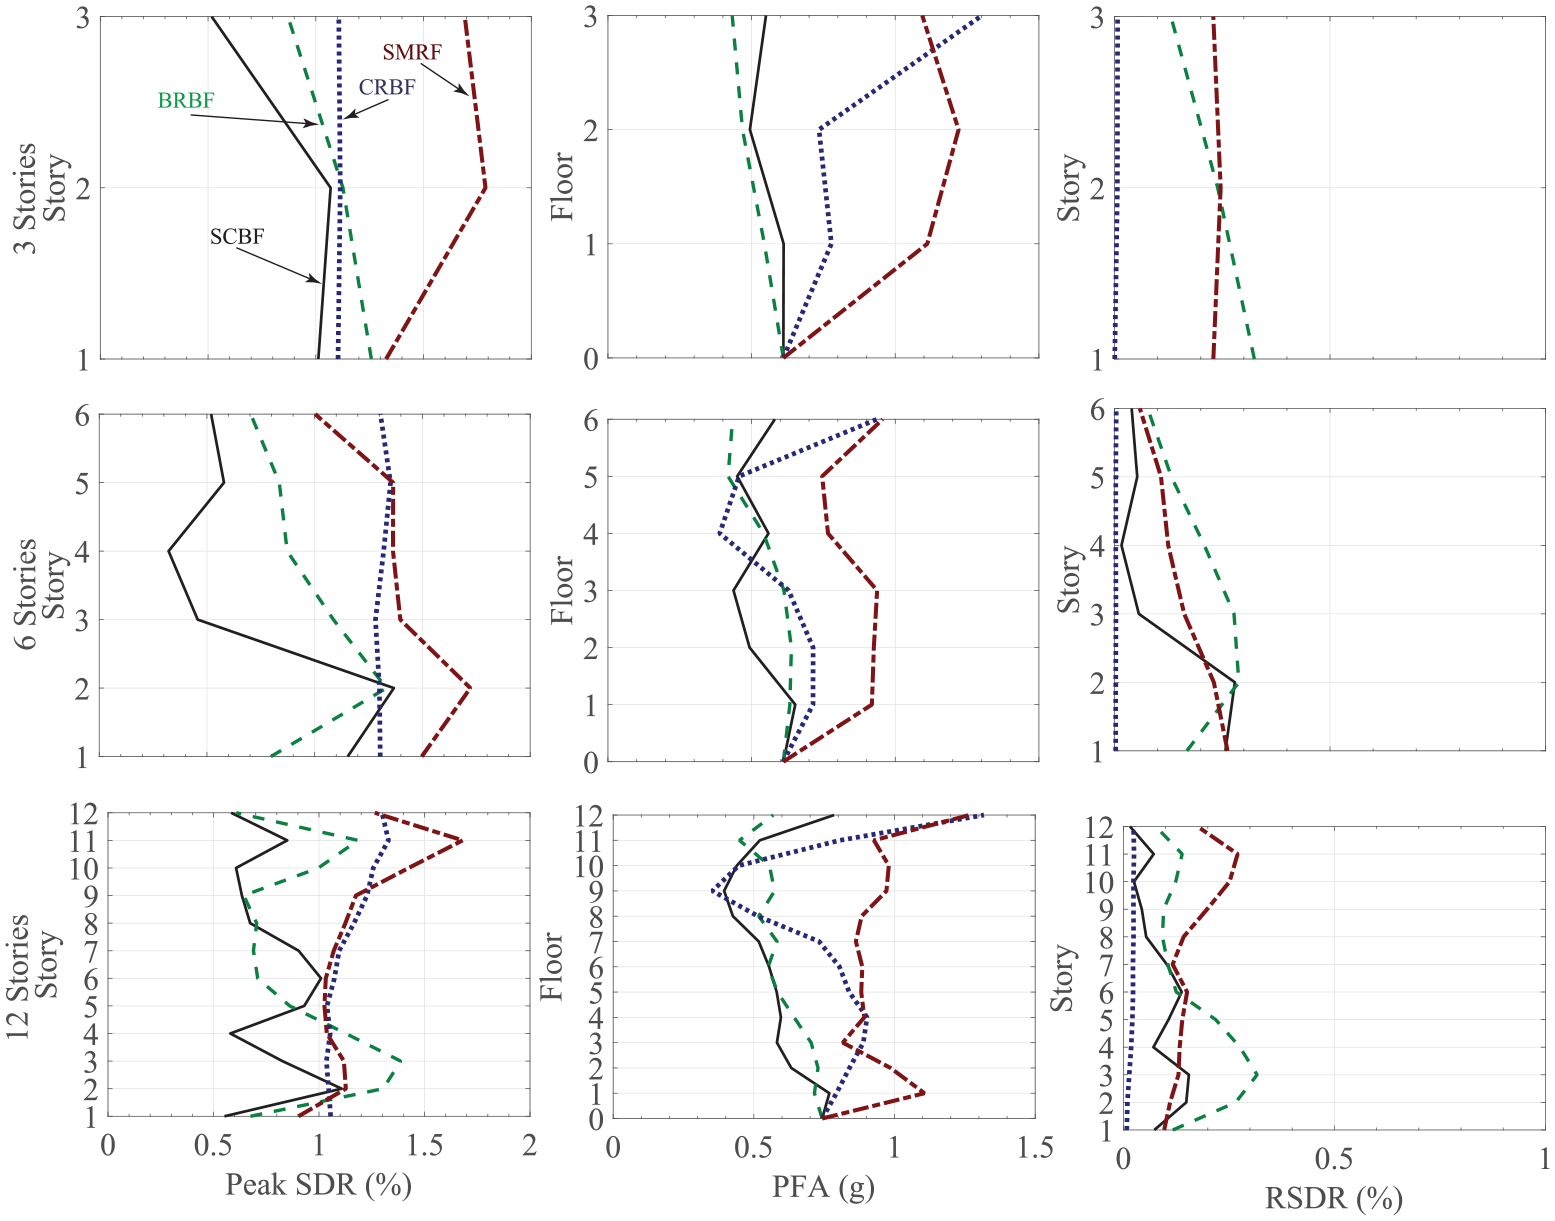
Median values of peak story drift ratio (SDR), peak floor acceleration (PFA), and residual story drift ratio (RSDR) at the DE level.
The collapse probability of each building was assessed for each intensity level of the MSA, based on a collapse definition of any SDR exceeding 10% using models that directly included the expected mechanisms of strength and stiffness deterioration as described previously. The collapse fragility curves of the SFRSs, which were developed employing the software tools provided by Baker (2015), are compared in Figure 8, with the x-axis showing the ratio of the demand intensity to the MCE spectral acceleration at the elastic period of that building (i.e., Sa(T1,5%)/SMT). Among the considered building heights and SFRSs, only the 12-story SMRF had a collapse probability exceeding 5% at the MCE level. Comparing collapse margin ratios (CMRs), defined as the median collapse spectral acceleration divided by SMT, all three-story SFRSs have very similar CMRs, while for taller buildings, the CMR is lowest for the SMRFs and highest for the BRBFs, with the other SFRSs in between. These results are generally consistent with the performance requirements of FEMA P695, considering that the ground motion scaling differs from the recommendation of FEMA P695 in order to directly compare the different SFRSs and that neither a spectral shape factor nor a total system collapse uncertainty has been applied.
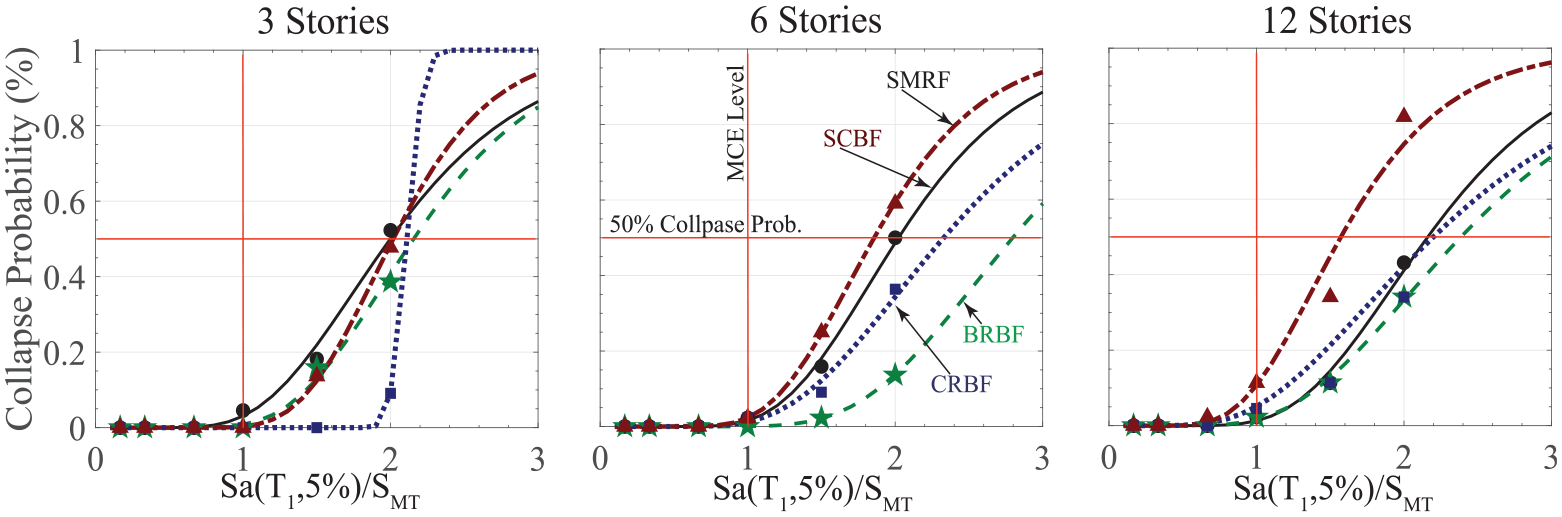
Collapse fragility curves.
The collapse fragility curve for the three-story CRBF (Figure 8a) has a notably lower dispersion than for the other cases considered. This is because the analysis did not indicate any collapse for this archetype at intensities below 2xMCE and indicated only two collapses at 2xMCE. Considering additional intensity stripes beyond 2xMCE would change the shape of the fragility curve for this structure, but the difference is only significant beyond 2xMCE, which is an intensity with a very low probability of exceedance. Further investigation of the collapse fragility of CRBFs is discussed by Steele and Wiebe (2017).
Seismic intensity-based expected losses
Figure 9 compares total expected losses of the four SFRSs at seismic intensity levels of 0.5 DE, DE, and MCE. The losses from the SFRSs at each building height were normalized by the SMRFs’ replacement cost. Also, the total expected losses are subdivided into losses owing to drift-sensitive and acceleration-sensitive nonstructural components, structural repairs, demolition, and building collapse.
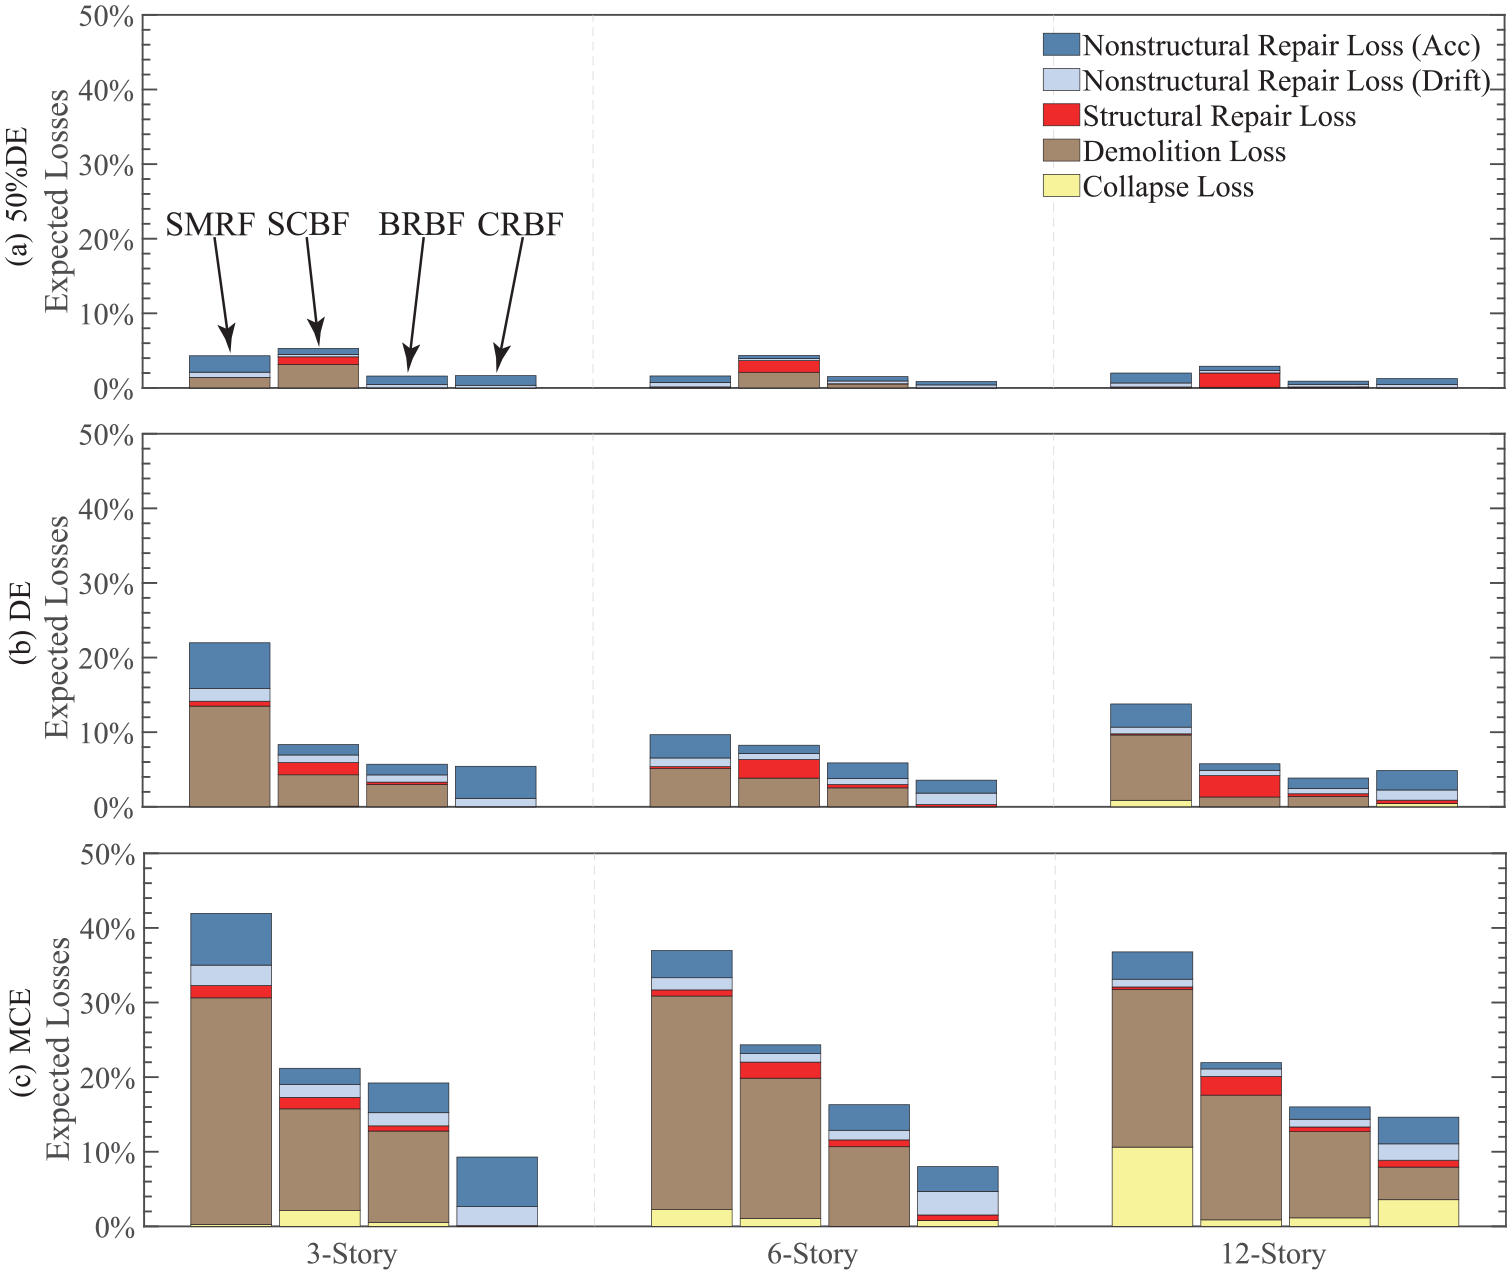
Expected losses (normalized by the replacement cost of the SMRFs for each building height) at three seismic intensities.
At the 0.5 DE level, the expected loss for all buildings is less than 8% of the SMRF replacement cost. Among the SFRSs, the SCBFs exhibit the largest expected loss, followed by the SMRFs. The expected loss for the BRBFs and CRBFs is relatively small, less than 2%, across all building heights. Acceleration-sensitive nonstructural components are the primary source of the loss for all systems except the SCBFs. For the SCBFs, the yielding and buckling of braces at the bottom floors even at low-intensity levels reduces PFAs at higher floors (Ray-Chaudhuri and Hutchinson, 2011) but at the cost of greater losses owing to structural components. Some small percentage of the loss due to demolition can be seen in Figure 9a, even though all story residual drifts at the 0.5DE level were much less than 1.5%. This is because the FEMA P58 Monte Carlo–based methodology (FEMA P-58-1, 2018) uses the Yang et al. algorithm (Yang et al., 2006, 2009) to generate a set of demands in each realization and incorporate the effects of uncertainties, and this algorithm produces a distribution with a longer tail than that of the original data set.
Similarly, at the DE level ( Figure 9b), the expected loss for the SCBFs, BRBFs, and CRBFs is less than 10% and generally lowest for the BRBFs and CRBFs. However, the SMRFs exhibit a greater expected loss, exceeding 20% for the three-story SMRF. Also, at this intensity level, the loss resulting from demolition is the greatest source of loss for almost all SFRSs at different heights, except for the CRBFs, where the lack of demolition-related losses is of a similar value to the increase in calculated losses related to nonstructural components.
At the MCE level (Figure 9c), the SMRFs exhibit expected losses surpassing 35% of the building replacement cost. Even just the irreparable losses of the SMRFs, namely losses due to collapse and demolition, are greater than the total expected losses for all other SFRSs. Figure 9c shows that the buildings with CRBFs greatly benefit from having little to no losses due to demolition at the MCE level, which leads to these buildings having the lowest expected losses at each height compared to buildings with other SFRSs. According to Figure 8, the collapse probabilities were low or zero for most SRFSs at the MCE level, resulting in the expected losses due to collapse remaining below 4% for most SFRSs at all heights. However, in the 12-story SMRF where the collapse probability was 11%, the associated expected loss due to collapse is 11%.
Expected annual losses
Total expected annual loss
This section examines earthquake-induced losses in the designed SFRSs in terms of expected annual loss (EAL), representing an average amount that is expected to be spent on earthquake damage repairs annually. This quantity is the area under the distribution curve of mean annual total repair cost (FEMA P-58-1, 2018). Such a curve was constructed for each building using time-based assessments following the guidelines of FEMA P58-1. The process involved multiplying the cumulative probability distribution of total loss at each intensity, which was obtained using Pelicun software (Zsarnóczay, 2019), by the annual frequency of occurrence within the corresponding intensity interval. The annual frequencies for a given loss level were then summed across all intensity-based loss curves. In this way, all seismic hazard levels were considered as well as all uncertainties provided in the FEMA P58-3 library for damage fragility functions and repair cost consequence functions.
Figure 10 illustrates the computed EALs of the SFRSs for each building height, normalized by the SMRF replacement cost. Figure 10 shows that the normalized EALs range from 0.05% to 0.3%, with the CRBF always having the lowest normalized EAL. Among the three-story buildings, the SMRF and CRBF exhibit the greatest and smallest normalized EAL, respectively. The normalized EAL of the three-story BRBF is only slightly greater than that of the CRBF. Comparing the irreparable losses, the three-story CRBF exhibits a minimal contribution from collapse losses, almost zero, consistent with the collapse fragility curve in Figure 7, which remains zero even until the 1.5 MCE level. The demolition losses from the three-story SMRF, SCBF, and BRBF account for over 45% of the total normalized EAL, making this the primary contributor to their total EAL. In contrast, the three-story CRBF benefits from self-centering behavior, resulting in zero demolition losses. In terms of repairable losses, the three-story SCBF exhibits the largest normalized EAL due to structural repairs, as SCBFs require repairs for braces and connections even at small drift ratios. In contrast, the three-story SMRF and BRBF experience smaller structural repair losses compared to the SCBF, and the CRBF has negligible structural repair losses due to capacity design and its rigid body rocking deformation. The normalized EAL caused by drift-sensitive nonstructural components is similar among the three-story SFRSs, while the SMRF and CRBF have relatively significant EALs due to acceleration-sensitive components. Indeed, the three-story CRBF’s major loss source is damage to acceleration-sensitive components, accounting for 75% of the total normalized EAL. Owing primarily to improved damage fragility curves in the most recent version of FEMA P58-3 (2018) compared to the earlier one (FEMA P-58-3, 2012), Figure 10 demonstrates that losses due to acceleration-sensitive nonstructural components do not dominate the normalized EALs for SMRFs and SCBFs in the way that was found by Hwang and Lignos (2017a, 2017b).
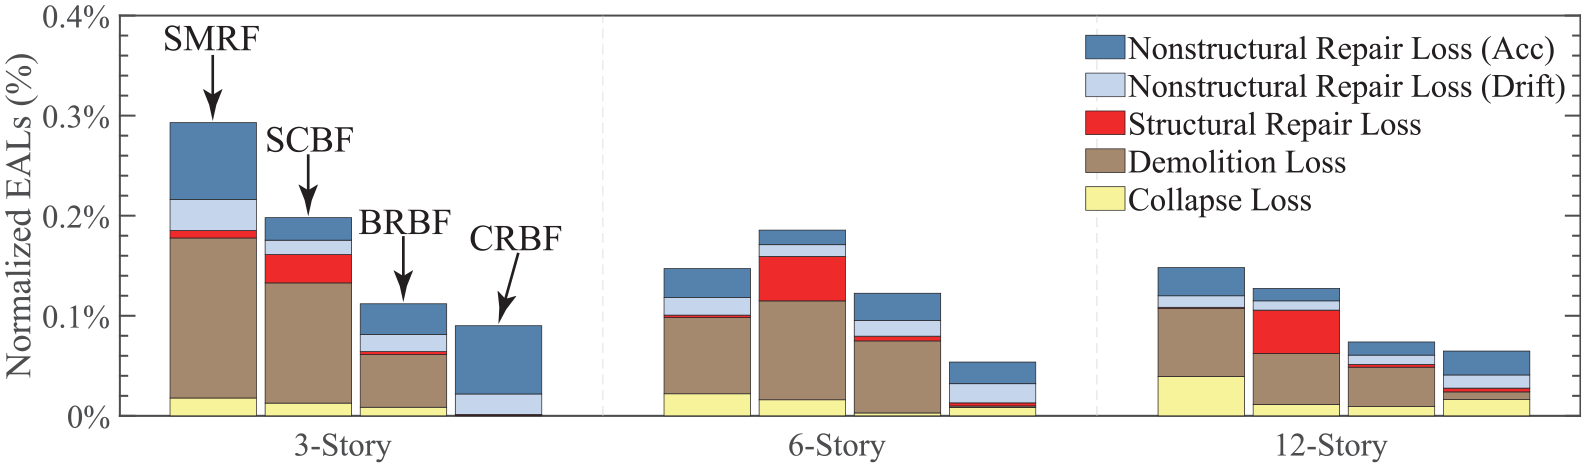
Expected annual losses (EALs) normalized by the replacement cost of the building with SMRFs for each building height.
The six-story buildings show similar trends as three-story buildings, but the SCBF has the greatest normalized EAL because it has both the greatest contribution from demolition losses among all SFRSs and the greatest contribution from structural losses. The EALs are generally lower than for the three-story buildings because the taller buildings benefit from economies of scale in repairs and because the probability of excessive residual drifts leading to demolition is lower for the SMRF building. Considering the 12-story buildings, similar trends can also be observed. The normalized EAL from structural repair loss is more evident for the higher-rise SCBFs because larger-sized braces and more seismic frames were used, although such loss is still small independent of building height for the other SFRSs. Figure 10 demonstrates that while the irreparable losses in the CRBFs contribute a small amount to the total annualized loss, the irreparable losses in other SFRSs contribute to more than half of the total EAL.
Contribution of individual nonstructural components
Figure 11 shows the contributions to expected annual losses from the five most significant nonstructural components, which collectively account for more than 70% of the total nonstructural component losses presented in Figure 10 for all cases. To evaluate the impact of these nonstructural components, their damage fragility function parameters and repair costs are given in Table 5 to be considered along with their quantities as listed in Table 4.
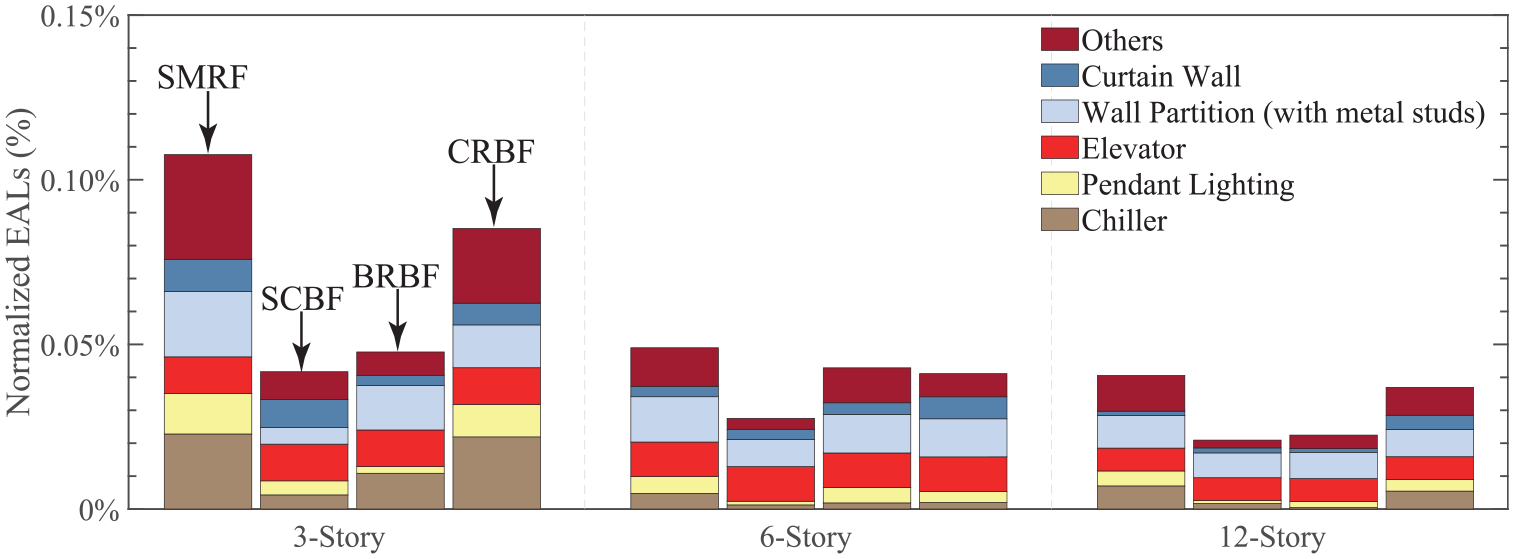
Nonstructural components with the greatest contributions to the total expected annual losses (EALs).
Damage fragility and repair cost for the seven nonstructural components with the most contributions to the total expected annual losses (EALs).
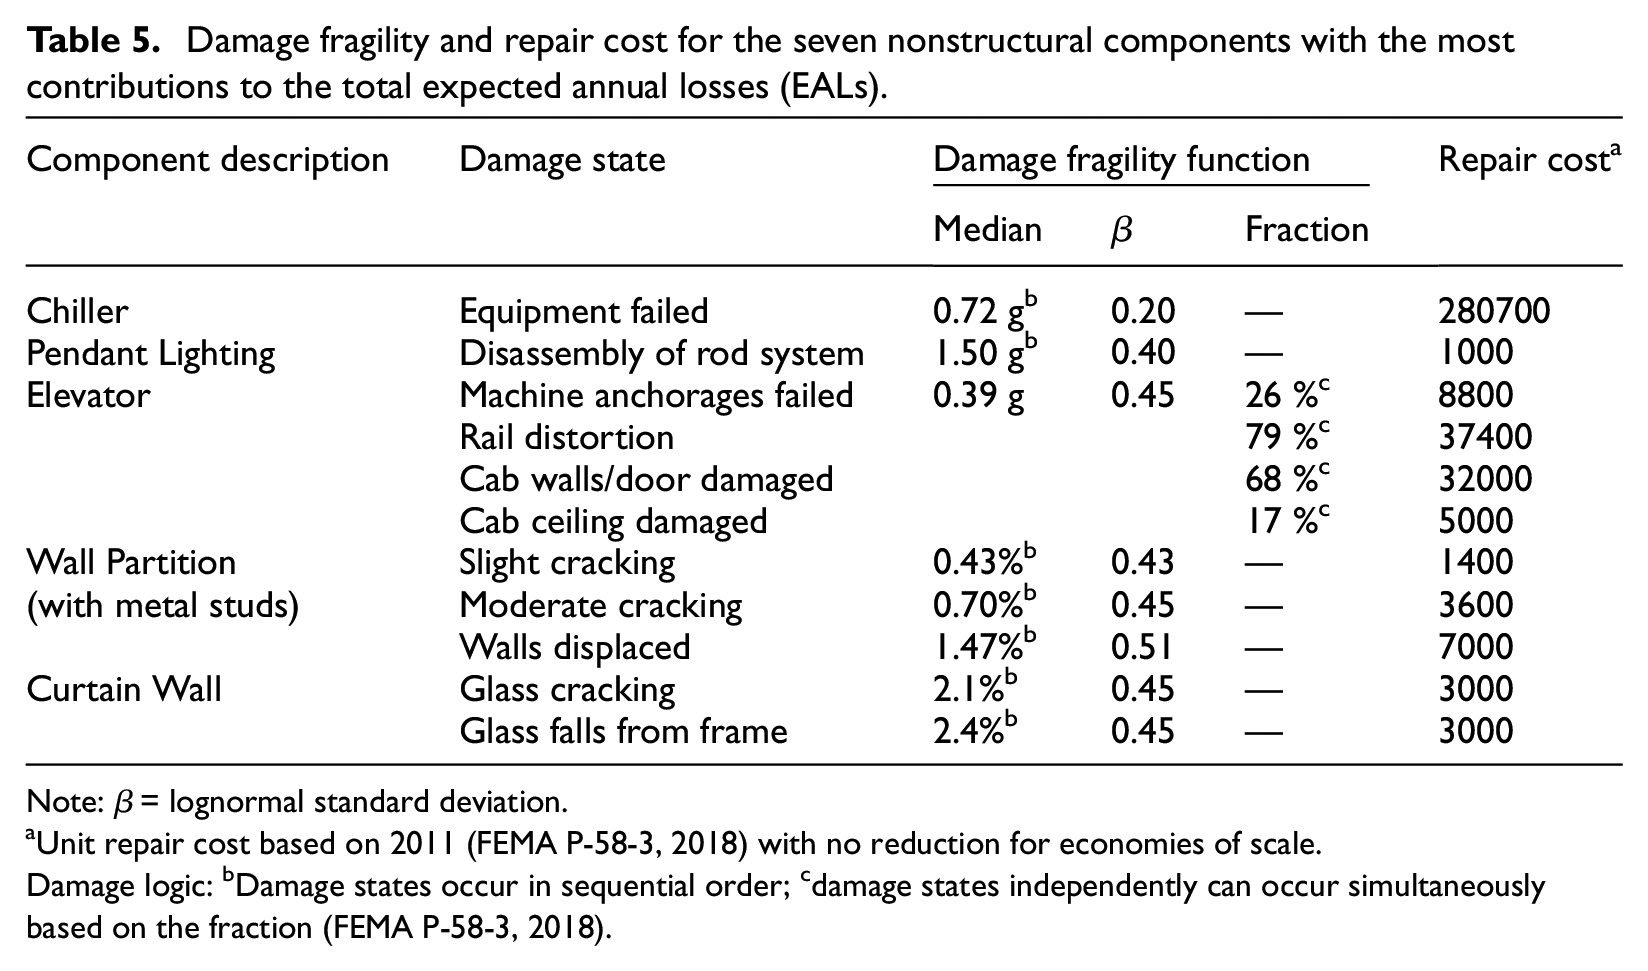
Note: β = lognormal standard deviation.
Unit repair cost based on 2011 (FEMA P-58-3, 2018) with no reduction for economies of scale.
Damage logic: bDamage states occur in sequential order; cdamage states independently can occur simultaneously based on the fraction (FEMA P-58-3, 2018).
Although there is only a single chiller installed on the roof of each three-story building, it makes a notable contribution to the total losses due to its modest 0.72 g median acceleration capacity and high repair costs exceeding $280,000. This contribution is relatively smaller for the three-story SCBF and BRBF because brace buckling and yielding at low earthquake intensities result in reduced acceleration demands on the roof. Pendant lighting contributes significantly to the total losses in the three-story SMRF and CRBF despite having a median acceleration capacity of 1.5 g and an inexpensive unit repair cost because of their high quantities, with more than 300 installed on each ceiling of each story. The elevator has a meaningful contribution to the losses because it has a high unit repair cost and a single damage state with a median acceleration capacity of only 0.39 g, which is less than the median peak ground acceleration (PGA) at the DE level (Figure 7). Damage to wall partitions often contributes significantly to the total losses due to their low capacity compared to the buildings’ story drifts. For example, moderate cracking can occur at a story drift ratio of 0.7%, which is smaller than the median demands of almost all floors of all three-story buildings at the DE level (Figure 7), although the associated loss is notably lower in the three-story SCBF building.
The trends that were described for the three-story buildings are also generally applicable to the 6- and 12-story buildings, although with lower total EALs, as noted previously. One additional difference is that the contribution of the chiller reduces for the 6- and 12-story buildings. This difference is primarily because of the discretization of the number of chillers, where one is assumed for both the 3- and the 6-story buildings and two chillers are assumed for the 12-story buildings, while the replacement value of the building is proportional to the number of stories. In addition, while Figure 7 often shows similar peak roof accelerations for all three building heights at the DE level of ground shaking, this is not true at all ground motion intensities.
Cost-effectiveness
This section investigates the cost-effectiveness of the BRBFs and CRBFs in comparison to the SCBFs, taking into consideration the influence of the return rate, r, as well as potential differences in construction and replacement costs. SMRFs are omitted because of their higher construction costs and the findings from the previous section that the considered SMRFs generally have higher EALs compared to braced frames. To make this comparison, the total of the initial building construction cost and the present value of earthquake-induced losses over the assumed 50 years of building life expectancy (Hwang and Lignos, 2017a) are determined as follows:
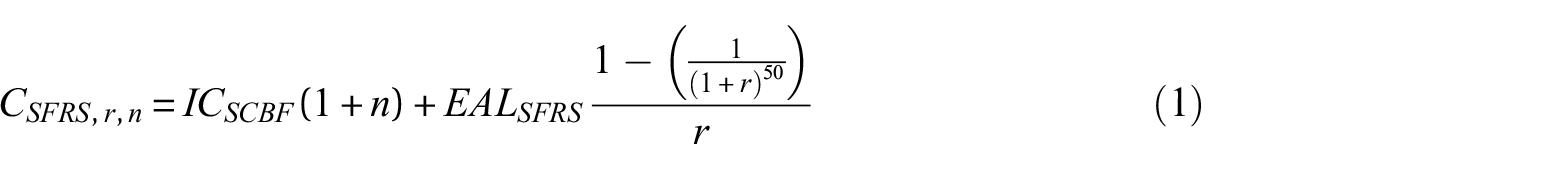
where ICSCBF is the construction cost of the considered building when using an SCBF as the seismic force-resisting system, and n is the relative premium in the building’s construction cost and replacement cost when using a different SFRS relative to the same height of SCBF. The cost-effectiveness of the BRBFs or CRBFs in comparison to the SCBFs is evaluated using the cost-effectiveness index CESFRS,r,n, which is defined to be normalized by the construction cost of the SCBF and is calculated for a range of different values of r and n:

Figure 12 illustrates the cost-effectiveness of the BRBFs and CRBFs using the above equation for ranges of 0 to 4% for r and 0 to 5% for n. For the BRBF and the CRBF, the values calculated with equation 2 and displayed on the contours represent the net present value of the total reduction in seismic costs over the assumed 50-year building life span, expressed as a percentage of the construction cost for an SCBF of the same height. This figure shows that the BRBF and CRBF are generally cost-effective, relative to the SCBF, for the three-story building because they have a positive index for most of the considered combinations of r and n. The three-story CRBF is slightly more cost-effective than the BRBF because it has a wider range of combinations of r and n that produce a positive cost-effectiveness index. For example, considering r of 3% and n of 4%, the BRBF is not more cost-effective than the SCBF, but the CRBF is. The six-story CRBF also has a positive index for almost all considered combinations of r and n, making it generally more cost-effective than the BRBF. According to the result for the 12-story buildings, the BRBF and CRBF have a positive index for fewer combinations of r and n. Nonetheless, the 12-story CRBF is marginally more economical than the BRBF.
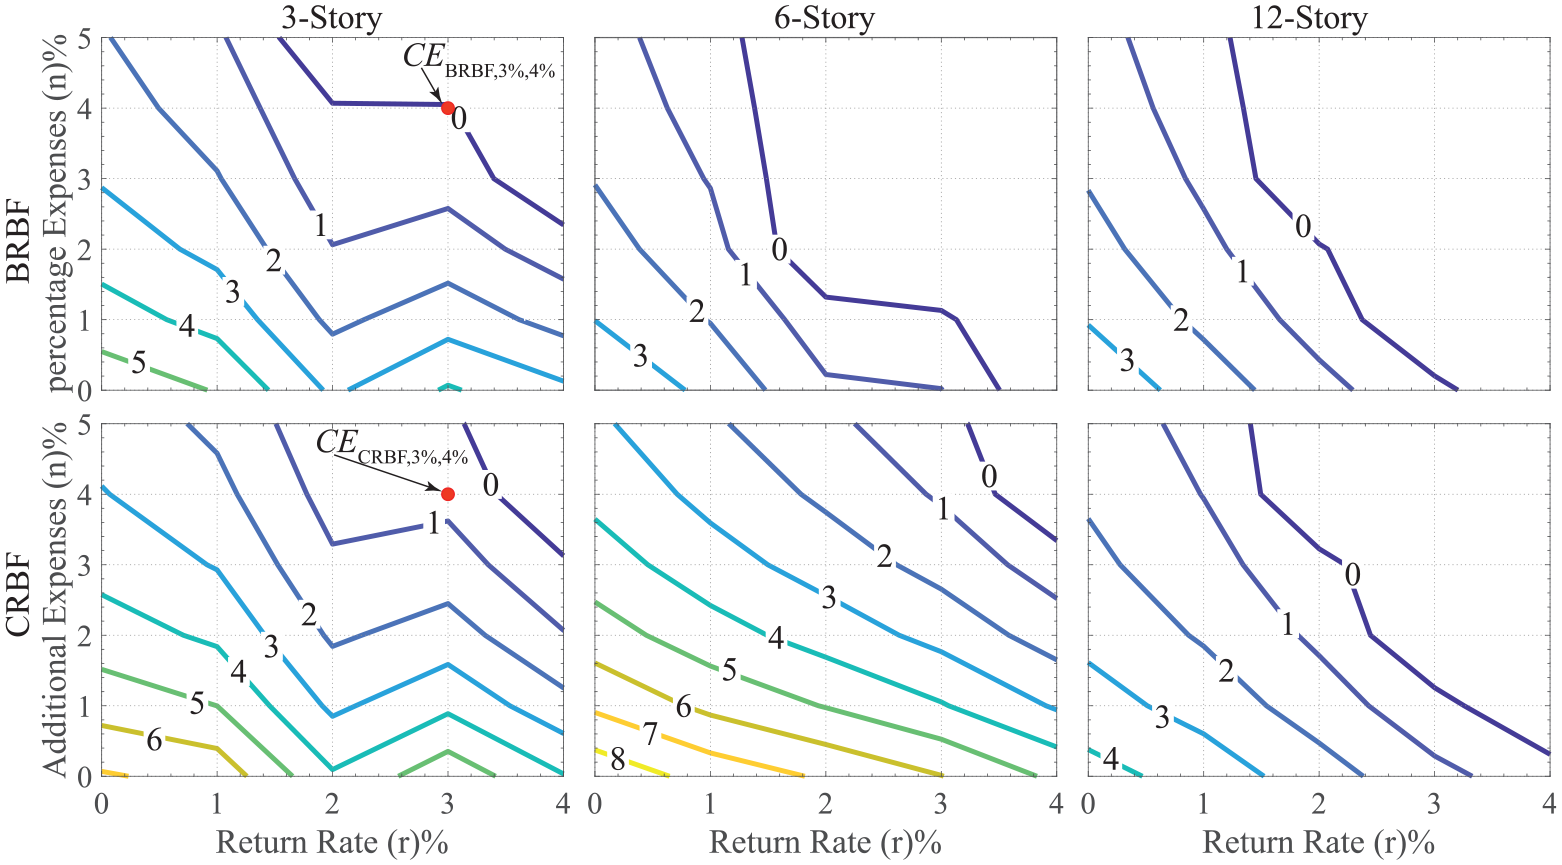
Cost-effectiveness comparison of the BRBFs and CRBFs to SCBFs.
Limitations
The aim of this paper was to compare the overall expected response of CRBFs and ductile SFRSs, yet the modeling of all these systems is an area of active research, particularly when the response nears collapse, as are the methods for translating the computed response into economic costs. The limitations of the modeling approaches taken in this work include:
The suite of ground motions recommended in FEMA P695 was used for this analysis, scaled over a period range that reflected the range of SFRSs considered in this study to produce a common set of ground motions for comparison. As such, the scaled ground motions are likely to have overestimated the demands on any one SFRS at a given probability of exceedance. Further study on the effect of ground motion selection and scaling on the comparisons presented in this study would be valuable. In addition, there is a need to calibrate spectral shape factors for systems, including CRBFs, that differ significantly from the moment frame buildings that were used for initial calibration (Haselton et al., 2011; 0.83%).
The effect of gravity frames was not modeled in this paper, potentially leading to an overestimation of the residual drift (e.g., Flores et al., 2014; Hwang and Lignos, 2017b). Given the significant influence of residual drift on total loss, future studies should explore the effects of gravity frames and slabs, considering a diverse range of influential parameters. Such analysis could also support examining the simplified equations for residual drift that are presented in Appendix C of FEMA P-58 (FEMA P-58-1, 2018) to assess their suitability with diverse types of SFRS hysteresis.
The connection design for the BRBFs and SCBFs, as well as their effects, was not considered in this paper. Others have studied the influence of different connection design alternatives for SCBFs (Mohsenzadeh and Wiebe, 2018), and Ruiz-García and Miranda (2006) emphasized the effect of the hysteretic diagram on residual drift. It is suggested that further research explore the effects of connection design and fixity in beam-column connections, as well as the hysteretic diagram, on total earthquake loss.
Rayleigh damping of 5% was modeled for consistency with design acceleration spectra, but the real damping is likely to be lower. While this is not expected to greatly influence the comparisons between different systems, it would still be worthwhile to investigate the influence of different damping models on the parameters considered here.
While this paper follows recommendations from Ramirez and Miranda (2012) for maximum residual drift to estimate demolition loss, studies such as McCormick et al. (2008) propose smaller thresholds for maximum residual drift to ensure both the safety and functionality of buildings. It is suggested that further research be conducted, taking into account the differing experiences with real earthquakes around the world (FEMA P-2090 / NIST SP-1254, 2021), to establish thresholds for residual drift.
This study relied on the damage fragility curves provided in FEMA P-58-1 (2018), which consider peak accelerations as the engineering demand parameter for acceleration-sensitive nonstructural components. However, prior research indicates that buildings designed with different SFRSs exhibit diverse shapes of floor acceleration spectra (Buccella et al., 2021), which may be expected to cause different demands on nonstructural components subjected to the same peak floor acceleration (Banihashemi et al., 2023).
This paper utilized the Pelicun software (Zsarnóczay, 2019), developed based on the FEMA P58 methodology (FEMA P-58-1, 2018). However, the effects of the correlation between damage to different components (Baker et al., 2023) and how economies of scale are calculated (Banihashemi et al., 2024) can be significant. The paper suggests further investigation to consider the results of these new articles when comparing the seismic loss of SFRSs.
Conclusions
The present study provided a comprehensive assessment and comparison of four distinct steel seismic force-resisting systems (SFRSs) as potential choices for designing buildings at three different heights (3, 6, and 12 story). These SFRSs included three common ductile SFRSs: special moment resisting frames (SMRFs), special concentrically braced frames (SCBFs), and buckling-restrained braced frames (BRBFs), as well as one low-damage self-centering SFRS—controlled rocking braced frames (CRBFs). The FEMA P58 methodology (FEMA P-58-1, 2018) was used to translate the unique structural performance attributes of each system into economic costs using the metric of expected annual loss (EAL). This also made it possible to compare irreparable losses, such as collapse and demolition due to excessive residual drifts, with reparable losses, involving repairs to structural and nonstructural components, for each distinct SFRS.
While all buildings designed with the four SFRSs demonstrated acceptable collapse capacities, their behavior at the design earthquake (DE) level revealed distinct characteristics. The SCBF and SMRF buildings showed the smallest and largest peak story drifts, respectively. The CRBF buildings maintained nearly constant story drifts throughout the building height due to the dominance of the rocking mode. Brace buckling and yielding in the lower stories of the SCBF and BRBF buildings led to decreased acceleration demands on the roof. Conversely, both the CRBF and SMRF buildings experienced higher roof accelerations, with the SMRF buildings generally exhibiting the greatest accelerations across all floors among the four systems. Moreover, the CRBF buildings exhibited minimal residual drift and member yielding, in contrast to the moderate residual drifts and larger contribution of yielding observed in the buildings with other SFRSs.
Considering expected annual losses (EAL) caused by seismic damage, the CRBF buildings exhibited the lowest total EAL among all considered systems, with the reduced losses due to irreparable damage or collapse (“irreparable losses”) more than compensating for the increased expected losses from acceleration-sensitive nonstructural components. The BRBF buildings showed only slightly higher EAL compared to the CRBF buildings, but the CRBFs offered a more favorable cost-effectiveness in terms of earthquake-induced losses over the assumed 50-year building life, for a wider range of combinations of cost premiums and return rates. In contrast, in the buildings designed with more common ductile SFRSs, more than half of the total EAL was attributed to irreparable losses, primarily driven by demolition losses. Notably, the contribution of only irreparable losses to the EAL of the SMRF and SCBF buildings was typically greater than the total EAL for the buildings with CRBFs.
Although the total EAL for the buildings with CRBFs was only slightly less than for buildings with BRBFs, the trade-off between irreparable and repairable losses would introduce complex factors when comparing expected recovery time. While further study is needed on this point, using CRBFs may be more advantageous because repairable losses are likely associated with less downtime than irreparable losses that require building demolition and rebuilding.
Footnotes
Declaration of conflicting interests
The author(s) declared no potential conflicts of interest with respect to the research, authorship, and/or publication of this article.
Funding
The author(s) disclosed receipt of the following financial support for the research, authorship, and/or publication of this article: Financial support for this work was provided by the Ontario Ministry of Colleges and Universities through an Early Researcher Award, and the Natural Sciences and Engineering Research Council of Canada (NSERC) through the Discovery Grant program.