
Abstract
While modern seismic design codes intend to ensure life-safety in extreme earthquakes, policy-makers are moving toward performance objectives stated in terms of acceptable recovery times. This article describes a framework to probabilistically model the post-earthquake recovery of buildings and provide quantitative seismic performance measures, expressed in terms of downtime, that are useful for decision-making. Downtime estimates include the time for mobilizing resources after an earthquake and conduct necessary repairs. The proposed framework advances the well-established Federal Emergency Management Agency (FEMA) P-58 and Resilience-based Earthquake Design initiative (REDi) methodologies by modeling temporal building recovery trajectories to target recovery states, such as stability, shelter-in-place, reoccupancy, and functional recovery. The shelter-in-place recovery state accounts for relaxed post-earthquake habitability standards, in contrast with the reoccupancy recovery state that relates to pre-event habitability criteria. Analogous to safety-based codes, which specify a threshold for the probability of collapse under a given ground motion shaking intensity, this framework permits evaluating the probability of a building not achieving a target recovery state, for example, shelter-in-place, immediately after an earthquake, or, alternatively, the probability of achieving a target recovery state, for example, functional recovery, within a specified time frame. The proposed framework is implemented to evaluate a modern 12-story residential reinforced concrete shear wall building in Seattle, WA. The assessment results indicate that under a functional-level earthquake (roughly equivalent to ground motion shaking with a return period of 475 years), the probability of not achieving shelter-in-place immediately after the earthquake is 22%, and the probability of downtime to functional recovery exceeding 4 months is 88%, which far exceeds acceptable thresholds suggested in the 2015 National Earthquake Hazards Reductions Program (NEHRP) guidelines and FEMA P-2090.
Keywords
Introduction
Prompt post-earthquake recovery of buildings is an integral component of a community’s seismic resilience. Functional recovery of buildings enables people to return to their homes and facilitates access to other essential functions, such as schools, healthcare, and commerce (Bonowitz, 2009; San Francisco Planning and Urban Research Association (SPUR), 2012). Nevertheless, past earthquakes have highlighted that building performance is generally inadequate to ensure the seismic resilience of communities. After the Kobe earthquake in 1995, roughly, 15,000 households (19% of those impacted) relied on temporary housing 3 years after the earthquake (Olshansky et al., 2005). After the Northridge earthquake in 1994, 33% of the damaged multi-family housing units, approximately 890 buildings, took more than 2 years to complete repairs (Comerio, 2006; Comerio and Blecher, 2010). One year after the L’Aquila earthquake in 2009, only 4% of the 427 buildings surveyed by Liel and Lynch (2012) had completed repairs, 29% had ongoing repairs, and the remaining 67% had not yet started repairs.
In recent years, seismic planners and policy-makers have directed a concentrated research effort to achieve “better than code” seismic design. “Functional recovery,” that is, the performance state of a building, wherein it maintains or regains the ability to perform its basic intended use, is gaining significant importance (Federal Emergency Management Agency (FEMA) P-2090, 2021). The National Institute of Standards and Technology (NIST) and the Federal Emergency Management Agency (FEMA) are developing performance objectives in terms of post-earthquake recovery times (42 U.S.C. § 7705b, 2018; Senate Bill 1768, 2018). FEMA P-2082 has also recommended making functional recovery the primary basis for seismic design by assigning target recovery times (ranging from hours to months) to every new building, depending on the building’s risk category (FEMA, 2020). Similarly, the San Francisco Planning and Urban Research Association (SPUR) identified target post-earthquake recovery times for a resilient San Francisco (Poland, 2009). The efficacy of these resilience-based performance objectives is dependent on the availability of tools to assess the post-earthquake recovery time of buildings. The primary motivation for this article is to support these recent efforts to develop resilience-based seismic design guidelines by proposing an analytical framework that estimates building downtime, defined as the time required to achieve a recovery state after an earthquake.
A growing number of frameworks have been developed to assess the post-earthquake recovery time of buildings and communities. The FEMA P-58 (FEMA, 2018) methodology, a seismic performance assessment tool for individual buildings, translated engineering demand parameters (e.g. story drifts and floor accelerations) obtained from structural analyses to performance metrics, such as casualties, economic loss, and repair time. Almufti and Willford (2013) advanced on the FEMA P-58 methodology to develop the Resilience-based Earthquake Design initiative (REDi), a rating system that includes a framework to estimate the downtime of individual buildings to a defined recovery state by accounting for the repair time of damaged components, the delay time to start repairs and utility disruption. Terzic and Yoo (2016) proposed a post-earthquake building repair sequencing methodology established from interviews with engineers and contractors involved in repairs after the Northridge earthquake in 1994. Burton et al. (2018) developed a framework to quantify recovery trajectories at a building and community level that accounted for household decisions and available resources after an earthquake. Costa et al. (2021) presented a framework of agent-based models that accounted for building vulnerability and socioeconomic factors to understand housing recovery of a portfolio of buildings after an earthquake. Hulsey (2020) proposed a community recovery time estimation framework that accounts for access restrictions due to both individual building damage and safety cordons that may be triggered due to extensive damage to adjacent buildings.
Numerous studies have utilized the aforementioned methodologies to quantify downtime estimates in tall buildings. Molina Hutt et al. (2016) assessed tall pre-Northridge steel-framed buildings in San Francisco and evaluated the effectiveness of different retrofit strategies on expected downtime using the REDi guidelines. The results highlighted the contribution of impeding factors, structural repair, and non-structural repair to the total downtime estimates. Terzic and Mahin (2017) studied the performance of conventional and seismically enhanced low-rise commercial steel buildings using the FEMA P-58 methodology and expressed the benefits of the enhancements in terms of repair cost and repair time. Molina Hutt et al. (2021) examined the performance of modern tall buildings, designed following a performance-based procedure, in terms of their downtime to functional recovery using the REDi guidelines with some adjustments. The authors provide insights into the benefits of using stricter drift limits in building design and implementing measures to mitigate impeding factors to reduce downtime.
Although the above-mentioned research has significantly improved our understanding of building recovery, existing frameworks have several limitations. For example, the FEMA P-58 methodology provides estimates of the total repair time to achieve full recovery, but it does not provide any information regarding the progress of recovery over time. The REDi guidelines have several limitations in their repair sequencing and worker allocation methodologies, which are discussed later in this article. Regional damage assessment frameworks by Burton et al. (2018) and Costa et al. (2021) are valuable for building portfolio assessments but do not inform specific design interventions in individual buildings. Moreover, most studies that estimate earthquake-induced downtime primarily report the average or median estimates, which fail to capture the high uncertainty in downtime predictions. These studies also do not track intermediate milestones throughout the building’s path to recovery.
To expedite post-earthquake recovery, design targets in building codes should extend beyond the life-safety performance objective in extreme earthquakes to include resilience-based performance measures. As proposed by Bruneau et al. (2003), these performance measures should describe (1) the ability to withstand earthquake loads without degradation or loss of function, that is, robustness and (2) the ability to regain functionality within a specified time frame, that is, rapidity. In this article, we introduce an open-source tool to estimate these resilience-based performance measures, assess downtime, and model post-earthquake recovery of individual buildings. To facilitate its use, the framework is coded in MATLAB (2020), as well as in Python (provided as an open-source application called TREADS), and made available as an Electronic Supplement. The framework is fully compatible with the SimCenter’s (the Natural Hazards Engineering Research Infrastructure (NHERI) program’s computational modeling and simulation center) tool for loss assessment, that is, PELICUN (Zsarnoczay and Kourehpaz, 2021), an open-source application that implements the FEMA P-58 methodology. Thanks to this compatibility, a user can perform a complete damage, loss, and downtime assessment within a unified workflow.
The proposed recovery framework builds on the aforementioned research and has several developments. The framework: (1) accounts for additional recovery states, for example, stability and shelter-in-place, to account for different milestones in a building’s recovery; (2) modifies existing impeding factor estimates and repair sequencing methodologies using empirical data to provide more realistic downtime estimates; (3) models the building’s temporal recovery trajectory, that is, its recovery with time; (4) provides probabilistic measures for estimating the seismic performance of a building in terms of robustness and rapidity, metrics that can potentially be used in building codes; and (5) includes a downtime disaggregation tool that permits identifying the contribution of different components to overall downtime, enabling design enhancements to achieve the desired design or retrofit target.
The following sections describe the point of departure of this research, namely, an overview of the FEMA P-58 and REDi methodologies, and provide a detailed description of the proposed framework. While the proposed methodology is generic, we demonstrate its implementation in the evaluation of the seismic performance of a modern 12-story reinforced concrete shear wall building, subjected to five distinct ground motion shaking intensities.
Point of departure
The proposed downtime assessment framework builds on the FEMA P-58 methodology and the REDi guidelines. A brief overview of these methodologies is presented next.
FEMA P-58
FEMA P-58 proposed a seismic performance assessment methodology for individual buildings based on the performance-based earthquake engineering framework developed by Cornell and Krawinkler (2000) and Moehle and Deierlein (2004). The methodology employs predefined fragility functions to predict damage states in building components from structural response parameters, such as story drift ratio and floor acceleration. Consequence functions translate these damage states into various performance metrics, such as casualties, repair costs, and repair times. Monte Carlo simulations are used to account for the high degree of uncertainty in the structural response parameters, damage state predictions, and consequence estimates.
While the repair cost estimation procedure employed in the FEMA P-58 methodology is well-established, the repair time calculation has several limitations. The FEMA P-58 methodology only estimates the repair time required to achieve full recovery and does not consider any intermediate recovery states, for example, reoccupancy or functional recovery. Two estimates of building repair time are provided: repair time in series (considering repairs in each floor are sequential) and repair time in parallel (considering repair in all floors simultaneously). The assumed workforce depends only on the building floor area and not on the extent of damage to the building, and the repair sequencing is simplified to consider repairs of only one trade at a time on a floor. While these assumptions do not provide a realistic representation of the building’s repair sequencing, the series and parallel repair estimates may serve as lower or upper bounds for the expected repair time to achieve full recovery. More importantly, FEMA P-58 does not account for any possible delays prior to the initiation of repairs, for example, contractor mobilization or financing, which can be a significant contribution to a building’s downtime (Comerio, 2006).
REDi downtime model
The REDi guidelines extended the FEMA P-58 methodology and proposed a framework to estimate downtime in individual buildings. The developments include an estimate of the impeding factor delays between the occurrence of an earthquake and the start of repairs (e.g. inspection, financing, and contractor mobilization), as well as estimates of utility disruption (e.g. electrical systems, water systems, etc.). The guidelines identify three post-earthquake recovery states: reoccupancy (i.e. building is safe enough to occupy), functional recovery (i.e. basic building functionality is restored), and full recovery (i.e. building is restored to its pre-earthquake condition). To identify the required repairs to achieve the desired recovery state, a “repair class” is assigned to each component based on its extent of damage.
While the guidelines represent a significant contribution to downtime quantification, there are several limitations, such as conservative reoccupancy criteria, worker allocation, and repair sequencing, which are discussed next. The REDi guidelines use the reoccupancy recovery state to determine whether a building is safe enough to occupy, that is, if it can be used for shelter. However, the structural and non-structural component recovery criteria suggested in Tables 4 and 5 of the REDi guidelines to achieve this recovery state seem overly conservative. According to the guidelines, repairs of almost all structural, plumbing, and heating, ventilation, and air-con (HVAC) components must be completed before a building can be occupied. By contrast, several researchers recommend that sheltering criteria for buildings in a post-disaster setting should consider relaxed habitability standards that allow people to stay in their own home, even if damaged after an earthquake, as long as the building does not pose a life-safety risk (FEMA P-2055, 2019; SPUR, 2012).
To help define the order of repairs to be conducted, the REDi guidelines segregate all non-structural repair activities into groups or repair sequences (RS). The guidelines consider that repair activities begin with the building’s structural components and repair progresses only one floor at a time. The non-structural repair commences only after the entire building’s structural repairs are complete. In contrast with this approach, after the 1994 Northridge earthquake, contractors often repaired several floors simultaneously and performed elevator and staircase repairs in parallel with structural repairs (Terzic and Yoo, 2016). The REDi guidelines are only applicable if the building is deemed repairable after an earthquake and they do not offer any provisions to consider an outcome where excessive residual drifts deem the building irreparable. However, past studies (e.g. Molina Hutt et al., 2019) highlight that considering excessive residual drifts that render a building irreparable can be a significant contribution to downtime because this outcome would require the building to be demolished and rebuilt, resulting in extensive recovery times.
Proposed downtime assessment framework
The proposed downtime estimation procedure is illustrated in Figure 1. The initial steps of the analysis, that is, from seismic hazard assessment to component repair time estimates, are identical to the well-established FEMA P-58 methodology. Therefore, we focus the discussion on components of the framework that are proposed in our study that leverage the damage state predictions and component repair times obtained from the FEMA P-58 analysis to estimate building performance in terms of downtime. This process consists of five sequential steps. The first step in the proposed framework requires evaluating the extent of damage and identifying the post-earthquake usability of the building considering five distinct recovery states immediately after the earthquake: stability, shelter-in-place, reoccupancy, functional recovery, and full recovery. These recovery states are described in detail in the next section. In the second step, we evaluate the impeding factor delays, that is, the various factors that may delay or impede the initiation of repair activities. These activities include the time required for building inspection, securing financing, arranging engineering services, obtaining permits, mobilizing a contractor, and performing repairs to stabilize the structure or the building envelope, that is, mitigation work to minimize aftershock collapse risk and falling debris hazard. In the third step, we estimate the building’s repair time to achieve the desired recovery state, which will depend on the sequence of repairs that will be undertaken and the number of workers. In the fourth step, the delay time and repair time estimates are used to model the building’s temporal recovery trajectory by providing downtime estimates for each story in the building. To account for the various uncertainties within the downtime estimation procedure, the first four steps are performed for thousands of Monte Carlo simulations, resulting in thousands of downtime realizations and recovery trajectories, each having an equal likelihood of occurrence. In the fifth and final step of the framework, the downtime estimates are linked to probabilistic performance measures that support decision-making by building owners, engineers, and policy-makers, namely, robustness and rapidity.
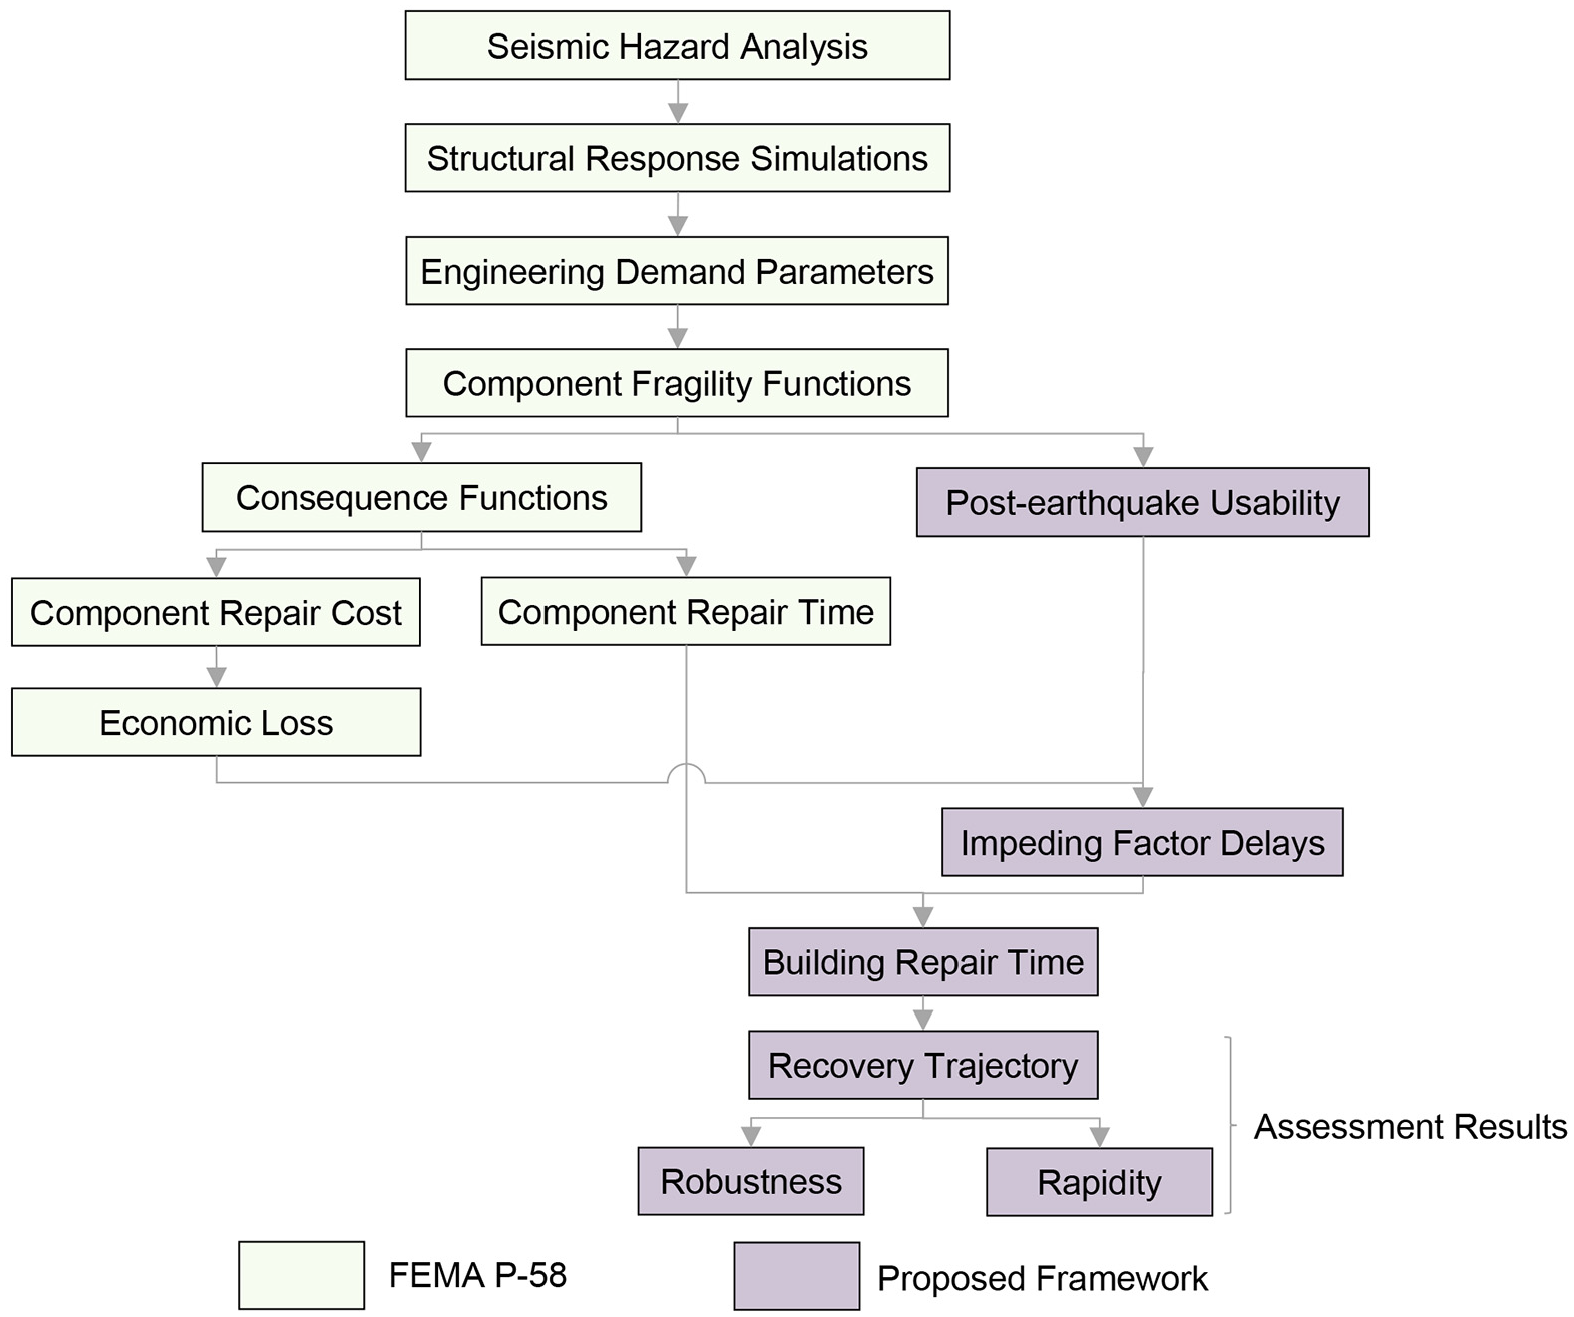
Overview of the proposed downtime assessment methodology.
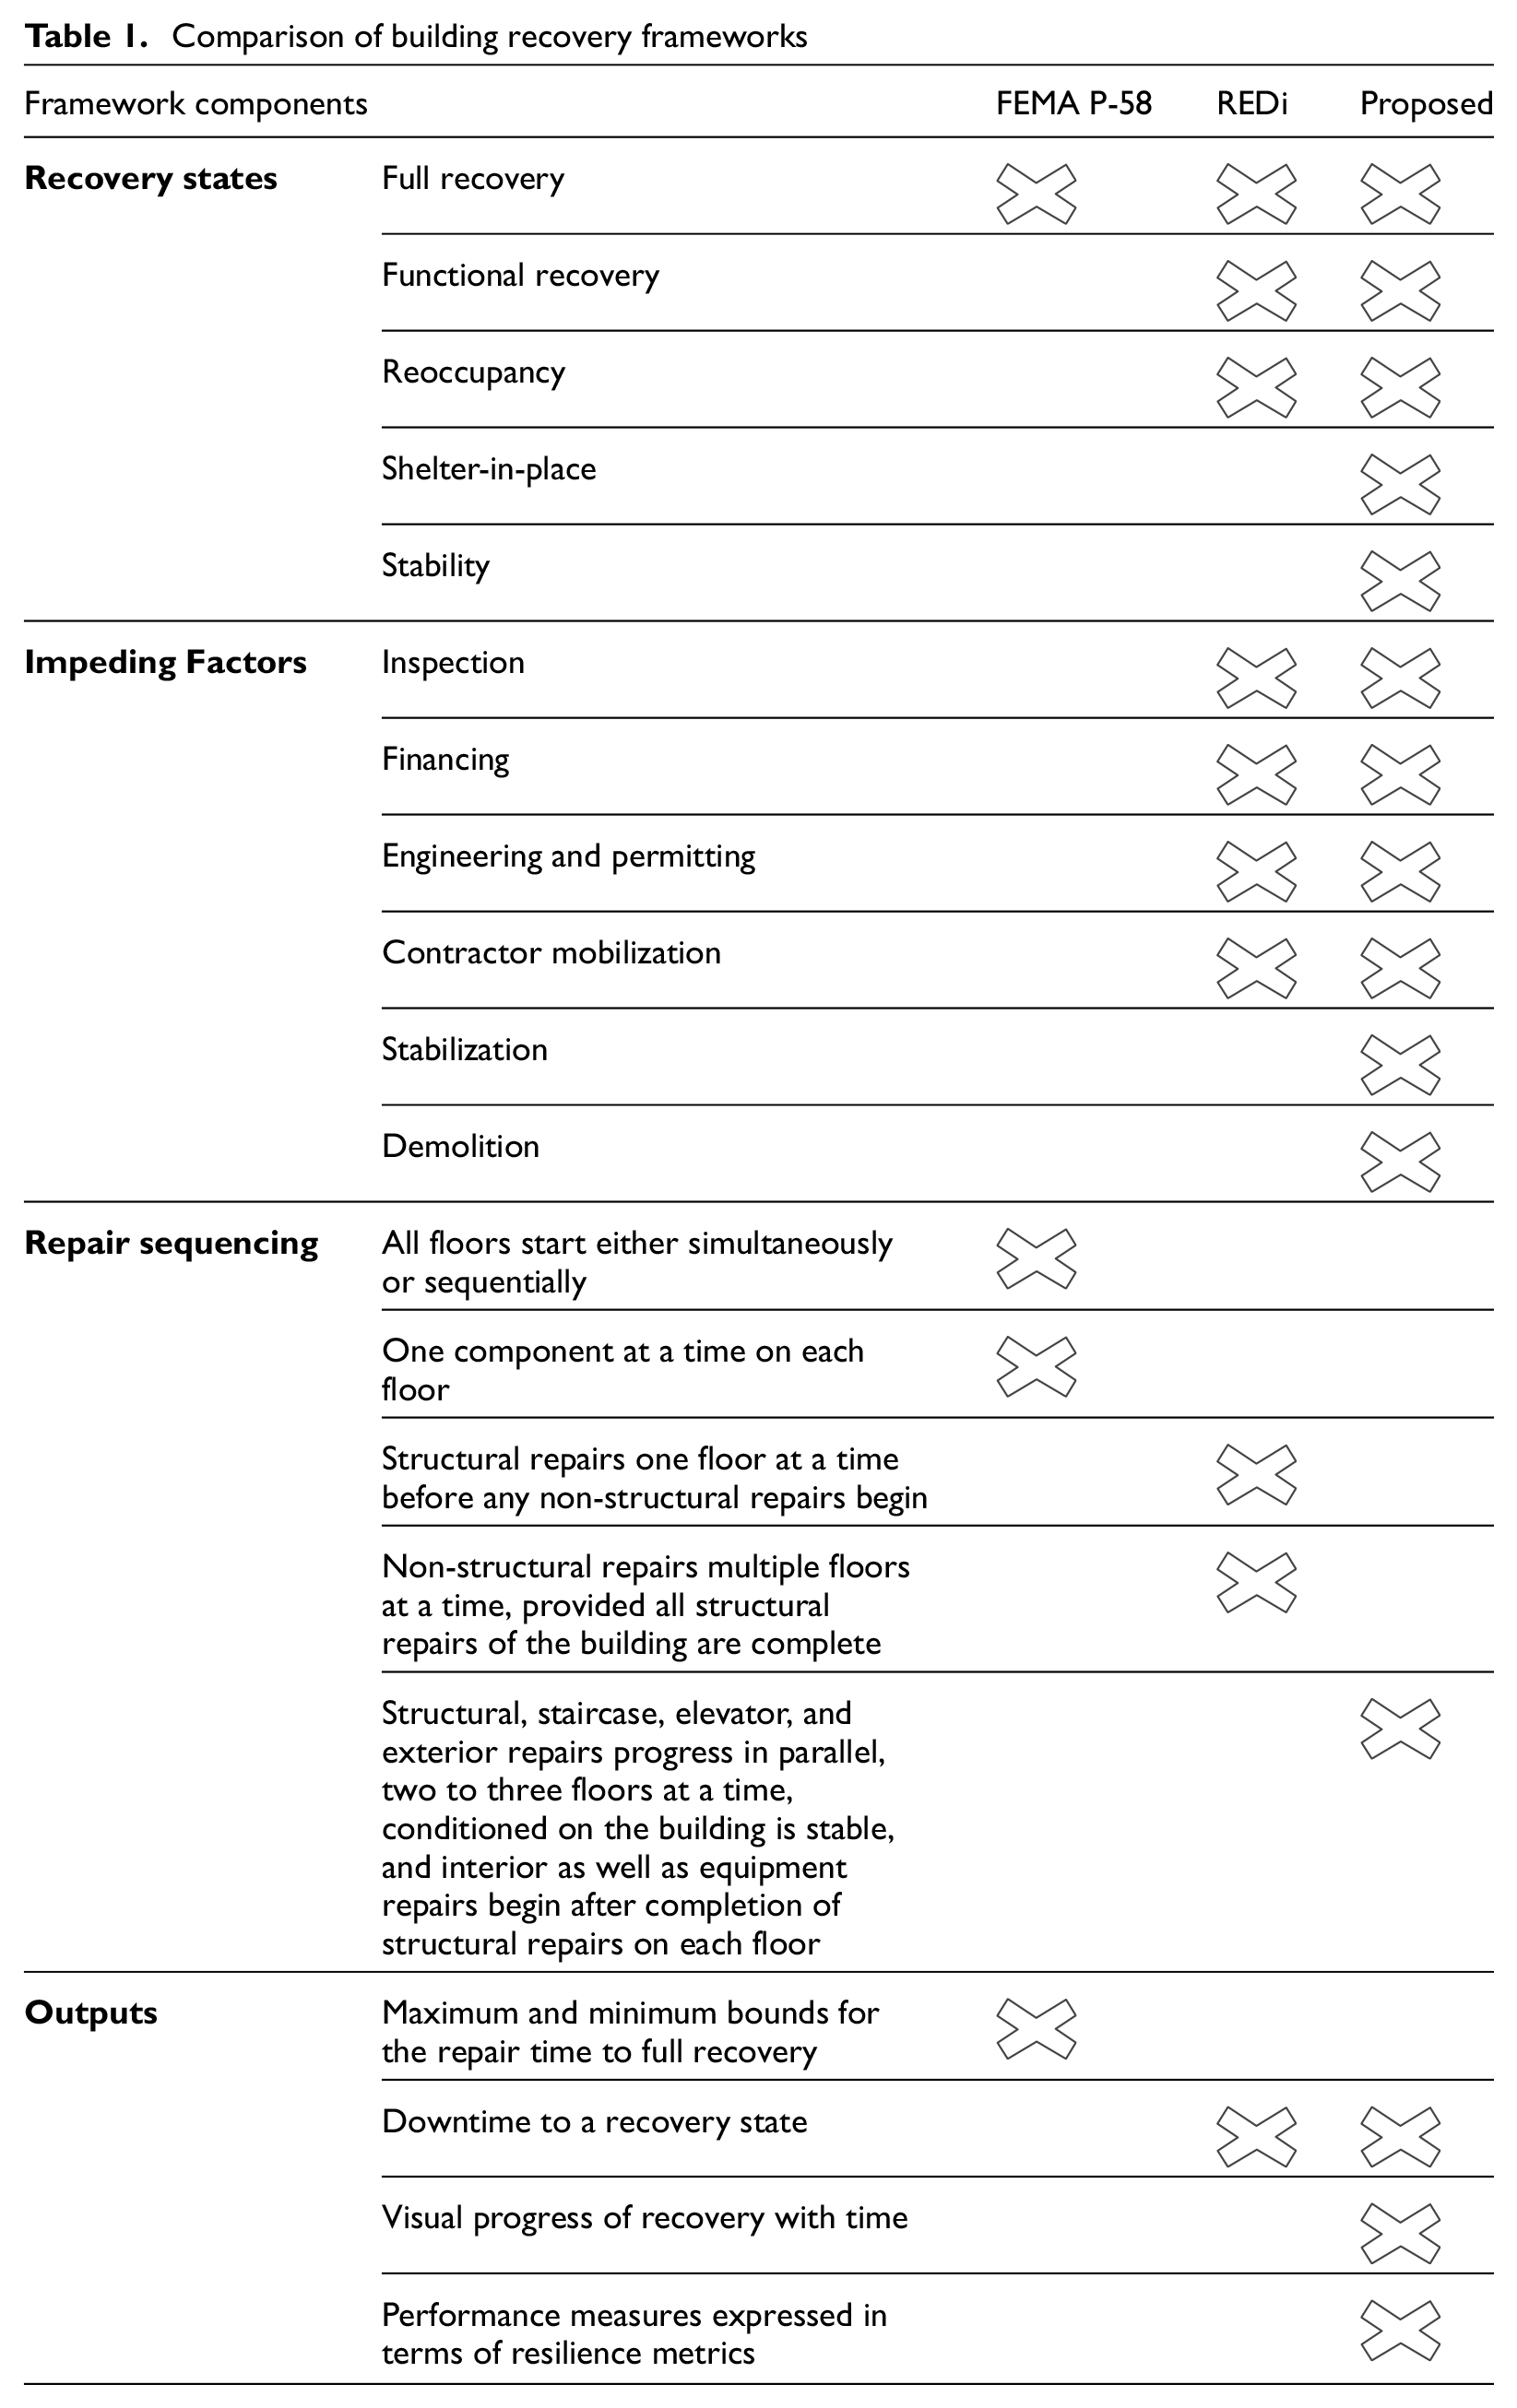
Comparison of building recovery frameworks
While some components of the proposed downtime framework are developed using FEMA P-58 and the REDi guidelines as a basis, we introduce a number of advancements, as summarized in Table 1. Most notably, we introduce two additional recovery states: the “shelter-in-place” recovery state emphasized in SPUR’s (2012) resilient city initiative, and the “stability” recovery state, which describes a post-earthquake condition where a building’s structure and façade are stable enough to eliminate the need for a safety cordon around the damaged building. The impeding factor delays and the repair class concept, used to flag the necessary repairs to achieve a desired recovery state, are largely based on the approach introduced in the REDi guidelines. However, we develop delay estimates for building stabilization, based on past research on rapid post-earthquake repair techniques, and for demolition, based on data from the 2011 Christchurch earthquake (Marquis et al., 2017). We also employ a repair sequencing methodology based on the experience of contractors involved in repairs after the 1994 Northridge earthquake (Terzic and Yoo, 2016). Finally, the framework provides downtime estimates for each story in the building as well as probabilistic measures of the seismic performance of the building in terms of resilience-based metrics, such as robustness and rapidity, which are not explicitly provided by the REDi guidelines or the FEMA P-58 methodology. These and other enhancements are discussed in detail in the next sections.
Comparison of building recovery frameworks
Recovery states and post-earthquake usability
The proposed downtime estimation framework considers five recovery states: stability, shelter-in-place, reoccupancy, functional recovery, and full recovery. Each recovery state represents a milestone in a building’s overall recovery trajectory and is described in detail in the sections that follow. To estimate downtime to achieve each of these recovery states, the framework uses the repair class concept introduced by the REDi guidelines (Almufti and Willford, 2013). Each damage state of each building component in each realization is tagged with a repair class, which serves to identify the recovery state hindered by the damage extent to the component. The post-earthquake usability is determined by identifying the recovery state achieved by the building immediately after the earthquake, before any recovery activities begin. The building condition when each of the recovery states considered is achieved and the associated repair class are shown in Table 2. Components that are damaged to a level that hinders achieving the building condition outlined in the table will need to be repaired before the recovery state can be achieved. To illustrate this concept, consider a reinforced concrete shear wall building. The structure’s slender shear walls are characterized by a fragility function with three distinct damage states. Damage state DS1 represents spalling of the cover with vertical cracks greater than 1/16th of an inch, which is tagged with a repair class RC3 and hinders achieving the reoccupancy recovery state. Damage state DS2 represents exposed longitudinal reinforcing and triggers an unsafe placard per the FEMA P-58 methodology, hence is tagged with a repair class RC4 and hinders achieving the shelter-in-place recovery state. Damage state DS3 represents concrete core damage or buckled/fractured reinforcing. Because this is believed to compromise the load carrying capacity of the member, it is linked to a repair class RC5 and hinders achieving the stability recovery state.
Recovery state, building condition, and repair class, in descending order of criticality
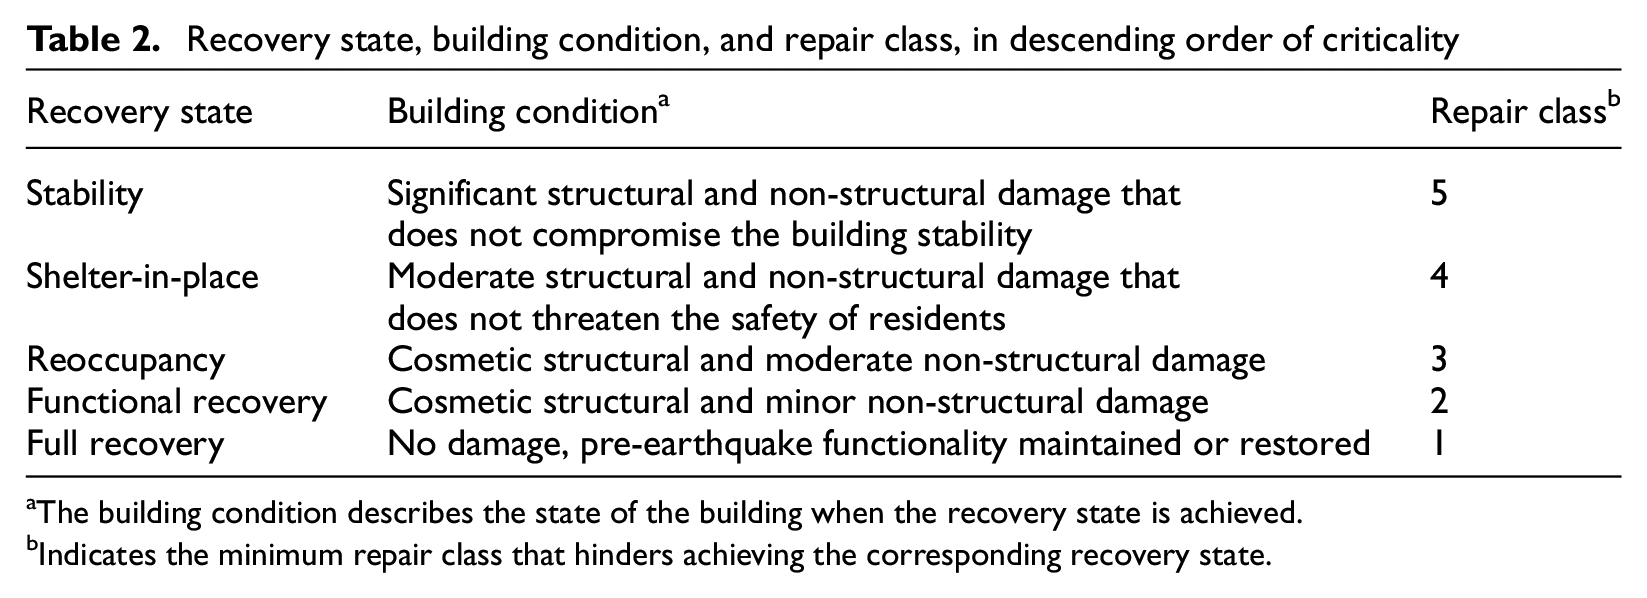
The building condition describes the state of the building when the recovery state is achieved.
Indicates the minimum repair class that hinders achieving the corresponding recovery state.
Within the proposed assessment framework, all component damage linked to a repair class equal to or greater than that associated with the desired recovery state, as indicated in Table 2, must be repaired before the recovery state in question can be achieved, for example, to achieve functional recovery, all components with repair classes RC2, RC3, RC4, and RC5 need to be repaired. If no component damage hinders achieving the desired recovery state, the repair time to the recovery state in question is zero, for example, if the maximum repair class across all structural and non-structural components is RC3, the repair time to shelter-in-place is zero. The basis for allocating a specific repair class to a component’s damage state is discussed in this section, and a comprehensive list of the repair classes associated with each damage state of all building components considered in this study is provided as an Electronic Supplement. However, users can modify these repair class allocations based on their judgment.
Stability
The stability recovery state represents a post-earthquake condition where the building poses negligible aftershock collapse risk or potential for falling debris from the damaged building envelope. It represents a condition in which structural and non-structural component damage may deem the building unsafe for residents to enter, but the building is stable and repairable. If damage exceeds the threshold of this recovery state, the building is considered unstable, a safety cordon around the building will potentially be required, and repairs must be carried out to stabilize the structure and mitigate the risk of falling debris. The proposed framework assumes that repairs to achieve any subsequent recovery states can only be carried out if the building is stable and safe for workers, hence stability is considered as a recovery state, and also as an impeding factor that delays the start of repairs required to achieve less critical recovery states.
Critical structural components in a damage state that may hinder building stability (typically their most severe damage state) are tagged with a repair class RC5. A building is deemed potentially unstable if the damage exceeds either of two criteria. The first criterion relates to structural damage on a story. If more than 50% of the critical structural elements in a performance group, in either direction on a given floor, are in a damage state tagged with RC5, the building is considered unstable. For example, in a reinforced concrete shear wall building, if more than 50% of the shear walls in either direction on a floor are in a damage state tagged with RC5 (i.e. damage state DS3: core concrete damage, buckled or fractured reinforcing, etc.), the building will require repairs to ensure stability. The 50% threshold is consistent with the damage index introduced in FEMA-352 to decide whether a welded steel-moment frame building is unsafe to occupy after an earthquake. The second criterion relates to structural damage throughout the building. If the total quantity of a critical structural elements in either direction, across the entire building, in a damage state associated with RC5, is greater than a predefined threshold, the building is deemed unstable. For example, if the quantity of shear walls, in either direction, in damage state DS3 across all floors is greater than 10% of the total shear walls in the building, the framework assumes that repairs are required to ensure stability of the building. This 10% threshold is based on the trigger for an unsafe placard in FEMA P-58 for the component and damage state under consideration. However, it is adjusted from a performance group basis, that is, similar components at a given floor subjected to the same earthquake demands, to a fragility group basis, that is, similar components across all floors in the building. This adjustment attempts to address the conservatism in assigning unsafe placards in FEMA P-58 as identified by Cook et al. (2021). If the damage levels in the building do not exceed either of these two thresholds, then no repairs are required to achieve the stability recovery state and the repair class of the components tagged with RC5, is reduced to RC4 (if shelter-in-place capacity is hindered) or else to RC3.
Similar to Hulsey (2020), this framework considers that damaged exterior building components, such as parapets, curtain walls, and chimneys, can represent a falling hazard and must be mitigated to ensure the safety of workers and pedestrians around the building. However, unlike severely damage structural components, which are tagged with a repair class RC5 if stability is hindered, the framework performs a separate check to determine whether stability is hindered due to these exterior components. If the quantity of exterior building components in damage states that could lead to a falling hazard is greater than 50% of the total components in the building, then the framework considers that building stability is not achieved.
While failing to achieve this recovery state could trigger a safety cordon around the building, other scenarios could also lead to barricading, for example, total collapse, partial collapse, or excessive residual drifts. Although these other scenarios also imply a loss of stability, they are flagged as irreparable outcomes, and not considered within the stability recovery, which only applies to repairable damage realizations. Furthermore, as this framework evaluates individual building downtime, it does not account for any cordoning delays due to damage to adjacent buildings, but provides a path for these outcomes to be considered in a spatially distributed community-wide recovery model.
Shelter-in-place
SPUR (2012) defines the shelter-in-place recovery state as “a resident’s ability to remain in his or her home while it is being repaired after an earthquake—not just for hours or days after an event, but for [the] months it may take to get back to normal.” The shelter-in-place recovery state represents a post-earthquake condition that considers relaxed habitability standards after an earthquake, that is, it permits significant non-structural damage and some structural damage as long as the safety of the tenants is ensured. However, the assumption of the shelter-in-place recovery state is that repairs are continuously carried out to improve the living conditions of occupants over time (SPUR, 2012).
Damage states that hinder sheltering capacity, but not building stability, are tagged with a repair class RC4. We assume the damage states of the structure and the building’s staircase that trigger an “unsafe” placard per the FEMA P-58 methodology also hinder the shelter-in-place recovery state. The quantity of components in these damage states should not exceed either of the following two criteria, which are similar to those defined previously for the stability recovery state, a story-level, and a building-level threshold. First, if more than 50% of the structural or staircase components on a floor, in any direction, are in the damage state tagged with a repair class RC4, then the building is uninhabitable until repairs are carried out. For example, in a reinforced concrete shear wall building with one steel staircase, if more than 50% of the shear walls in any direction on a floor are in damage state DS2 (exposed longitudinal reinforcing), or if more than 50% of the steel staircase components in any direction on a floor are in damage state DS3 (connection or weld failure), the building will need to be repaired before it can be used for shelter. The second criterion is that if the total quantity of structural or staircase components throughout the building, in the damage state tagged with a repair class RC4, is greater than a predefined threshold, then the building is uninhabitable until repairs are carried out. For example, if more than 25% of the reinforced concrete shear walls in the entire building are in damage state DS2, or if more than 75% of the steel staircase components in the entire building are in damage state DS3, the building will not have sheltering capacity. As discussed previously, these thresholds are consistent with the trigger for an unsafe placard in the FEMA P-58 methodology for the components and damage states under consideration, but are modified from a performance group basis, to a fragility group basis. If the damage levels in the building do not exceed either of these two thresholds, then no repairs are required to achieve the shelter-in-place recovery state, and the repair class of all components originally tagged with RC4 is reduced to RC3.
Damage to exterior facades is not considered to hinder sheltering capacity because the damaged panels can be removed and temporarily covered to prevent water ingress while people shelter in the building (SPUR, 2012). Consistent with downtime assessments by Mar (2021), this framework considers that damage to interior partitions does not hinder the sheltering capacity because people can still shelter-in-place. This framework also assumes that if plumbing is not operational, temporary toilets and clean drinking water will be available at walking distance (SPUR, 2012). We also consider that the building’s fire-protection system need not be functional to allow residents to shelter-in-place. However, this criterion can be adjusted if a fire-watch is not present near the building after the earthquake. Elevators are not required to be functional, and hence elderly or those with reduced mobility might be unable to access higher floors.
It is important to note that the actual decision to re-enter and shelter in a building will also depend on other factors, such as the nature of ownership (owner- or tenant-occupied) and individual choices, which might be unrelated to building damage (SPUR, 2012). While the framework does not account for these externalities, the assumptions can be adjusted to consider additional criteria.
Reoccupancy
The REDi guidelines define reoccupancy as the recovery state “when the building is deemed safe enough to be used for shelter.” Damage states that hinder reoccupancy are tagged with a repair class RC3 per the REDi guidelines. Conceptually, the definition is similar to that of the shelter-in-place recovery state, but the practical implications are different because the reoccupancy recovery state assumptions fail to account for the realities of a post-earthquake context where tenants may accept reduced habitability standards to minimize the risk of displacement. For instance, as outlined in the REDi guidelines, slender shear walls in damage state DS1 (spalling of cover, vertical cracks greater than 1/16th of an inch, but no exposed longitudinal reinforcing), pipe braces, and HVAC ducts in damage state DS1 (1 failure per 1000 ft) or lighting fixtures in any damage state are tagged with a repair class RC3 and need to be repaired before the structure can achieve the reoccupancy recovery state. In this study, the reoccupancy recovery state is only included to highlight the impact of different assumptions related to recovery states that describe when a building is safely habitable.
Functional recovery
Functional recovery is defined as a “post-earthquake state in which [building] capacity is sufficiently maintained or restored to support pre-earthquake functionality” (Earthquake Engineering Research Institute (EERI), 2019). It pertains to a post-earthquake condition where the building is able to carry out its primary function. Damage states that hinder functional recovery are tagged with a repair class RC2 per the REDi guidelines. For example, mechanical equipment, electrical equipment, and elevators in damage state DS1 (equipment not working), or piping in damage state DS1 (one leakage in 1000 ft) are tagged with a repair class RC2 and need to be repaired before the structure achieves functional recovery. In addition to building damage, utility systems (power, water, and gas) need to be functional to achieve functional recovery.
Full recovery
Full recovery is achieved when the building is fully restored to its pre-earthquake condition. Damage states that hinder full recovery are tagged with a repair class RC1 per the REDi guidelines. For example, partition walls in damage state DS1 or DS2 (moderate cracking, screws popping out, etc.), staircases in damage state DS1 (local steel yielding), or reinforced concrete beam-column joints in damage state DS1 (residual cracks of widths less than 0.06 inch) are tagged with a repair class RC1 and need to be repaired before the structure achieves full recovery. Since these repairs are minor and do not hinder building functionality, they are not a priority and can be undertaken at any time following an earthquake (Almufti and Willford, 2013). Hence, the building owner will likely postpone these repairs to a later time, rather than performing them in the immediate aftermath of an earthquake. For this reason, the proposed framework does not explicitly calculate downtime to full recovery for repairable buildings. However, in the event that the building is deemed irreparable after the earthquake, the framework assumes the building will be demolished and rebuilt to its pre-earthquake condition. The building’s recovery state at the end of reconstruction will correspond to full recovery, and thus, the framework estimates the time to full recovery for irreparable buildings. Since tenants will only occupy a new building after its reconstruction is complete, the downtime to other intermediate recovery states is considered equal to that of full recovery.
Impeding factor delays
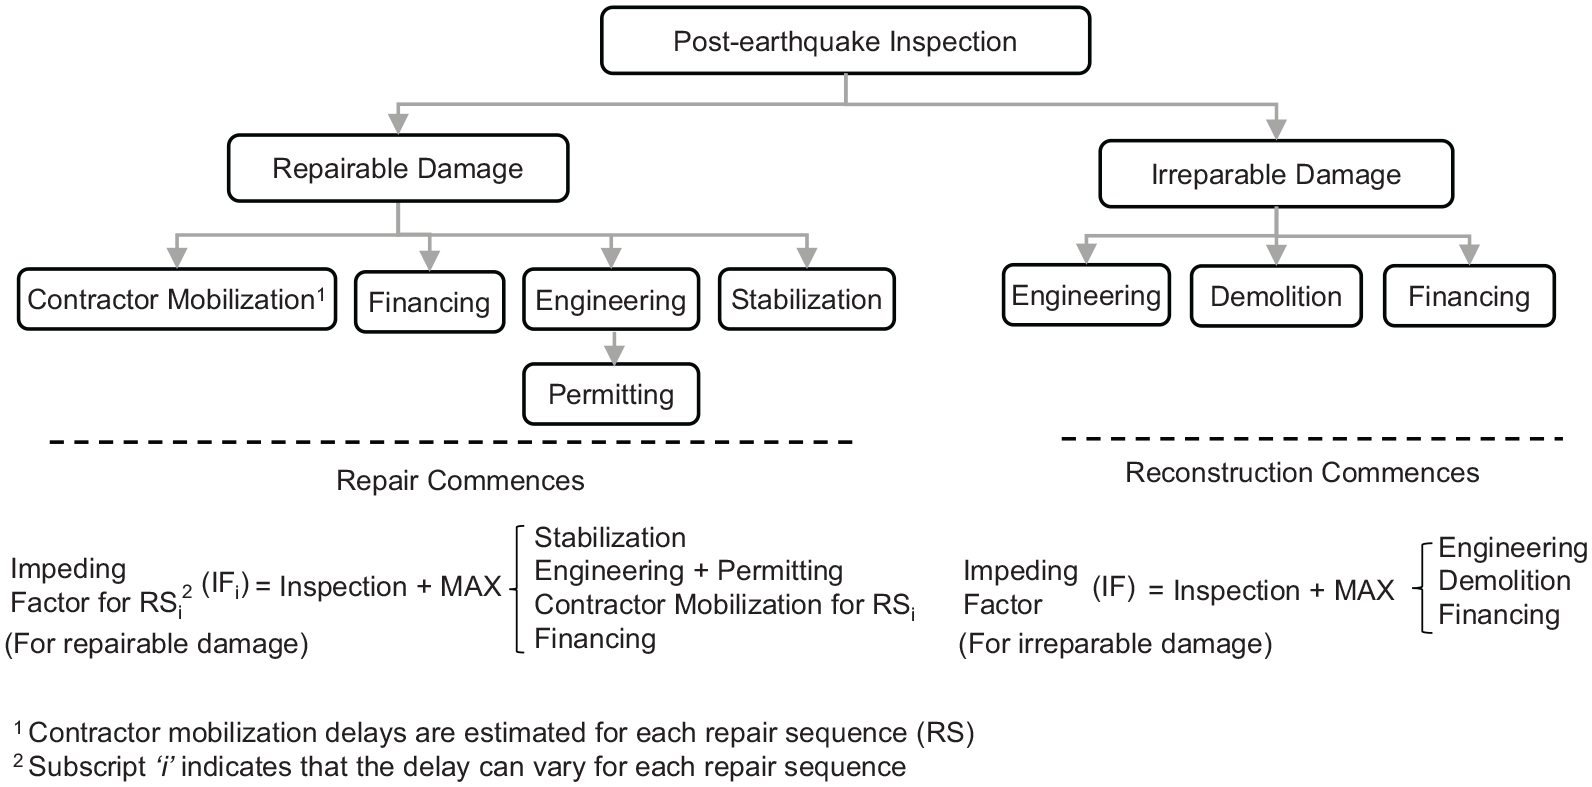
Observations from past earthquakes have shown that several factors delay the start of post-earthquake damage repairs and contribute significantly to a building’s downtime. For example, after the Loma Prieta earthquake in 1989, repairs in some Stanford University buildings were delayed by 4–9 years due to the time required to obtain federal funds and to conform with federal procurement and contracting rules (Comerio, 2006). After the Indian Ocean tsunami in 2006, the demand surge for skilled workers coupled with the difficulty in recruiting construction experts due to the poor post-disaster living conditions prolonged recovery times in Sri Lanka (Bilau et al., 2015). After the Canterbury earthquakes in 2010 and 2011, insurance companies took up to 2 years to settle claims (Marquis, 2015). Comerio (2006) coined the term irrational factors to refer to these delays, which the REDi guidelines later termed “impeding factors” as they unequivocally impede the initiation of repairs. The proposed framework accounts for the following impeding factors: (1) post-earthquake inspection, (2) stabilization, (3) engineering mobilization and review, (4) permitting, (5) contractor mobilization, and (6) financing. The duration of each impeding factor is estimated by sampling the lognormal cumulative distributive functions summarized in Table 3. The delay estimates will be zero if the building experiences no seismic damage, that is, the maximum repair class is equal to zero.
Lognormal cumulative distributive functions to represent impeding factor delay estimates
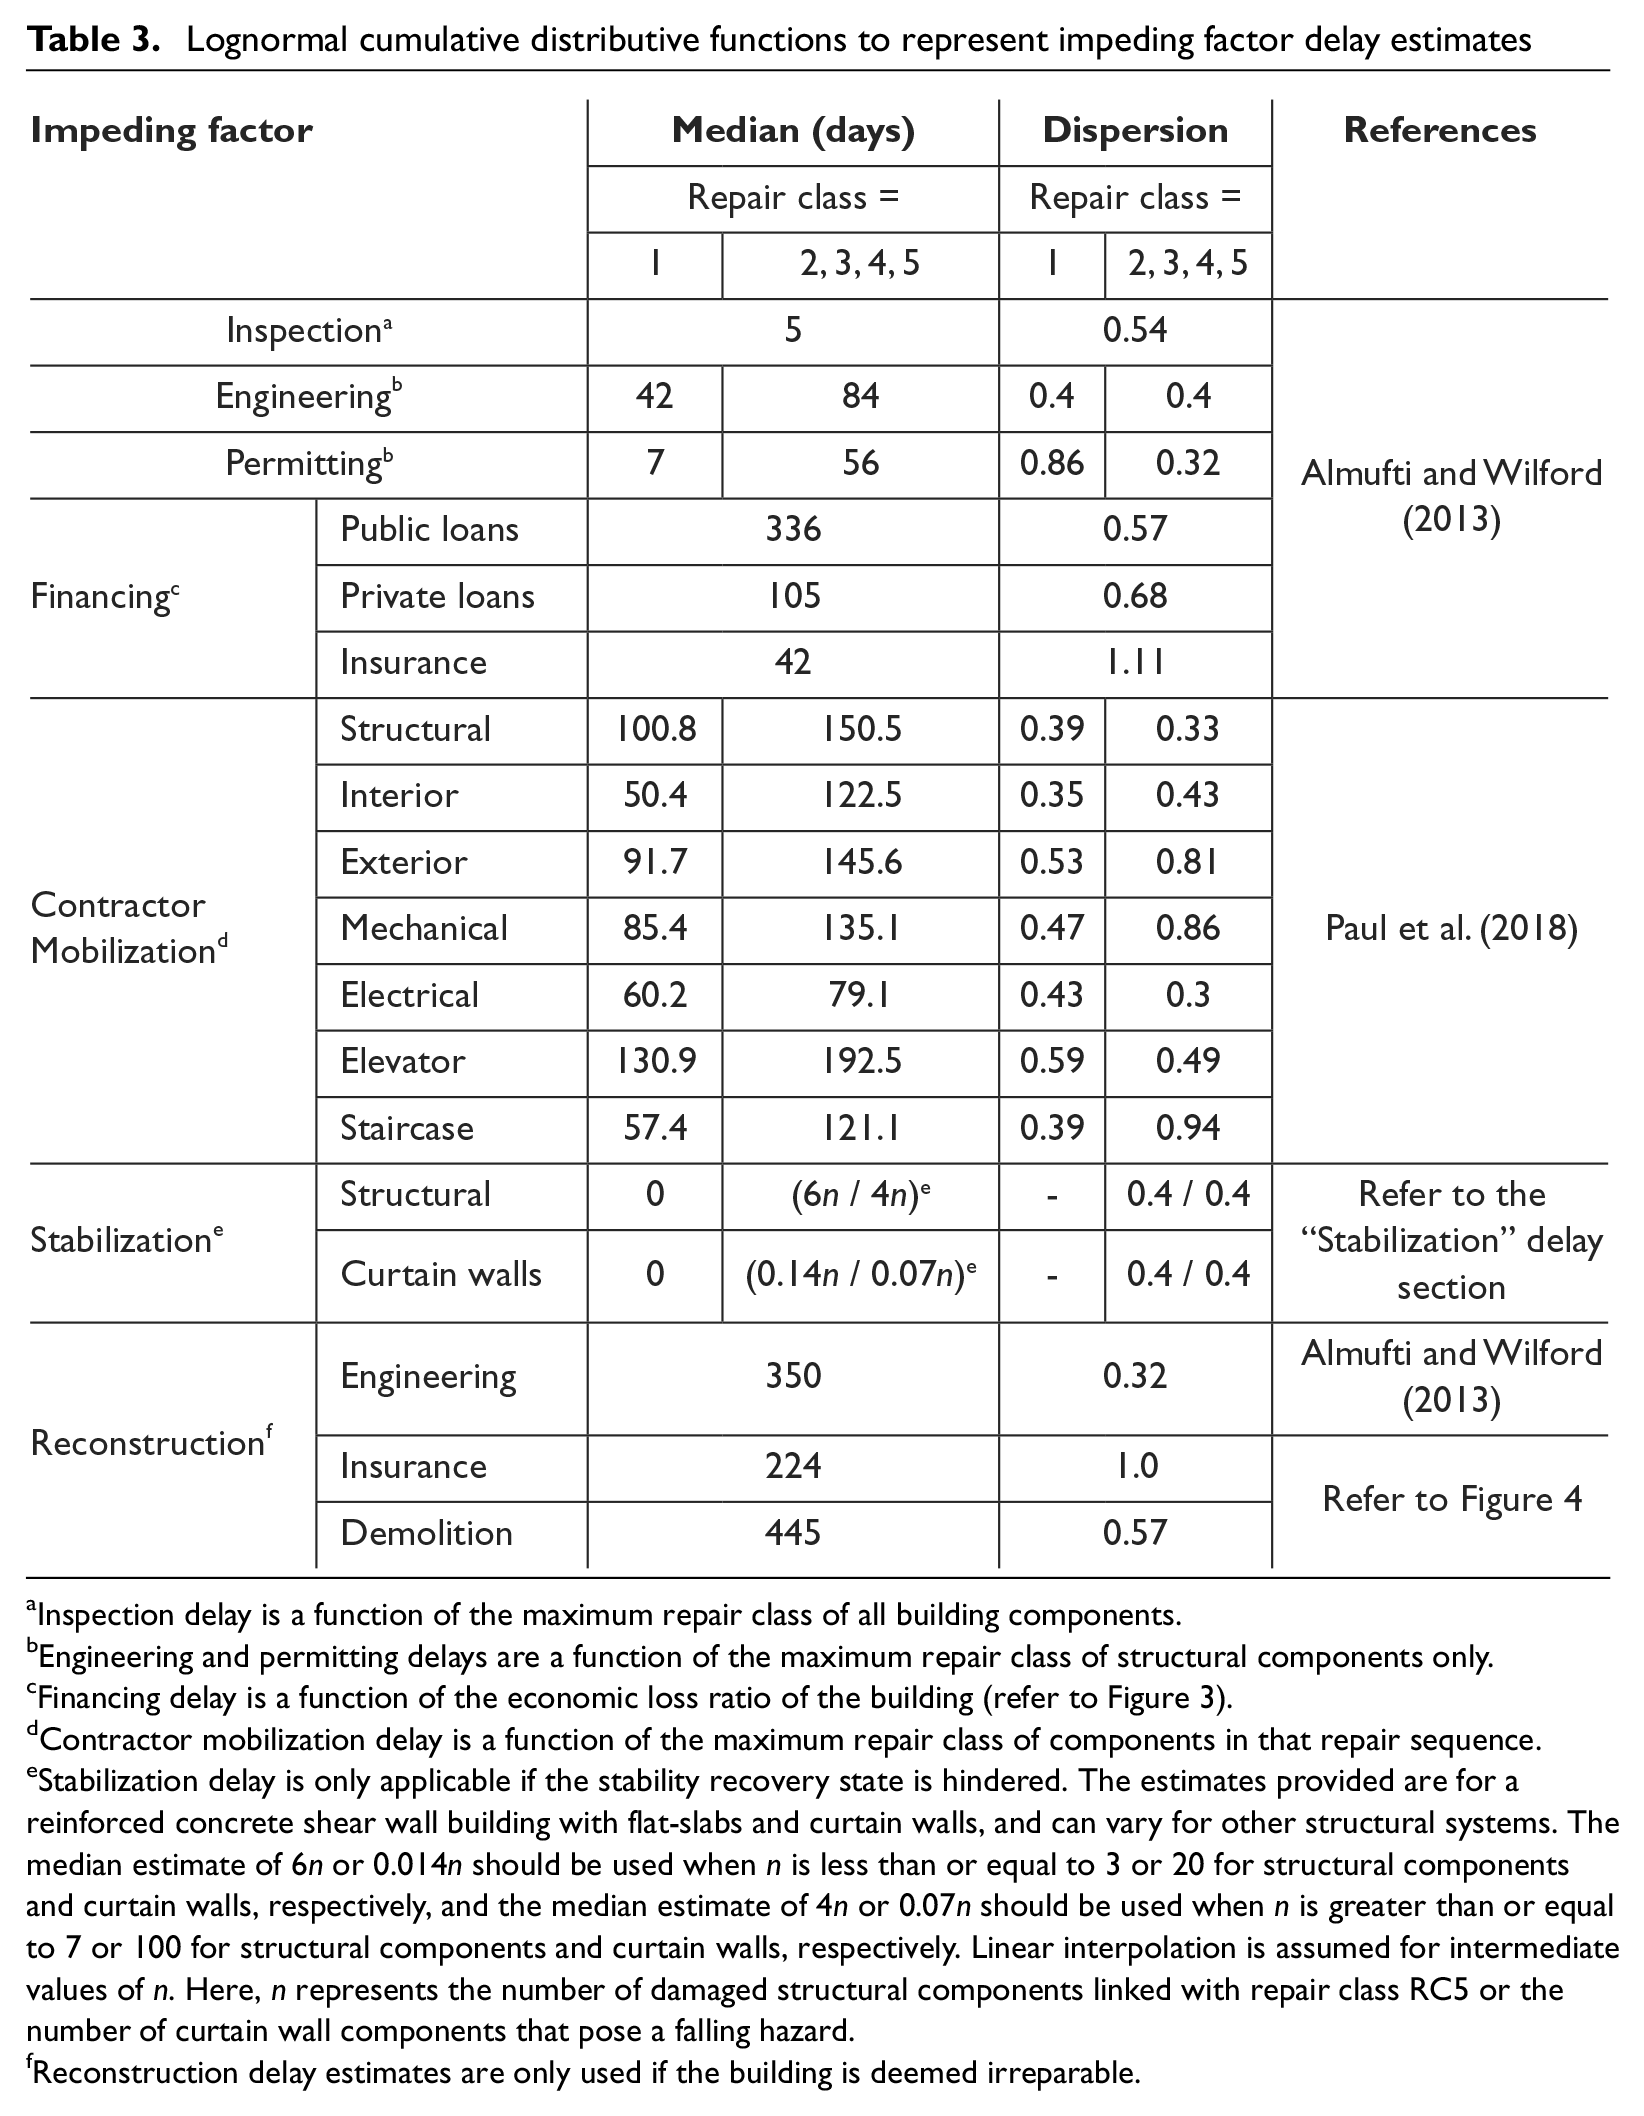
Inspection delay is a function of the maximum repair class of all building components.
Engineering and permitting delays are a function of the maximum repair class of structural components only.
Financing delay is a function of the economic loss ratio of the building (refer to Figure 3).
Contractor mobilization delay is a function of the maximum repair class of components in that repair sequence.
Stabilization delay is only applicable if the stability recovery state is hindered. The estimates provided are for a reinforced concrete shear wall building with flat-slabs and curtain walls, and can vary for other structural systems. The median estimate of 6n or 0.014n should be used when n is less than or equal to 3 or 20 for structural components and curtain walls, respectively, and the median estimate of 4n or 0.07n should be used when n is greater than or equal to 7 or 100 for structural components and curtain walls, respectively. Linear interpolation is assumed for intermediate values of n. Here, n represents the number of damaged structural components linked with repair class RC5 or the number of curtain wall components that pose a falling hazard.
Reconstruction delay estimates are only used if the building is deemed irreparable.
The assumed sequencing of delays in this framework is illustrated in Figure 2. Immediately after an earthquake, the building is inspected to determine the extent of damage. During the inspection, if observed building damage poses a life-safety risk, the building is considered inaccessible until repairs are carried out to stabilize the structure and mitigate the risk of falling debris. Following the inspection, the building owner appoints an engineer, mobilizes contractors, and secures the required funding to carry out repair work. We assume that these activities proceed independently and there is no interaction between them. When applicable, the permitting process begins after engineering drawings are prepared. The governing impeding factor is equal to the longest sequence of delays, as illustrated in Figure 2.
Sequencing of impeding factor delays.
Post-earthquake inspection
The inspection impeding factor represents the time between the earthquake and the conclusion of building inspection. The delay is considered if the maximum repair class of any building component is greater than or equal to RC1. However, if all components have a repair class of zero (i.e. no damage), it is assumed that the owner and/or the tenants will not request an inspection and the building may resume its activity as long as utilities are not disrupted.
Stabilization
The stabilization delay includes the time required to mobilize emergency crews and perform stabilization repairs on severely damaged elements that either hinder the stability of the building or pose a falling hazard to workers and pedestrians around the building. Findings from the 2009 L’Aquila earthquake suggest that these stabilization repairs do not require a detailed analysis of the structure (Dolce, 2010), hence, we assume stabilization repairs, if needed, commence immediately after inspection. Unlike Hulsey (2020) that considers complete repair of structural and exterior curtain wall components in the building’s stabilization time, we only consider the time required to complete stabilization repairs of these components to restore capacity to levels that alleviate the need of a safety cordon around the building.
The duration of these stabilization repairs can be estimated from past studies and can vary depending on the structural system of the building. For example, for the case study building discussed later, that is, a reinforced concrete shear wall building with flat-slabs, the post-earthquake structural damage repair studies by He et al. (2013), Farhey et al. (1995), and Lombard et al. (2000) are used to develop stabilization repair time estimates for structural components. Similar to FEMA P-58, the effect of efficiencies in construction operations is also accounted for in these estimates. We consider a median repair time of 6 days per damaged structural component for repair quantities smaller than three and a median repair time of 4 days for repair quantities greater than seven. The quantity thresholds are consistent with those in FEMA P-58 to account for economies of scale on the repair time of reinforced concrete shear walls. Furthermore, we introduce a dispersion of 0.4 to account for the uncertainty in these estimates. The total stabilization delay time for the building will also depend on the number of worker crews assigned to the temporary repair and should be selected based on the availability of skilled workers after an earthquake. These components that have undergone stabilization repairs will need to be repaired subsequently to achieve their pre-earthquake capacity. The repair time for the subsequent repairs, like all other building components, is estimated from the FEMA P-58’s consequence functions and no reduction in this repair time is considered for components that have undergone stabilization repairs.
For exterior components that pose a falling hazard, the stabilization time only considers the time to remove the damaged components from the building’s façade, and not the time for their repair. For instance, the time to remove each damaged curtain wall panels is estimated as 0.14 days (Kim, 2013; Vahanvaty, 2021). To account for the effect of economies of scale, we consider a median repair time of 0.14 days per damaged curtain wall panel for quantities smaller than 20 and a median repair time of 0.07 days for repair quantities greater than 100. These quantity thresholds are similar to those used in FEMA P-58 to describe the effect of economies of scale on the repair time of curtain wall panels. Since damaged curtain wall panels will typically be removed from the exterior, this work will not interfere with the stabilization repairs for structural components, and the two can proceed simultaneously. More details of the stabilization repair time can be found in the work of Vahanvaty (2021).
Engineering and permitting
The engineering delay accounts for the time required to mobilize a team of engineers to assess structural damage and, if necessary, design a repair intervention. The permitting delay accounts for the time needed by local building officials to review and approve the repair strategy. These delays are only considered if there is structural damage and the length of delay depends on the severity of such damage. The REDi guidelines provide longer delay estimates if structural damage hinders functional recovery (repair class RC2 or higher) than if structural damage hinders only full recovery (repair class RC1). This is because damage that only hinders full recovery is primarily cosmetic and does not require detailed structural calculations (Almufti and Willford, 2013). By contrast, structural damage that hinders functional recovery would require the engineer to prepare a drawing package, and the associated structural calculations, to address the necessary repair interventions. The REDi guidelines consider that these longer delays are independent of the number of damaged components, that is, they are triggered even if a single component experiences damage that hinders functional recovery. For instance, if a single slab-column connection in 1 story within a 12-story building experiences damage that hinders functional recovery, referring to Table 3, this would trigger ∼84 days of impeding time for engineering and ∼56 days for permitting, as opposed to ∼42 days for engineering and ∼7 days for permitting if component damage only hinders full recovery. To address this issue, in this methodology, we propose weighting the expected delays according to the proportion of floors that experience structural damage with repair class RC2 or higher and structural damage with repair class RC1. For example, if a realization resulted in structural components with a maximum repair class of RC3 in half of the floors and maximum repair class of RC1 in the remaining floors, the engineering and permitting impeding factor delays would be equal to the average of the sampled delays for repair classes RC3 and RC1, respectively.
Contractor mobilization
Contractor mobilization delays account for the time required to find available contractors, to complete the bidding process, to procure materials and equipment, and to mobilize the necessary labor force. While the REDi guidelines use a single estimate for all repair sequences, this framework uses the delay estimates provided in the work of Paul et al. (2018) that provide contractor mobilization delay estimates for each RS depending on the severity of damage to components in the RS in question. In this methodology, similar to the engineering and permitting delay estimates, these impeding factors are also weighted according to the ratio of floors that experience damage with repair class RC2 or higher and damage with repair class RC1.
Financing
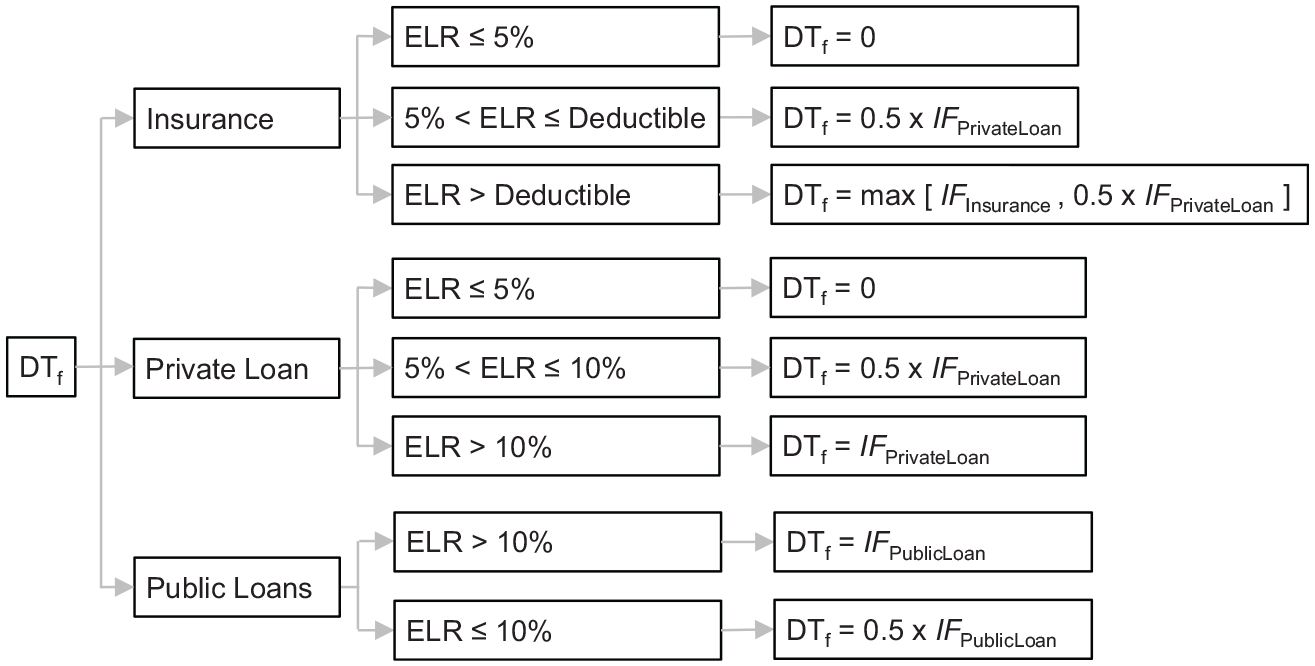
The financing delay accounts for the time required to obtain the funds necessary to carry out repairs. The delay time is a function of the economic loss ratio (repair cost normalized by building replacement cost) and the method of financing, that is, insurance, private loans, or public loans, as outlined in Figure 3. Insurance claims initiate only if the claim is more than the deductible, usually 10%–15% of the insured value (Kreidler, 2018). In this study, we assume buildings that carry insurance do so to their full replacement value and have a deductible of 10%. We also assume the deductible is self-financed if the economic loss ratio is less than 5% (i.e. the financing delay is zero), or otherwise, paid by means of a private loan. The methodology assumes that processing times for private loans and public loans will depend on the size of the loan, that is, smaller loans will be processed faster. The framework considers a 50% reduction in the processing time of private or public loans if the required loan amount is less than 10% of building replacement cost, as outlined in Table 3. If the financing method is unknown, the community’s socioeconomic characteristics can be explored to probabilistically determine the economic status of the building owners, as demonstrated later in the case study. The assumptions made to determine the financing delay are based on the financing algorithm used in the housing recovery framework developed by Costa et al. (2021), where moderate-to-high-income households rely on private loans to fund repairs if the building does not have earthquake insurance or self-finance if the economic loss ratio is less than 5%. Low-income households depend on public loans to finance post-earthquake repairs, hence self-funding is not considered as an option. To simplify the highly complex financing problem, we make several assumptions in our framework. The complexities related to different shareholders of the building coming to an agreement on the post-earthquake financing strategy have not been considered. As more research is conducted to determine the factors that impact the financing delay, and more post-earthquake empirical data are gathered, the financing delay estimates in this framework can be refined.
Financing delays after an earthquake.
Reconstruction delays
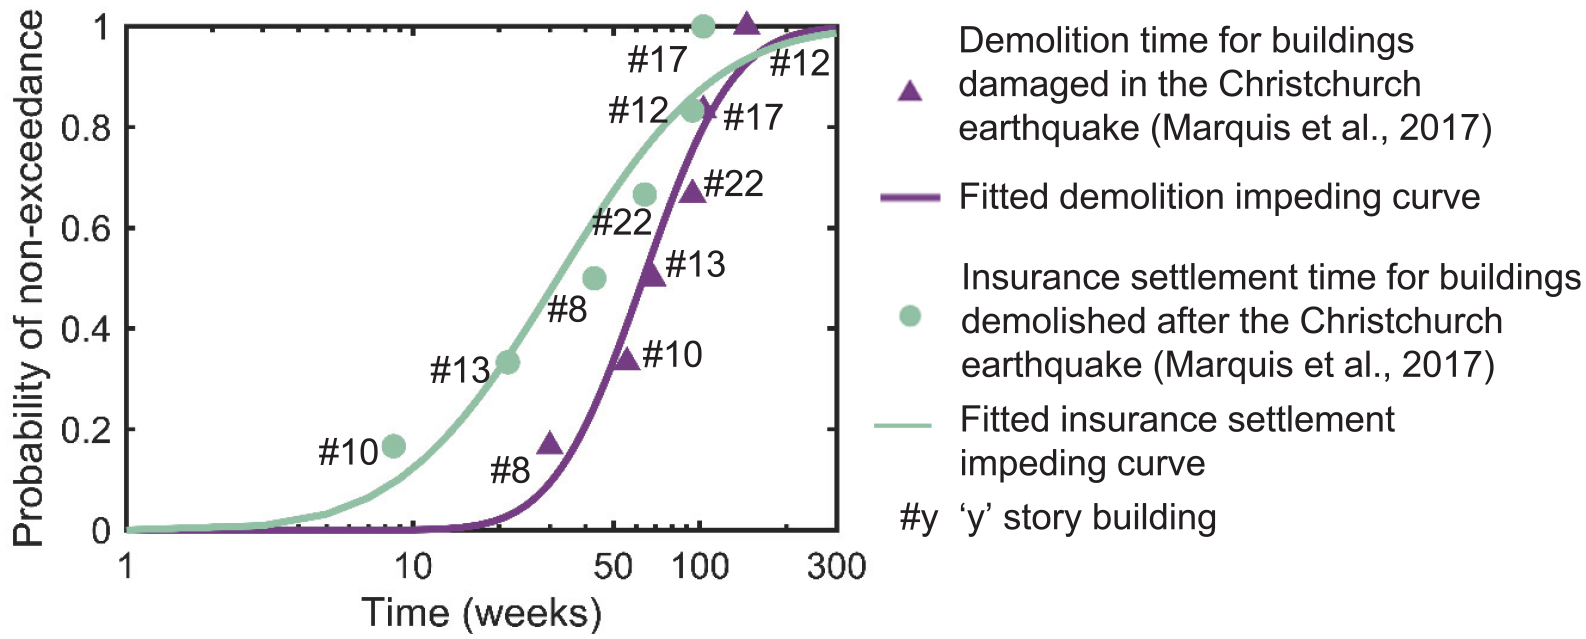
In the event that the building collapses after an earthquake or experiences heavy damage that deems it technically or economically unfeasible for repair, the framework assumes that the building will be demolished and reconstructed to its pre-earthquake condition. The impeding factor delay to initiate reconstruction will be the maximum of engineering, demolition (including contractor mobilization time), and financing. The median and dispersion of the engineering impeding factor delay for a complete re-design, as outlined in Table 3, is consistent with that of the REDi guidelines. The demolition time and financing delay for irreparable buildings are estimated from empirical data. Figure 4 shows the time required for the demolition and financing (via insurance settlements) for six buildings after the 2011 Canterbury earthquake (Marquis et al., 2017). The time required for demolition is calculated from the day of the earthquake to the day building demolition was completed, which includes time for decision-making, contractor mobilization, and the demolition itself. Lognormal cumulative distribution functions are fitted to the available data using the maximum-likelihood approach, as outlined by Baker (2015), to derive the corresponding impeding factor delays. The median of the demolition and financing impeding factor delays are 63.6 and 32 weeks, with a dispersion of 0.57 and 1.0, respectively. The high degree of uncertainty in these delays is primarily due to the paucity of data and can be reduced as more information becomes available. The empirical data in Figure 4 illustrate that the time to complete building demolition is usually longer than the time to settle insurance claims.
Lognormal cumulative distributions to characterize impeding factors delay estimates for reconstruction.
Utility disruption
The proposed framework accounts for the disruption of utilities, such as natural gas, water, and electrical systems when estimating the downtime to functional recovery. Functional recovery cannot be achieved until these utilities are restored, even if the building condition meets the required criteria. The utility repair time is estimated by sampling the lognormal distributions provided in the REDi guidelines. These distributions for natural gas, water, and electrical systems have a median of 10, 4, 3 days and a dispersion of 1.0, 0.55, 1.2, respectively. These short utility restoration times suggest that, although possible, it is unlikely that utility disruption will govern the downtime to functional recovery.
Building repair time
This section describes the worker allocation and repair sequencing procedure used to calculate the building repair time. Referring back to Figure 1, after the impeding factor delays are estimated, the framework evaluates the building repair time to achieve the desired recovery state using the repair class concept previously introduced. The consequence functions of the components tagged with a repair class greater than or equal to that associated with the desired recovery state (refer to Table 2) are used to estimate the component repair time. The building repair time is estimated based on the sequencing of repairs that will be undertaken as well as the workers allocated to each RS.
Key terminology used in the repair sequencing procedure is as follows:
Repair Sequence (RS). This is used to group building repairs into one of seven categories. The first RS, RS1, represents structural repairs. RS2 relates to interior repairs, such as plumbing, HVAC ducts, and partitions. RS3 represents repairs to the building envelope, such as curtain wall glazing. RS4 and RS5 represent mechanical and electrical equipment repairs, respectively. RS6 refers to elevator repairs, and RS7 represents staircase repairs.
Repair path. This consists of one or more repair sequences and serves to define the order of repairs to be conducted in the building. The repairs in each path are independent from one another and can begin and progress in parallel.
Repair phase. Based on observations following past earthquakes, the proposed framework assumes that contractors will repair multiple floors simultaneously as opposed to one floor at a time. Each group of floors that will be repaired simultaneously is referred to as a repair phase.
Worker allocation
The component repair times obtained from the consequence functions in FEMA P-58 express the repair time as the number of worker days (i.e. number of days for a single worker to complete the task assuming 8-h workdays). Since multiple workers will contribute to the repair efforts, the repair time from FEMA P-58 is divided by the number of workers allocated to each component to estimate the appropriate repair time. The proposed methodology allocates workers for the repair of damaged components as a function of (1) the number of damaged units, (2) the floor area, (3) the contractor’s resource limitations, and (4) the restrictions of the site. The number of workers required to repair damaged components is estimated based on the number of damaged units as outlined in the work of Paul et al. (2018). The total number of workers assigned to a repair path on a given floor is limited according to the floor area to avoid congestion of workers (FEMA, 2018) as follows: one worker per 500 square feet of floor area if tenants do not occupy the building during repairs and one worker per 1000 square feet if the building is occupied during repairs. The total number of workers allocated to each RS at any given time across all floors is limited to account for a contractor’s resource limitations after an earthquake as outlined in the work of Paul et al. (2018). Finally, to account for site restrictions, the total number of workers on site at any time across all repair paths is limited based on the gross square footage of the building as outlined in the REDi guidelines. If the number of workers needed exceeds either of these restrictions, then the allocation of workers to the components requiring repairs is reduced proportionally to stay within acceptable limits.
Sequencing of repairs
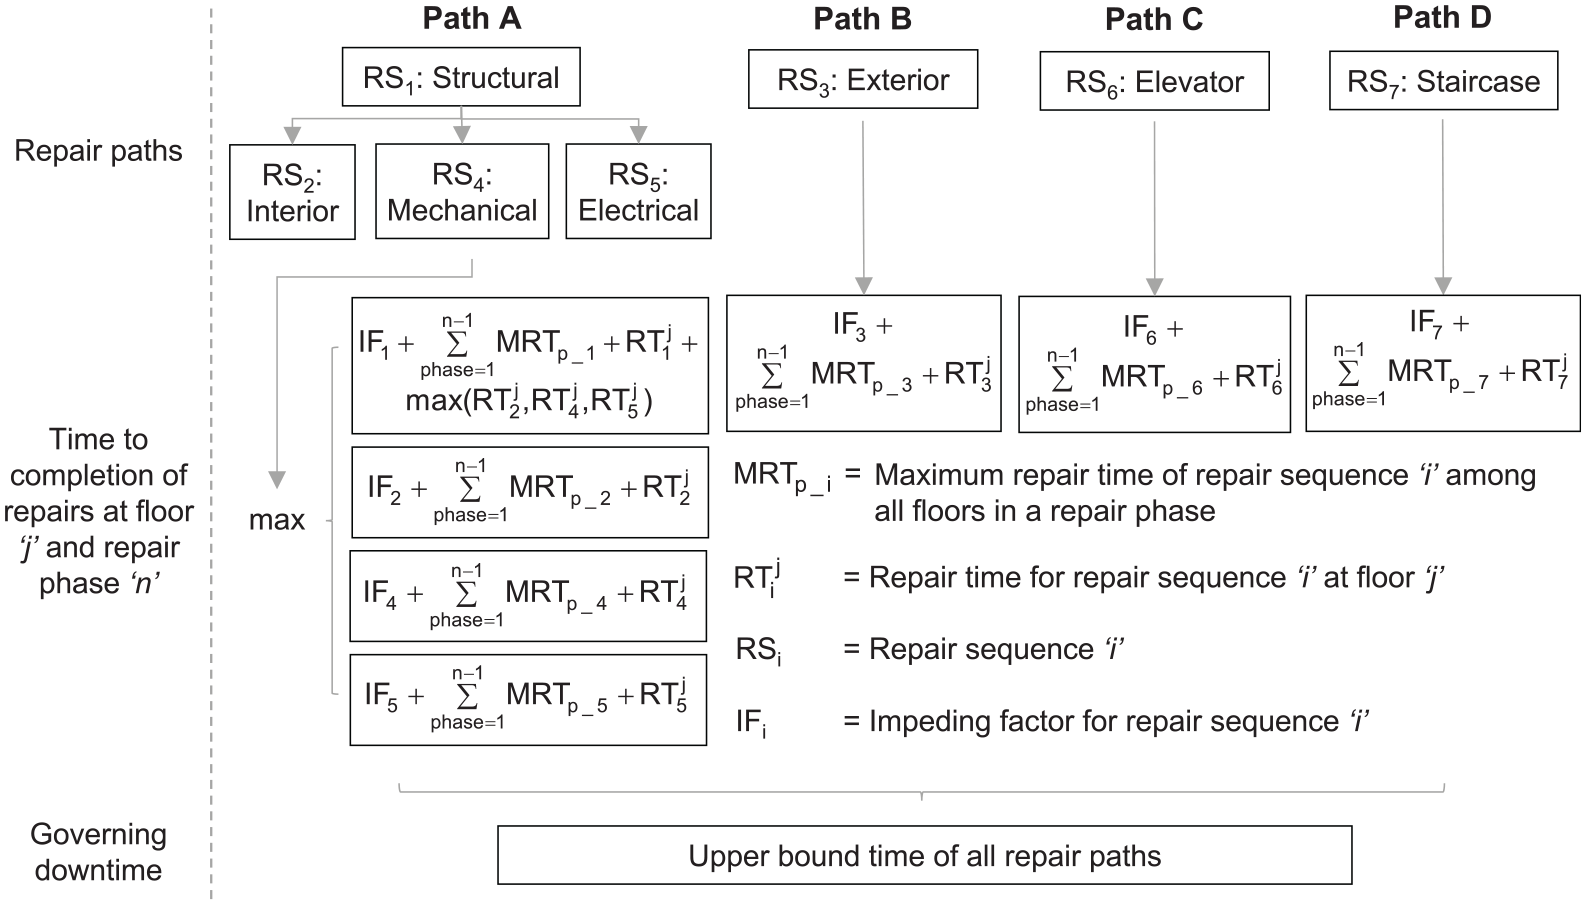
The repair sequencing adopted in this study is informed by interviews with contractors and engineers involved in repairs after the 1994 Northridge earthquake (Terzic and Yoo, 2016). The interviews indicated that contractors performed structural, elevator, and staircase repairs simultaneously in groups of two to three floors, and interior repairs followed immediately after structural repairs on each floor were complete. Based on these observations, the proposed framework assumes that repairs can proceed in four repair paths once building stability is ensured. Repair path A consists of structural repairs (RS1), followed by interior (RS2) and equipment repairs (RS4 and RS5) on each floor. Repair path B represents exterior repairs (RS3). Repair paths C and D represent elevator (RS6) and staircase (RS7) repairs, respectively. These four repair paths are illustrated in Figure 5. Repairs in path A generally occur throughout the interior of the floor, whereas repairs in path B occur along the perimeter of the building. Repairs in paths C and D occur at select locations within the floor. It is assumed that workers in repair path A can make accommodations around these select locations. Thus, the framework assumes that the four repair paths can proceed in parallel. The framework also assumes that floors are repaired in groups of three floors, starting from the lowermost floor.
Sequencing of repairs and downtime estimation for each realization.
To determine the building repair time, the first task is to estimate the time to completion of repairs in each RS and each floor. Since all floors within a phase are repaired simultaneously, the repair time of each RS in a given phase is equal to the maximum repair time in each sequence among all floors in that phase. Thus, the time to complete repairs for repair sequence i (RSi) on floor j, which is part of repair phase n, is the sum of (1) impeding factor delays for RSi, (2) the sum of repair times for RSi in each phase from 1 to n–1, and (3) the repair time of RSi on floor j.
Next, the time to complete repairs in each repair path is estimated. In repair path A, interior and equipment repairs start only after structural repairs on each floor are completed. Therefore, the time to complete repairs for path A is calculated as the maximum of (1) the time to completion of structural repairs (RS1) in previous repair phases and on floor j including the corresponding impeding factor delays, plus the maximum repair time of interior repairs (RS2), mechanical equipment repairs (RS4), and electrical equipment repairs (RS5) on floor j; (2) the time to completion of interior repairs (RS2) in previous repair phases and on floor j, including the corresponding impeding factor delays; (3) the time to completion of mechanical equipment repairs (RS4) in previous repair phases and on floor j, including the corresponding impeding factor delays; or (4) the time to completion of electrical equipment repairs (RS5) in previous repair phases and on floor j including the corresponding impeding factor delays. This calculation is required because each RS within repair path A has a unique contractor mobilization time as part of the impeding factor delay estimates. Since the repair paths B, C, and D consist of one RS each (RS3, RS6, and RS7, respectively), the time to completion of each repair path is equal to the time to completion of the corresponding RS. The calculation methodology is illustrated in Figure 5.
The methodology calculates four recovery trajectories, one per repair path. Each recovery trajectory provides a floor-wise recovery time for each repair path. The governing trajectory for the realization is computed as the upper bound time of the four individual trajectories and need not represent any single repair path. This governing trajectory gives us the downtime of the building to achieve the desired recovery state. The details of the calculations are illustrated later in the case study.
The repair sequencing process is repeated for thousands of Monte Carlo realizations and produces a governing recovery trajectory for each realization. The median and xth percentile trajectory is calculated after sorting all trajectories with respect to their end (total) downtime, that is, the time at which the building fully achieves the desired recovery state. If an even number of Monte Carlo simulations is used in the analysis, the median downtime is taken as the greater of the middle two downtime estimates to ensure that every stepping function reported represents a plausible outcome. In the event of irreparable damage or collapse, downtime is taken as the building replacement time, considering demolition and reconstruction. The reconstruction time is assumed to take 2 weeks per floor, but can be adjusted based on the degree of complexity of the building, as well as other region-specific constraints.
Assessment results
The proposed framework permits calculating the following outputs and resilience-based metrics: (1) the recovery trajectory of the building showing the progress of building restoration, or reconstruction, over time, (2) the robustness, or “the ability [of the building] to withstand a given level of stress or demand without suffering degradation or loss of function” (Bruneau et al., 2003), (3) the rapidity, or “the capacity to meet priorities and achieve goals in a timely manner to contain losses and avoid future disruption” (Bruneau et al., 2003), and (4) the downtime disaggregation to help prioritize design or retrofit interventions to minimize downtime. While the terms “robustness” and “rapidity” are frequently used to measure the seismic resilience of communities, in this article, the terms measure seismic performance of individual buildings. To best illustrate the implementation of the methodology and its assessment results, this section outlines the post-earthquake downtime assessment of a case study building.
Case study building
The case study building consists of a modern 12-story residential reinforced concrete shear wall building located in Seattle, WA. The building has a floor dimension of 30.5 m long by 30.5 m wide (100 × 100 ft) in the 12 levels above grade, as seen in Figure 6, and 48.8 m long by 48.8 m wide (160 × 160 ft) in the four basement levels. The lateral force resisting system consists of two C-shaped symmetrical reinforced concrete core walls, coupled in one direction, and cantilevered in the other. The structural design and relevant analyses for this reference building were performed by Marafi et al. (2020) to meet the minimum code-prescriptive requirements of ASCE 7-16 (American Society of Civil Engineers (ASCE) 7, 2016). The building’s seismic performance is assessed at five intensity levels using the multiple stripe analysis procedure. The intensity stripes have return periods of 100, 475, 975, 2475, and 4975 years. At each intensity level, 100 ground motion records of crustal, interface, and intraslab earthquakes are selected at each intensity level in proportion to their contribution to the total hazard, as determined per the 2014 National Seismic Hazard Model. Because the nonlinear simulation of structural response was performed using 2D models in the cantilevered direction of the reinforced concrete shear wall building, we assume equal demand parameters in the coupled and cantilevered directions. Consequently, we also assume the same structural component quantities in both orthogonal building directions.
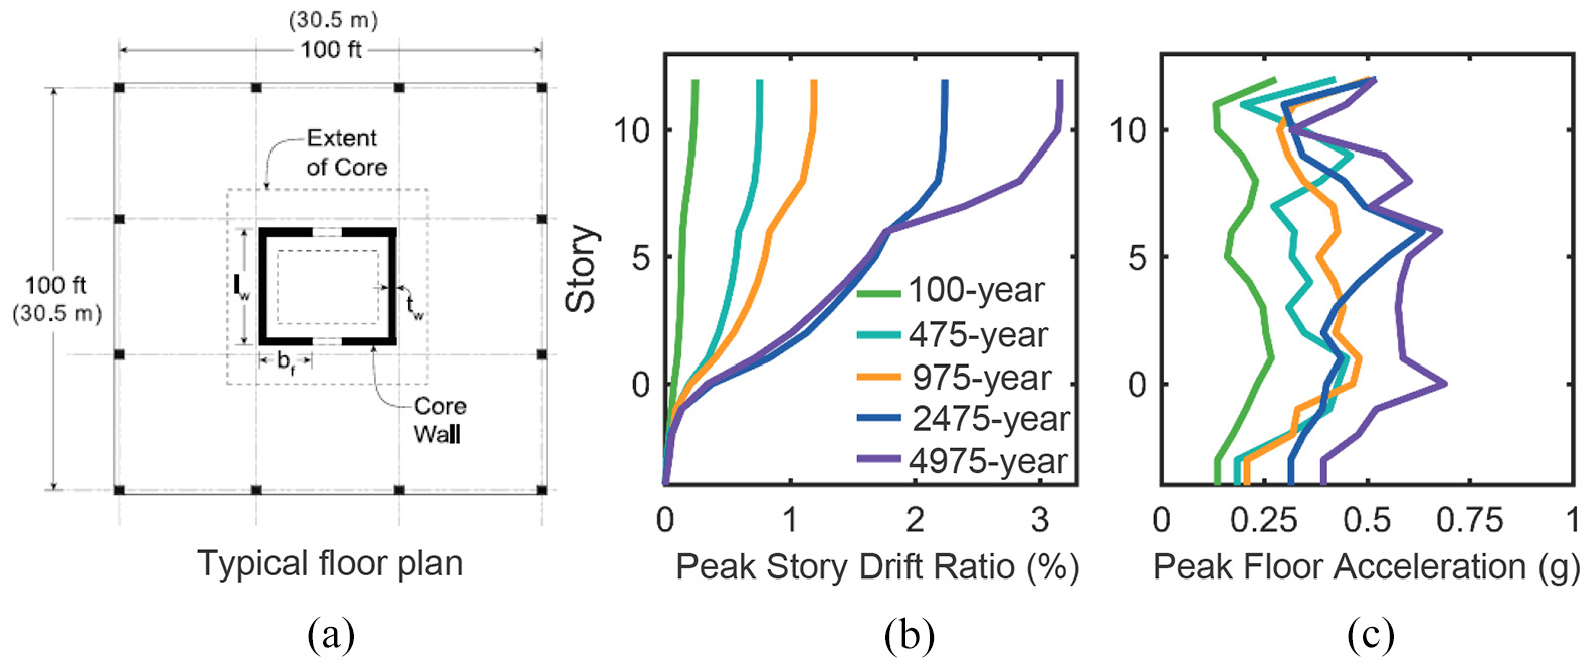
(a) Typical floor plan for stories above grade, (b) median peak story drift ratios, and(c) median peak floor accelerations of the case study building subjected to five intensity levels asderived from the 2014 National Seismic Hazard Model.
The fundamental period of the building is 2.7 s. The median peak story drift ratios and median peak floor accelerations from the structural analyses of the building for each intensity level considered are shown in Figure 6. More details regarding the seismic hazard, the building analyses, and design requirements are provided in the work of Marafi et al. (2020).
The building performance model for the 12-story building was initially created by Kourehpaz et al. (2021) to assess the earthquake-induced direct economic losses of reinforced concrete shear wall buildings. Kourehpaz et al. (2021) provide a comprehensive list of the structural and non-structural component quantities, unique fragility identifiers, and assumptions used in creating the building performance model. The model was initially developed by Kourehpaz et al. (2021) using HBRisk’s Seismic Performance Prediction Program (SP3, 2019), a software that implements the FEMA P-58 methodology. However, a detailed breakdown of the data required by the proposed downtime assessment framework was not readily available through the SP3 user interface. Therefore, for this study, we re-created the building performance model in PELICUN, an open-source python-based loss estimation tool (Zsarnoczay and Kourehpaz, 2021), using the same assumptions outlined in the work of Kourehpaz et al. (2021). At each intensity level, we perform 2000 Monte Carlo simulations to account for the uncertainties affecting the building’s seismic performance. In addition to instances of repairable seismic damage, collapse realizations and non-collapse irreparable damage instances were also considered in the assessment. Decisions to deem a building irreparable are currently based on FEMA P-58 criteria, which account for excessive residual drifts. Nevertheless, the framework permits developing additional criteria to determine irreparable damage, for example, exceedance of predefined economic loss or recovery time thresholds.
The proposed downtime estimation framework requires the following input datasets: (1) repair time matrix, (2) repair cost matrix, (3) repair class database, (4) damage state matrix, (5) repair class matrix, and (6) damage summary matrix. The repair time and repair cost matrices consist of the repair time and repair cost, respectively, of each building component in each floor and realization. These two matrices are obtained directly from PELICUN, as they consist of direct outputs of the FEMA P-58 assessment. The repair class database contains, for each component, an RS flag, the repair class triggered by each damage state, the total quantity of the component in the building, and relevant information from the FEMA P-58 fragility database. The damage state matrix provides the quantity of components in each damage state, in each floor and realization, and is also available as a PELICUN output. This information is used along with the repair class database to calculate the repair class matrix, which summarizes the repair class of every component in the building for all realizations. The damage summary matrix indicates if the building is repairable or irreparable in each realization. Detailed instructions on how to compile the necessary datasets and their use in the downtime assessment framework are available in the Electronic Supplement and can also be found in the work of Molina Hutt (2017).
Financing assumptions
For this case study building, we consider that the source of financing the repairs is unknown. Hence, we study the city’s socioeconomic characteristics to determine the probable funding source. We assume that the case-study building is part of strata housing, that is, units are owned individually and common areas and the overall building structure are owned collectively. Therefore, owners would fund the necessary repairs. As discussed earlier, to determine the probable funding source, we assume that low-income households will depend on public loan for repairs and moderate-to-high-income households will depend on insurance or public loans for repairs. The proportion of low-income households encompasses 11% of the city of Seattle’s population (United States Census Bureau (USCB), 2019). The total population of Seattle indicated in this census is 753,675 persons, translating to 83,733 persons with low income. The median persons per household is 2.11 and the total number of households is 331,836 (USCB, 2019), thus giving us approximately 12% of households in Seattle that are in the low-income category. Assuming all occupants in an apartment building belong to similar financial backgrounds, the percentage of buildings with low-income tenants is approximately 12%. The framework thus considers that 12% of the realizations will be financed by public loans. The insurance commissioner of Washington state’s report indicates that approximately 16% of the residential insurance policies in King County (county of the city of Seattle) have earthquake coverage (Kreidler, 2018). Assuming all multi-family apartment buildings have general insurance, 16% of the realizations are considered to be financed by insurance. The residential earthquake insurance deductible is reported as 10% of the insured value (Kreidler, 2018). The framework considers that the remaining 72% of the realizations that are not financed by insurance or public loans will depend on private loans for financing post-earthquake repairs. While these assumptions may not be representative of any one building, this approach is adopted in the case study building to illustrate the range of possible assumptions related to post-earthquake financing of repairs.
Recovery trajectory
The building recovery trajectory describes the building’s usability at any instant in time after the earthquake as illustrated in Figure 7. Building usability ranges from 0% to 100%, where 100% signifies that all floors in the building have achieved the desired recovery state, and 0% signifies that none have. Each floor above grade has an equal contribution to building usability. This means that if repairs in the first story to achieve the desired recovery state are completed in a five-story building, the building usability is 20%, and when repairs in the second floor are also completed, the building usability is 40% and so on. A conceptual recovery trajectory for a five-story repairable building is shown in Figure 7a. In Figure 7a, we assume that all floors in the building are damaged in the earthquake, hence the building’s usability drops to zero. The usability remains at zero until the impeding factors delays are resolved. Once the contractor commences the necessary repair work, the trajectory increases a step when the repairs that hinder achieving the desired recovery on any given floor are completed. In this hypothetical scenario shown in Figure 7a, trajectory increases a step when repairs in each floor are completed, rather than when repairs in each repair phase are completed. This is because the repair time on any floor j is always assumed to be greater than that of the floor j–1. However, if within a repair phase, the repair time of a floor j is lower than that of floor j–1, then the repairs to floor j would be completed by the time repairs in floor j–1 are completed. Hence, building usability would jump to that of floor j directly. This is observed later in Figure 8. If damage is concentrated on the higher floors, and no repairs in the lower floors are required, the building usability increases immediately after inspection up to the floor where repairs are required. If any realization results in building collapse or irreparable damage due to excessive residual drifts, the recovery trajectory is characterized by a single step function, from 0% to 100%, at the building replacement time, as shown in Figure 7b. The building replacement time accounts for demolition, which we consider as an impeding factor, and reconstruction time.
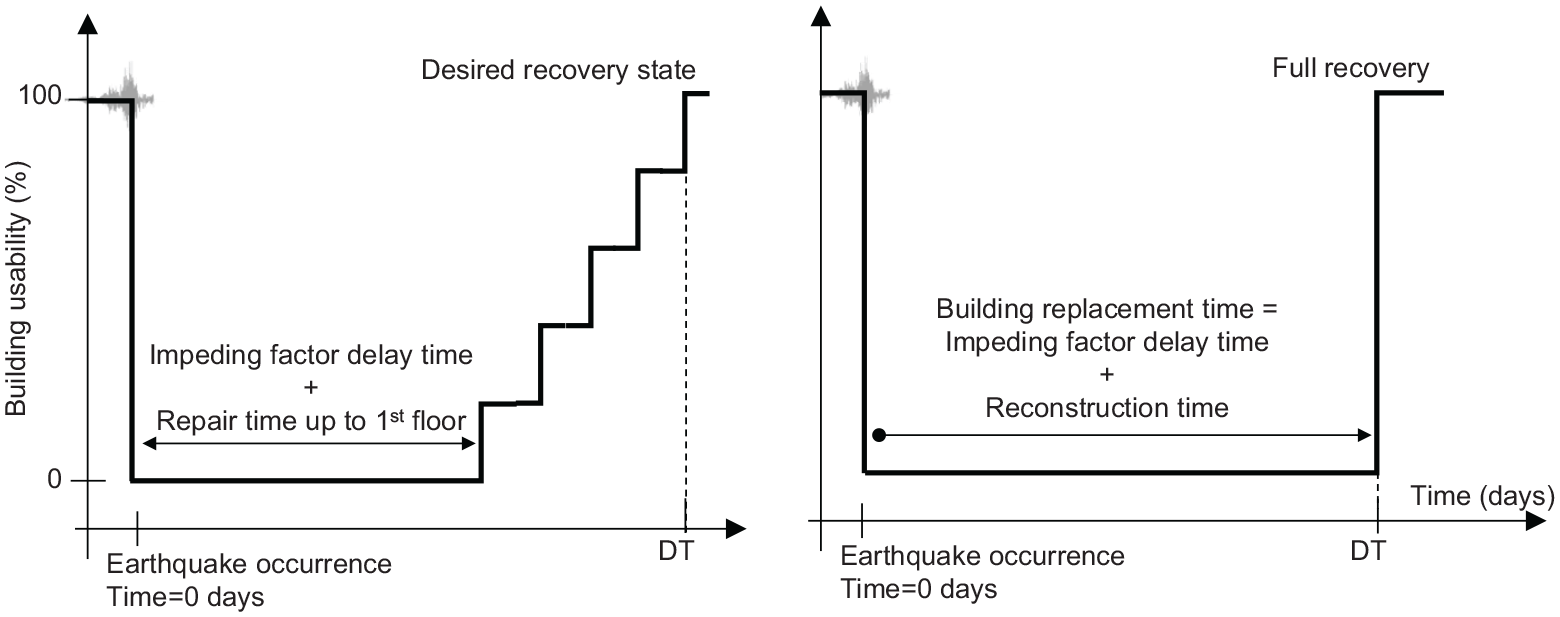
Conceptual illustration of the recovery path for (a) repairable and (b) irreparable building, where DT denotes the downtime at the top floor to achieve the desired recovery state.
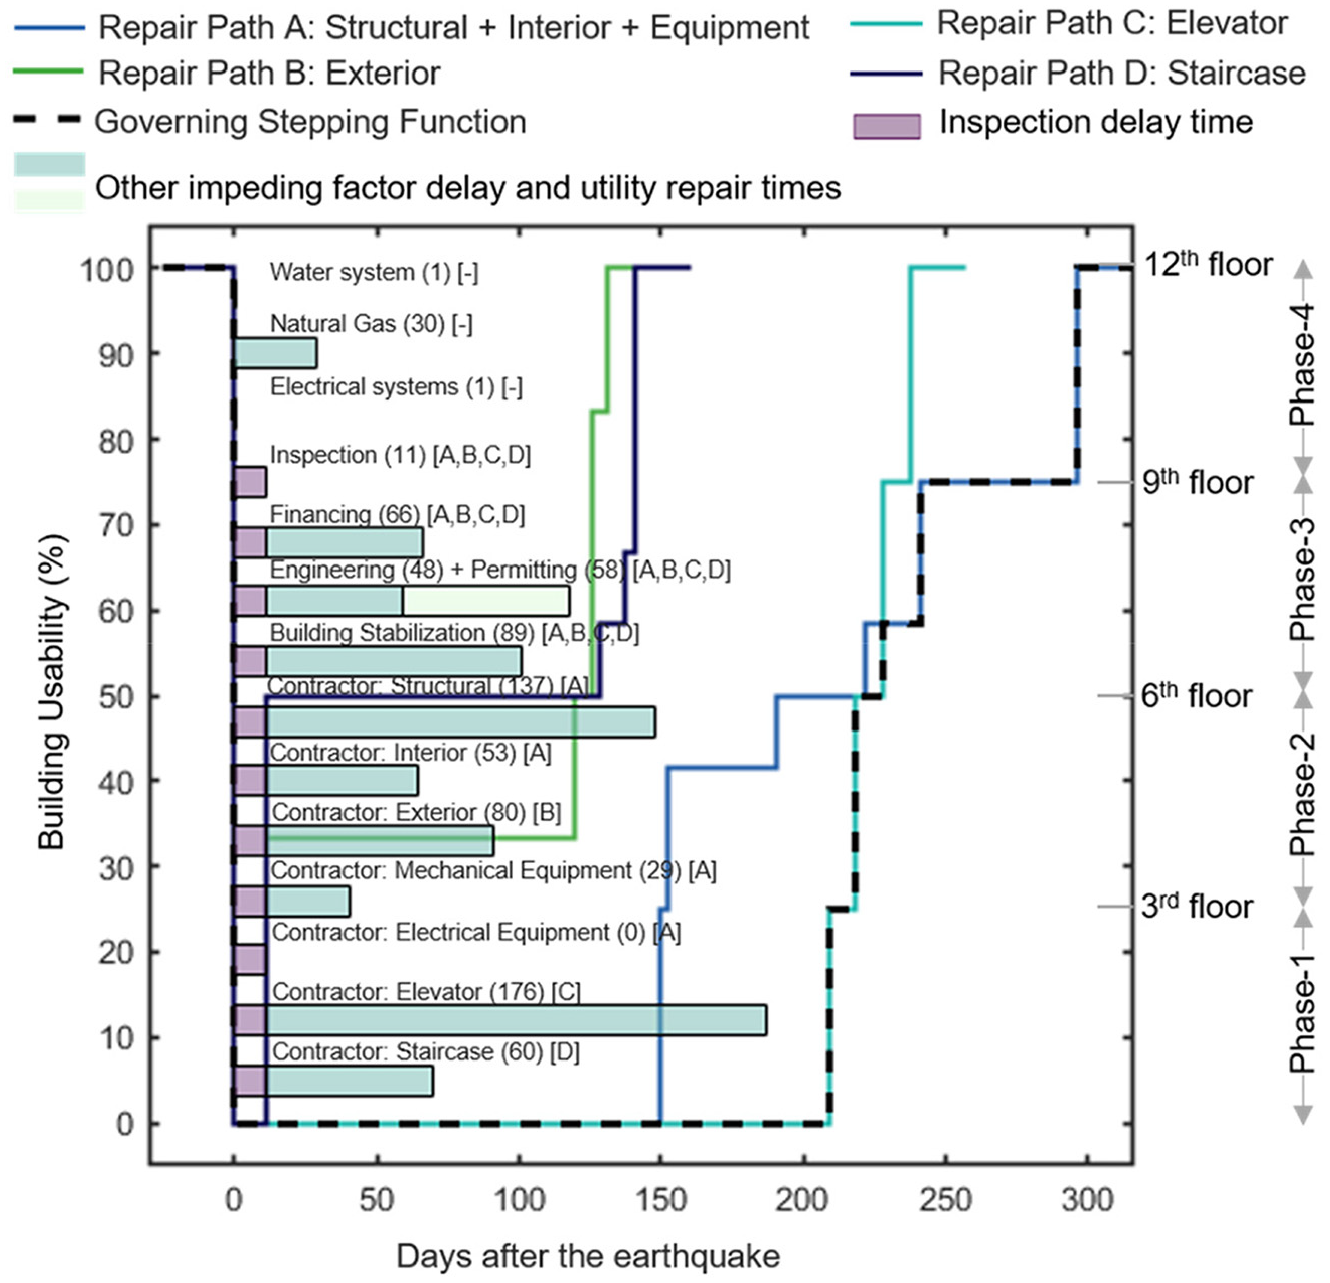
Recovery trajectories for each repair path to functional recovery of the median realization for the 975-year intensity level assessment. Numbers in “( )” brackets indicate the duration of the impeding factor. The letters in “[ ]” brackets serve to identify the repair paths affected by each impeding factor delay.
As discussed earlier, the framework models four recovery trajectories, one for each repair path, for each realization of building performance. The recovery trajectories of the median realization of the 975-year intensity level assessment of the 12-story case study building are shown in Figure 8. The four repair phases are also shown along the y-axis of the plot. The governing recovery trajectory is determined as the upper bound time to completion of the four trajectories. As observed in Figure 8, repair path C (i.e. elevator repairs) controls the downtime in the building’s lower 7 stories and repair path A (i.e. structural, interiors, and equipment repairs) governs downtime in the building’s top 5 stories. These results enable the planning of a phased return of building occupants. For instance, the lower 6 stories (50% building usability) will regain functionality 218 days after the earthquake. But, if elevators we not considered essential in the lower 6 stories, this phased return could happen as early as 190 days after the earthquake. In the realization illustrated in Figure 8, no staircase repairs are required in the building’s lower 6 stories, thus, the stepping function for staircase repairs jumps from 0% to 50% immediately after inspection. Similarly, the exterior façade components are undamaged in the lower 4 stories, hence, the stepping function jumps from 0% to 33% after inspection. The contractor mobilization delay for structural and elevator components governs the delay to the start of repairs in repair paths A and C, respectively, and engineering and permitting delay govern the delay time to the start of repairs in repair paths B and D. While utility delay times are also shown in Figure 8, they do not govern for the realization shown. As discussed earlier, it can be observed that in path A during phase 1, the trajectory jumps directly from 0% to 25%, that is, the end of phase 1, because repairs in the second and third stories take less time than those of the first floor. By contrast, also in path A, during phase 2, repairs in the sixth story take longer than those of the fifth story, hence the trajectory takes an intermediate step within phase 2.
While Figure 8 represents only the median realization to functional recovery, Figure 9a and b, displays the governing recovery trajectories to shelter-in-place and functional recovery, respectively, for all 2000 realizations of the 975-year intensity-level assessment. The plots highlight the large uncertainty associated with downtime estimates. The 10th, 50th (median), and 90th percentile downtime estimates to shelter-in-place are 4, 120, and 219 days, respectively. The same percentiles to functional recovery are 210, 296, and 478 days, respectively. In Figure 9a, the short downtime of 4 days for the shelter-in-place recovery state corresponds to the time required for inspection, as no repairs are required to achieve the shelter-in-place recovery state in the 10th percentile realization.
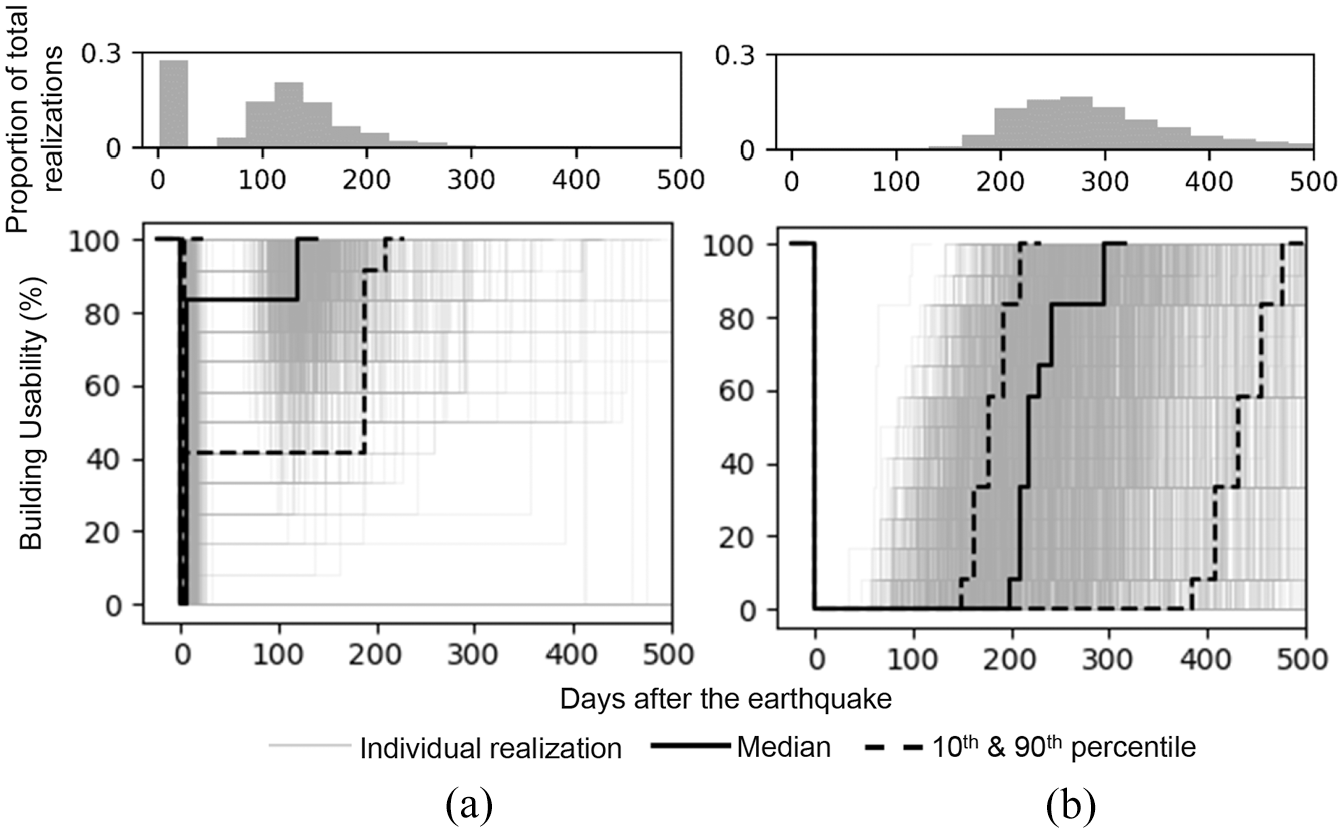
Recovery trajectories to (a) shelter-in-place and (b) functional recovery states for all realizations of the 975-year intensity-level assessment.
Robustness
In the context of this framework, evaluating a building’s seismic performance begins with assessing its ability to withstand seismic forces without loss of function, that is, its robustness. This requires determining the immediate post-earthquake usability of the building. The National Earthquake Hazards Reductions Program (NEHRP, 2015) provisions proposes a “function loss” performance metric that requires all buildings in risk category IV to have a probability of 10% or less of not being operational after a “functional-level earthquake,” which roughly corresponds to ground motion intensity with a return period of 475 years. Analogous to these provisions, we propose a performance metric that describes the probability, i.e. Y%, of a building not achieving a target recovery state immediately after an earthquake with specified ground motion shaking intensity. Consistent with the 2015 NEHRP performance objective, Y is tentatively set to 10% for an earthquake intensity corresponding to the “functional-level earthquake.” However, the target recovery state is dependent on the buildings risk category or intended post-earthquake use, for example, functional recovery for buildings in risk category IV, such as hospitals, and shelter-in-place for buildings in risk category II, such as residential buildings. The generalized expression for the robustness target is shown in Equation 1 for a predefined ground motion intensity level.

Equation 1 expresses that the probability of the criticality of the immediate post-earthquake recovery states exceeding the criticality of the target recovery state should not be greater than a predefined threshold. We calculate this probability by determining whether the recovery state associated with the most critical repair class across building components in each realization is more critical than that of the target recovery state, that is, if 200 out of 2000 realizations result in damage that hinders functional recovery (i.e. the most critical repair class is greater than or equal to two), there is a 10% chance that the building will be not functional after the earthquake. Figure 10 illustrates these results for the case study building. For a ground motion intensity with a return period of 475 years (hereinafter referred to as the 475-year intensity level), Figure 10a shows that the probability of not achieving the expected target recovery state in the case study residential building, that is, shelter-in-place, is equal to 22%, which is greater than the 10% acceptable threshold previously introduced. However, Figure 10b shows that the probability of not achieving reoccupancy at this intensity level is almost 100%, which exceeds the acceptable threshold tenfold. This shows that more residents will be able to shelter in their own homes after the earthquake, albeit with reduced habitability standards, if the shelter-in-place criteria are employed in lieu of the more stringent reoccupancy criteria. The large difference in the percentage of realizations that hinder reoccupancy over shelter-in-place is primarily because the reoccupancy recovery state requires severely damaged HVAC, piping, curtain walls and partitions to be repaired (or replaced) before residents can reoccupy the building. In addition, unlike the shelter-in-place recovery state, which is hindered when a threshold of acceptable damage in RC4 is exceeded, any damage in RC3 hinders achieving reoccupancy, leading to a larger number of realizations that hinder this recovery state. At the 100-year intensity level, the probability of not achieving shelter-in-place is 0%, that is, the building will have sheltering capacity when subjected to a ground-motion intensity with a return period of 100 years. The probability of not achieving reoccupancy at this intensity level is 53%. Figure 10c shows that the probability of not achieving functional recovery is almost 100% at every intensity level considered in the assessment.
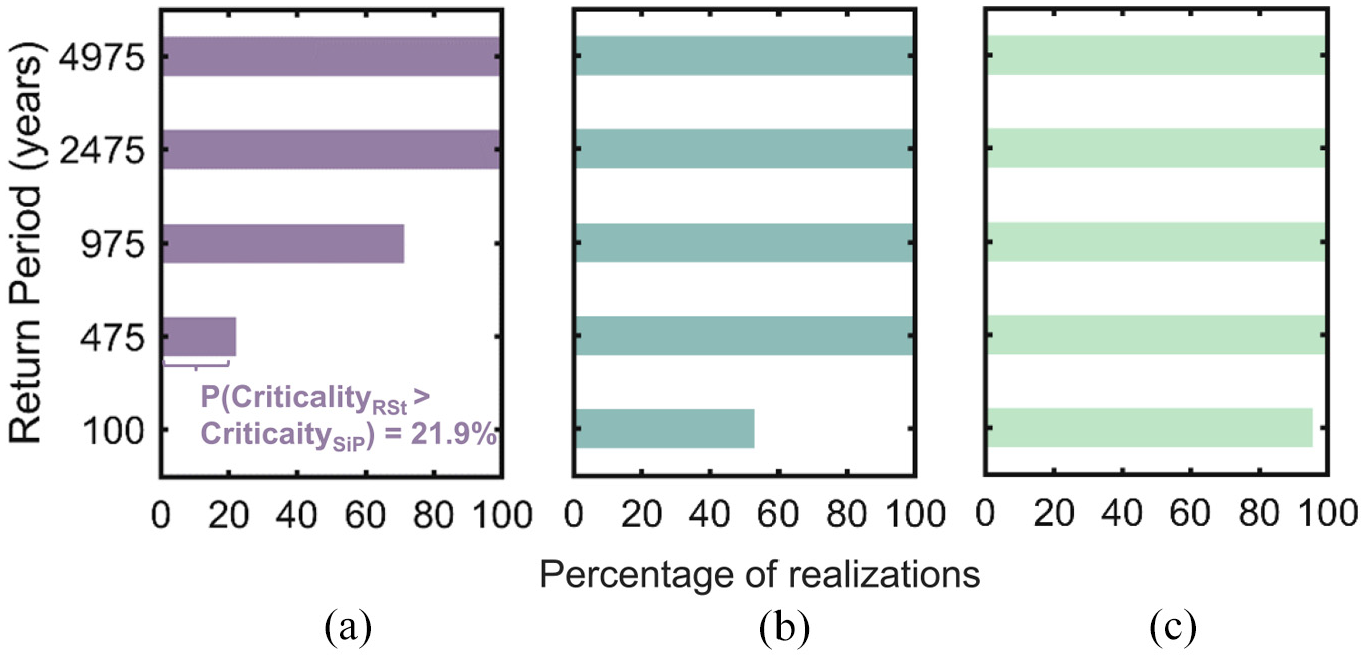
Probability of the criticality of the immediate post-earthquake recovery state being greater than that of target recovery states of (a) shelter-in-place, (b) reoccupancy, and (c) functional recovery for a range of ground motion shaking intensities. RSt denotes recovery state, SiP denotes shelter-in-place.
Rapidity
Using the estimated downtime from the recovery trajectories, we next develop a performance measure to check the “rapidity” of the building, that is, the ability to meet recovery goals in a timely manner. FEMA P-2082 (FEMA, 2020) recommends assigning target functional recovery downtimes (ranging from hours to months) to every new building, depending on the building’s risk category. Due to the significant variation in downtime estimates, reporting only central tendency estimates, that is, mean or median results, to evaluate rapidity would be misleading. A more meaningful approach is to ensure that the probability of not achieving a recovery state, for example, functional recovery, within a specified time frame is small, say less than Y%. Considering functional recovery as a target recovery state, this metric can be stated as shown in Equation 2 for a predefined ground motion intensity level (e.g. a “functional-level earthquake” with a 475-year return period).

where DTFR is the estimated downtime to functional recovery, DTTARGET is the target downtime as defined by the building owner, city, resilience-based code or standard, and Y is the threshold beyond which building performance is unacceptable, which can tentatively be set at 10% for a risk category II building (FEMA, 2020). This framework calculates the probability of DTFR exceeding DTTARGET based on the percentage of realizations in which the estimated downtime exceeds DTTARGET.
Poland (2009) establishes target downtimes for a resilient San Francisco. It requires all residences to be repaired within 4 months of an earthquake representative of a 475-year intensity-level event. Assuming a similar 4-month target, Figure 11 shows that the probability that the downtime to functional recovery exceeding 4 months is approximately 88% for the 475-year intensity level, which is far greater than the 10% threshold previously introduced.
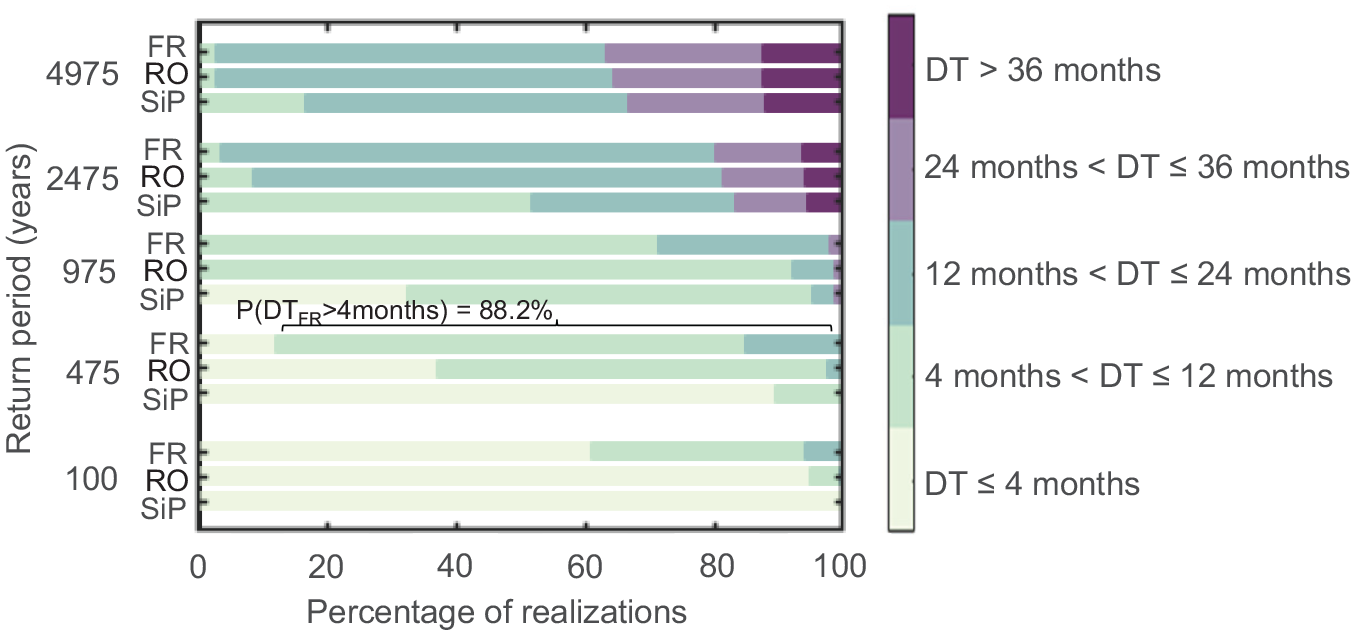
Downtime to achieve functional recovery (FR), reoccupancy (RO), and shelter-in-place (SiP) recovery states across all intensity levels considered in the assessment.
Summary of results
Table 4 summarizes the results of the structural analyses and loss-based assessments of the 12-story case study building. The results illustrate that even when the building experiences story drifts within the code allowable limit, or when the economic loss ratio (direct repair cost normalized by building replacement cost) is low, its seismic performance measured in terms of “robustness” and “rapidity” is unacceptable. For instance, at the 475-year intensity level, the maximum story drift is 0.75% (i.e. less than half of the building code limit), the probability of the building being deemed irreparable is zero, and the median economic loss ratio is only 2.5%. However, the probabilities of the building not achieving its robustness (i.e. sheltering capacity immediately after the earthquake) and rapidity criteria (i.e. achieving functional recovery within 4 months) are 21.9% and 88.2%, respectively. Similarly, at the 975-year intensity level, the maximum story drift is 1.19%, probability of the building being deemed irreparable is 2.2%, and the economic loss ratio is 5.8%, yet the probability of not achieving shelter-in-place is 71% and the probability of downtime exceeding 4 months is 100%. The median story drift and median floor acceleration reported in Table 4 are the maximum of the median story drift/floor acceleration of all ground motions among all floors in the building.
Summary of structural and loss assessment results for the case study building.
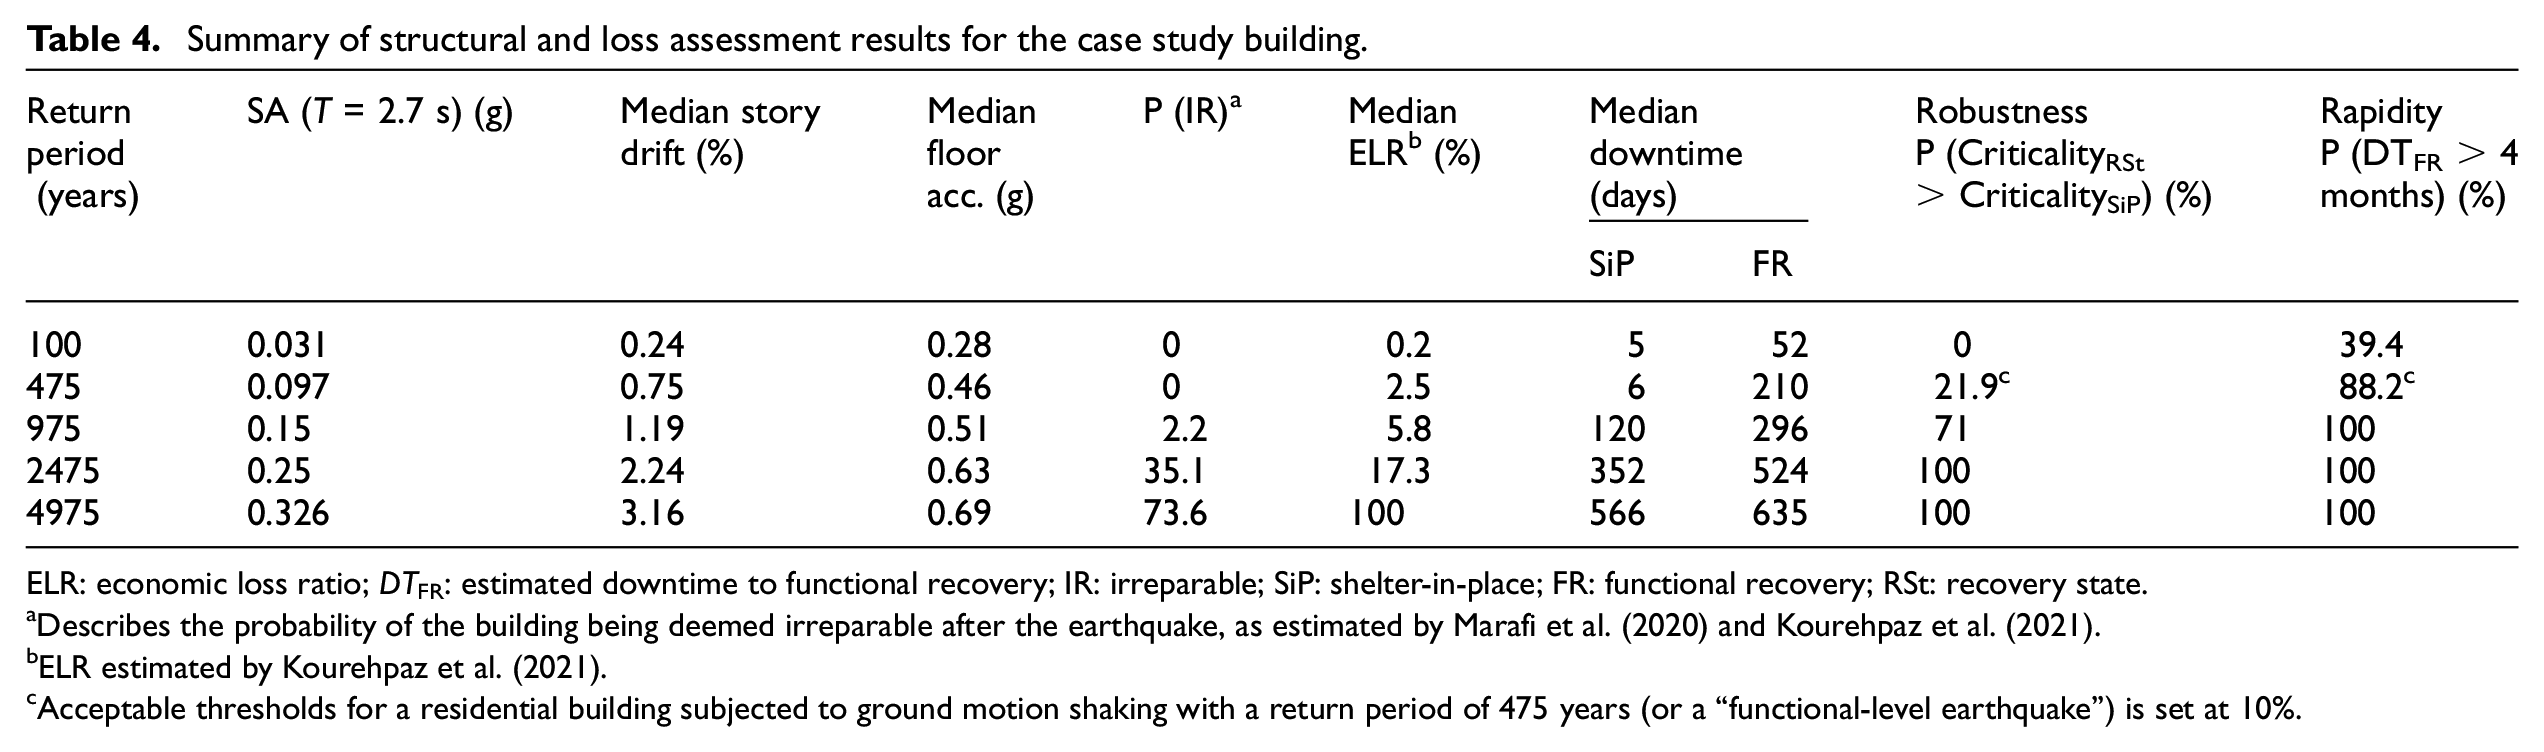
ELR: economic loss ratio; DTFR: estimated downtime to functional recovery; IR: irreparable; SiP: shelter-in-place; FR: functional recovery; RSt: recovery state.
Describes the probability of the building being deemed irreparable after the earthquake, as estimated by Marafi et al. (2020) and Kourehpaz et al. (2021).
ELR estimated by Kourehpaz et al. (2021).
Acceptable thresholds for a residential building subjected to ground motion shaking with a return period of 475 years (or a “functional-level earthquake”) is set at 10%.
Disaggregation of results
If a building fails to achieve the desired recovery targets, it is important to provide a breakdown of the different downtime contributors to help engineer a design or retrofit intervention. This section provides a breakdown of downtime in three stages: Figure 12 shows the contribution of collapse, non-collapse irreparable damage and repairable damage to the total mean downtime to functional recovery; Figure 13 provides insights on the component damage hinders achieving a recovery state immediately after the earthquake; and Figure 14 highlights the components that govern repairable downtime.
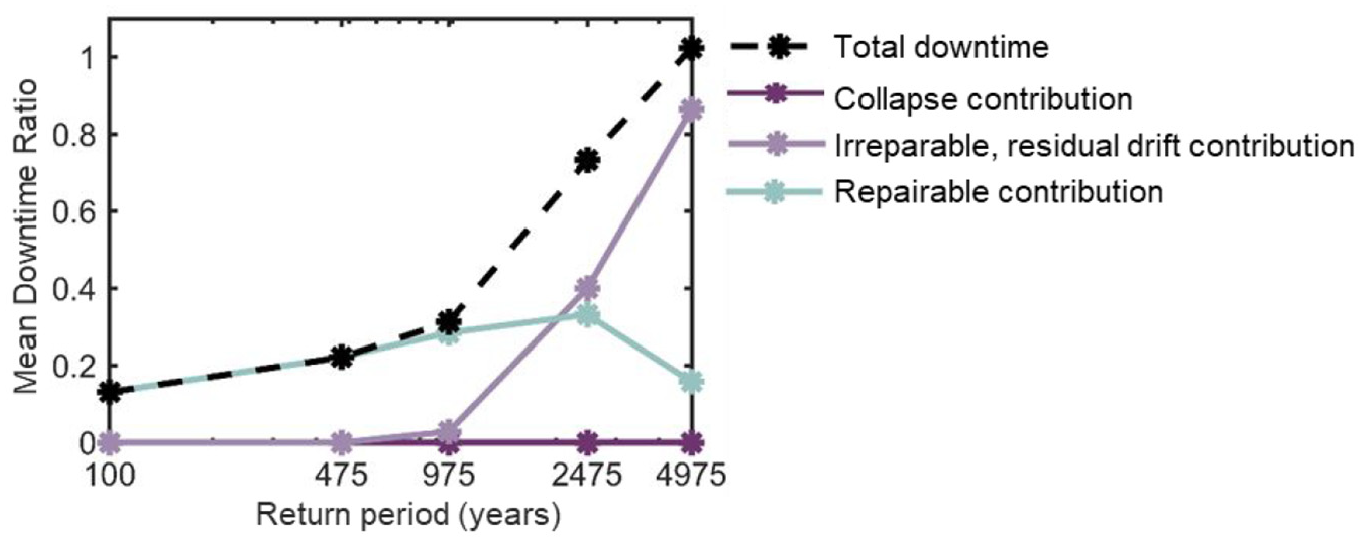
Mean downtime to functional recovery ratio at each intensity level, including contributions from collapse, irreparable damage, and repairable damage.
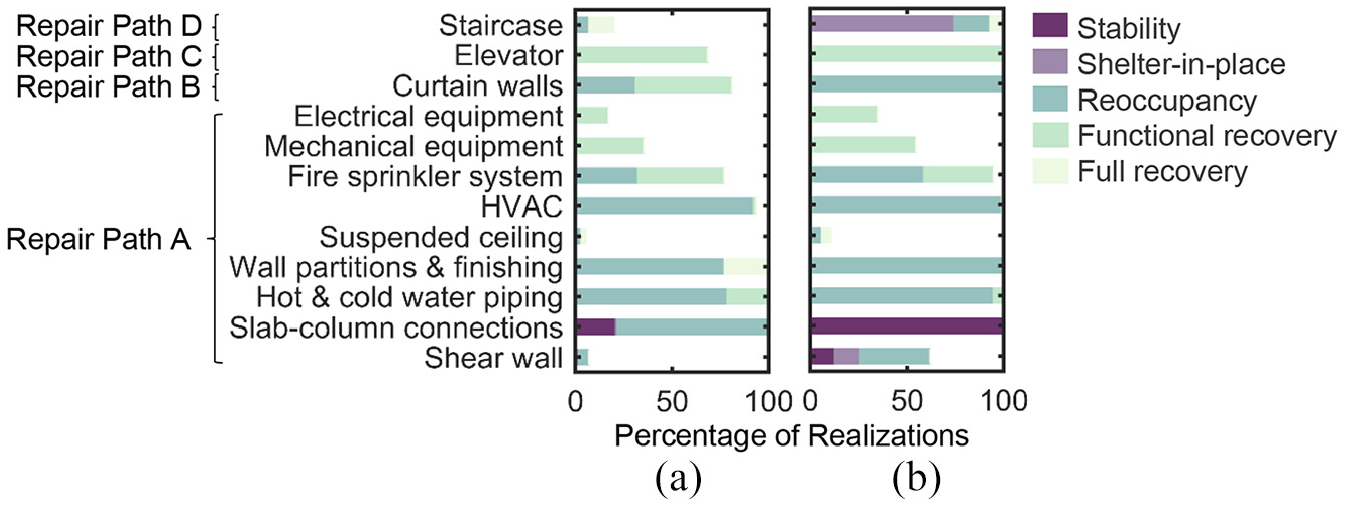
Percentage of non-collapse repairable realizations in which a component incurs damage that hinders either stability, shelter-in-place, reoccupancy, functional recovery, or full recovery for the (a) 475-year and (b) 2475-year intensity levels.
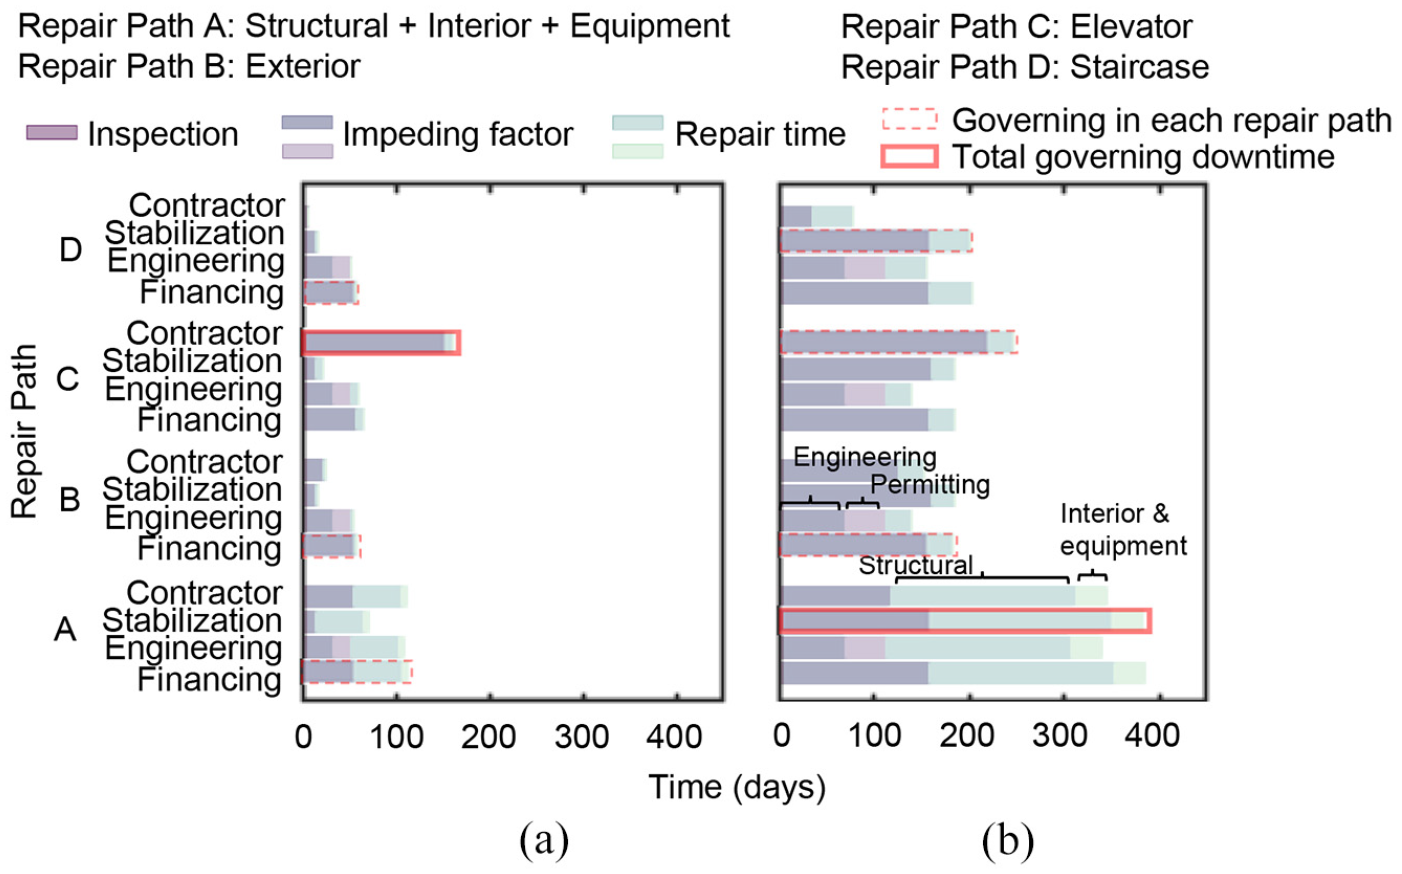
Disaggregation of mean downtime to functional recovery for repairable realizations for the (a) 475- and (b) 2475-year intensity levels.
Figure 12 illustrates the mean downtime ratio (mean downtime to functional recovery normalized against the mean building replacement time) at each intensity level considered in the assessment. The results indicate that the downtime contribution due to collapse is negligible for all earthquake intensities, as expected of a modern building designed to ensure collapse prevention. Irreparable damage is a larger contributor at higher intensity levels while repairable damage is the main contributor at lower intensity levels, which is consistent with past studies (Molina Hutt et al., 2019). The linear interpolation of data points in Figure 12 may not be accurate for return periods other than those considered in the assessment, but it serves to identify trends of increasing downtime ratios and increasing contribution of irreparable outcomes to the total downtime at earthquakes with higher return periods.
Figure 13 highlights building components that require strengthening to help achieve the “robustness” performance measure. For instance, at the 475-year intensity level, Figure 13a shows that damage to slab-column connections hinders achieving the stability recovery state immediately after the earthquake in 21.9% of the realizations, and hence needs to be strengthened to increase the probability of achieving stability or another less critical recovery state. Figure 13 also shows the benefit of having reduced habitability standards, that is, the shelter-in-place vs the reoccupancy recovery states. While slab-column connections are the only component that require strengthening to achieve shelter-in-place at the 475-year intensity level, damage to curtain walls, HVAC ducts, partitions, piping and slab-column connections hinder achieving the reoccupancy criteria. Figure 13b shows that building damage is more severe at the 2475-year intensity level, where damage to shear walls, slab-column connections, and staircases can hinder sheltering capacity immediately after the earthquake.
Not all components that hinder achieving a recovery state are critical to expedite recovery. Unlike seismic damage and earthquake-induced economic losses, the relationship between seismic damage and downtime is not one-to-one. This is because strengthening a component will reduce downtime only if that component belongs to the controlling repair path. This is illustrated in Figure 14 which provides a disaggregation of repairable downtime to functional recovery by calculating the average contribution of each repair path across all realizations. Results show that for the 2475-year intensity level, the mean downtime is 386 days, which is controlled by repair path A (structural, interior and equipment repairs). This downtime may be reduced either by a more stringent design of structural elements or by reducing the corresponding impeding factor delays. However, the downtime can only be reduced by 137 days (35%) because after further reductions, repair path C (elevator repairs) would control the downtime. At the 475-year intensity level, repair path C (elevator repairs) control downtime. The downtime can be reduced by 49 days (30%) if the owner has a pre-arranged contract with an elevator contractor. However, beyond this reduction, repair path A would govern downtime and any further reduction in the elevator repairs would not reduce the total downtime. This unique relationship between damage and downtime is of particular importance when evaluating design strategies to reduce downtime.
Conclusion
In support of the development of performance goals for the built environment stated in terms of post-earthquake recovery times, this study proposes an analytical framework to assess earthquake-induced downtime and model recovery of buildings. The framework comprises of five key components:
The starting point for recovery modeling begins with evaluating the immediate post-earthquake usability of the building. For this, we determine the maximum repair class of all building components and identify the recovery state hindered by the building immediately after the earthquake.
Next, the impeding factor delays before repair or reconstruction activities are estimated.
The framework then estimates the repair time of the building by allocating workers required for the repair of damaged components and performs the sequencing of repairs to get the repair time.
The framework then models the individual building-level recovery trajectory to the desired recovery state. The recovery trajectory is modeled as stepping function that provides floor-wise downtime estimates to allow the owner to plan a phased repossession of the building.
We define two seismic probabilistic performance measures for individual buildings that provide estimates in terms of resilience-based metrics, that is, robustness (ability to withstand loads without service disruption), and rapidity (capacity to meet recovery goals in a timely manner). If the building design does not conform with these performance measures, the framework provides a disaggregation of downtime that highlights the components that contribute to inadequate performance, thus enabling effective design interventions.
The framework is implemented on a modern 12-story residential reinforced concrete shear wall building in Seattle, WA. The performance evaluation shows that at a functional-level earthquake (roughly equivalent to ground motion intensity with a return period of 475 years), the probability of not achieving a target recovery state of shelter-in-place immediately after the earthquake is 21.9%, which exceeds the 10% threshold suggested by the 2015 NEHRP provisions. The probability of the building not achieving functional recovery within a target downtime of 4 months is 88.2%, which also exceeds the 10% threshold suggested in FEMA P-2082. These extended downtimes are despite the building experiencing mean story drift ratios of less than 1%, half of the building code limit. These results of this case study substantiate the importance of moving beyond performance measures in terms of story drifts to additionally consider resilience-based performance measures such as post-earthquake usability, or acceptable recovery times. While this framework was implemented on a multi-family residential building for this article, the framework is generic and can be implemented on a building with any structural system, height, and type of occupancy.
Due to the complexity in conducting downtime estimates, several heuristic assumptions are made within the proposed framework. The extent of damage to be exceeded to hinder achieving different recovery states warrants further research. Also, while the impeding factor delays in this framework are estimated by sampling lognormal distributions, a more holistic approach would be to explicitly consider region-specific constraints with more advanced agent-based models. The accuracy of the impeding factor estimates, which are largely based on expert opinions, needs to be verified with empirical data and its applicability across geographical regions and hazard levels needs to be validated. Further work is also required to validate and expand the library of fragility and consequence functions in the FEMA P-58 database. Methodical collection of data after earthquakes about the degree of damage to buildings and the time required to achieve each phase of recovery is needed to validate and refine the assumptions in this framework. Despites its assumptions and limitations, the proposed framework and its associated open-source code can be adjusted to suit region or building-specific constraints. As more data become available, the proposed framework can help building owners, design engineers and policy-makers evolve from life-safety-based building codes toward resilience-based standards.
Footnotes
Acknowledgements
The authors thank Nasser Marafi (Risk Management Solutions) for sharing the structural design and relevant analyses of the case study building used in this manuscript. The authors thank Adam Zsarnoczay (Stanford University) for his improvements to NHERI-SimCenter’s PELICUN v2.5 to support the needs of this study and his constructive feedback to improve the clarity of the manuscript. They also thank Anne Hulsey (The University of Auckland) and Francisco Galvis (Stanford University) for their thoughtful comments and suggestions to improve this work. Any opinion, findings, and conclusions or recommendations expressed in this material are those of the authors and do not necessarily reflect the views of the collaborators or sponsoring agencies.
Declaration of conflicting interests
The author(s) declared no potential conflicts of interest with respect to the research, authorship, and/or publication of this article.
Funding
The author(s) disclosed receipt of the following financial support for the research, authorship, and/or publication of this article: This research was funded by Canada’s Natural Sciences and Engineering Research Council under Discovery Grant No. RGPIN-2019-04599, as well as Canada’s New Frontiers in Research Fund—Exploration under Grant No. NFRFE-6032018-01060.
Electronic Supplement
The data and code generated during the study are compiled as a companion to this paper and can be found at the following URL ( A step-wise procedure to implement the framework for any type of building. A repair class database containing the associated repair class for every damage state of all components in the FEMA P-58 database used in this study. The framework coded in MATLAB and Python languages. The engineering demand parameters and building performance model for the case study building.![]() ). The electronic supplement includes the following:
). The electronic supplement includes the following:
The code generated in this study is compatible with version 2.5 of NHERI’s SimCenter PELICUN tool. The framework coded in Python is provided as an open-source application called TREADS (Tool for Recovery Estimation And Downtime Simulation) at the following Github repository (![]() ). TREADS is also available at the Python Package Index (PyPI) and can be easily installed using pip.
). TREADS is also available at the Python Package Index (PyPI) and can be easily installed using pip.