
Abstract
Rapid restoration of transportation systems following earthquake disruptions is essential due to its significant impact on commutes, freight transport, and emergency medical response. This study develops a framework to model bridge post-earthquake functional recovery, which is a critical step in assessing the seismic resilience of transportation networks. A simulation-based strategy is used, which is initiated by component-level damage assessment. This is followed by three major modules that include functional state evaluation, impeding factor definition and duration, and repair or replacement duration. The functional state module determines the bridge closure decisions (e.g. partial or complete lane closure, weight restriction) immediately after the earthquake and during the reopening phase. The duration estimates include the time delays before the initiation of repairs (in the impeding factor module) and the time needed to perform any necessary repairs or to replace the bridge (in the repair or replacement duration module). Worker allocation schemes and repair sequencing are explicitly considered to realistically reflect local construction practices. The framework architecture and duration-based input parameters were informed by a series of interviews with California bridge engineers and builders. Nonetheless, the overall methodology is flexible and can be easily adapted to other jurisdictions.
Keywords
Introduction
Earthquakes can cause considerable damage to transportation infrastructure, such as bridges, tunnels, and roadways, resulting in a myriad of negative impacts on daily commutes, commerce, and emergency response efforts. The 1989 Loma Prieta, California earthquake (
New bridge seismic designs in California are required to comply with the California Department of Transportation (Caltrans) Seismic Design Criteria (SDC) (California Department of Transportation, 2018), the American Association of State Highway and Transportation Officials (AASHTO, 2021) Load-and-Resistance Factor Design (LRFD) specifications, and the California Amendments to the AASHTO LRFD specifications. Historically, the bridge seismic design criteria in California were governed by the life-safety objective with no emphasis on preserving functionality. In Caltrans SDC v1.7 (California Department of Transportation, 2013), the design earthquake corresponding to a 975-year return period was the only considered hazard level for bridge seismic design. The current Caltrans SDC v2.0 has evolved from the single, life safety–oriented design objective that is encoded in the Safety Evaluation Earthquake (SEE) level, to also incorporate a Functional Evaluation Earthquake (FEE), which corresponds to a 225-year return period. Newly designed bridges must satisfy the displacement criteria (frame or bent lateral displacement and component displacement ductility) and force requirements under these two seismic hazard levels. Although the current bridge design criteria provide qualitative descriptions of expected post-earthquake bridge functionality, there are no available methods to evaluate the likelihood that this performance expectation will be realized.
The performance-based earthquake engineering (PBEE) methodology (Moehle and Deierlein, 2004) advanced the prescriptive design approach by explicitly quantifying stakeholder-centric metrics for buildings, such as economic loss and downtime. A study by Mackie et al. (2008) was the first to adapt PBEE, which was originally developed for buildings, to assess bridge repair cost and downtime. The method proposed by Mackie et al. decomposed the repair of individual bridge components into multiple tasks (e.g. soil excavation, epoxy inject cracks) to estimate the associated durations. The total repair time in Mackie et al. (2008) was expressed as the sum of component-specific durations, based on the unrealistic assumption that all component repairs are performed in series. Zakeri and Zareian (2017) and Ning and Xie (2022) also adapted the PBEE methodology for bridge seismic design to minimize earthquake-induced repair cost.
A high-fidelity post-earthquake functional recovery model must explicitly consider the relationship between component-level damage and its contribution to the impairment of a bridge’s intended functionality. The associated repair activities, their sequencing, and implications to functionality restoration should also be modeled. There have been frameworks developed to assess seismic functional recovery for bridges. Padgett and DesRoches (2007) developed a stepwise restoration model for quantifying a bridge’s traffic-carrying capacity as a function of the system-level damage state. Terzic and Pasco (2021) proposed a framework for evaluating bridge functional recovery based on structural mechanics. The bridge functionality was defined as the probability of traffic demand exceeding the maximum axial capacity of columns. However, all prior frameworks neglected the time associated with impeding factors that may delay the initiation of post-earthquake bridge repair or replacement activities (Comerio, 2006). In some cases, these delays may dominate the total recovery time. Also, these prior studies did not consider the possibility of weight restrictions and additional secondary measures, which are often instituted during the bridge reopening process.
Empirical data on earthquake-induced repair delays, repair durations, and the relationships between structural damage and traffic closures, are necessary inputs for a bridge functional recovery model. These data can be obtained from post-earthquake reconnaissance reports or elicited from expert opinions during an interview or survey. Reconnaissance efforts after an earthquake (e.g. Wotherspoon et al., 2012) provide insights on observed bridge damage and repair strategies. However, they typically do not contain well-documented repair duration information. Moreover, eliciting bridge builders and designers can serve as a targeted approach to acquiring the necessary repair sequencing and duration data. Based on a survey with four respondents participating in the ATC-13 project, HAZUS (Federal Emergency Management Agency, 2003) defines bridge system-level restoration curves as time-dependent percentages of recovered functionality. This is the basis of the bridge recovery simulation in the HAZUS methodology, which estimates restoration times based on 28 bridge categories. While this approach is straightforward to implement, it overlooks the nuances associated with damage to individual components. This spurred the development of component-based recovery assessment strategies. To inform such a strategy, Padgett and DesRoches (2007) developed a component-based bridge traffic recovery database based on a web survey. The survey results included relationships between the expected traffic carrying capacity and the damage to three bridge components (i.e. the approach, expansion joint, and column). Later, Misra et al. (2020) conducted a more in-depth survey and developed a database containing the repair durations for three bridge components (abutment, bearing, and column) under various damage states. This study was the first to quantitatively link bridge component-level damage to post-earthquake functionality states (FSs, i.e. complete closure, partial closure, and fully open). Based on Misra et al.’s (2020) survey results and empirical data, Kameshwar et al. (2020) developed a series of decision trees to predict post-earthquake traffic restrictions and their associated durations. Impeding factors were not considered in either of these two studies. A related study by Karamlou and Bocchini (2017a, 2017b) proposed a framework to simulate bridge post-earthquake recovery that considers component-level damage, and repair resource and logistical constraints. This model used the concept of “idle time” to address factors that delay the start of repairs. However, the specific factors and their sequencing and durations were not explicitly addressed. More recently, Wang et al. (2025) performed a nationwide survey with of more than 100 bridge professionals to solicit bridge component repair and recovery data across Mainland China.
The above review underscores the need for additional research on post-earthquake functional recovery of bridges, which, compared to buildings (e.g. Burton et al., 2016; Cook et al., 2022; Molina Hutt et al., 2022; Terzic et al., 2021; Wu et al., 2024), has received much less attention in the literature. This is partially due to the absence of a systematic and unified procedure (e.g. ATC-138 (Federal Emergency Management Agency, 2021)), coupled with the lack of a well-organized dataset that supports such assessments. This article proposes a framework for probabilistically quantifying bridge post-earthquake functional recovery, complemented by expert opinion-based data and general insights (e.g. impeding factor and repair sequencing architecture). The method is supported by the data and information obtained from interviews with California bridge engineers, engineering managers, and contractors, including Caltrans. The relevant data and information include bridge post-earthquake closure and reopening decisions and sequencing and probability distributions for specific impeding factors and component repair activities. An illustrative case study is presented to evaluate the post-earthquake repair and functional recovery of a hypothetical bridge in Los Angeles, California (CA). The evaluation is performed for the Caltrans SDC-specified FEE and SEE hazard levels.
The remainder of the article is organized as follows. First, the overall framework is presented. Next, detailed descriptions of the three constituent modules are provided. The details of the case study are then discussed, followed by specific guidelines on how the framework can be adapted to Non-Caltrans jurisdictions. The article concludes with a summary of the key findings, limitations of the study, and suggestions for further related work.
Bridge post-earthquake functional recovery framework
The proposed functional recovery assessment procedure is illustrated in Figure 1. A simulation-based scheme is used where the hazard and damage characterization, and the post-earthquake FSs and duration estimates are probabilistically determined. The framework is initialized by probabilistic seismic hazard analysis (PSHA). Using the hazard characterization and component fragility functions, the damage distributions for the individual bridge components are sampled.
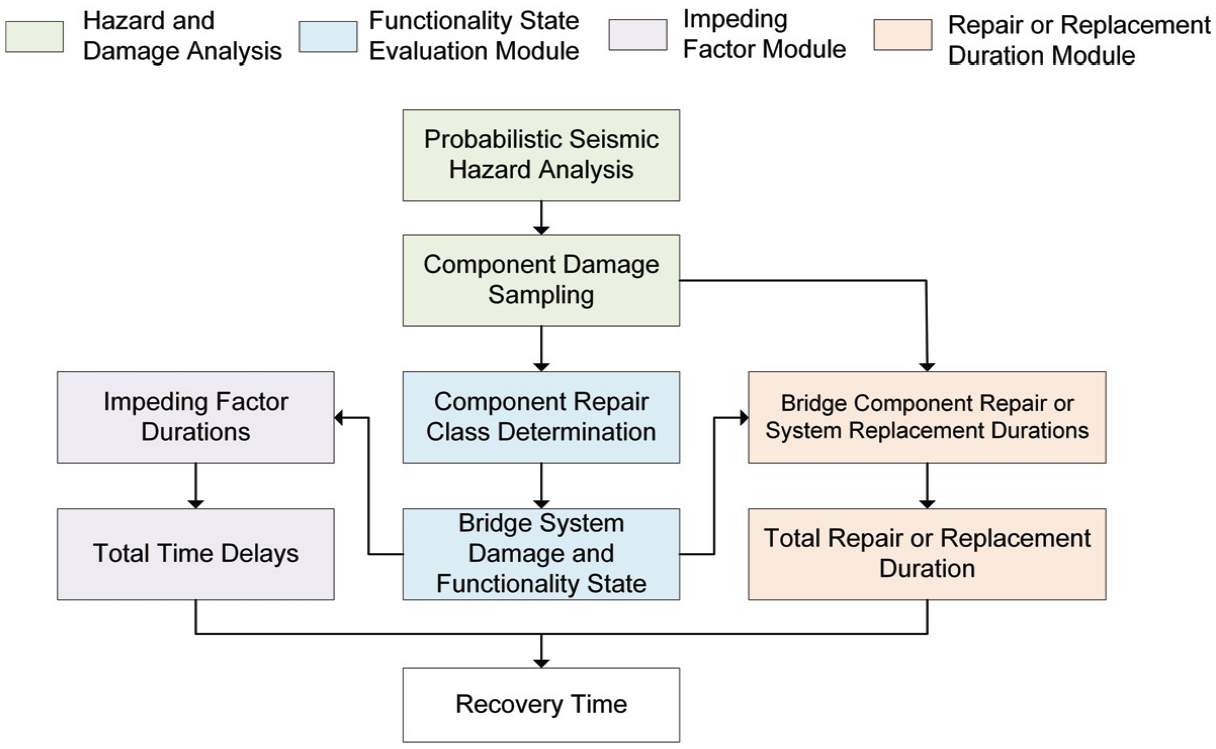
Overview of the proposed framework for modeling post-earthquake bridge functional recovery.
The component-level damage distribution is used as input for the FS evaluation and repair or replacement duration module. In the FS evaluation module, the component damage distribution is linked to the impairment of the bridge functionality through the repair class, which is an intermediate variable that relates the amount and severity of damage to the FSs. The immediate post-earthquake bridge closure decision (e.g. partial or complete lane closure) and the impact on functionality are determined in this module. In the impeding factor module, the total time associated with delays is simulated based on the sequencing and duration distributions of those factors that delay repairs. In the repair or replacement duration module, the duration is taken as the time to demolish and rebuild the bridge if it is deemed to be irreparable. If a bridge is repairable, the repair duration of each component is sampled from their respective distributions and ordered according to the predefined sequencing. Finally, the total recovery duration is calculated as the sum of the total time delays and the total repair or replacement duration.
Simulating bridge component damage
A component-based strategy is used to simulate bridge damage and estimate the functional recovery time. The key advantage of this approach relative to the system-based assessment (e.g. HAZUS (Federal Emergency Management Agency, 2003)) is the ability to relate individual component damage (and the effect of any mitigating actions, such as retrofits) to functional recovery durations. As illustrated in Figure 2, two alternative approaches are proposed for sampling component-level damage: one is based on the ground-motion intensity measure (IM) while the other uses engineering demand parameters (EDPs). The IM-based approach does not require nonlinear response history analysis (NRHA). Instead, component damage states are sampled from IM-based fragility functions (i.e. a component-level IM-damage relationship). Such functions are already available in the literature (e.g. Chen et al., 2024). For the EDP-based approach, a nonlinear finite element model must be constructed and analyzed using a set of carefully selected ground motions (e.g. using site-specific and hazard-consistent record selection; Mangalathu, 2017; Wu and Burton, 2024). The damage sample is obtained by comparing component demands (as quantified by the EDPs) with capacities. While the EDP-based strategy requires more computational effort, it can capture the effect of seismic demand variations across different instances of the same component type more appropriately. For example, in a multi-column bridge, there is a typical (implicit) assumption built into the IM-based approach that the response demand level is the same across all columns. Whereas, the EDP-based approach can capture the unique response demand in each column. Moreover, the EDP-based approach can more accurately capture the specific structural characteristics of the bridge under consideration (i.e. through nonlinear modeling and analyses). Whereas, the IM-based approach relies on relevant fragility curves from the literature to define the hazard-response-damage relationship for the considered bridge.
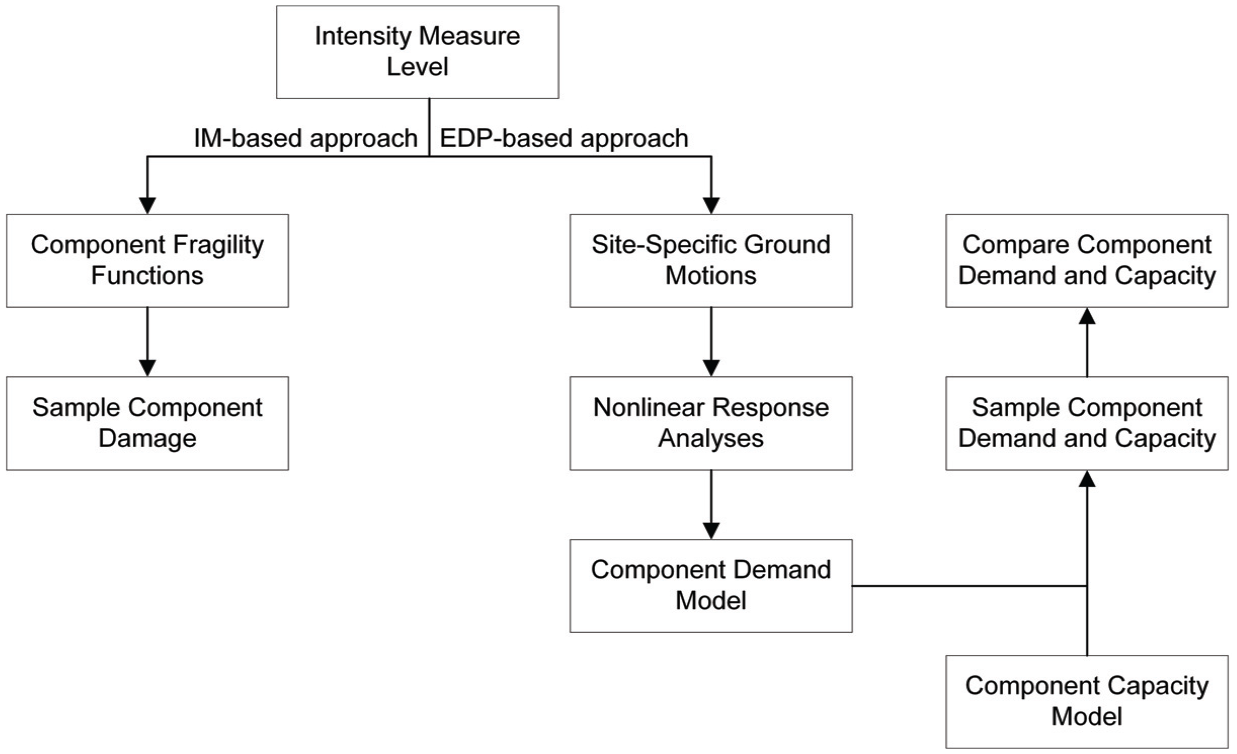
Alternative procedures for assessing component damage.
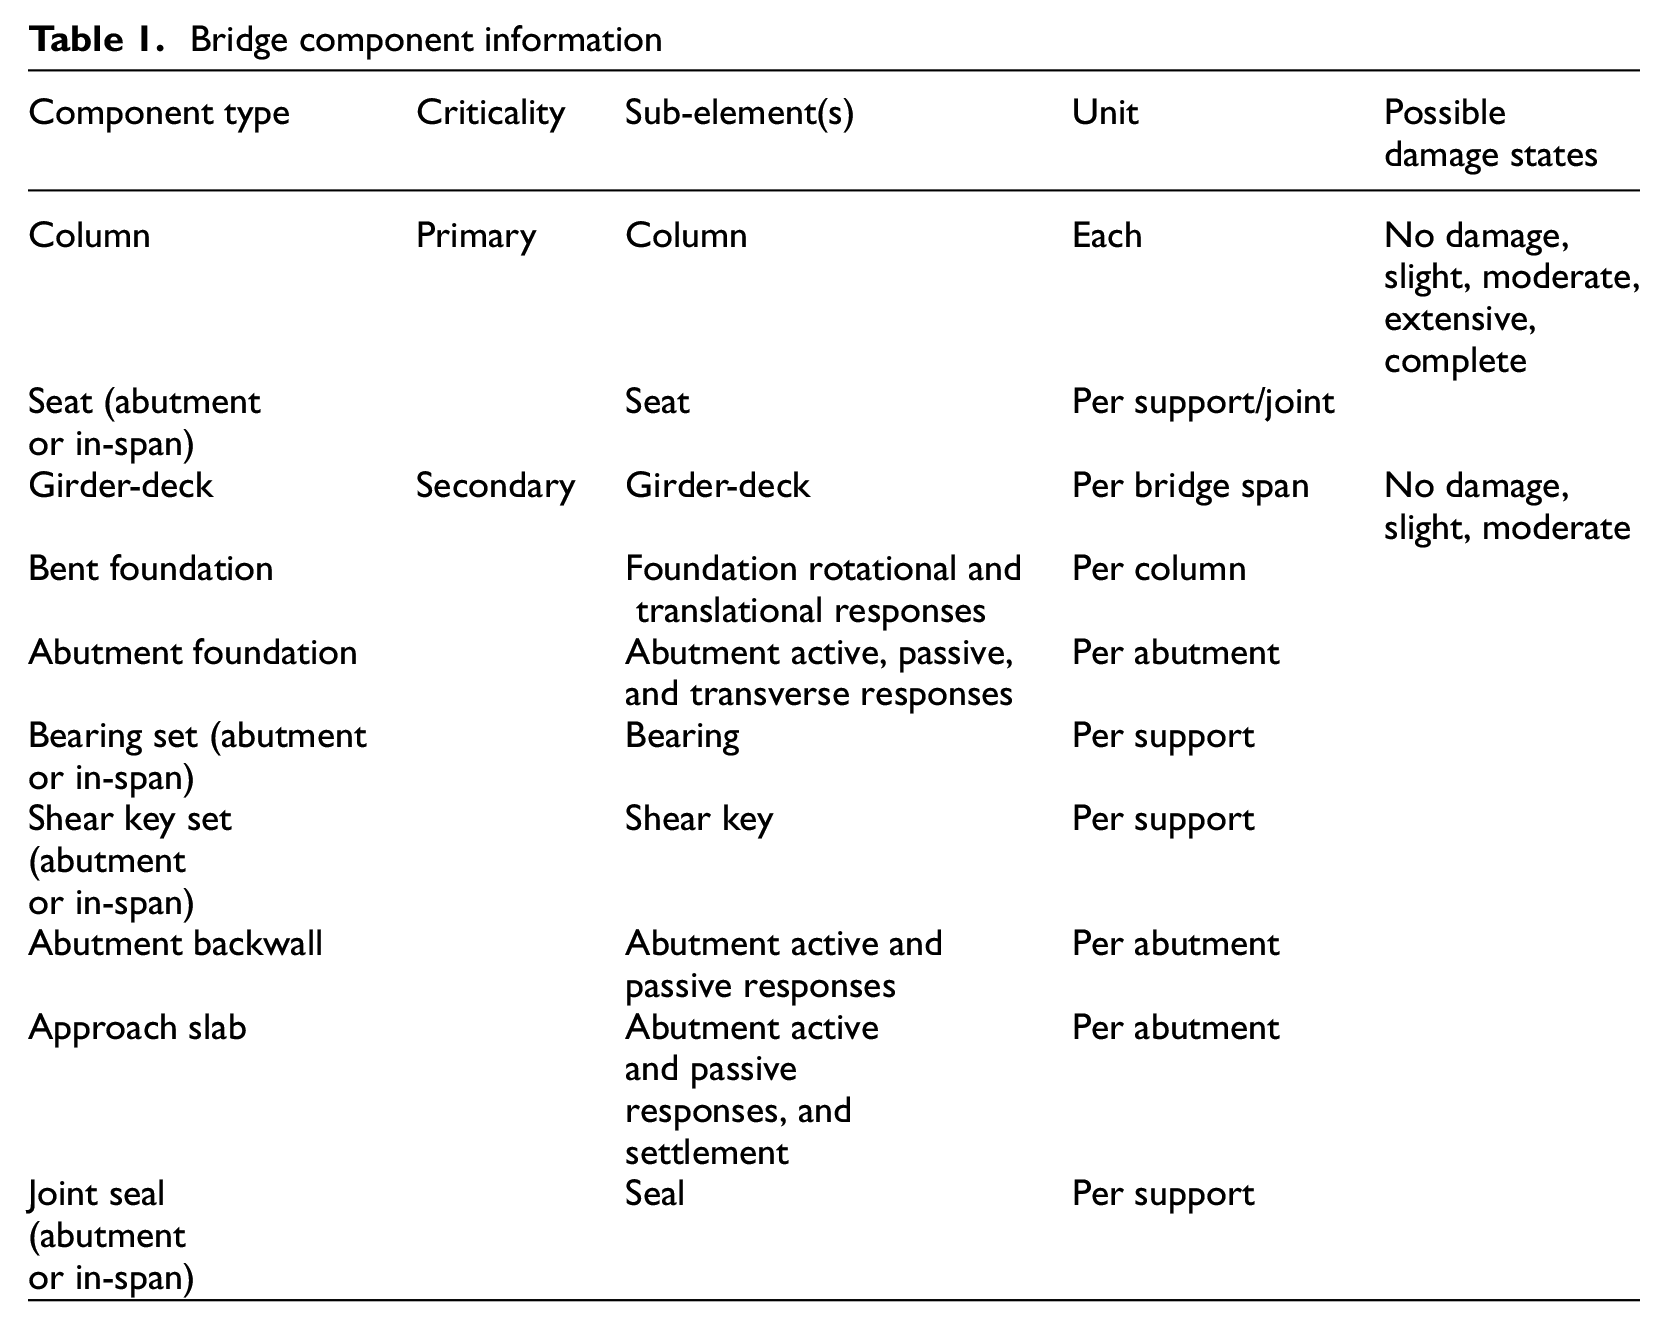
The following bridge components are considered: column, seat, girder-deck, bent foundation, abutment foundation, bearing, shear key, abutment backwall, approach slab, and joint seal. These components are suitable for regular bridges, which comprise 86.8% of the City of Los Angeles inventory (Federal Highway Administration, 2020). Damage to non-structural components, such as utilities, is not considered because of the lack of relevant fragilities and their minimal expected impact on bridge functionality. For irregular bridges, such as arch, suspension, and curved bridges, the analyst can augment the component database developed in this study if there are fragility functions available. Table 1 summarizes the key information for each component, including their criticality, possible damage states, units, and constituent sub-elements. These components and their criticality and damage state definitions are consistent with prior studies (e.g., Mangalathu, 2017; Ning and Xie, 2022), with the following assumptions/reasoning: (1) damage to some secondary components (e.g. abutment-related components) is not expected to significantly disrupt bridge functionality even if they need to be replaced, and (2) some secondary components (e.g. column and abutment foundations) are designed to be capacity-protected and are therefore highly unlikely to be the main cause of functional disruption (unless the connecting primary components, e.g. columns, need repair or replacement). The damage to some components is collectively determined by the response of more than one sub-element in a finite element model. For example, the damage to the bent foundation is determined by the translational and rotational response of the foundation elements. Also, the damage to the approach slab is characterized by the horizontal abutment response and vertical settlement. The relationships between the sub-elements and component damage are also based on prior studies (e.g., Mangalathu, 2017; Ning and Xie, 2022). The units assigned to each component are consistent with those used during the expert interviews where per-component repair durations were acquired. The units also form the basis of the component quantities used as inputs in the functional recovery assessment.
Bridge component information
FS evaluation module
This section describes how the bridge system functionality is determined based on the component damage distribution (i.e. across component types and instances) and relevant repair activities. The definition of FS, which is tailored to bridges, is first presented. The repair class, an intermediate variable that relates the component damage distribution to bridge system FS, is then defined. Next, the decision tree approach proposed by Kameshwar et al. (2020) is implemented for the bridge reopening phase (i.e. a transition phase between the initial response phase and fully functional state). Finally, the probabilistic determination of partial lane closure is presented.
FSs for bridges
The term functionality is used as a performance measure that characterizes a bridge’s ability to serve its intended purpose. FSs are time-dependent discrete random variables that represent milestones in a bridge’s recovery process.
In the work by DesRoches et al. (2012), bridge functionality is defined as the likelihood of placing speed, weight, or lane restrictions on a damaged bridge. We discussed the three possible restrictions defined in the work by DesRoches et al. (2012) and Kameshwar et al. (2020) with Caltrans officials who had prior experience in bridge inspection and management (Yen et al., 2023) following a disruptive event. During this discussion, we learned that the speed limit restriction is rarely used in this context. Whereas, lane closures are commonly used and have been implemented in historical post-earthquake bridge recovery processes (California Department of Transportation, 2020). The specific number of closed lanes depends on the damage severity and the number of lanes available under normal conditions. Weight restrictions are typically not applied immediately after an earthquake. They are more commonly used during the reopening phase when a bridge is structurally safe, yet there are secondary components under repair that reduce its load-carrying capacity. Based on the above information, two possible functionality-impairing decisions are incorporated: lane closures and weight restrictions. The overarching goal of the bridge post-earthquake recovery process is to reopen as quickly and completely as possible. A lane closure decision can be made either immediately after the post-earthquake inspection or during the reopening process. If a bridge is not severely damaged, complete lane closure is not necessary. A weight restriction is usually placed during the reopening process but not implemented during the initial response phase. To summarize, if a bridge is structurally safe but its serviceability is compromised, it is reopened with partial lane restrictions (initially and during reopening) and weight restrictions (only during reopening).
Based on the discussions with Caltrans officials, two sets of bridge FSs are considered depending on the phase of the bridge recovery. These states are defined in Table 2 and illustrated in Figure 3. The first set of states (i.e. FS1, FS2, FS3, and FS7) can only occur during the initial response stage. These four FSs are defined based on lane availability. For slight damage (e.g. cosmetic damage in a column or abutment), bridge functionality is typically not impaired (i.e. no lanes are closed during the repairs) and the bridge is taken to be in the FS1: “fully functional,” state. However, based on discussions with Caltrans, the repair schedule for a slightly damaged bridge can be placed in the same category as “routine maintenance,” which can take years to repair or may never be repaired due to the lack of funding. A moderately damaged bridge typically requires fewer lanes to be closed compared to when there is extensive damage. In the case of the former, FS2 is assigned, which corresponds to moderate lane closure, whereas FS3 is specified as extensive lane closure when there is significant damage. If a bridge collapses or is deemed irreparable, then the adjoining roadways are taken to be completely closed. This leads to FS7 (complete closure). This FS7 state will last until the replacement of a bridge is completed, without a reopening phase. In addition to FS1-3 and FS7, there is an “intact” state (indicated in the footnote of Table 2), which corresponds to the case where the bridge is either undamaged or fully repaired. This state is used to emphasize the fact that an “intact” bridge is in FS1 (“fully functional”), but a fully functional bridge may still have cosmetic damage and hence may not be fully repaired (intact).
Bridge functionality states definitions a
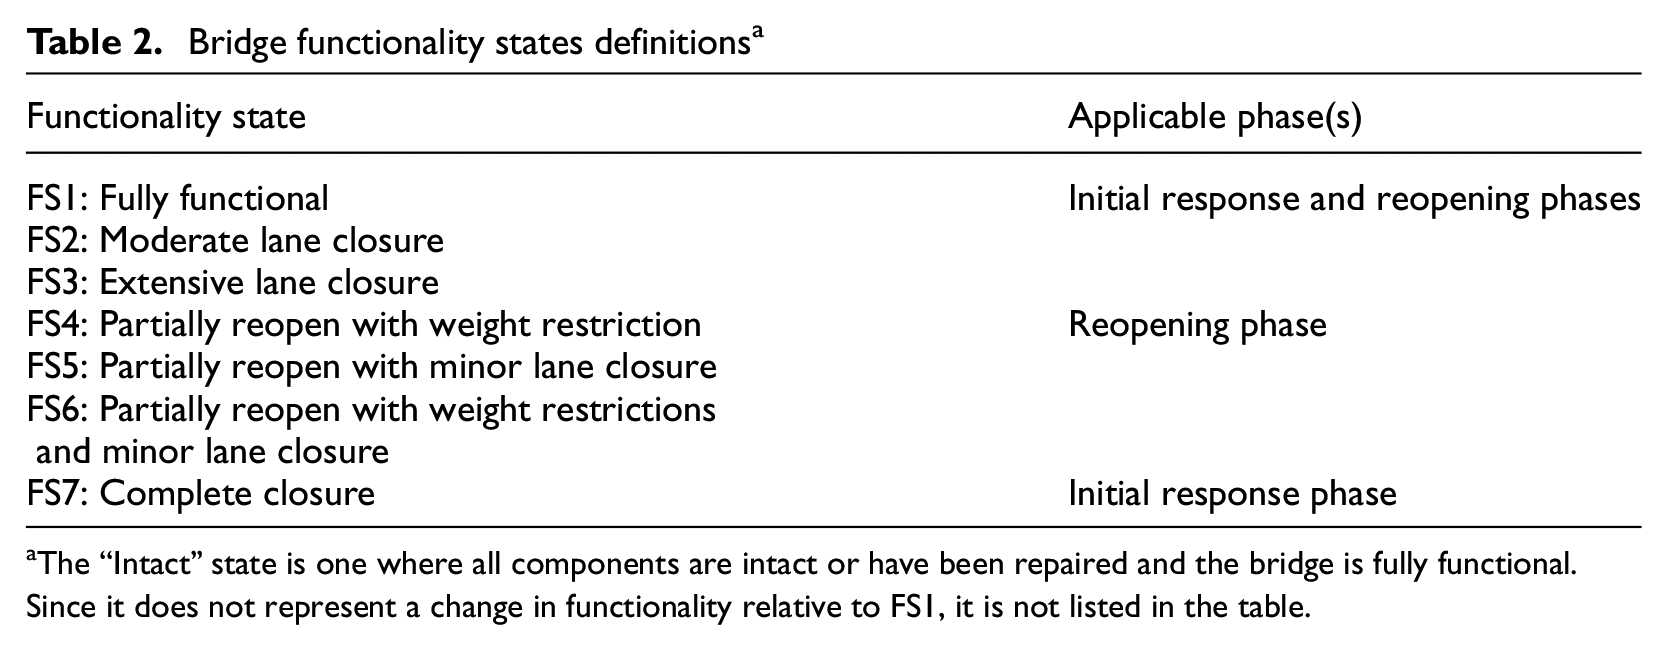
The “Intact” state is one where all components are intact or have been repaired and the bridge is fully functional. Since it does not represent a change in functionality relative to FS1, it is not listed in the table.
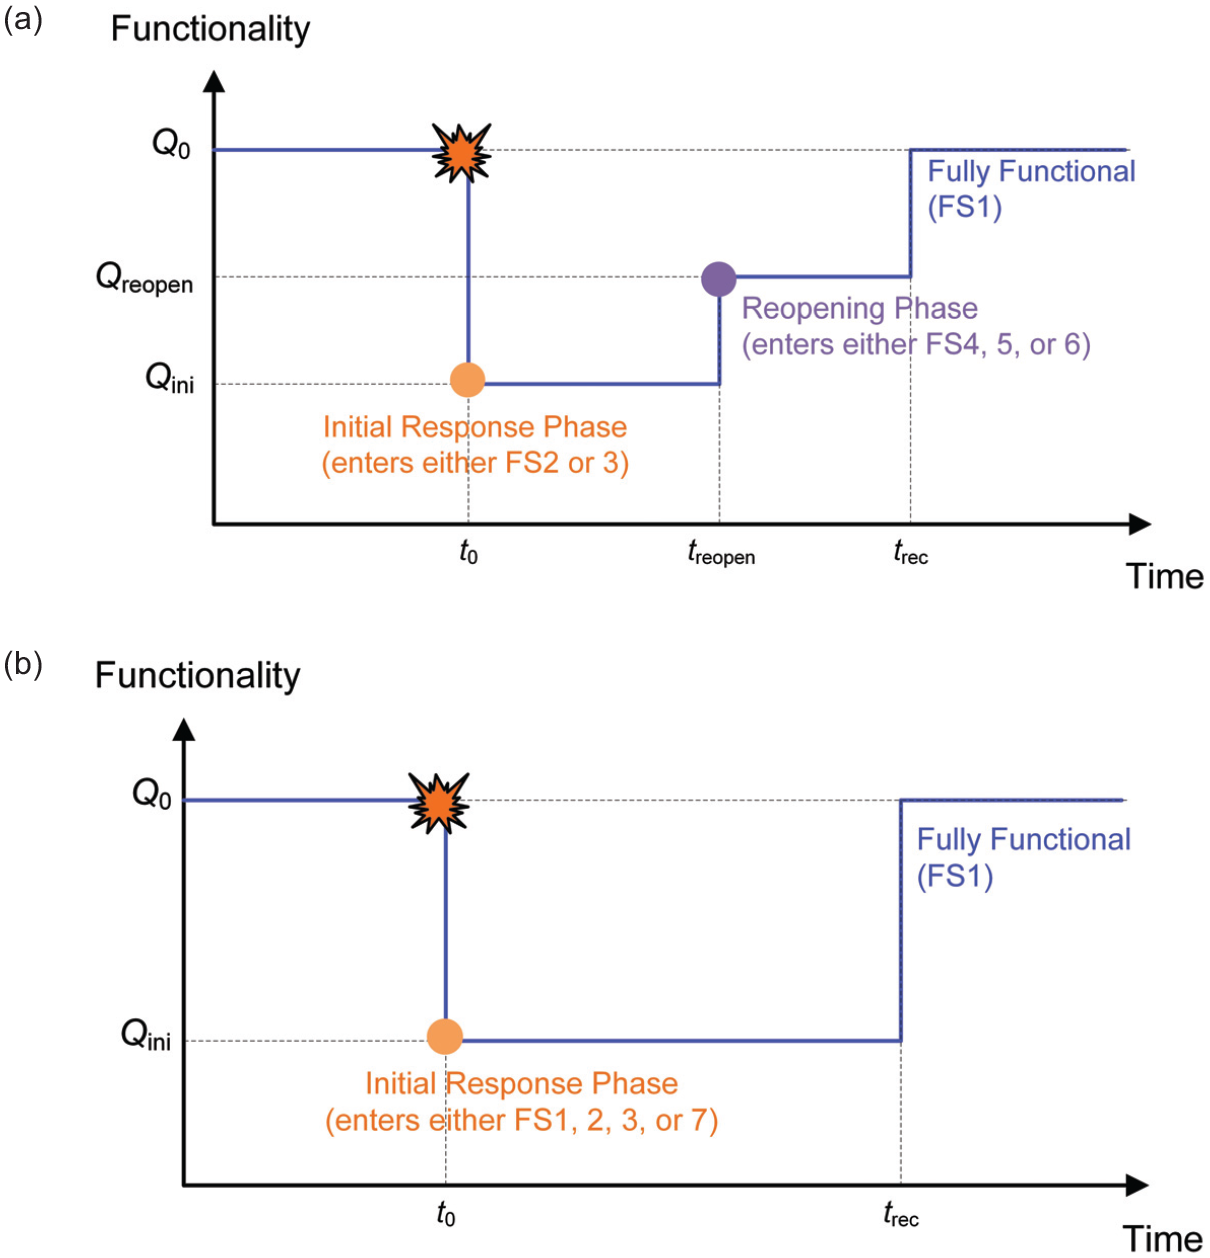
Schematic representation of bridge recovery trajectory: (a) With and (b) Without a reopening phase.
To accelerate the reopening process, when all primary components have been repaired but there are secondary components that still require repairs, a bridge can be partially reopened. To capture this condition, a second set of FSs, which are exclusive to the reopening stage, are defined. They include FS4 (reopen with weight restrictions), FS5 (reopen with minor lane closure), and FS6 (reopen with weight restriction and minor lane closure). The reopening decisions are made based on the damage state of the secondary components including the superstructure, abutment components, and approach slab. It is possible that none of the three reopening FSs are realized during the recovery, and the bridge remains in FS1, FS2, or FS3 during the reopening phase. The reopening phase decision algorithm is discussed later.
Lane closure probabilities
According to the defined FSs, a bridge can have partial lane closure either during the initial response or the reopening stage. There are four FSs, FS2, FS3, FS5, and FS6, that are associated with partial lane closure. A bridge in FS2 (moderate lane closure) is taken to have approximately 25% of its lanes closed. For a bridge in FS3 (extensive lane closure), a 75% lane closure is used (Hart et al., 2024). Compared to the initial response phase, fewer lanes are closed during the reopening phase. Based on the information obtained from Caltrans officials, Table 3 specifies the probability mass functions (PMFs) for the lane closure extents for each relevant FS and number of lanes under normal operating conditions.
Lane closure PMFs for California bridges
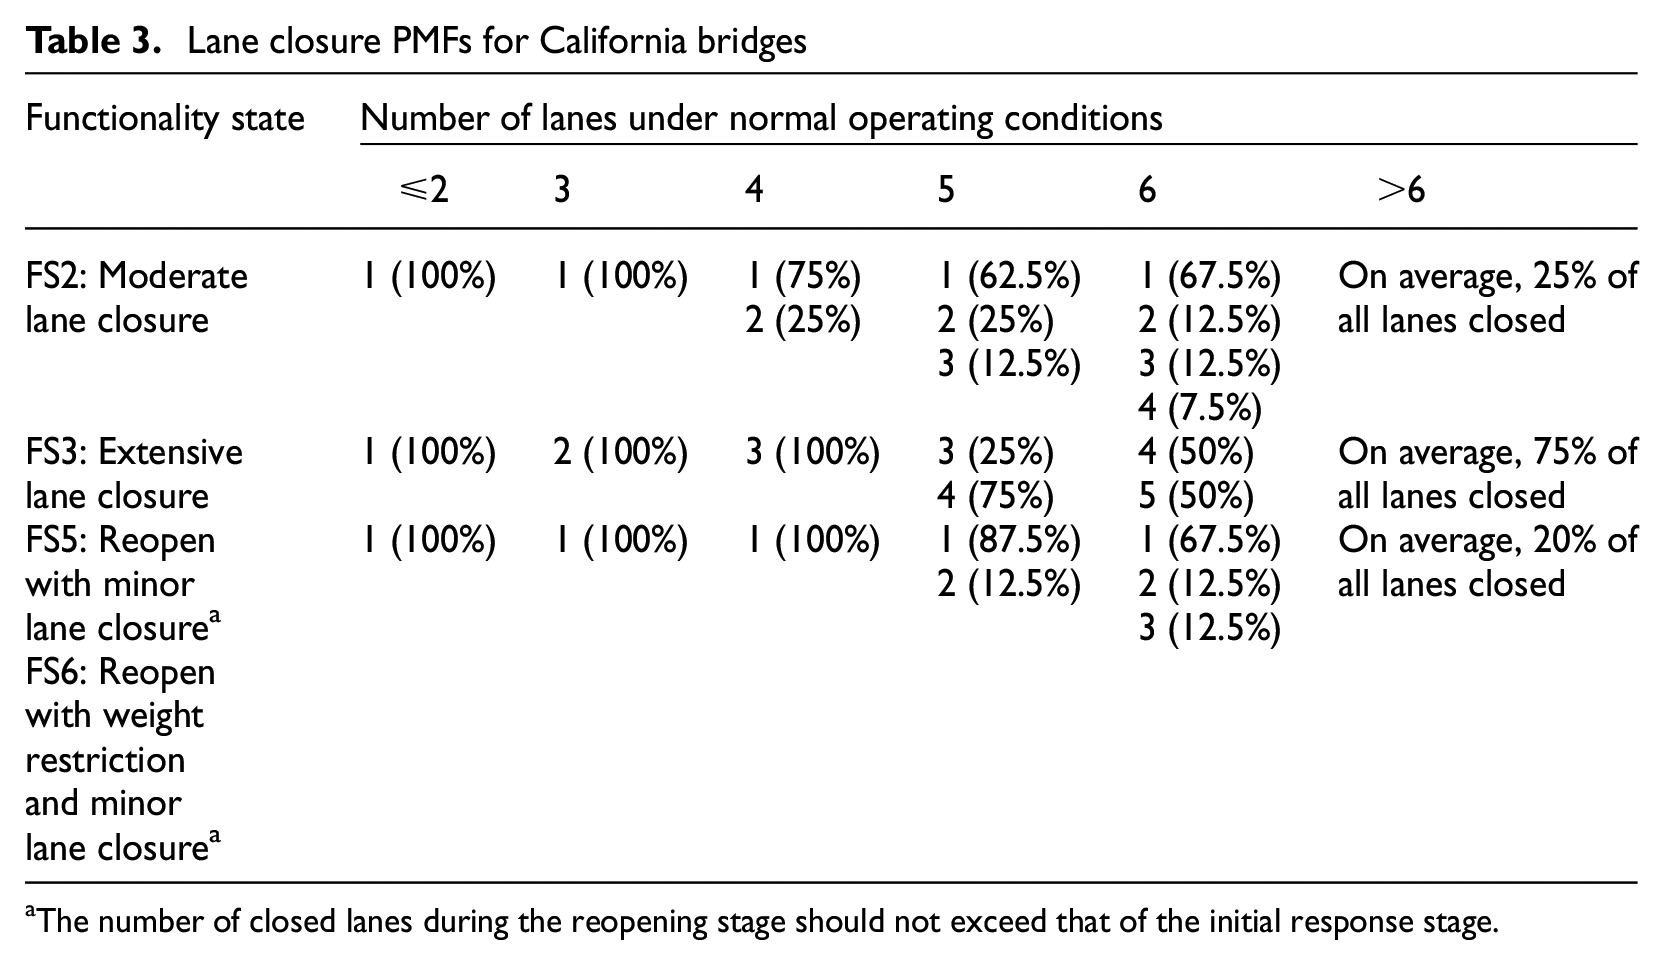
The number of closed lanes during the reopening stage should not exceed that of the initial response stage.
Repair class
The bridge FS is defined at the system level. To relate the component damage distribution to the system-level state, we adopt the repair class (RC) concept introduced in the REDi methodology (Almufti and Merrifield, 2013). The repair class for each component type indicates the extent to which damage to that component can impede the bridge’s functionality. The FS during the initial response phase is based on the worst-case repair class among all components, as shown in Table 4. The bridge system damage state, which is used as a measure of overall damage, is also included because it determines the sequencing and composition of the impeding factors and their duration distribution (discussed in the Impeding Factor Module). In Table 4, the one-to-one mapping from component RC to bridge system damage and FSs are shown. A smaller RC corresponds to a less severe system damage state and functionality reduction, and vice versa.
Relationship between component repair class and system functionality and damage states during the initial response phase
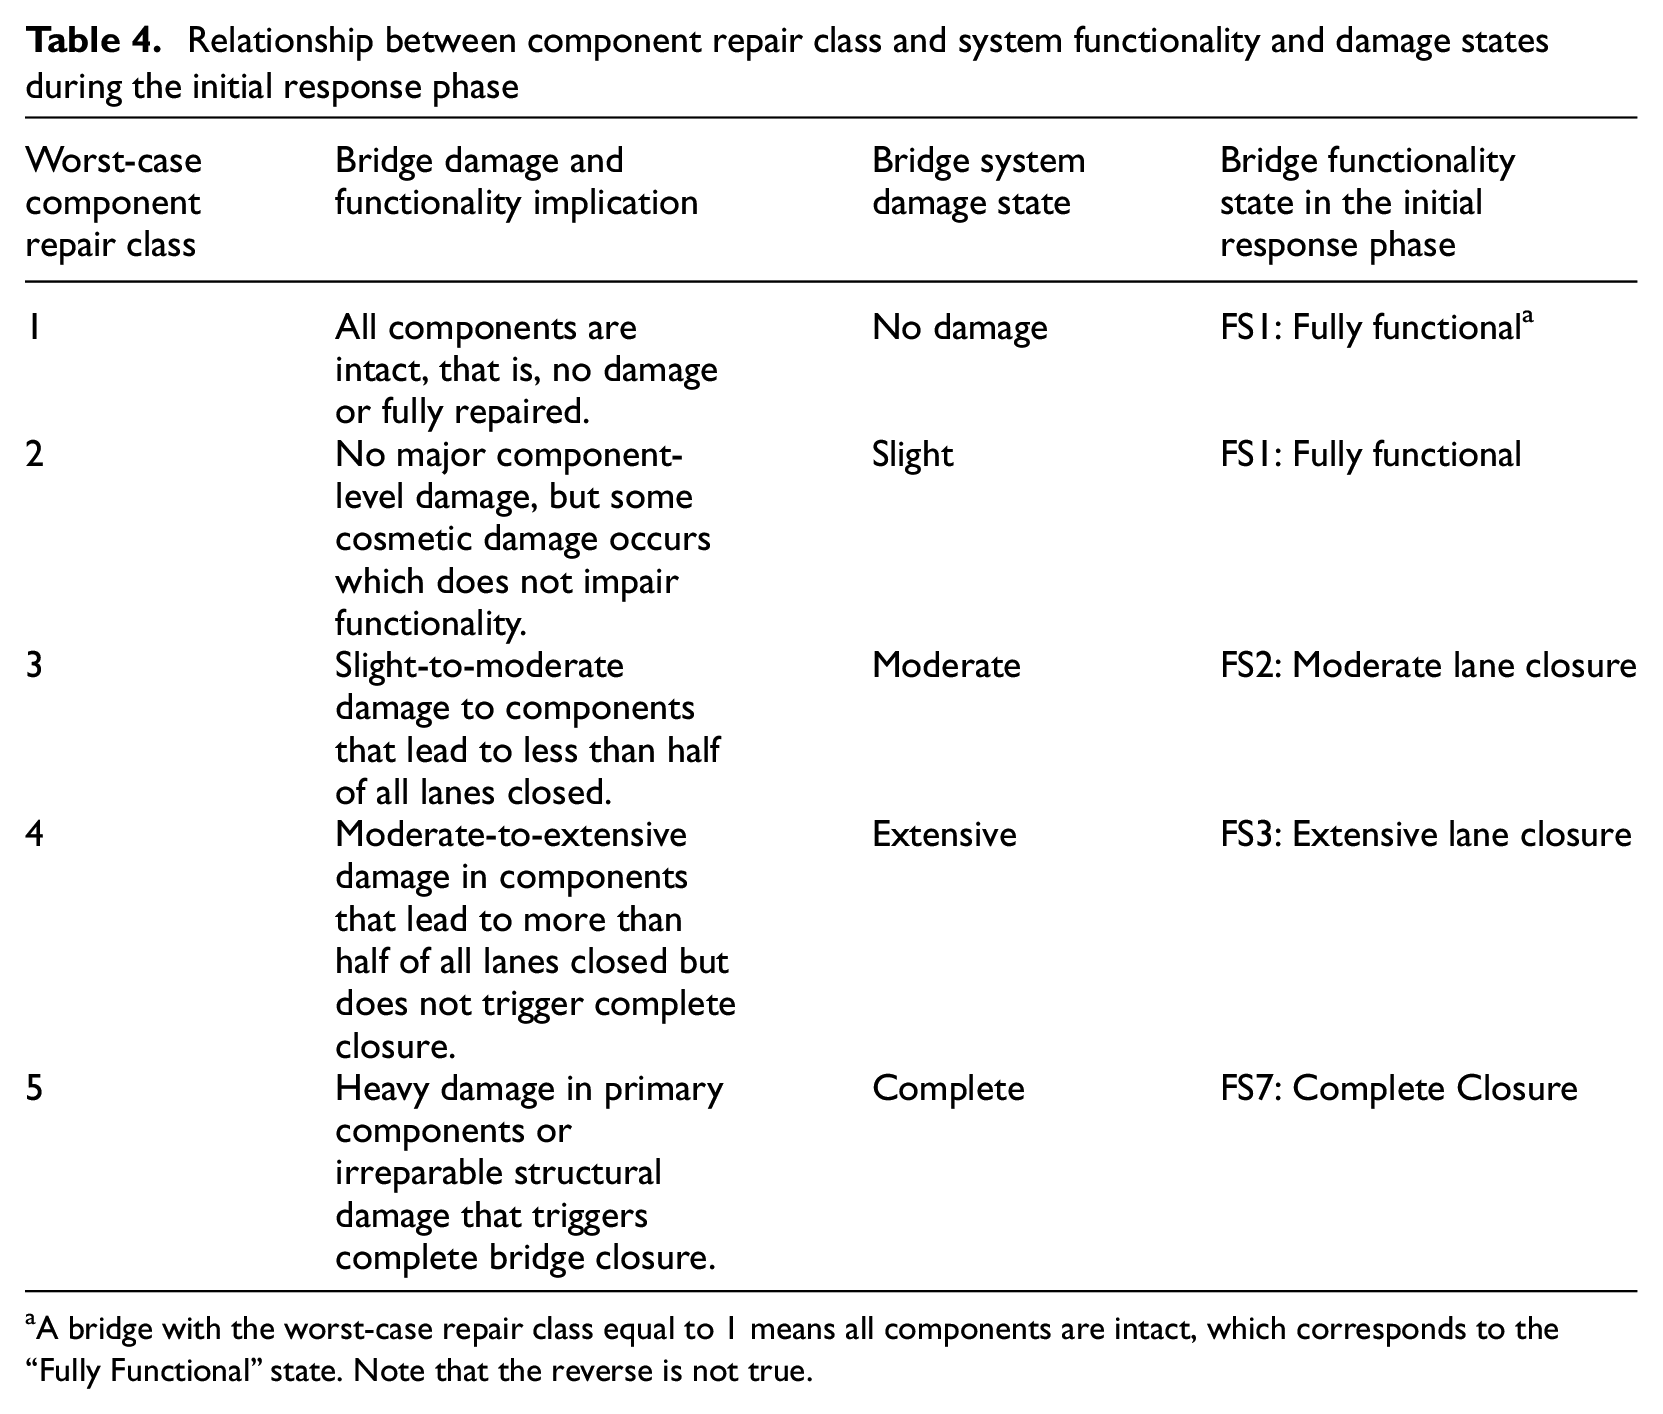
A bridge with the worst-case repair class equal to 1 means all components are intact, which corresponds to the “Fully Functional” state. Note that the reverse is not true.
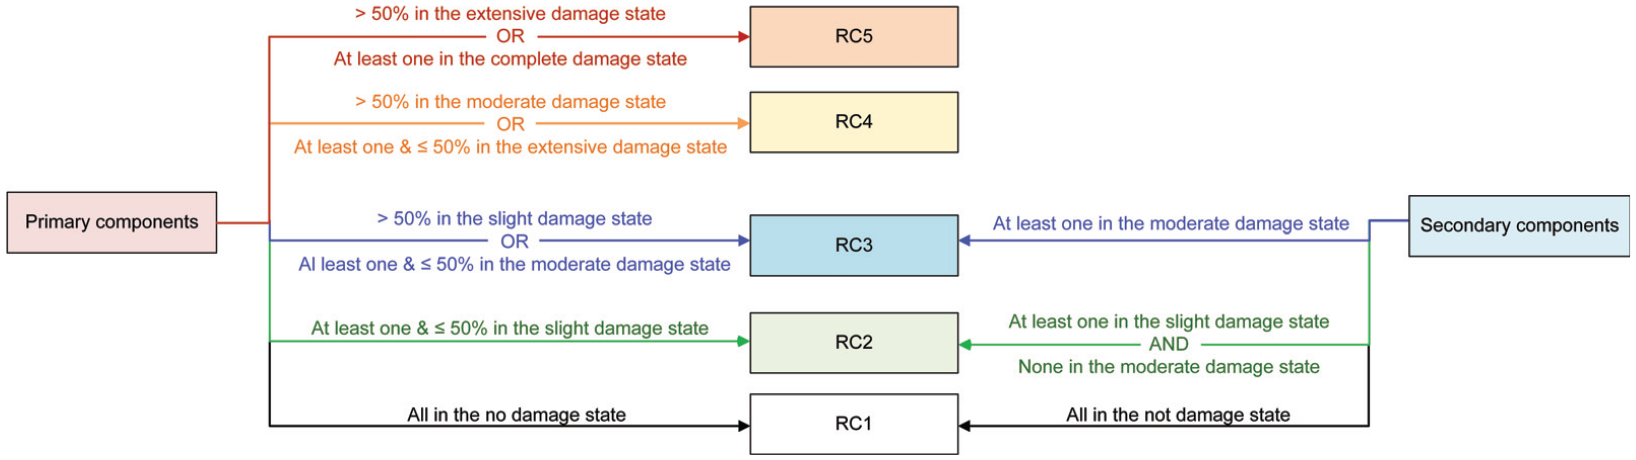
Figure 4 illustrates the criterion for assigning repair classes based on a component’s criticality, damage state, and damage quantity. In general, a more important component with a large amount of severe damage is assigned a higher RC, resulting in a more detrimental effect on the bridge functionality.
Criteria for assigning component repair classes to California bridges.
To illustrate the repair class assignment, consider a bridge with three out of four columns in the moderate damage state, and one with slight damage. There is also one column foundation and two sets of bearing that are moderately damaged. All other components are assumed to be intact. In this situation, the column is assigned to RC4, and the column foundation and bearing types are in RC2 and RC3, respectively. Therefore, the worst-case repair class, which is RC4, results in an extensive system-level damage state and places the bridge in FS3 (extensive lane closure). Note that the RC assignments were informed by the discussions with Caltrans (Hart et al., 2024; Yen et al., 2023) but can be adjusted to capture local practices based on the relevant jurisdiction and engineering judgment.
Reopening decision tree: rules for determining the FS during the reopening phase
The goal of the reopening phase is to minimize the time during which the bridge functionality is impeded without compromising safety. If a bridge is structurally safe but its serviceability is compromised, its closed lanes can be partially reopened with limited functionality. Note that a bridge does not necessarily undergo the reopening phase before it becomes fully functional. Specifically, the reopening phase is only triggered when all of the following three conditions are satisfied:
At least one primary component is in RC3 or RC4 such that functionality is impaired due to repairable damage from a primary component.
After all primary components have been repaired based on the sequencing introduced later in the article, at least one secondary component is in RC3 and impairs functionality.
The bridge is deemed to be repairable (otherwise, it will not be reopened until the demolition and replacement work are completed).
If the reopening phase is not triggered, the bridge will maintain the initial response state until it is restored to the fully functional state.
Two potential restrictions are considered during the reopening phase: a weight restriction and a minor lane closure. During reopening, a bridge can enter one of the three FSs that are exclusive to this stage (i.e. FS 4 through 6) if the aforementioned three conditions that trigger reopening are satisfied.
The decision tree shown in Figure 5 is used to determine the FSs during the reopening stage. Probabilities are assigned to leaf nodes to indicate the likelihood of entering each state. These probabilities are informed by the interviews with a California bridge engineer with over 30 years of experience (Law, 2024). In general, if a superstructure-related component (i.e. girder-deck, in-span share key, bearing, or joint seal) or an approach slab is under repair and in RC3, it is more likely that a weight restriction and a minor lane restriction will be imposed at the same time. If this situation does not hold, but an abutment-related component (i.e. abutment joint seal, backwall, shear key, or bearing) is under repair and in RC3, there is a higher chance that only a weight restriction will be placed.
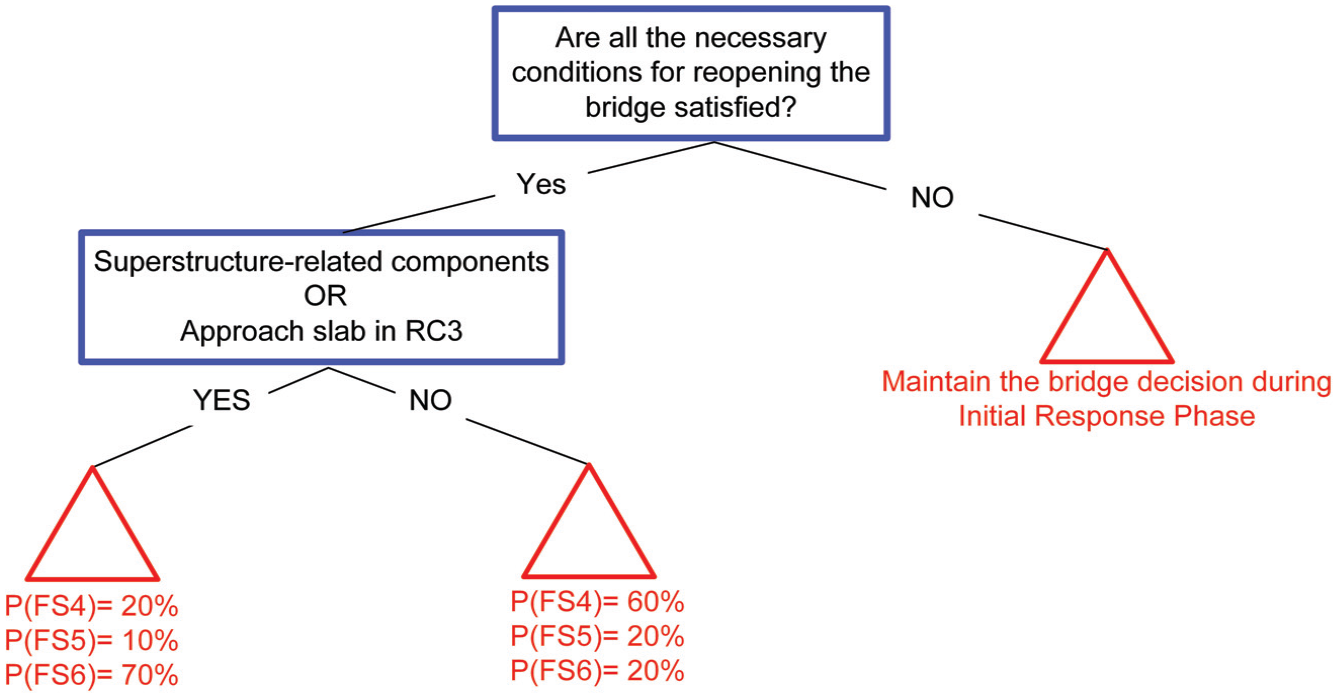
Decision tree used to determine the reopening stage FSs for California bridges.
Impeding factor module
Experience from prior earthquakes and discussions with Caltrans reveal that the repair/replacement time delay for a significantly damaged bridge is often minimal. This is attributed to organizational efforts that seek to minimize disruptions to the transportation network and the use of emergency protocols. For example, after the 1994 Northridge earthquake, the Governor of California signed an emergency executive order to accelerate the bid-solicitation procedures. Caltrans used incentive and disincentive clauses in the bridge repair and reconstruction agreements to reward early completion and penalize delays (Wise, 1994). In contrast, the emergency protocol is never used for slightly damaged bridges and is rarely used for moderate damage. Therefore, bridges with low-to-moderate levels of damage always have longer repair time delays compared with those that experience severe damage. This can be contrasted with the impeding factor duration calculation in building assessment frameworks (Almufti and Merrifield, 2013; Molina Hutt et al., 2022; Terzic et al., 2021) where the time delays for minimal damage are typically shorter.
Many of the existing bridge downtime estimation frameworks (e.g. Padgett and DesRoches, 2007; Terzic et al., 2021) did not consider the delays due to impeding factors and assume the repair or replacement activities are initiated immediately after an earthquake. This assumption leads to underestimated recovery durations. As noted earlier, Karamlou and Bocchini (2017a) used the concept of “idle time” to account for factors that delay the start of repairs. However, the specific factors (or activities) and their sequencing and durations were not explicitly considered. There is also no existing impeding factor database (neither sequencing nor duration) tailored to bridge recovery assessment. REDi (Almufti and Merrifield, 2013) was among the first to provide a comprehensive impeding factor database for buildings with duration parameters and sequencing informed by expert opinions. Specifically, the following six impeding factors were considered: inspection, engineering mobilization and review/re-design, financing, contractor mobilization, permitting, and procurement of long-lead time components. These impeding factors (including the sequencing) have been adopted in subsequent functional recovery models with minor modifications (Federal Emergency Management Agency, 2022; Molina Hutt et al., 2022; Terzic et al., 2021).
The impeding factor module in the proposed framework is informed by the expert interviews (Hart et al., 2024; Law, 2024; Powell, 2024; Yen et al., 2023). The durations for the individual impeding factors are sampled and ordered based on the predefined sequencing to obtain the total time delays. The following six impeding factors are identified as being relevant to post-earthquake functional recovery of bridges: initial inspection, in-depth inspection, financing, design, permitting, and contractor acquisition.
Although some of the adopted impeding factors have been used for building assessments, they may have different implications, ranges, and sequencing. For example, the building owner needs to consult a structural engineer if there is visible damage or have an engineer on contract to perform any necessary re-designs. Whereas for damaged bridges, Caltrans has in-house engineers that are responsible for most of the bridge re-designs. As such, the engineering mobilization process defined as the time delay that is spent on hiring designers and familiarizing them with the design requirements, is expected to be short and is therefore merged with the design delay. Where permitting is required, a building owner typically needs to acquire approval of the repair strategy from the local building jurisdiction. Whereas for damaged bridges, permitting is not required if they are completely located within the Caltrans jurisdiction. However, if the bridge crosses a jurisdiction managed by a non-Caltrans agency, permitting may be required. The upper and lower bounds of the impeding factor duration parameters are shown in Table 5, as a function of the bridge system damage states described in Table 4.
Recommended impeding factor duration bounds for California bridges
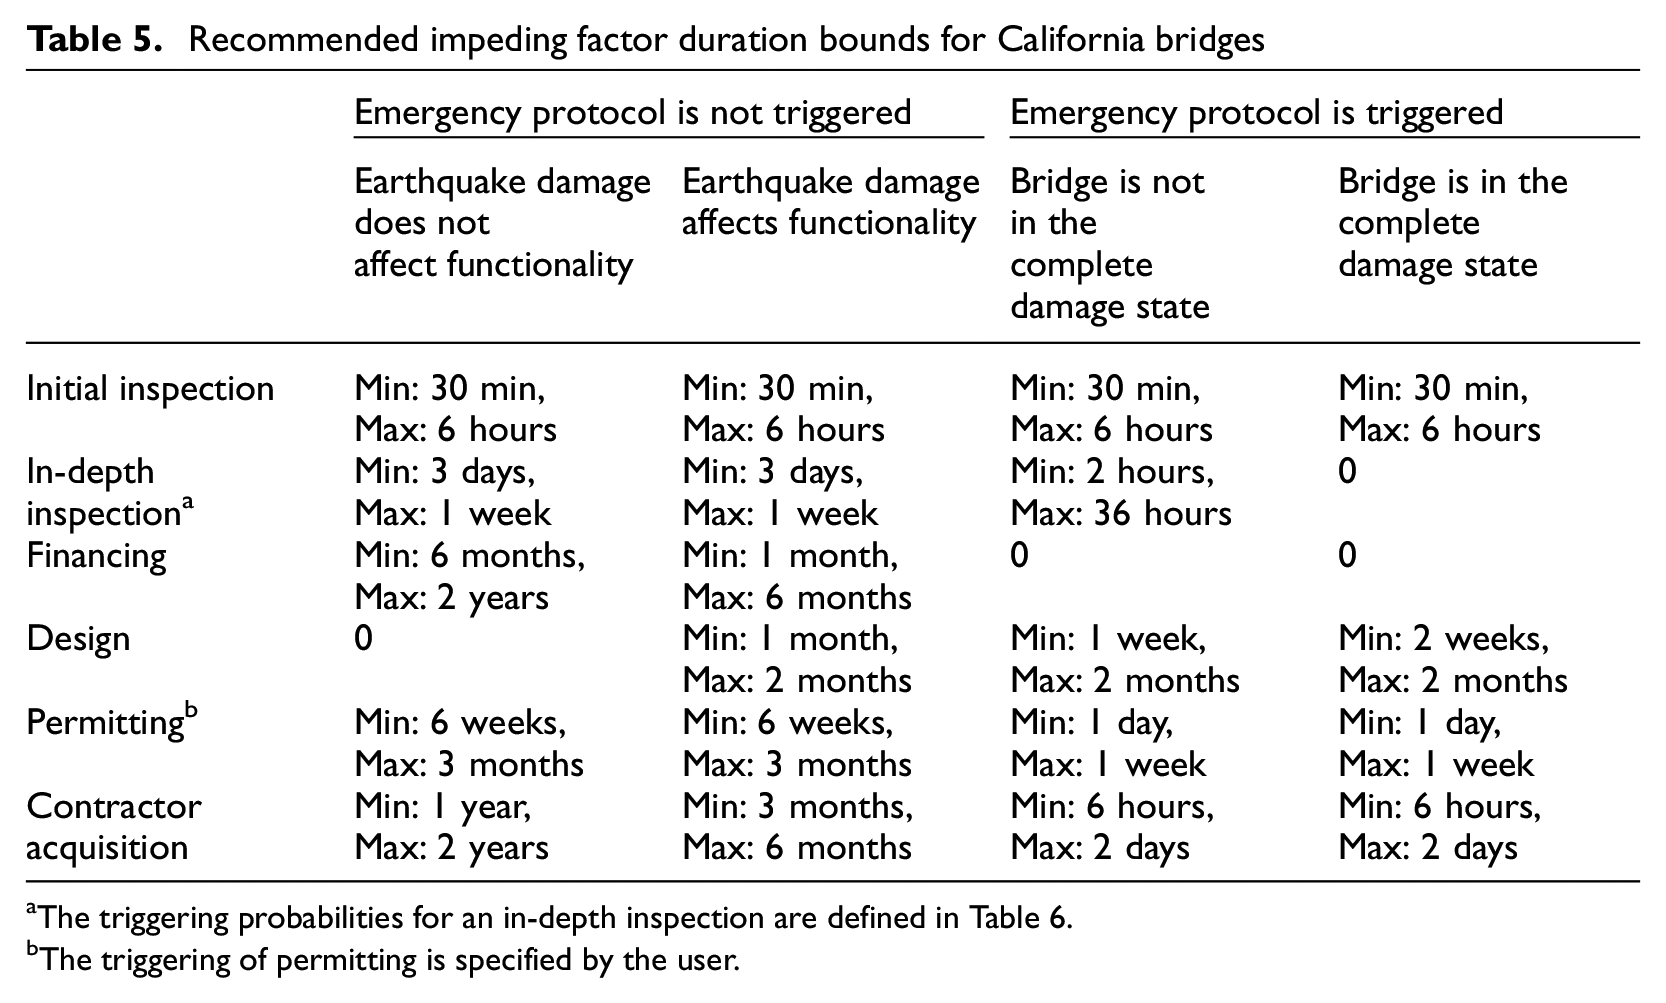
The triggering probabilities for an in-depth inspection are defined in Table 6.
The triggering of permitting is specified by the user.
The impeding factor sequencing shown in Figure 6 is based on the results of the expert interviews (Hart et al., 2024; Law, 2024; Yen et al., 2023). Immediately after an earthquake, the bridge is examined through an initial inspection to visually determine the extent of damage. If the damage is difficult to identify with the naked eye, an in-depth inspection is requested. During the in-depth inspection, the bridge is thoroughly examined, which requires more time than the initial inspection. If post-earthquake inspections are simultaneously requested for a large number of bridges, this can result in further delays. The bridge closure decision is made after the in-depth inspection is completed. Depending on the extent of damage, Caltrans determines whether to initiate the emergency protocol, which influences the duration parameter values for all impeding factors, and the sequencing of the following four impeding factors: financing, design, contractor acquisition, and permitting.
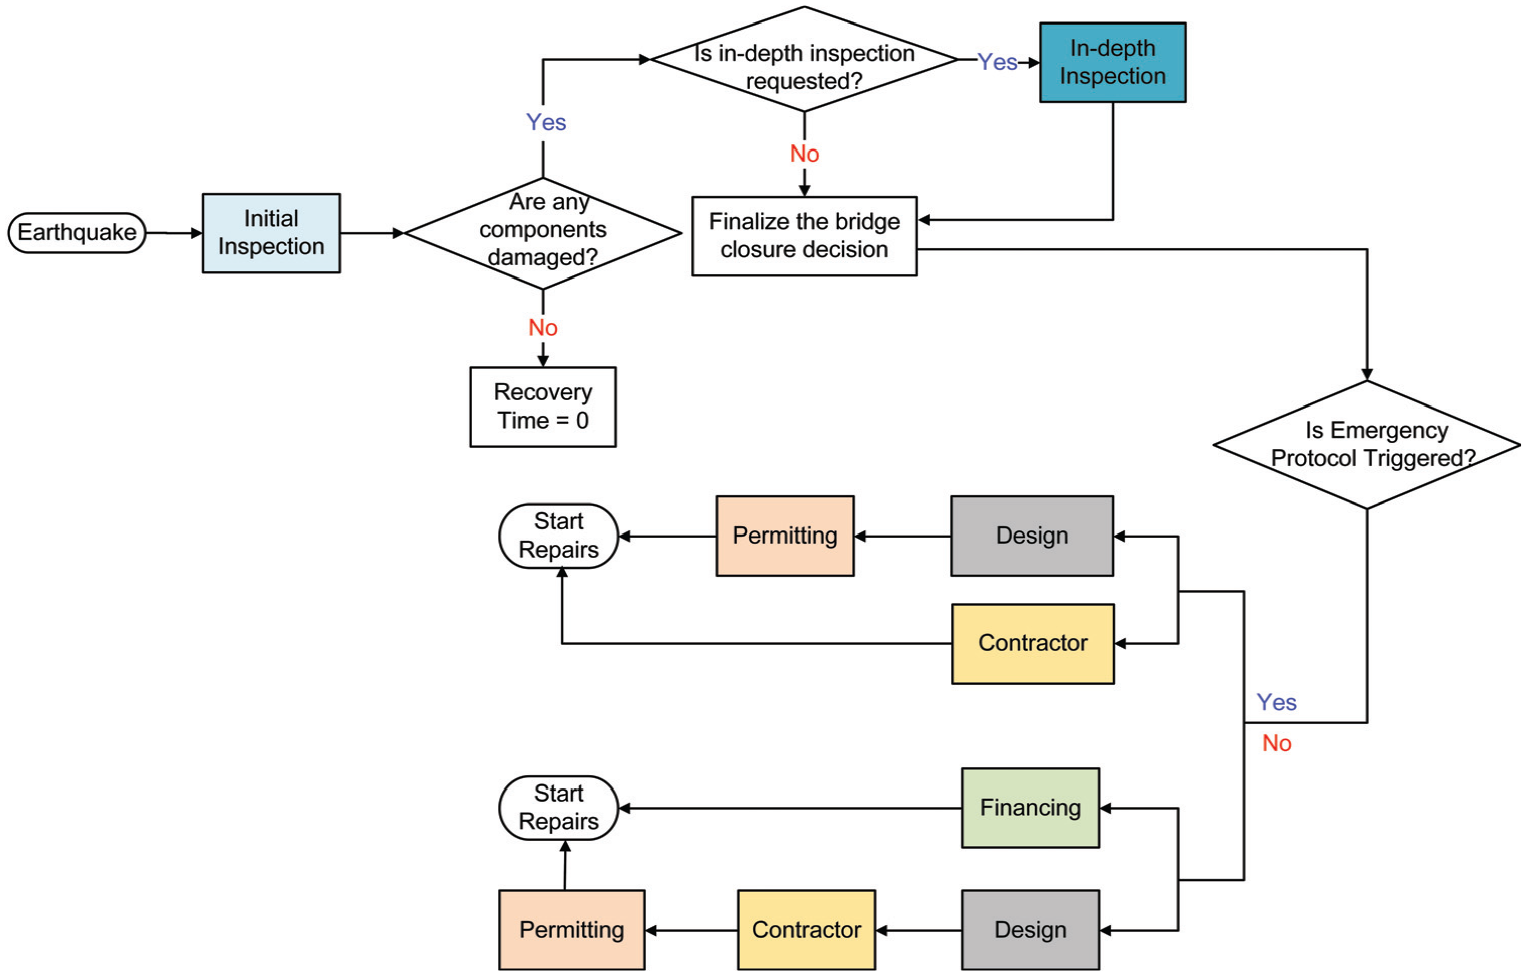
Impeding factors sequencing for California bridges.
If the emergency protocol is not initiated, the contractor acquisition will not start until the design is completed. This is because engineering drawings, project plans, and the estimated material quantities are a part of the bid documents (California Department of Transportation, 2024a). The acquisition of financing is conducted concurrently with the design, contractor acquisition, and permitting (if needed). Whereas, if a bridge is reported to have significant damage, the emergency protocol is initiated, and the review and bidding can be waived or expedited. In this situation, the financing approval procedure is waived, and the emergency funding is initiated. Two impeding factors, namely design, and contractor acquisition occur concurrently, because Caltrans will engage with contractors in the early design phase, circumventing the normal bidding procedure. In some cases, contractors may even assist with the design. If needed, the permitting process is initiated after the design is completed and the duration is expected to be minimal. The detailed description of each impeding factor is presented in the next few subsections. The descriptions are based on the results of the expert interviews and documents published by Caltrans.
Initial inspection
After an earthquake, Caltrans immediately dispatches its District Bridge Maintenance Crew (BMC) to conduct an initial inspection. The goal of this stage is to determine whether a bridge has sustained structural damage and if it is repairable. The BMC also decides whether they need to request the Structural Maintenance and Investigations (SM&I) team for an in-depth inspection. This happens when the BMC visually detects damage, but they are unsure about the extent of that damage.
After the initial inspection, the BMC assigns a bridge to one of the following three categories: (1) If there is no damage or the damage is cosmetic, the bridge is reopened immediately; (2) When the damage is obviously significant, the bridge is partially or completely closed without requesting a follow-up in-depth inspection; (3) If the damage appears to be significant but it is less obvious, the bridge is partially or completely closed and an in-depth inspection request is sent. Since the initial inspection process is straightforward and superficial, it can be completed within 6 hours.
In-depth inspection
The in-depth inspection is triggered when it is requested by the BMC and involves a comprehensive evaluation of every bridge component by the SM&I team. This process could include extracting concrete core samples, sending the samples to a laboratory, and awaiting the test results. The purpose of the in-depth inspection is to thoroughly assess the extent of bridge damage when it is difficult to determine visually, finalize the bridge closure decision, and determine the subsequent repair actions.
The duration of the in-depth inspection can vary significantly, ranging from a few hours to a week, depending on the severity of damage reported by the BMC, the availability of engineers from the SM&I, and how the damage impacts traffic. If there is a demand surge for bridge inspectors after a major event, the queuing time may be longer. If many bridges are damaged after a large earthquake and the demand for inspectors exceeds capacity, Caltrans prioritizes the inspection based on the importance of roadways and the extent of damage.
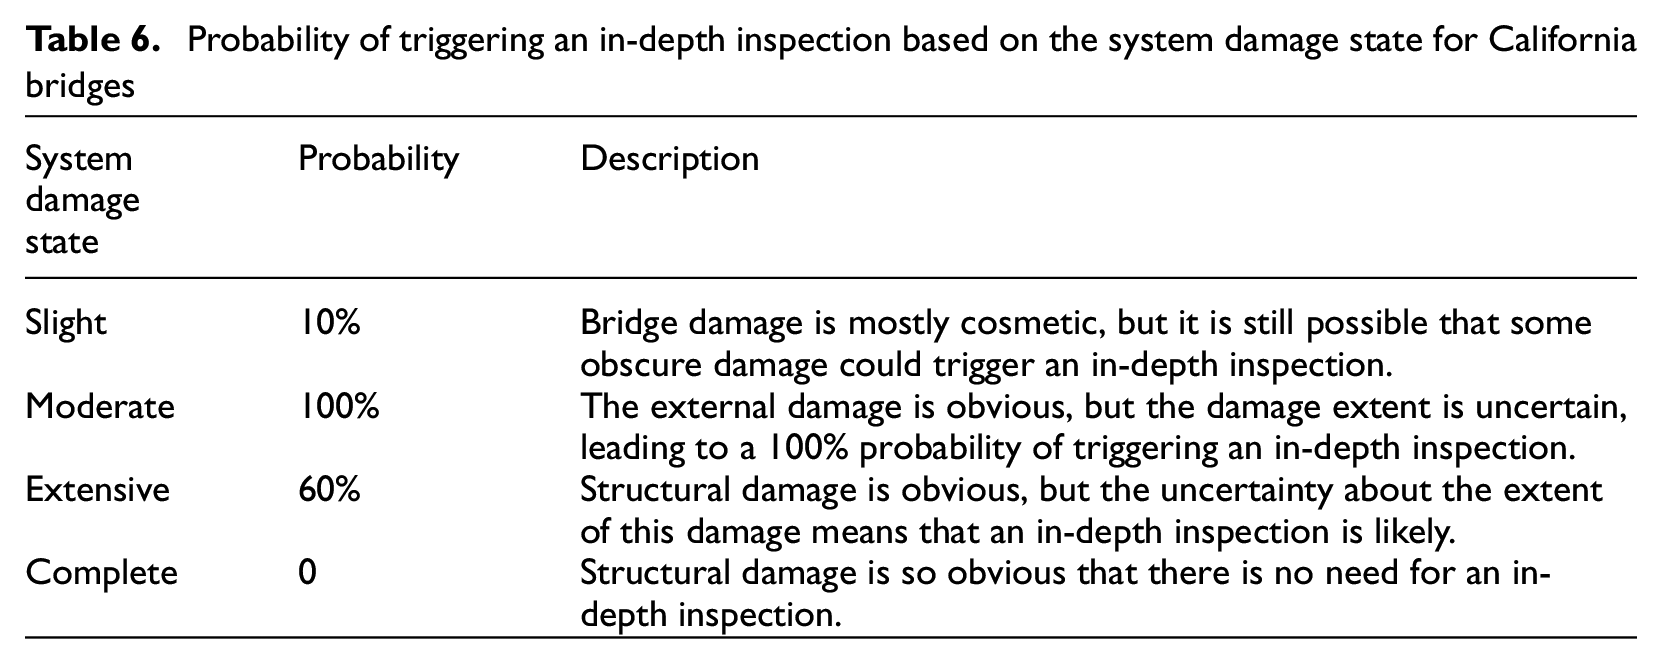
The rules for triggering an in-depth inspection based on the bridge system damage state are specified in Table 6. The “slight” state implies that the damage appears cosmetic. However, it is still possible that there is significant but visually undetectable damage. For this reason, a low probability is assigned (10%) that an in-depth inspection is requested. For the “moderate” state, the external damage is obvious, but it is difficult to evaluate the internal damage with the naked eye. In such cases, an in-depth inspection is always requested. For the “extensive” state, structural damage is visible, but the extent of internal damage may not be completely determined from a visual inspection. Therefore, a 60% probability of triggering an in-depth inspection is specified. The severity of damage in the “complete” state is obvious, which makes an in-depth inspection unnecessary.
Probability of triggering an in-depth inspection based on the system damage state for California bridges
Design
For the most part, Caltrans uses in-house engineers to re-design individually damaged components or the whole bridge (in the event that replacement is needed). However, sometimes part of this work is assigned to external design consultants to supplement their in-house capacity. The design duration in a post-earthquake context accounts for the time needed for the engineers to familiarize themselves with the specific damage situation, perform the necessary calculations, prepare drawings, and finalize the design scheme. The duration for re-designing an entire bridge is longer than when only some damaged components require re-design. There is no design needed for a bridge with only cosmetic damage.
Acquisition of financing
Caltrans is able to access emergency state funds when bridges are subjected to extreme external disruptions (U.S. Department of Transportation, 2019). In addition to these emergency state funds, Caltrans may request funding from the Emergency Relief Program administered by the U.S. Department of Transportation which was designed to help states rapidly restore affected infrastructure under extraordinary conditions (Governor of California, 2023). The duration spent on funding acquisition is waived when the emergency protocol is initiated. For minimal-to-moderate damage, it is rare to access emergency funding. For the proposed model, we assume emergency funds are unavailable in such cases. The process of acquiring non-emergency funds is managed by the Caltrans State Highway Operation and Protection Program (SHOPP) (California Department of Transportation, 2024c), which is primarily used for normal repairs and preservation, safety improvements, and some unexpected (but not emergency) disruptions. The funding acquisition from the SHOPP program can take up to 2 years. It is also possible that a bridge with cosmetic damage will never receive funds for repairs due to fiscal challenges. Therefore, the time delay in acquiring funds under normal circumstances dominates the total time delays.
Permitting
Caltrans typically does not require external review and approval for post-earthquake repairs. However, permitting is needed when a state-owned damaged bridge crosses some local (e.g. city, county) administrative division. When this occurs, Caltrans has to coordinate with the relevant agency regarding the land use permits, impacts to pedestrians, local businesses and residences, and construction and environmental reviews.
If a permit is needed from another jurisdiction, the time delay depends on whether the emergency protocol is initiated. When the emergency protocol is initiated, the process is streamlined through communications with state and local leadership. For non-emergencies, Caltrans engineers coordinate with local jurisdictions and permits may be obtained within a few weeks or months. The upper and lower bounds for permitting delay are shown in Table 5.
Contractor acquisition
When the emergency protocol is initiated, the Caltrans Division of Procurement and Contracts executes an emergency contract, where the bids can be waived, and a contractor is selected from their internal registry (California Department of Transportation, 2024b). Under these circumstances, it takes 6 hours to 2 days to mobilize contractors without the bidding process.
If the emergency protocol is not triggered, Caltrans secures a contractor through a series of steps. First, a bid solicitation is published based on design documents and other criteria. The contractors then analyze the documents, generate an estimate, and submit bids to Caltrans. These bids are evaluated and a contractor is selected based on several factors, such as the lowest bid, proximity to the damaged bridge, and the willingness to mobilize rapidly. Finally, the selected contractor procures the necessary materials and equipment and mobilizes the required work crews. The entire process can take as much as 1 year.
Repair or replacement duration module
If a bridge is deemed irreparable following an earthquake, it will be demolished and (most likely) replaced. In this case, the total replacement duration is calculated. If a bridge is considered to be repairable, the work crews are dispatched to perform the necessary repairs, and the total repair duration is taken as the aggregation of the component repair durations in accordance with the specified construction sequence. The provided data correspond to cast-in-place or precast concrete bridges and the assumption that the necessary materials and work crews are readily available. If a bridge spans over a channel or creek, the repair or replacement duration will be longer.
Replacement duration of the whole bridge
The adopted replacement durations, which are based on the interviews conducted as part of this study (Hart et al., 2024; Law, 2024; Powell, 2024), are shown in Table 7. The number of spans (
Recommended California bridge replacement durations and required worker numbers a
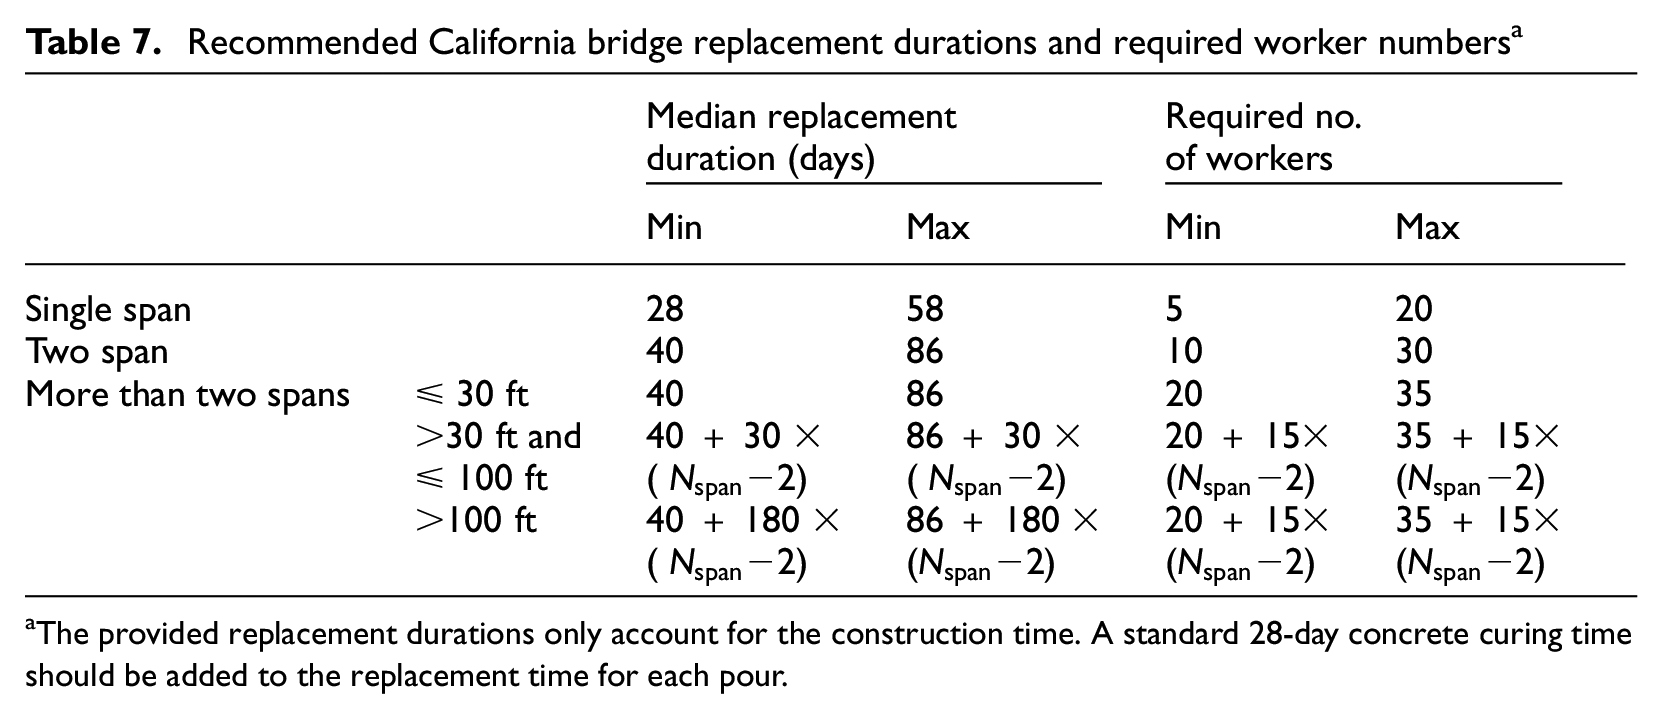
The provided replacement durations only account for the construction time. A standard 28-day concrete curing time should be added to the replacement time for each pour.
The bridge replacement durations specified in Table 7 are based on the standard 8-hours workday assumption. For the case where multiple shifts are used in emergency bridge replacement, an expediting factor,
Repair duration for individual components
Similar to the time delays, the total repair duration is estimated through a two-step procedure that includes sampling the individual component durations and ordering them according to a predefined sequence. Table 8 provides per-unit bridge component repair durations based on the interviews conducted as part of this study (Hart et al., 2024; Law, 2024; Powell, 2024). Lower and upper bounds are provided for each component conditional on the damage state. Repair duration estimates for primary components in the complete damage state are not provided because this would coincide with the entire bridge being replaced.
Recommended per-unit component repair durations for California bridges. a
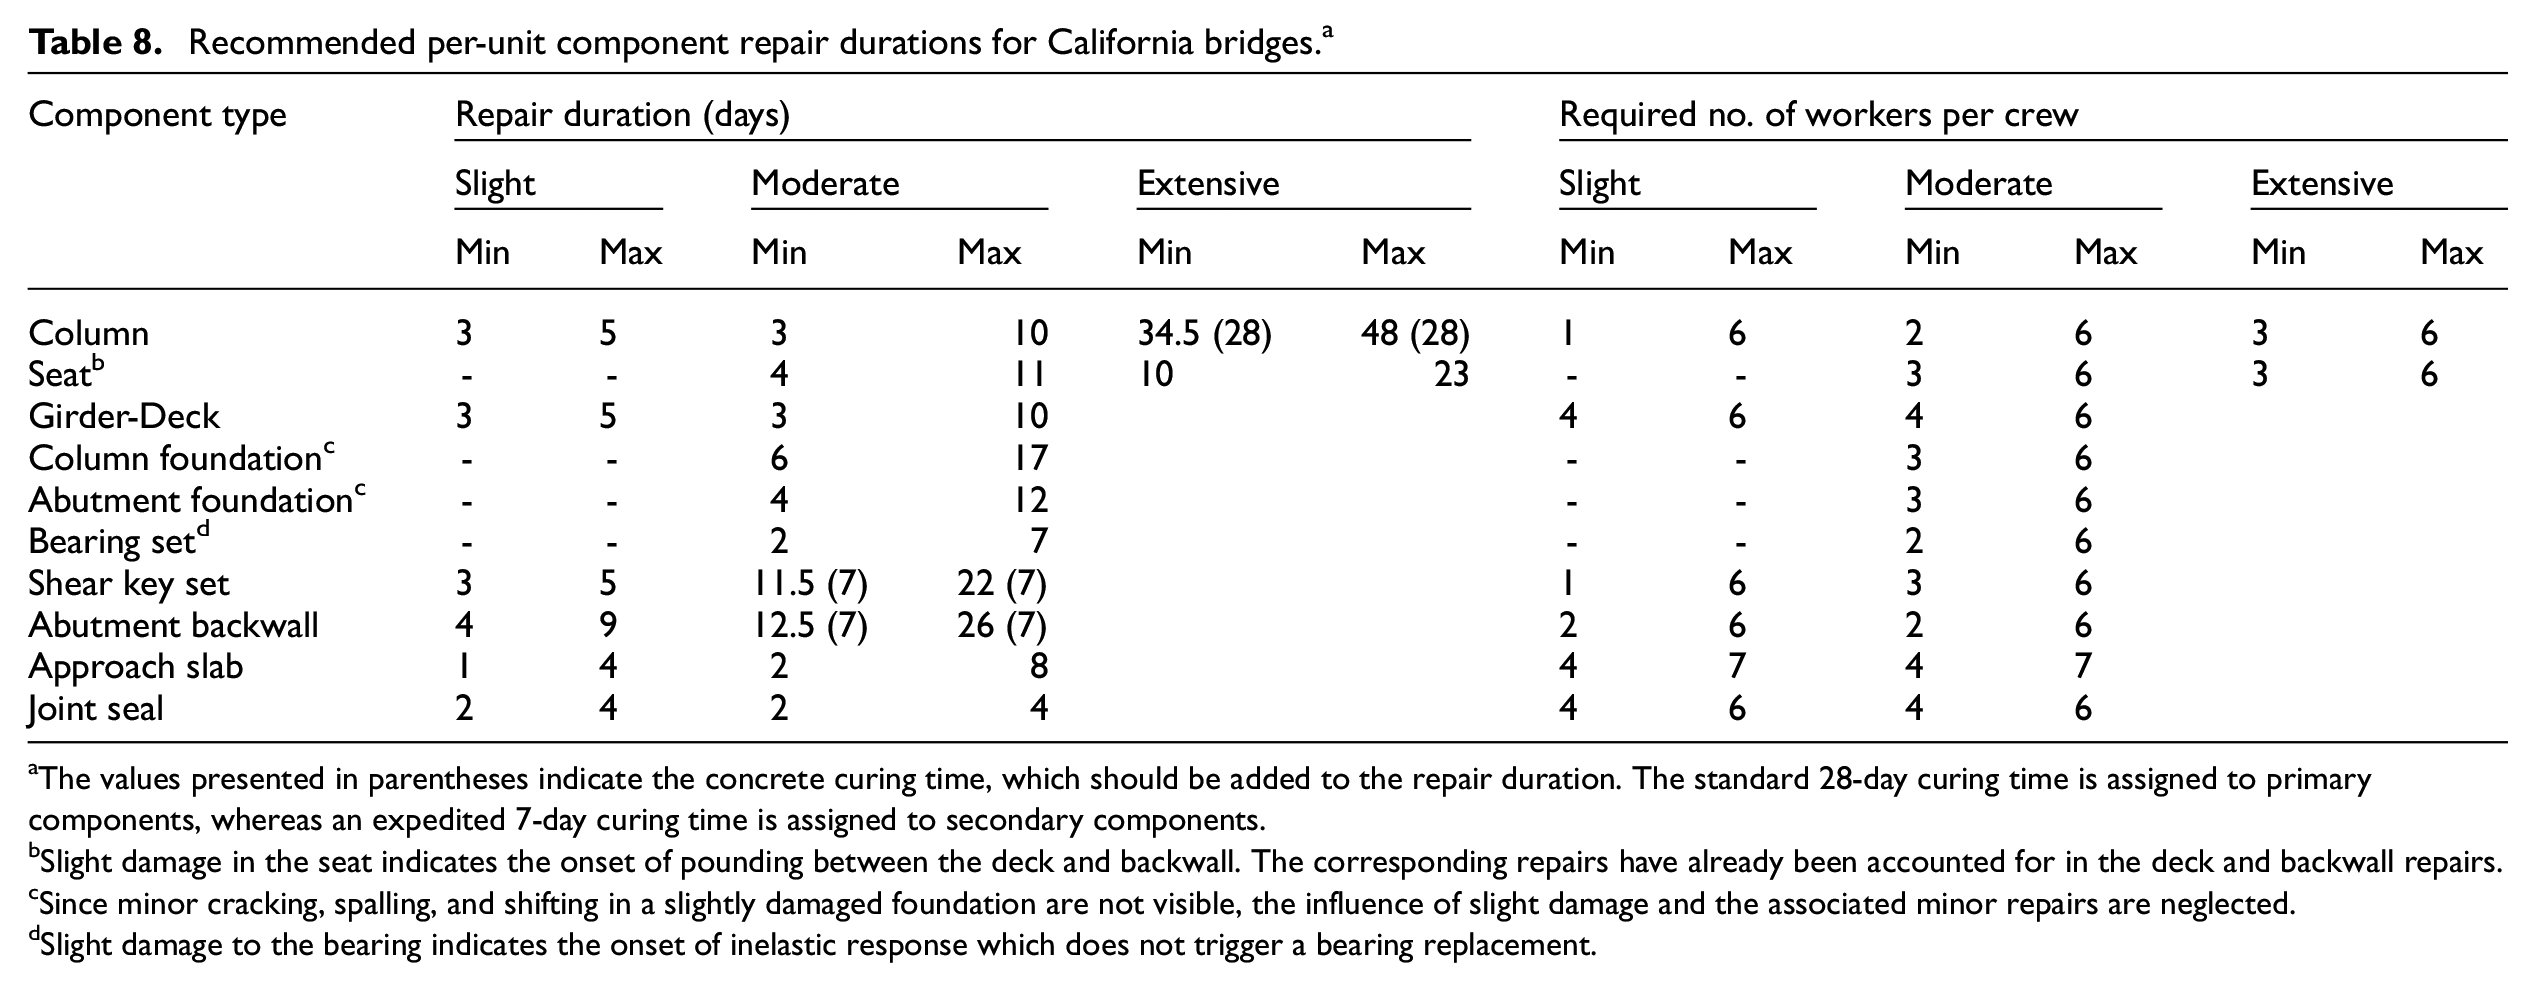
The values presented in parentheses indicate the concrete curing time, which should be added to the repair duration. The standard 28-day curing time is assigned to primary components, whereas an expedited 7-day curing time is assigned to secondary components.
Slight damage in the seat indicates the onset of pounding between the deck and backwall. The corresponding repairs have already been accounted for in the deck and backwall repairs.
Since minor cracking, spalling, and shifting in a slightly damaged foundation are not visible, the influence of slight damage and the associated minor repairs are neglected.
Slight damage to the bearing indicates the onset of inelastic response which does not trigger a bearing replacement.
The duration estimate for repairing a component that is in a specific damage state is based on the associated repair tasks. We adopted a similar approach to Mackie et al. (2008) for the duration imputation by decomposing the repair of a damaged component into multiple tasks, while accounting for the internal construction sequencing of those tasks. For example, repairing an extensively damaged bridge column requires the following six sequential repair tasks: set up temporary supports, demolish the existing damaged column, install forms, place rebar and pour concrete, allow concrete to cure, and strip forms. The sum of these six sequential tasks results in a repair duration estimate for the column that ranges from 34.5 to 48 days, depending on the number of available workers. The repair duration estimation process differs from Mackie et al. (2008) in two respects. The durations provided in the work by Mackie et al. (2008) contain some time delays due to impeding factors. For example, to replace a column, the duration for submitting and reviewing a removal plan is included. Since the impeding durations are treated separately, the time delays in the component repair durations are excluded. We also updated some of the repair task durations in the work by Mackie et al. (2008) to reflect the information obtained from the interviews. The detailed documentation of the repair task decomposition, sequencing, and the corresponding repair duration calculations for each component is summarized in the electronic Supplement A.
Table 8 also provides a range for the number of workers per crew that is needed to repair a given component within the corresponding duration. If more than one crew is assigned to repair multiple damaged instances of a given component type (e.g. multiple damaged columns), the associated repair activities happen simultaneously. If only a single crew is assigned, the repairs proceed sequentially.
In the FEMA P-58 and REDi building downtime estimation methodology, the component repair durations are in the unit of worker-days (Federal Emergency Management Agency, 2012). In other words, the values correspond to time spent repairing a specific component in a particular damage state if only a single worker is assigned. Therefore, the analyst must specify the actual number of workers allocated to each component. It is also important to consider the upper and lower bounds for worker assignments to reflect local construction practices. FEMA P-58 and REDi provide empirical estimates of the maximum worker allocation per component type and per floor to account for human resource limitations and space constraints. However, the minimum assignment is not explicitly specified. In this sense, theoretically, a single worker could be assigned to perform a complex repair task (e.g. replace a column), although it would take an unrealistically long duration. This does not align with typical construction practice where a complex repair task requires multiple workers at minimum.
For the proposed framework, the maximum number of workers per component is provided based on space constraints. The repair duration cannot be shorter than the specified minimum value, even if the actual number of allocated workers exceeds the specified maximum. The minimum number of workers per component is also provided to reflect realistic construction practice. Also, repair work for a component cannot start until the minimum number of workers are on site. If the actual number of workers falls between the minimum and maximum, the repair duration is interpolated. The repair duration for the
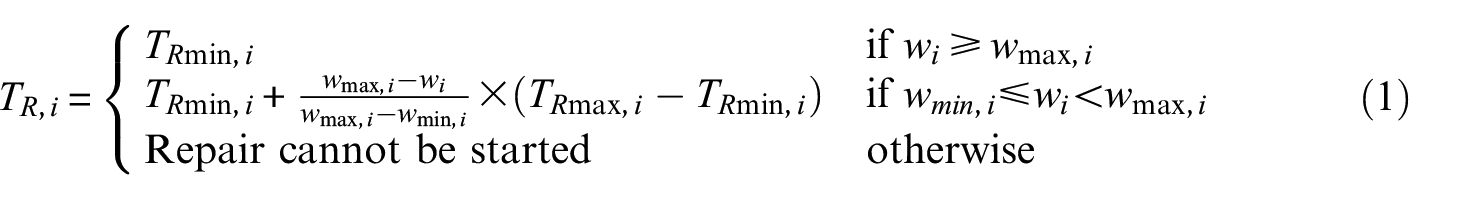
where
FEMA P-58 further considers the repair duration reduction due to economies of scale and efficiencies in construction operations (Banihashemi et al., 2024; Federal Emergency Management Agency, 2012). This is modeled by linearly interpolating the median repair duration within the range of a minimum (corresponding to a maximum damage quantity) and a maximum duration (corresponding to a minimum damage quantity). Due to the lack of empirical data, the impact of economies of scale on bridge component repair duration reduction is not considered in this study.
Repair sequencing
The repair sequencing is used to combine the sampled component repair times and obtain the total repair duration. The repair sequences for diaphragm- and seat-type bridges in Figure 7 are informed by the interviews conducted as part of this study (Hart et al., 2024; Law, 2024; Yen et al., 2023). These sequences are based on the understanding that the substructure–superstructure system (the first row in Figure 7) and the abutment system (the second row in Figure 7), if both damaged, can be repaired in parallel since their construction processes are independent.
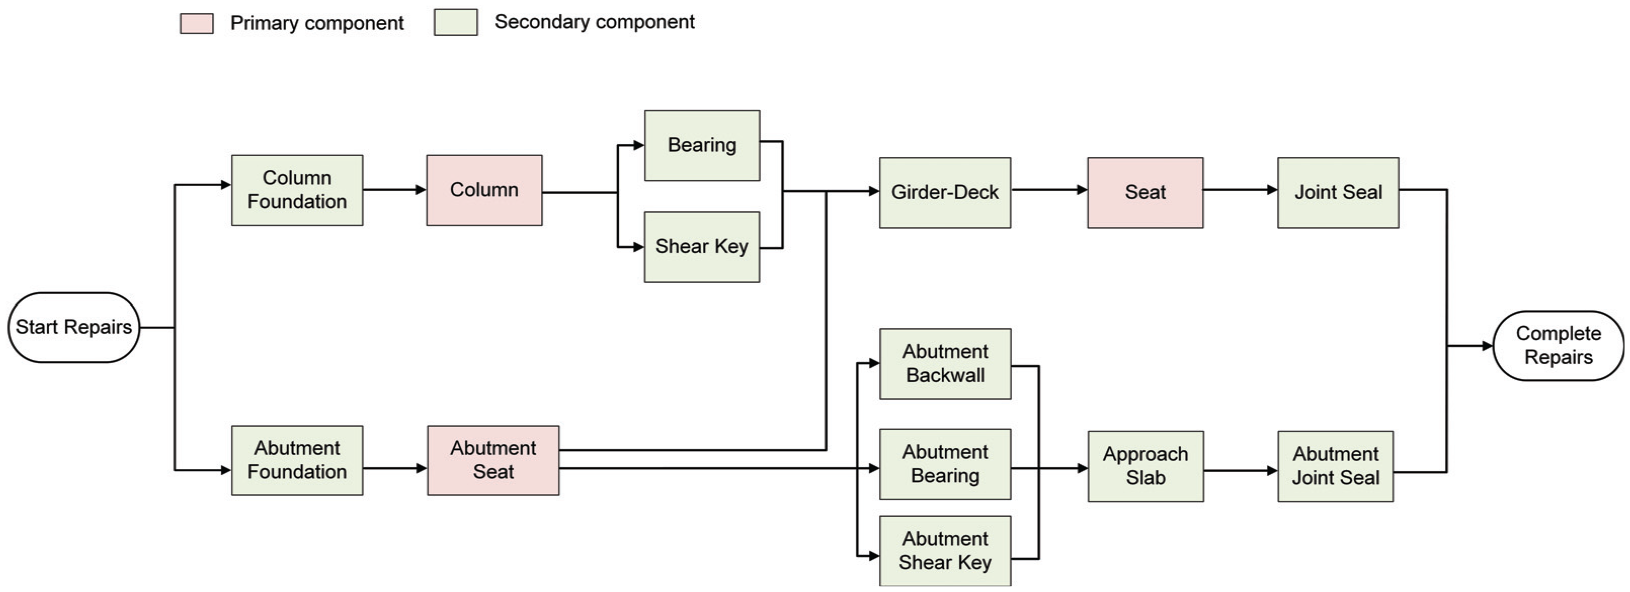
Recommended bridge repair sequencing.
For the substructure–superstructure system, the foundation should be repaired before the column and superstructure. In-span shear keys and bearings, if present, are located on the top of columns. If these two components are damaged, they can be repaired concurrently after the columns are repaired. After the substructure and abutment seat repairs are completed, the superstructure repairs (where necessary) can be initiated. This begins with the repair of the girders and decks. For a multiframe bridge, the in-span seat or joint seal repairs, if needed, are initiated after the girder and deck repair is complete. Note that the superstructure repair might be conducted in segments (i.e. after repairing the first segment of the girder and deck, the in-span hinge in the same segment is repaired before moving to the next one). However, the repair duration calculated from the above sequencing will not be affected by this nuance.
For the abutment system, if both the abutment foundation and seat are damaged, the former must be repaired first. The abutment backwall, shear key, and bearing can be repaired in parallel after the seat. The approach slab which connects the embankment to the abutment, is repaired after the abutment repair is completed. Repairs to the abutment seal, which is the sealant placed between the abutment seat and backwall, cannot begin until the approach slab is repaired.
Example application
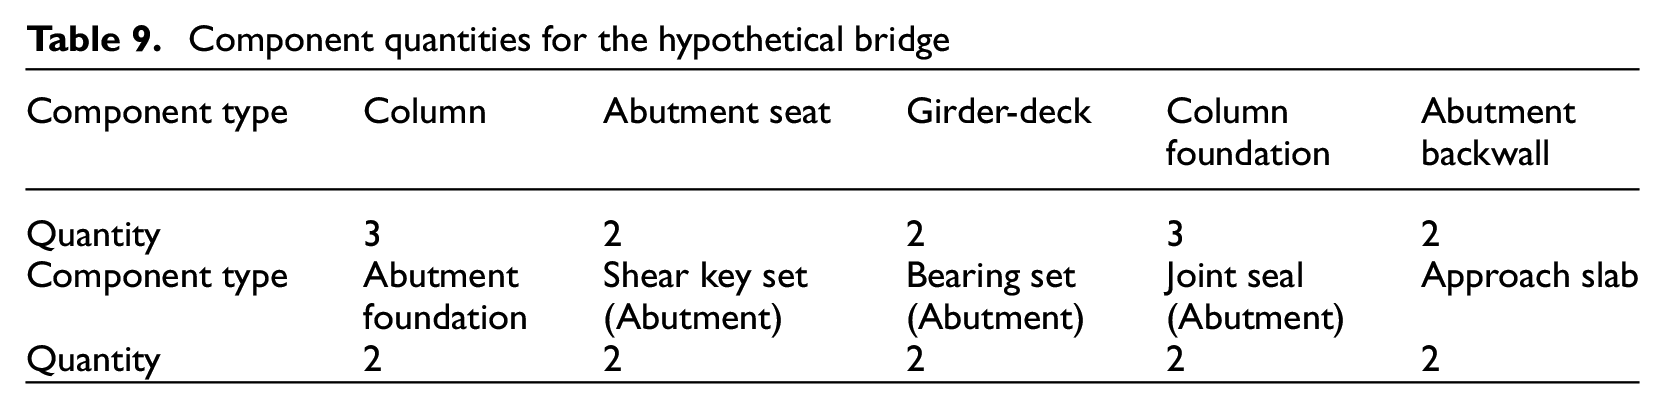
To demonstrate the implementation of the proposed framework (Figure 1), we perform post-earthquake functional recovery assessments for a hypothetical single-frame (i.e. no in-span seat), two-span, multi-column, seat-type, box-girder concrete bridge. The quantities associated with each of the constituent bridge components are shown in Table 9.
Component quantities for the hypothetical bridge
A reference site in the City of Los Angeles (Latitude 34.05°, Longitude −118.25°) is chosen, with a time-averaged shear-wave velocity to a 30-m depth (
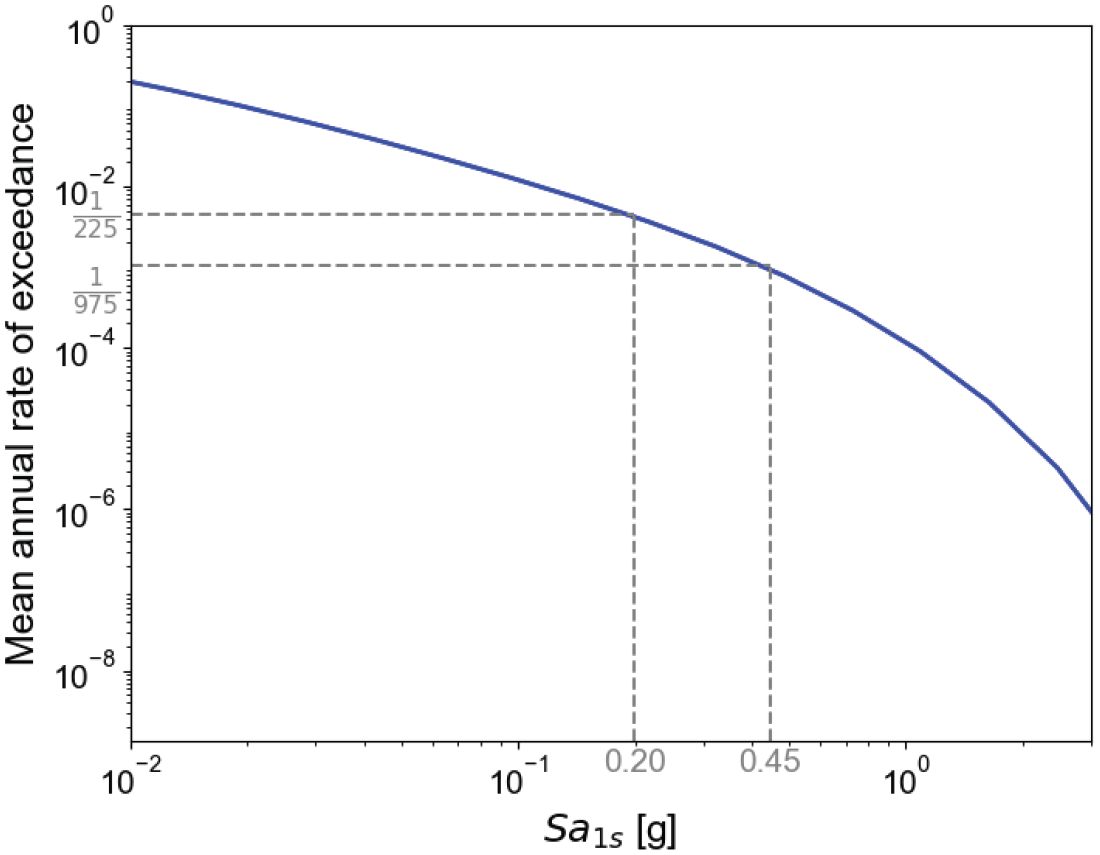
Seismic hazard curve for the reference site.
In this case study, a bridge is deemed irreparable if any component enters repair class 5 (based on the criteria in Figure 4). The replacement duration for an irreparable bridge is sampled from a lognormal model using the median value specified in Table 7. For a repairable bridge, the component-level durations, which are also based on a lognormal distribution, are sampled using the median values specified in Table 8. For both the repair and replacement durations, an assumed logarithmic standard deviation of 0.3 is used. The number of workers assigned to replace the bridge and repair each component is taken as the midpoint between the maximum and minimum values specified in Tables 7 and 8, respectively. Each damaged component type is assigned a single work crew to undertake the necessary repairs. The component-level repair and system-level replacement durations are interpolated using Equation 1. The workday is taken to be 8 hours long.
To sample impeding factor durations, we use uniform distributions and the lower and upper bounds defined in Table 5. As discussed in the “Impeding Factor Module” section, the triggering of an emergency protocol would streamline the post-earthquake decision-making by performing the contractor acquisition and design in parallel (Figure 6). The emergency protocol is triggered when a bridge enters or exceeds the extensive damage state. Also, as discussed earlier, the permitting process is triggered only when a Caltrans-owned bridge crosses other jurisdictions. In this case study, the probability of triggering permitting delay is set as 30%.
This case study uses the IM-based approach to assess the post-earthquake functional recovery. However, the implementation of the EDP-based approach (and the associated comparisons) are presented in the Electronic Supplement B.
In the IM-based approach, the component damage is directly sampled from existing component fragility functions (i.e. the IM-damage relationship) without explicitly performing structural analyses. To this end, all fragility functions that determine the component damage are based on the work by Mangalathu (2017), except the settlement model from Shao et al. (2022), and the shear key and foundation models from Zheng et al. (2021). The parameters of the lognormally distributed fragility functions for each model sub-element are obtained from the literature and shown in Table 10. The damage states across different components are sampled independently from these fragility functions. However, the proposed methodology is capable of incorporating component correlation models in damage sampling (Baker et al., 2024; Dueñas-Osorio and Padgett, 2011; Song and Kang, 2009).
Component sub-element fragility functions used in the IM-based approach
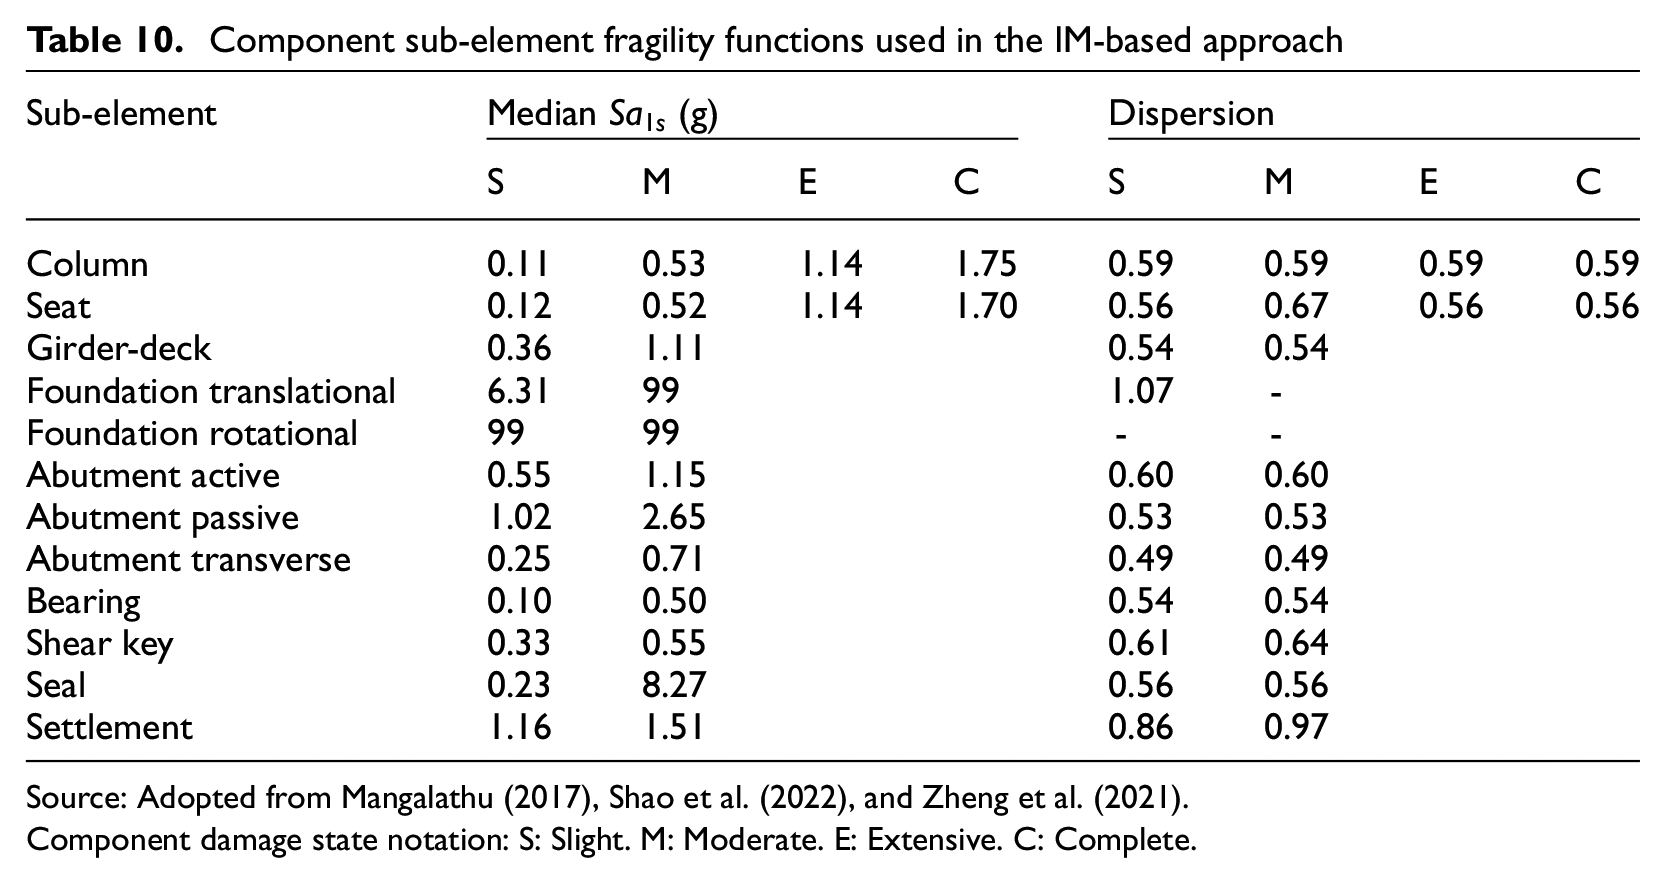
Source: Adopted from Mangalathu (2017), Shao et al. (2022), and Zheng et al. (2021).
Component damage state notation: S: Slight. M: Moderate. E: Extensive. C: Complete.
The repair classes for each component are determined based on the sampled damage and the rules specified in Figure 4. Figure 9 shows the repair class PMFs for the two primary components (i.e. column and seat) under the FEE and SEE hazard levels. Figure 9a shows that both the columns and seats are highly likely to enter RC3 under the FEE, which incurs a moderate lane closure (Table 4). Whereas for the SEE (Figure 9b), the columns have a smaller probability of entering RC3 with the highest probability of being in RC4. Under the SEE (Figure 9b), the seats have a reduced probability of being in RC3 compared to the FEE case (Figure 9a), but it is still higher than the other repair classes.
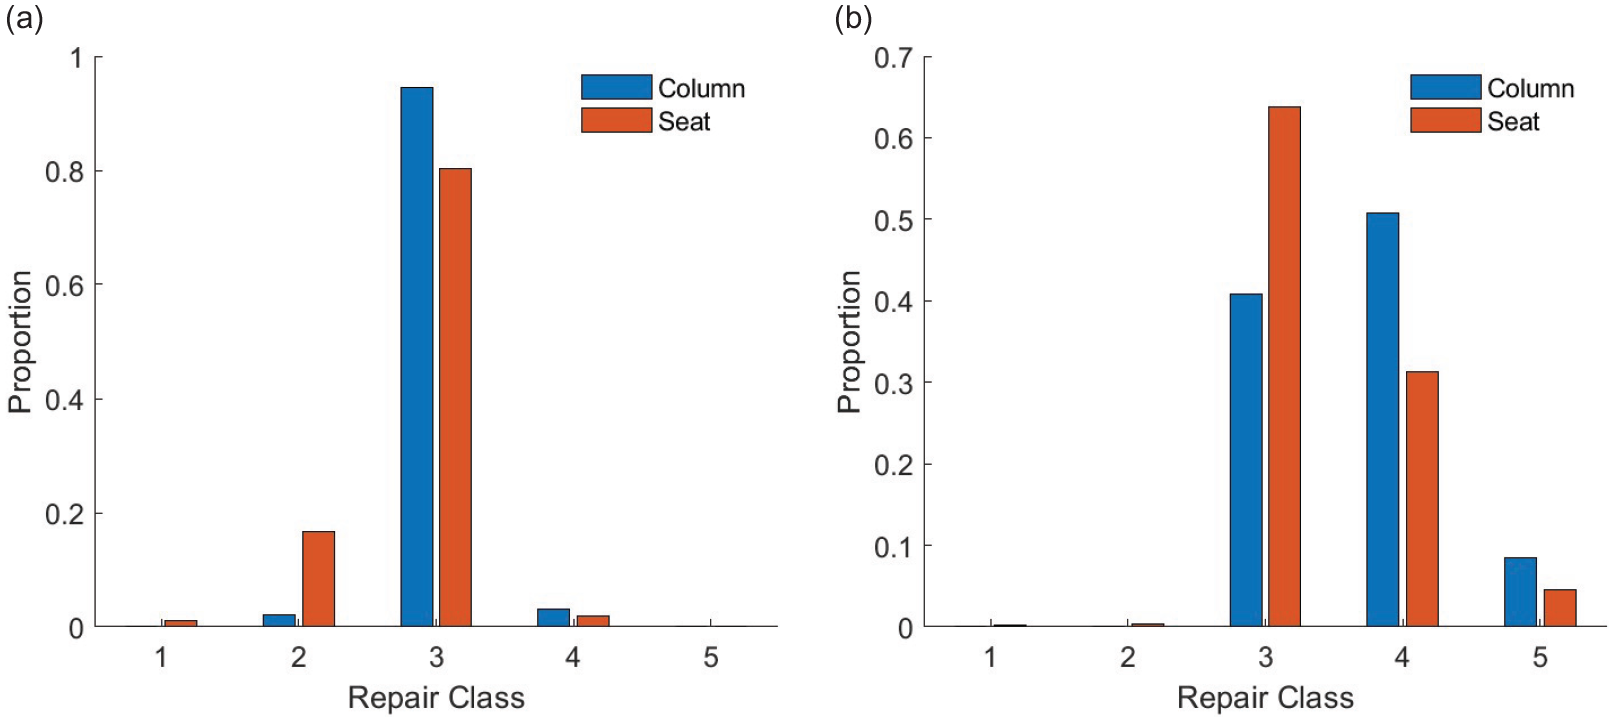
PMFs for the simulated repair classes for the columns and abutment seats, under the (a) Functional Evaluation and (b) Safety Evaluation Earthquakes.
Figures 10 and 11 show histograms with the probability that the bridge enters each of the FSs during the initial response and reopening phases, respectively. Under the FEE hazard level, the bridge has the highest probability of entering FS2 (moderate lane closure) during the initial response phase, and these partial lane closures are lifted (i.e. bridge transitions to a FS1) during the reopening phase. There is a small probability that the bridge enters FS3 (extensive lane closure) under the FEE level. Under the SEE hazard level, it is certain that the bridge will have restricted functionality (i.e. entering either FS2, FS3, or FS7) during the initial response phase (Figure 10). Specifically, there is an 87% probability that the bridge will have partial lane closure and 13% probability of being completely closed due to very severe or irreparable damage. FS3 (extensive lane closure) has the highest occurrence probability during the initial response phase followed by FS2 (moderate lane closure), then FS7 (complete closure). During the reopening phase (Figure 11), it is possible that the bridge returns to full functionality (FS1), but it is still likely that it will be subjected to restrictions, either with weight limitations only (FS4), minor lane closure only (FS5), or a combination of both (FS6). The probability that the bridge is in the complete closure state (FS7) remains the same as in the initial response phase because an irreparable bridge does not have a functionality change during its replacement (Figure 5).
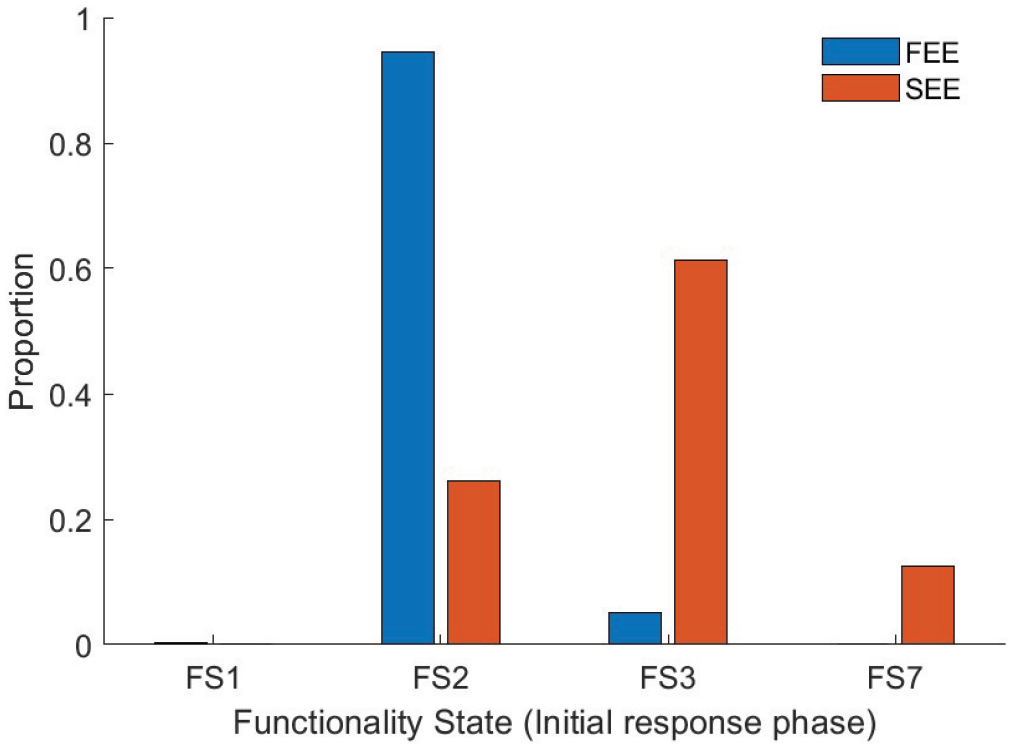
PMFs for entering each of the FSs under the initial response phase.
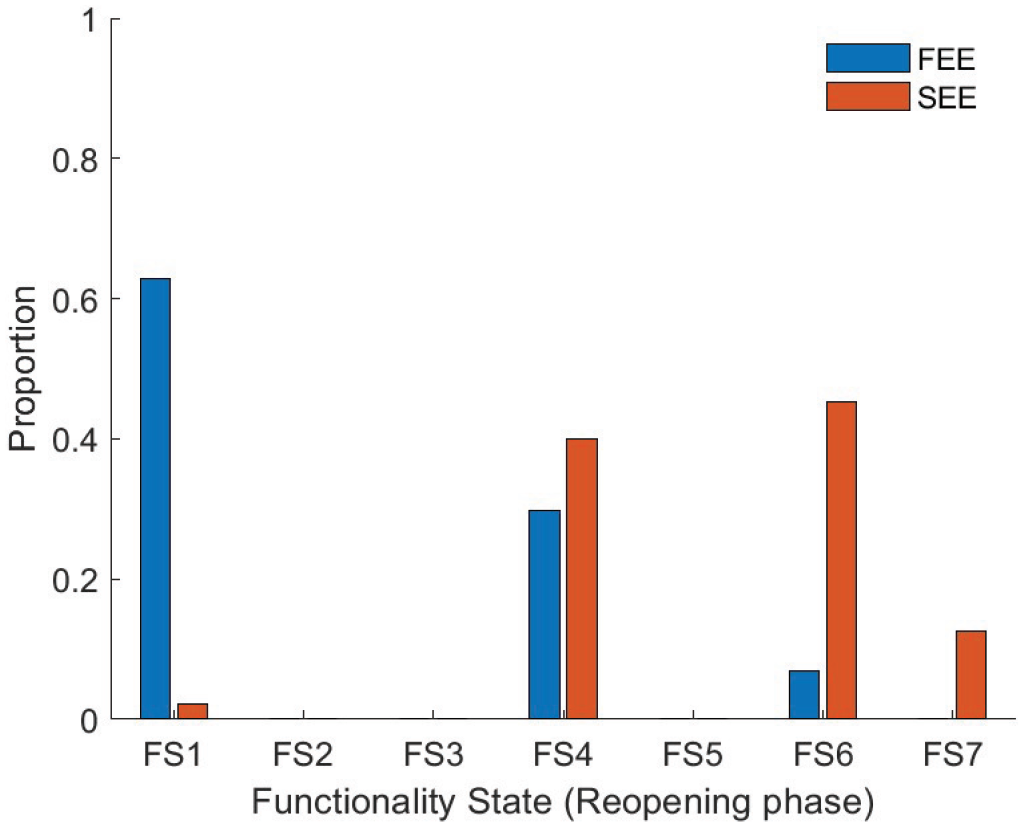
PMFs for entering each of the FSs under the reopening phase.
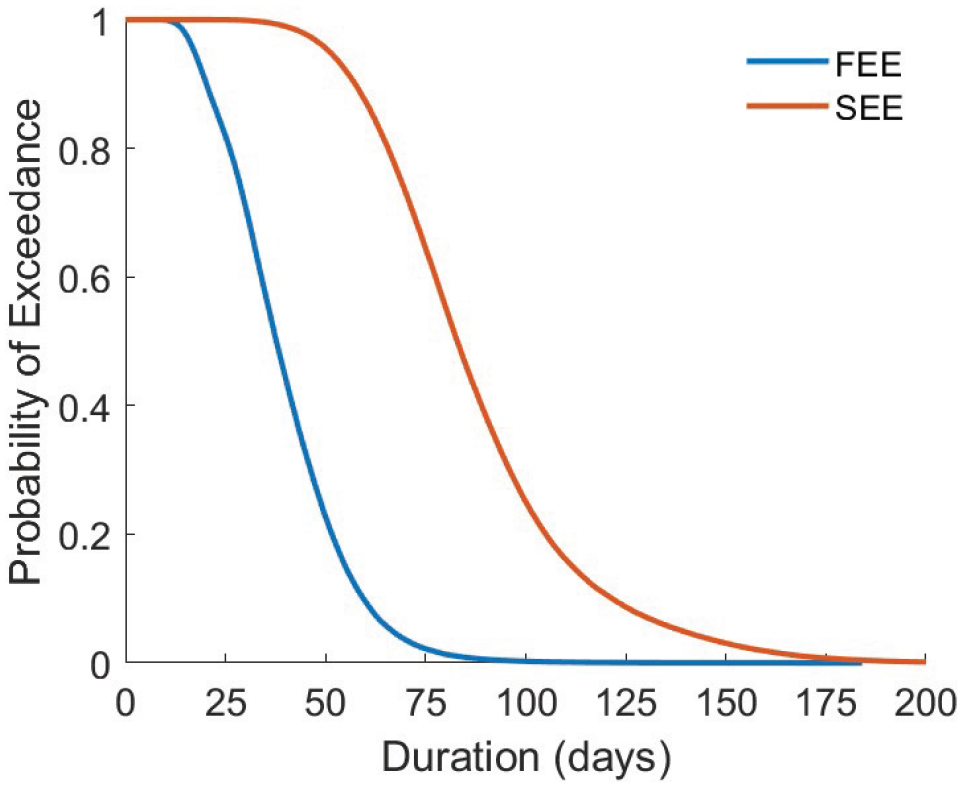
Figure 12 shows the complementary cumulative density functions (CCDFs) for the total time delays due to impeding factors. The CCDF under the SEE is always below the FEE hazard level. In other words, the significantly stronger shaking under the former produces shorter delays. This is because severe damage is more likely to trigger an emergency protocol, leading to an expedited review and planning process and shorter delays. Without the emergency protocol, the delays are longer. Therefore, it is most likely (0.95 exceedance probability) that a delay of up to 120 days occurs after the FEE.
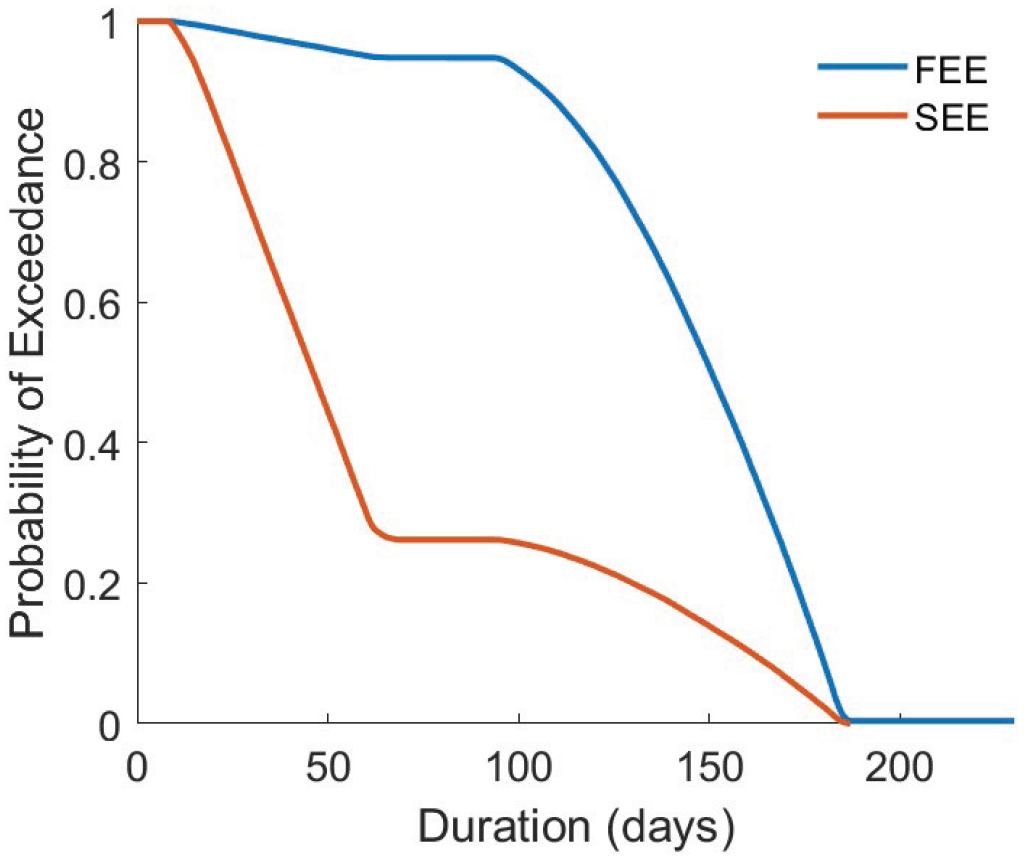
Empirical complementary cumulative distribution function for the total impeding factor delay duration under the Functional Evaluation and Safety Evaluation Earthquakes.
Figure 13 disaggregates the median impeding factor durations that contribute to the total time delays. The sequencing of these impeding factors are based on Figure 6. The total median impeding delays under the SEE hazard level (46 days) are about one-third of that under the FEE hazard level (150 days), due to the triggering of emergency protocols. Under the FEE hazard level, the impeding delays are dominated by the contractor and financing acquisitions, which take 101 and 132 days, respectively. In contrast, for the SEE hazard level, the design phase contributes the most to the delays, taking 44 days. Since the impeding factor delays are based on the median of all Monte Carlo realizations, neither of these two cases trigger the permitting procedure. For both hazard levels, the two types of inspection (initial and in-depth) contribute minimally to the delays.
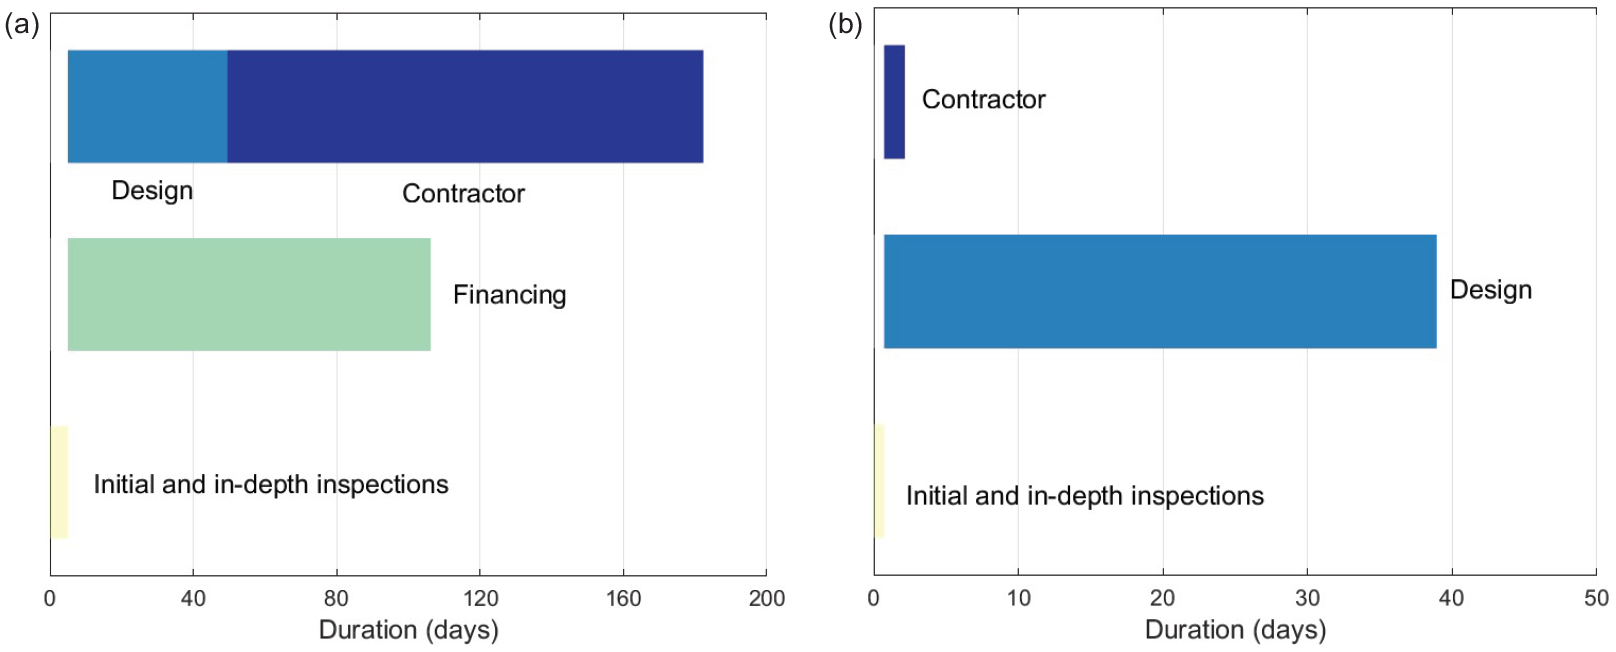
Disaggregation of the median impeding factor duration: (a) Functional Evaluation Earthquake and (b) Safety Evaluation Earthquake.
Figure 14 shows the CCDFs for the total repair or replacement durations under the two hazard levels. Compared to Figure 12, the trend is reversed. Specifically, the SEE level produces consistently longer durations than the FEE. This is as expected since in general, more severe damage always produces longer repair or replacement durations.
Empirical complementary cumulative distribution function for the total repair or replacement duration under the two hazard levels.
Figure 15 disaggregates the median repair durations based on the contribution from the individual components. These durations are ordered according to the component repair sequencing shown in Figure 7. It is evident that the total repair durations are dominated by column repairs for the FEE hazard level and abutment-related repairs for the SEE level. (Table 10) and long repair durations.
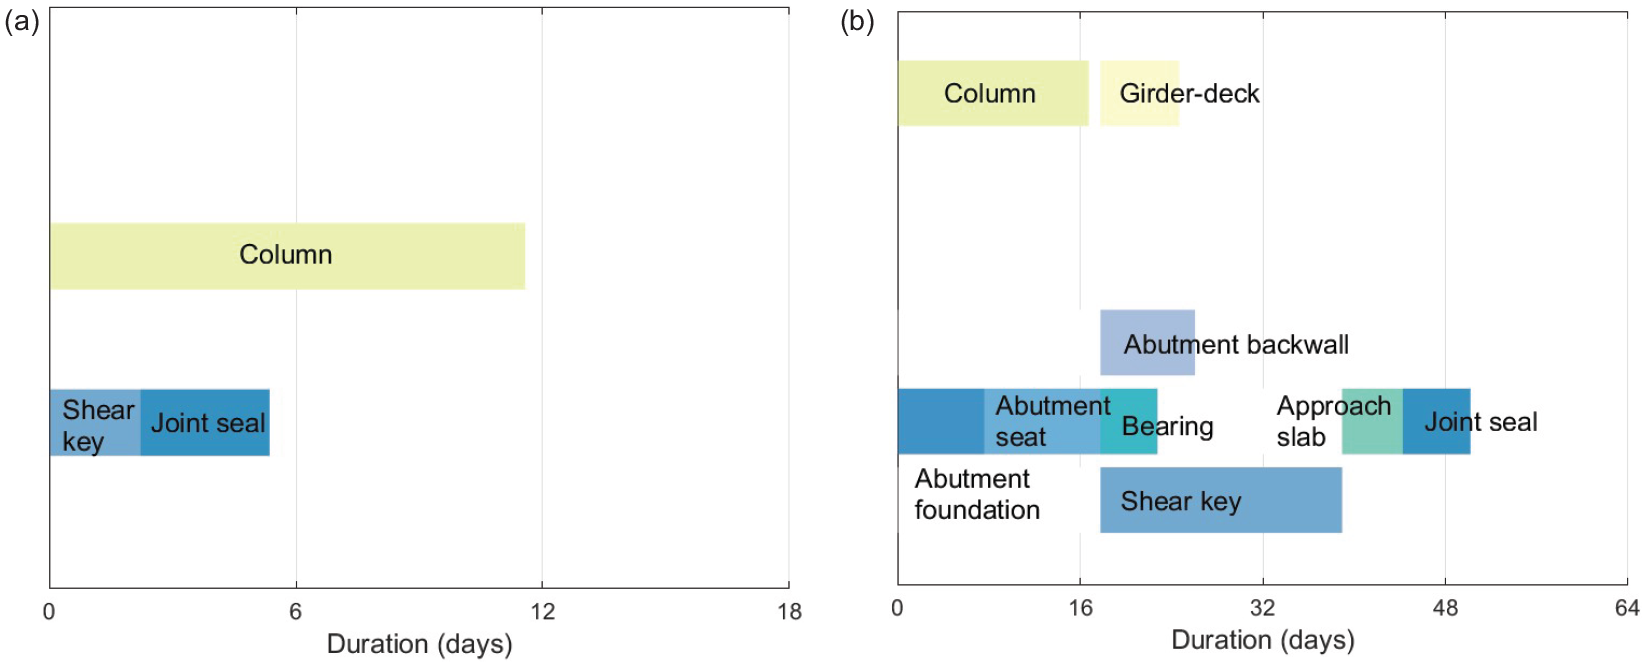
Disaggregation of the median component repair duration: (a) Functional Evaluation Earthquake and (b) Safety Evaluation Earthquake.
Figure 16 shows the CCDFs for total recovery time, which is taken as the sum of the impeding factor and repair durations. The exceedance probability values for the FEE hazard level within the time range from 0 to 200 days exceed those of the SEE. This can be explained by the higher impeding factor durations that are associated with lower damage levels. Note however that the trend reverses for recovery times greater than 200 days. These higher recovery durations are generally (in a probabilistic sense) governed by irreparable damage and replacement, which has a higher probability of occurrence under the SEE hazard level. The exceedance probabilities converge to zero after approximately 250 days.
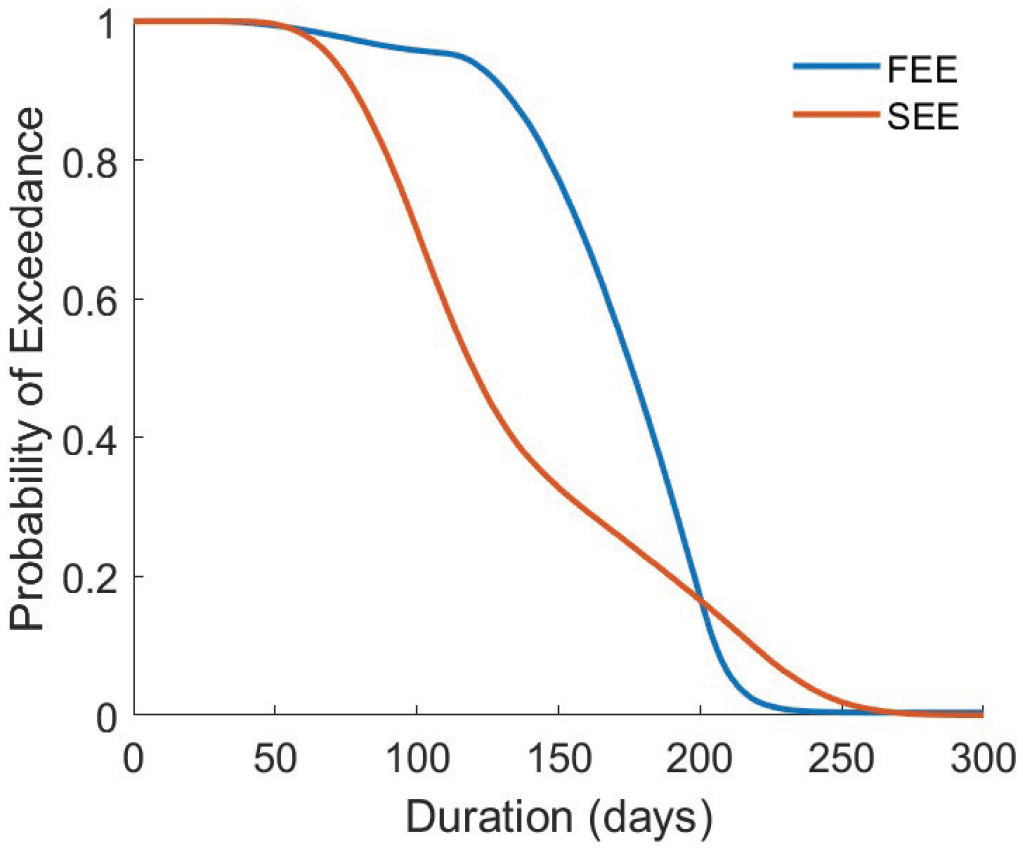
Empirical complementary cumulative distribution function for the total recovery time under the two hazard levels.
Framework adaptation to non-Caltrans jurisdictions
The proposed framework for quantifying bridge post-earthquake functional recovery (Figure 1) is flexible and conceptually applicable to any jurisdiction. However, as indicated throughout the article, the FS specification, duration parameter values, sequencing of the impeding factor and component repair activities, and some decision variables (e.g. the triggering probability for in-depth inspection in Table 6), were informed by expert elicitation and are specific to bridges managed by Caltrans. To further adapt this framework to Non-Caltrans bridges, the following modifications should be considered based on the specific jurisdiction of interest:
Only two possible functional restrictions (i.e. lane closure and weight restriction) are incorporated. However, reduced speed limits and other restrictions not considered in this study may be applicable to other jurisdictions. For example, after the 2001 Nisqually, Washington earthquake (
It is recommended that the analyst carefully examines the administrative practices of the governing jurisdiction and consider all potential post-earthquake functional restrictions. The analyst should also evaluate whether distinguishing between the initial response and reopening phases is necessary.
The relationship between the component repair class and system FS defined in Table 4 and the rules for assigning repair classes based on the number (or proportion) and severity of the damaged bridge components in Figure 4 should reflect the local practices of the considered jurisdiction.
The decision tree architecture during the reopening phase, and the associated probabilities of entering each FS presented in Figure 5 should be modified accordingly.
The definition and sequencing (Figure 6) of the impeding factors, their duration distribution parameters (Table 5), and the conditions under which the emergency protocol is triggered, should be informed by discussions with the relevant transportation agency.
The system replacement durations (Table 7), component repair sequencing (Figure 7) and durations (Table 8), and the associated required number of workers, should be informed by discussions with bridge builders and engineers who have experience with the local construction practice.
Concluding remarks
This research developed a framework to probabilistically model the post-earthquake functional recovery of bridges. Empirical data and general insights (e.g. impeding factor and component repair sequencing) are based on interviews with California bridge builders and engineers. However, the overarching framework can be adapted to other regions.
Following a component-level damage simulation, the framework is structured into three main modules:
The FS evaluation module provides qualitative and quantitative descriptions of possible bridge closure decisions during the initial response and reopening phases. The repair class, which serves as an intermediate variable to relate the severity and distribution of component damage to the initial response FS, is defined and assigned to each component type. To account for possible partial reopening of the bridge after all primary components are repaired, a decision tree is used to assign probabilities of entering the FSs that are specific to the reopening phase.
The impeding factor module includes a database that defines and provides duration estimates for different activities that delay the start of repairs. The duration for the individual impeding factors is sampled and ordered based on the proposed sequencing to obtain the total time delays. The time delays depend on the bridge system damage state and whether an emergency protocol is initiated following the earthquake.
The repair or replacement module determines whether a bridge is repairable and if so, provides the sequencing and durations associated with component-level repairs. Replacement durations are also provided for use in the event that the bridge is deemed irreparable. To reflect realistic construction scheduling, the minimum and maximum numbers of workers needed to conduct the repairs/replacement are provided. The bridge repair schedule is represented in a Gantt chart-type sequencing which depicts the various component-level repairs that occur concurrently or consecutively, distinguishing between seat-type and diaphragm-type bridges.
The metrics produced by this framework include PMFs for the component-level repair classes and FSs, probabilistic estimates of lane closures, time delays, and repair or replacement durations, and disaggregation of time delays and repair or replacement durations. The proposed framework is implemented on a hypothetical two-span multi-column bridge. Two alternative damage sampling strategies are considered. One uses fragility functions that directly relate the ground-motion IMs to the component-level damage state (or the IM-based approach). The other uses explicit nonlinear response history analyses to obtain EDPs, which are used for component damage simulations (or the EDP-based approach). The case study presented in the main body of the article uses the IM-based strategy but the implementation of the EDP-based approach is included as part of the electronic supplements.
Due to the complexity of capturing real-world recovery activities and the sequencing and durations for different types of bridges, several assumptions were made in developing this framework, which need further investigation:
Temporary supports may be used to expedite the functional recovery of bridges. For example, in the aftermath of an earthquake, the transportation agency may set up temporary supports for columns and girders so that the bridge can be partially reopened during the daytime, and closed throughout the night so that the necessary repairs can be performed. In this article, we do not consider the functional change due to the placement of temporary supports.
Future work can extend the proposed framework to consider the impact of non-structural bridge components (e.g. utilities) whose damage may trigger repair or impede functionality.
The rules used to assign the repair classes to each component type based on its damage distribution are deterministic. Further research may use the “repair class fragility” concept (Paul et al., 2018) to specify the relationship between repair classes and component damage distribution in a probabilistic manner.
Efficiency of scale in performing repairs is not considered due to a lack of empirical data.
Some of the specified parameter values and triggering criteria are based on engineering judgment. Some examples include the 50% threshold used to distinguish between “small” and “large” damage quantities (Figure 4), the dispersions that define the probability distributions for the duration variables, and the triggering condition of bridge irreparability. These parameters and criteria should be further refined through empirical evidence or a comprehensive sensitivity analyses.
The empirical data made available by this study can augmented by leveraging intelligent devices that monitor construction and repair activities, along with additional surveys, interviews, or expert opinions.
The framework is scalable and flexible and can be used to perform functional recovery assessment for either a single or network of bridges. The source code and data used to implement the framework will be integrated into the National Science Foundation Natural Hazards Engineering Research Infrastructure (NHERI) SimCenter Tools.
Supplemental Material
sj-pdf-1-eqs-10.1177_87552930251321301 – Supplemental material for Modeling post-earthquake functional recovery of bridges
Supplemental material, sj-pdf-1-eqs-10.1177_87552930251321301 for Modeling post-earthquake functional recovery of bridges by Chenhao Wu, Henry V Burton, Ádám Zsarnóczay, Shanshan Chen, Yazhou Xie, Vesna Terzić, Selim Günay, Jamie E Padgett, Mike Mieler and Ibrahim Almufti in Earthquake Spectra
Supplemental Material
sj-pdf-2-eqs-10.1177_87552930251321301 – Supplemental material for Modeling post-earthquake functional recovery of bridges
Supplemental material, sj-pdf-2-eqs-10.1177_87552930251321301 for Modeling post-earthquake functional recovery of bridges by Chenhao Wu, Henry V Burton, Ádám Zsarnóczay, Shanshan Chen, Yazhou Xie, Vesna Terzić, Selim Günay, Jamie E Padgett, Mike Mieler and Ibrahim Almufti in Earthquake Spectra
Footnotes
Acknowledgements
The authors thank the individuals who have engaged in multiple rounds of interviews to provide insights into California bridge repair and recovery. These individuals include Sharon Yen, Shawn Hart, Colman Cronin, Tanya Wyckoff, Hubert Law, and Mike Powell.
Declaration of conflicting interests
The author(s) declared no potential conflicts of interest with respect to the research, authorship, and/or publication of this article.
Funding
The author(s) disclosed receipt of the following financial support for the research, authorship, and/or publication of this article: This research is supported by the Pacific Earthquake Engineering Research Center’s Transportation Systems Research Program Topic 2: Forward Uncertainty Quantification, the U.S. National Science Foundation (grant no. 2131111) and the NSERC Alliance International Catalyst Grant Any opinions, findings, and conclusions expressed in this article are those of the authors and do not necessarily reflect the views of the sponsor.
Data availability
Supplemental material
Supplemental material for this article is available online.
References
Supplementary Material
Please find the following supplemental material available below.
For Open Access articles published under a Creative Commons License, all supplemental material carries the same license as the article it is associated with.
For non-Open Access articles published, all supplemental material carries a non-exclusive license, and permission requests for re-use of supplemental material or any part of supplemental material shall be sent directly to the copyright owner as specified in the copyright notice associated with the article.