
Abstract
Probabilistic models in performance-based earthquake engineering propagate uncertainties from key input parameters to output performance measures. Although these models integrate important sources of uncertainty, several model parameters are deterministic and remain constant despite the difficulty in defining them with high confidence based on empirical or theoretical arguments. This study employs variance-based sensitivity analysis to investigate how uncertainty in (1) demands, (2) fragility functions, (3) building replacement consequences and (4) impeding factor delays impact seismic loss and recovery time estimates. The results indicate that the size of modeling uncertainty added to the simulated demand distribution has the most significant impact on the variance in seismic losses at all, but the highest hazard level, that is, 2475-year. At low hazard levels, that is, 100 and 475 years, the uncertainty in the capacity of structural components (e.g. slab–column connections) and nonstructural components (e.g. elevator) are the main contributors to variance in downtime to re-occupancy and functional recovery, respectively. At the 2475-year intensity level, the uncertainty in building replacement cost and replacement time becomes the primary contributor of the variance in the seismic loss and recovery time outputs due to the high probability of irreparable damage. The analyses presented in this article offer valuable insights into which parameters deserve more attention when conducting seismic loss and recovery time assessments.
Keywords
Introduction
The performance-based earthquake engineering (PBEE) framework aims to quantify earthquake-induced losses by integrating the results of hazard, structural, and damage analyses (Cornell and Krawinkler, 2000; Moehle and Deierlein, 2004). Building on the PBEE framework, several analytical frameworks were developed to estimate earthquake-induced downtime by leveraging damage and repair analysis results (Almufti and Willford, 2013; Cook et al., 2022; Molina Hutt et al., 2022b; Terzic et al., 2021). All these procedures were established on a probabilistic basis in order to acknowledge the inherent uncertainties at different stages (e.g. structural analysis) of the calculation. Therefore, uncertainties in the input variables affect performance measures in the output, such as seismic loss and downtime. Researchers have explored the sensitivity of seismic loss predictions to uncertainty in modeling assumptions. Porter et al. (2002) conducted a local deterministic sensitivity analysis for a high-rise reinforced concrete moment-frame building to identify the most important input parameters that can influence earthquake-induced repair cost estimates. Sokolov and Wenzel (2011) carried out a sensitivity analysis to study the influence of the correlation between seismic hazard parameters on seismic damage and loss. Lamprou et al. (2013) assessed how the expected life-cycle seismic repair costs of a low-rise concrete moment-frame building would be impacted by uncertain parameters related to seismic hazard. In the context of conducting sensitivity analysis for regional seismic risk assessments, Price et al. (2010) evaluated the contribution of hazard-related factors (e.g. earthquake epicenter and depth) to uncertainties in seismic risk outputs obtained from HAZUS (FEMA, 2020), that is, a tool developed by the Federal Emergency Management Agency (FEMA) to estimate losses under natural hazard events. Neighbors et al. (2013) performed sensitivity analysis by considering parameters related to hazard source (e.g. earthquake epicenter) and site conditions (e.g. soil type) to investigate the relationship between peak ground acceleration and earthquake loss estimates obtained from HAZUS.
Although previous research has provided valuable insights into the main factors contributing to uncertainty in seismic risk, their emphasis has been on considering seismic loss as the primary risk metric. Furthermore, past research has exclusively concentrated on evaluating the uncertainty of loss estimates associated with the hazard parameters by using deterministic or local sensitivity analysis methods. To better understand the input–output interaction in probabilistic seismic performance assessment, it is critical to utilize global and probabilistic sensitivity analysis approaches. Unlike local sensitivity analysis, which evaluates the sensitivity of a model to changes in individual input parameters around a specific point in the input space, global sensitivity analysis accounts for the overall behavior of the model across the entire range of possible input values (Saltelli, 2004). Previous research on the application of variance-based sensitivity analysis in seismic risk assessment is limited. For example, Cremen and Baker (2021) carried out variance-based sensitivity analyses for seismic loss and downtime estimates by considering ground shaking intensity, building period, occupancy, lateral system, and nonstructural building quantities as input variables. Although their research improved our understanding of consequence predictions with the FEMA P-58 (FEMA, 2018) and REDi methodologies, it did not explore important parameters regarding the calculation of irreparable damage, component-level fragility functions, and impeding factor delays. Furthermore, a variance-based sensitivity analysis approach has not yet been applied to recently developed comprehensive frameworks for downtime assessments, such as TREADS (Molina Hutt et al., 2022b).
This article aims to assess how uncertainties in input parameters, typically treated as deterministic in seismic performance assessments, affect output metrics. To accomplish this goal, we present a conceptual framework based on variance-based sensitivity analysis, along with its numerical implementation. Two separate variance-based sensitivity analyses for seismic loss, and post-earthquake recovery measures, are considered, respectively. In the first sensitivity analysis, the seismic loss measures are the probability of irreparable damage and the expected repair cost. In the second sensitivity analysis, the post-earthquake recovery measures are the downtimes to re-occupancy and functional recovery. The analyses are carried out to derive Sobol sensitivity indices considering a wide range of input variables that underlie the loss and downtime assessment frameworks. We evaluate not only the first-order indices but also estimate total-effect and second-order indices to assess the impact of the interaction between input variables on the variability of the output variable. The analyses described in this article are performed for three building archetypes at four seismic hazard levels to highlight how the outcomes are affected by the changes in structural behavior and typical assumptions at different levels of ground shaking.
Methodology
We propose to represent several conventionally deterministic input parameters as random variables within the PBEE framework and assess the implications of their uncertainty on outputs of interest. We examine input variables across various stages of PBEE that influence engineering demand parameters, damage measures, and decision variables (i.e. loss and recovery time measures). We adopt a variance-based sensitivity analysis (Saltelli et al., 2004) method to quantify each input variable’s impact on the variability of each output. The applied method is a common type of global sensitivity analysis that is based on decomposing the total variance of output into the contributions of variance in each input variable and their interactions. Sobol indices (Sobol, 1990) are derived to identify the relative importance of input variables. The first-order Sobol index (Si) for an input variable (Xi) represents the expected reduction in the output variance if Xi is fixed while all other input variables follow their prescribed distributions. For a given output variable, Y, the first-order Sobol index can be computed as follows:
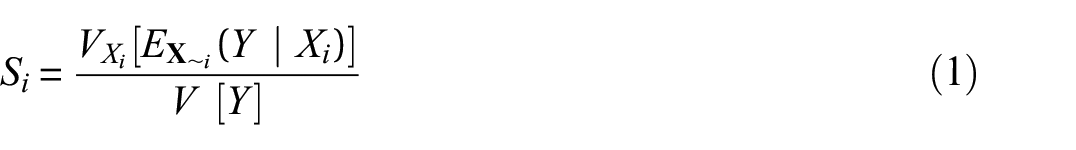
where the variance and the mean of an argument (.) are denoted by V [.] and E (.), respectively.
In order to account for interactions between input variables, the total-effect Sobol index (STi) is employed. STi is defined as follows:
where
where
When the relationship between inputs and output is complex or cannot be represented with a closed-form solution, data-driven approaches can provide approximate values for Sobol indices. Monte Carlo-based sampling methods are robust and efficient for such purposes (Sobol, 2001). These methods are utilized to numerically compute the variance and mean terms specified in Equations 1 to 3. To this end, we sample N realizations from the distribution of each input variable (nv in total) to construct the input variable matrix,
Archetype buildings and hazard levels
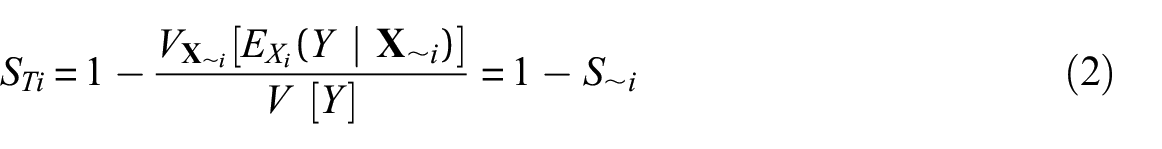
We apply the proposed methodology to case study 8-, 12-, and 16-story modern residential reinforced concrete shear wall building archetypes to demonstrate how we can identify the most important parameters in seismic loss and recovery time assessments. The buildings were designed by Marafi et al. (2020a) to meet the minimum seismic design requirements as outlined in ASCE 7-16 (ASCE, 2016) for a site in downtown Seattle, WA (47.60°N, −122.30°W). Marafi et al. (2020a) designed the archetypes as special reinforced concrete shear walls according to the ACI 318-14 (American Concrete Institute (ACI), 2014) requirements, with a seismic force-reduction factor (R) of 6, and using a modal response spectrum analysis procedure. The typical floor size for the archetype buildings is 30.5 m × 30.5 m (100 ft × 100 ft), and the story height is 3.05 m (10 ft). The lateral force-resisting system in all archetypes incorporates a symmetrical central core with two C-shaped walls that are connected in one direction and disconnected in the opposite direction. Figure 1a depicts the typical plan view for the archetype buildings. Marafi et al. (2020a) evaluated the structural response for the archetypes using the multiple stripe analysis (MSA) procedure (Jalayer and Cornell, 2009) with ground motion records representing 100-, 475-, 975-, and 2475-year intensity stripes consistent with the 2014 National Seismic Hazard Model (NSHM) (Petersen et al., 2014).
(a) Typical floor plan view. (b) Conditional mean spectrum at the period of ~2.7 s per the 2014 National Seismic Hazard Model for interface earthquakes.
To represent the anticipated ground motion response spectrum considering the target Spectral Acceleration (SA) at the fundamental period of each archetype, a conditional mean spectrum (CMS) was employed. To compute the CMS for each return period, a weighted average of the site-specific ground motion prediction models was adopted. At each hazard level, 100 ground motion records were selected to represent the contribution of three types of source mechanisms (i.e. crustal, intraslab, and interface) to the total hazard. Figure 1b displays the target CMS for interface earthquakes across different hazard levels as defined in the 2014 NSHM at the fundamental period (Tn = ∼2.7 s) of the 12-story archetype. Interface earthquakes are the largest contributors to the total hazard at long periods (Tn > 1 s), which is relevant for the archetype buildings considered in this study. The acceleration time histories were scaled to match a conditional mean spectrum for the site (Jayaram et al., 2011). Further details about the modeling strategy and ground motion selection process can be found in Marafi et al. (2019, 2020b). The structural and nonstructural components for the archetype buildings were adopted as suggested by Kourehpaz et al. (2021), encompassing components such as shear walls, slab–column connections, façade, Mechanical, Electrical, and Plumbing (MEP) systems, fitouts, and elevators.
Outputs of interest
We distinctly focus on outputs from FEMA P-58 and TREADS analyses. The FEMA P-58 outputs pertain to two loss metrics, namely, the probability of irreparable damage and the expected repair cost, while TREADS outputs relate to two post-earthquake recovery metrics, namely, the expected downtime to re-occupancy and the expected downtime to functional recovery. We exclusively focus on the expected values as they are often used to develop vulnerability functions and conduct risk-based assessments. A brief overview of these outputs of interest is provided next.
Loss measures
We follow the performance-based earthquake engineering methodology as outlined in the FEMA P-58 document to quantify seismic losses. We use SimCenter’s open-source PELICUN software (Zsarnóczay and Deierlein, 2020; Zsarnóczay and Kourehpaz, 2021) to simulate damage and losses in the archetype buildings by generating 1000 Monte Carlo realizations under each ground motion intensity level and considering various structural and nonstructural components as indicated in Kourehpaz et al. (2021). For each realization, the simulated engineering demand parameters (e.g. story drifts and accelerations) are generated by fitting a multivariate Lognormal distribution to the original demands (based on results of nonlinear response analyses) and incorporating additional uncertainty into the distribution to account for the modeling uncertainty (βm). Figure 2a presents an example of a Lognormal probability density function for the peak story drift ratio (Δ), with a median of 1% and dispersion of 0.4 for the original demands, considering three distinct values of βm. In conjunction with the simulated demand parameters, component fragility functions are used to determine the associated damage state for each structural and nonstructural component. Finally, consequence functions are used to translate damage states into repair costs. When quantifying seismic losses, we also determine the probability of irreparable damage that is controlled by residual drifts. The residual drift ratio (Δr) is calculated using the approximate approach recommended in the Second Edition of FEMA P-58 (Appendix C, Volume 1) based on Δ and the yield drift ratio (Δy) of the structural system. Per this approach, Δr is zero if Δ is less than Δy; otherwise, it is a linear combination of Δ and Δy. Figure 2b presents the probability density function (approximated using a kernel density estimation (KDE) methodology) for Δr at three distinct values of Δy, with Δ sampled from the Lognormal distribution shown in Figure 2a, using a βm of 0.35. Note that because Δ is directly influenced by βm, Δr will also be affected by the choice of βm, in addition to Δy. In each realization, the residual drift estimate (demands) is evaluated against a repair fragility (capacity) sampled from a Lognormal distribution to determine if the building is repairable. The probability of irreparable damage is calculated as the proportion of realizations with irreparable damage over the total number of realizations. In essence, for each irreparable realization, the repair cost is taken as the building’s total replacement cost (C rep ). We combine the losses from both repairable and irreparable damage realizations to calculate the expected repair cost, that is, the second loss measure analyzed in this study. The collapse cases are also considered in estimating the expected repair costs; however, their contribution is negligible as the case-study archetypes are modern, code-conforming buildings.
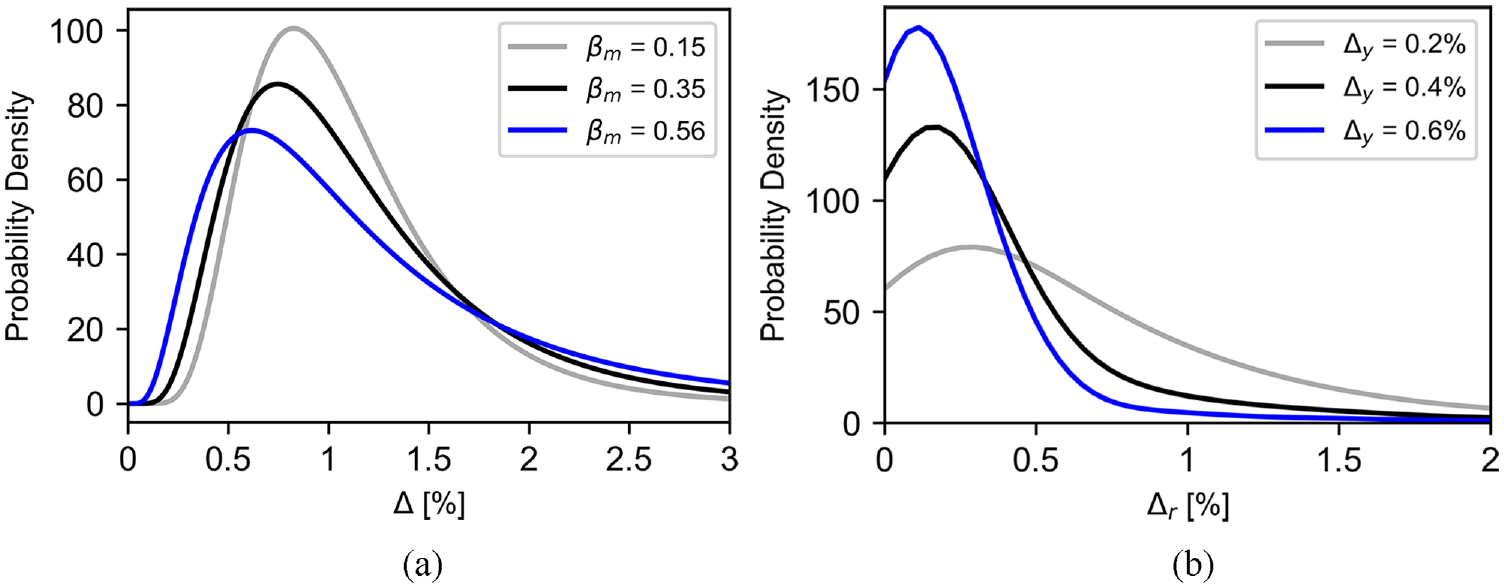
(a) Probability density function for the story drift ratio (Δ) considering different values of the modeling uncertainty (βm). (b) The variation of the residual drift ratio (Δr) as a function of the yield drift ratio (Δy) for Δ with a median of 1% and βm of 0.35.
Recovery measures
We estimate post-earthquake recovery times or downtime using the TREADS open-source software package (Kourehpaz, 2022), which implements the downtime estimation framework developed by Molina Hutt et al. (2022b). This framework leverages the damage states and component repair times obtained from the FEMA P-58 analysis, along with rigorous repair phasing and sequencing, to quantify the overall recovery time of a building. Similar to the loss assessments, we perform 1000 Monte Carlo simulations to propagate various sources of uncertainty (e.g. impeding factor delays) within the downtime assessment methodology. We also consider irreparable damage scenarios in accordance with FEMA P-58 criteria, which are determined based on Δr as outlined in the previous section. In such scenarios, the recovery time is taken as the building’s total replacement time. Collapse cases (when applicable) can be incorporated into assessments in the same way as irreparable damage scenarios, as both require full replacement time. However, similar to the loss assessments, collapse is excluded from the recovery simulations due to its negligible probability at the hazard levels considered in this study. We exclusively focus on the expected earthquake-induced downtime to achieve two recovery states, namely, re-occupancy and functional recovery. Functional recovery refers to the post-earthquake condition in which the building is capable of fulfilling its primary function even though not all repairs have been completed. In the re-occupancy recovery state, a building is deemed safe for occupancy even if it has not yet fully restored its basic functionality.
Per this framework, the total downtime is computed by combining the delays caused by impeding factors and the building’s repair time. We calculate the building’s repair time by aggregating component repair times considering repair sequencing and the number of workers available. To compute the component repair time, we use consequence functions of the components tagged with a repair class greater than or equal to 2 or 3, respectively, for functional recovery and re-occupancy. The repair class concept was originally introduced in the REDi guidelines which is used to flag the repairs necessary to achieve a desired recovery state. Each damage state of each building component is tagged with a repair class, which serves to identify the recovery state hindered by the damage. The impeding factor delays correspond to the various factors that may delay or impede the initiation of repair activities. These activities include the time required for building inspection, securing financing, arranging engineering services, obtaining permits, mobilizing a contractor, and performing repairs to stabilize the structure or the building envelope, that is, mitigation work to minimize aftershock collapse risk and falling debris hazard. The impeding factor delays constitute the major portion of the downtime (Molina Hutt et al., 2019, 2022a) and thus warrant further exploration.
Input variables
This study considers a range of input variables that reflect different assumptions pertaining to various stages of the FEMA P-58 loss assessment and TREADS downtime estimation frameworks. Table 1 summarizes the input variables, and their relevant ranges used for conducting sensitivity analyses, with variables #1–10 considered for FEMA P-58 assessments and variables #6–21 for TREADS assessments. The input variables considered can be categorized into the following groups:
Damage analysis: Variables related to irreparable damage calculation (#1–3 in Table 1) and component fragility functions (#6–10 in Table 1).
Demand model: Additional uncertainty added to simulated demands (#4 in Table 1).
Building replacement consequences: The total replacement cost and time of the building (#5 and #11 in Table 1).
Number of workers allocated for repair: This variable corresponds to the number of workers assigned to repair the damaged structural components, which directly influences the building repair time calculation (#12 in Table 1).
Impeding factor delays: Various delays that are associated with different factors (#13–21 in Table 1).
Input variables definition, mean (µ), coefficient of variation (CoV), and truncation interval [a,b] considered
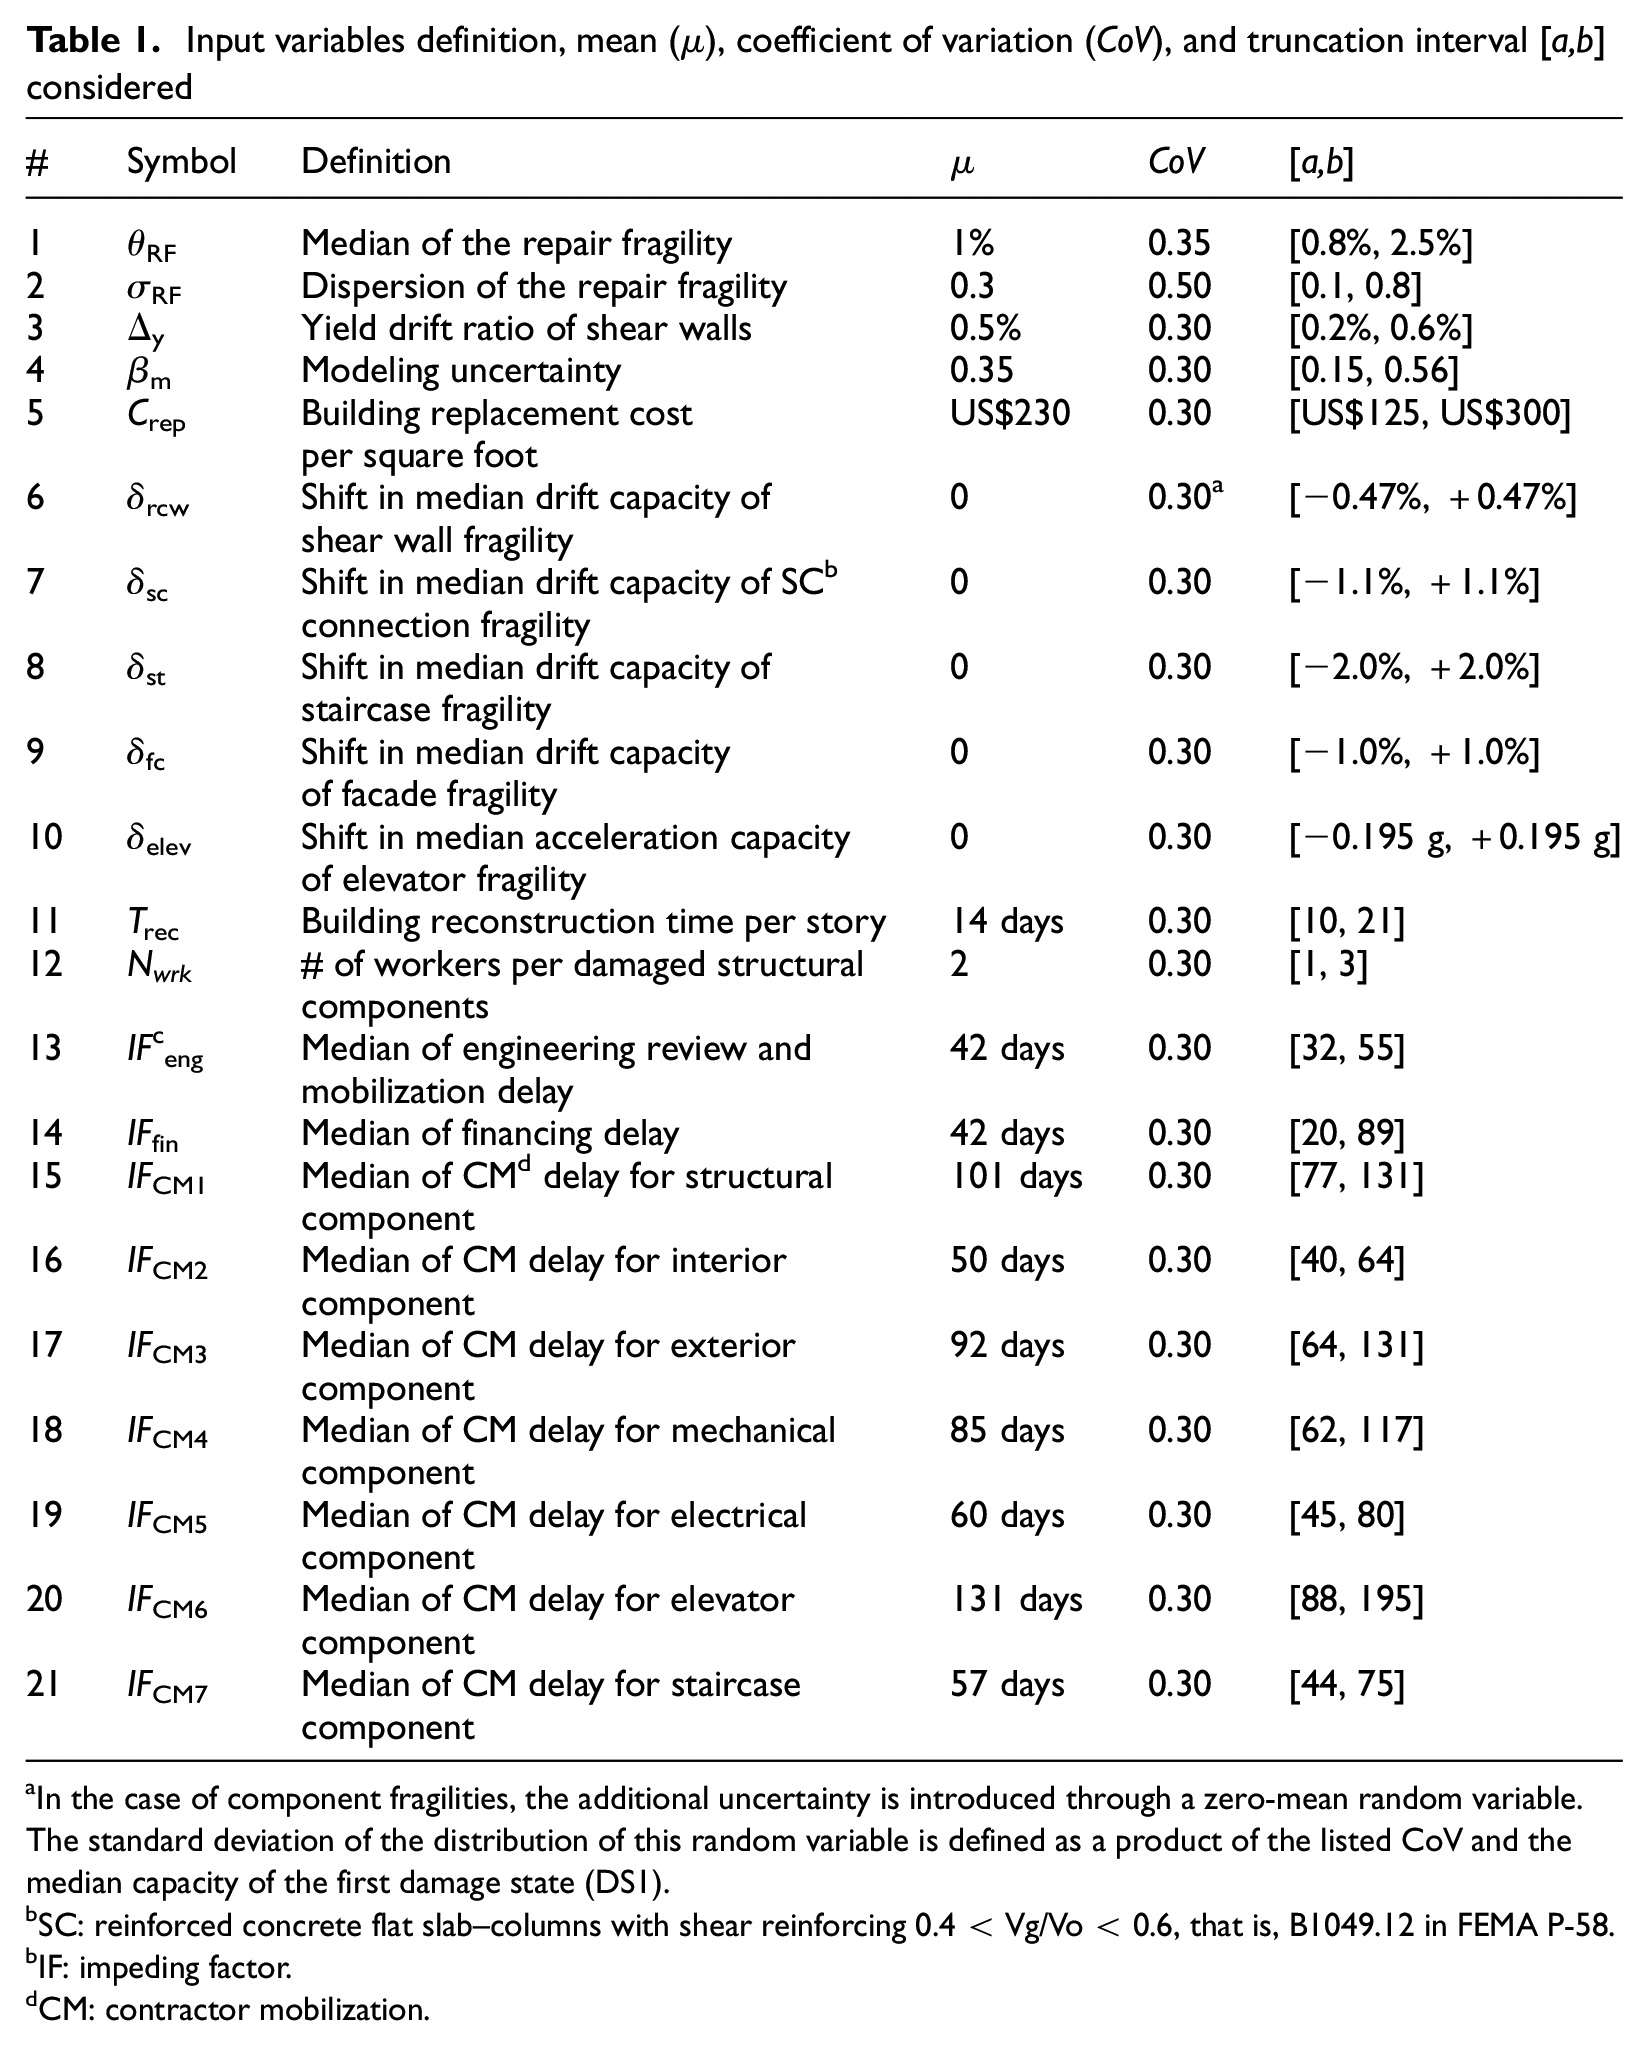
In the case of component fragilities, the additional uncertainty is introduced through a zero-mean random variable. The standard deviation of the distribution of this random variable is defined as a product of the listed CoV and the median capacity of the first damage state (DS1).
SC: reinforced concrete flat slab–columns with shear reinforcing 0.4 < Vg/Vo < 0.6, that is, B1049.12 in FEMA P-58.
IF: impeding factor.
CM: contractor mobilization.
In selecting the input variables, we focus on a subset of key input variables based on engineering judgment. For example, we focus on the repair fragility function (building-level and global) parameters that are critical for calculating irreparable damage, as well as component-level (local) fragility functions for key structural components (e.g. shear walls, slab–column connections) and nonstructural components (e.g. elevators, staircases, façades), whose damage could drive repair costs or hinder re-occupancy and/or functional recovery. In addition, we consider a comprehensive list of impeding factor delays, as these can significantly influence recovery time estimates. These were only a subset of the critical parameters considered in the analyses. For instance, parameters related to consequence functions (i.e. component repair costs and times) were intentionally excluded to clearly distinguish the importance of various structural and nonstructural components in terms of their capacities (i.e. fragility functions).
We assume a truncated normal distribution for all random variables with the mean values set equal to the typical values employed in standard practice. The probability density function of each distribution can be defined as follows:
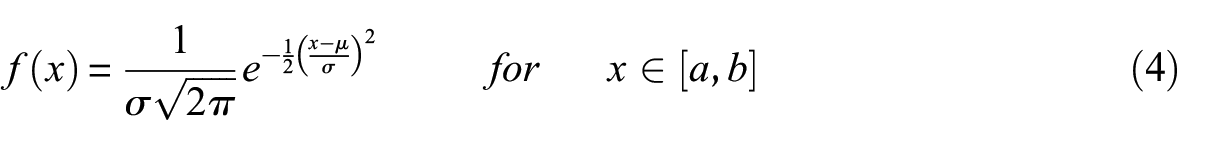
where μ and σ correspond to the mean and dispersion, respectively, of the original normal distribution, which has been truncated within the prescribed range of [a, b]. The dispersion for each distribution is chosen so that the coefficient of variation (CoV) is targeted at 0.3 unless evidence in the literature supports the calibration of the CoV. For instance, for replacement consequence, and impeding factor delay variables where there is insufficient information in the literature, a typical value of 0.3 is utilized for the CoV, and the upper and lower bounds of the truncated distribution are determined based on engineering judgment. On the contrary, when there is adequate information available in the literature, a data-driven approach is employed to determine the CoV and the prescribed distribution range. For instance, past studies indicate that the Δy for reinforced concrete shear walls varies between 0.2% and 0.6%. It is improbable for the Δy to be below 0.3% (Kazaz et al., 2012; Rana et al., 2004; Ruiz-García and Miranda, 2006). Considering this information, the CoV of the probability distribution of the Δy is set to 0.3 to achieve an approximately 10% likelihood of obtaining values lower than 0.3%. Similarly, although the median (θRF) and dispersion (σRF) of the repair fragility can range from 0.8% to 2.5% and from 0.1 to 0.8, respectively, it is highly unlikely to encounter median values exceeding 1.5% and dispersion values exceeding 0.5 (FEMA, 2018; Ramirez and Miranda, 2012). Therefore, the CoV for θRF and σRF is calibrated to produce such rare values with about 10% probability. The βm represents an extra uncertainty added to simulated demands, where its mean value and range are determined per FEMA P-58 recommendations.
For component fragility functions, the median capacity of each component is assumed to vary within ±50% of the typical median capacity of the first damage state. There are two input random variables associated with the building’s replacement consequences, namely, Crep and the building’s reconstruction time per story (Trec). As per the RS Means (2019), recommendation for midrise residential buildings in Seattle, WA, the typical value of US$230/sq ft is regarded as the mean value of the sampling distribution for Crep. The lower and upper bounds for Crep are also determined according to RS Means. The mean value of the reconstruction time is assumed to be 2 weeks per story, which is combined with the demolition time (Marquis et al., 2017) to compute the building’s total replacement time. The mean value for the number of workers per damaged structural components (Nwrk) is assumed to be 2, as per REDi guidelines, with the lower and upper bounds determined based on engineering judgment. Regarding the impeding factor delays, the median value is assumed to lie between the 25th and 75th percentiles of the original lognormal distribution defined in the REDi guidelines and by Paul et al. (2018). Figure 3 showcases the sampling distribution used for Δy, βm, Trec, and the contractor mobilization delay for the elevator component (IFCM6). The illustration of sampling distributions for other variables can be found in Electronic Supplement II.
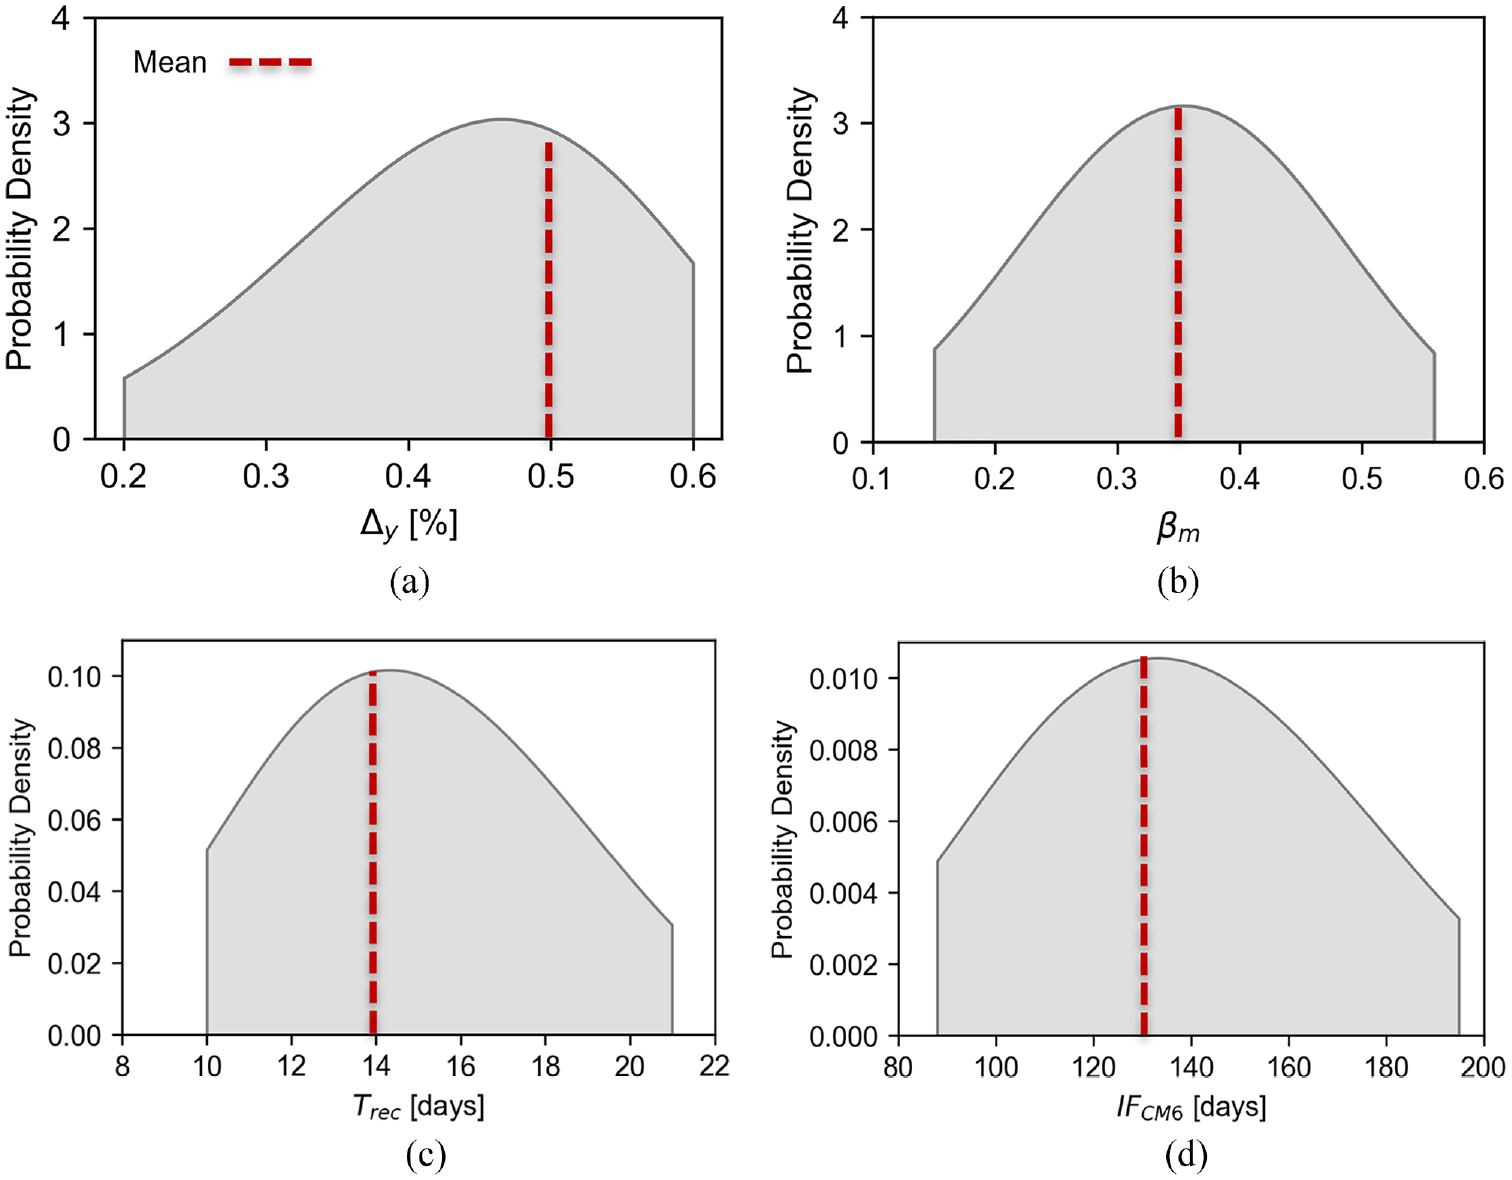
Examples of input variable sampling distributions: (a) yield drift ratio, (b) modeling uncertainty, (c) reconstruction time per story, and (d) contractor mobilization delay for elevator component repairs.
Importance of input variables
In this section, we evaluate the significance of input variables in estimating (1) the building’s loss (i.e. the probability of irreparable damage, and the expected repair cost) and (2) post-earthquake recovery measures (i.e. the expected downtime to re-occupancy, and the expected downtime to functional recovery) for the 12-story archetype at four ground shaking intensity levels ranging from 100 to 2475 years.
Impact of input variables assumptions
We hypothesized that considering uncertainty in conventionally deterministic input variables can significantly influence the outputs obtained from seismic risk analyses. Thus, we evaluate the impact of uncertainty in input variables (refer back to Table 1) on outputs of interest. We illustrate the variation in output estimates for one of the metrics, that is, the probability of irreparable damage, which directly influences the expected repair cost and recovery time estimates, as these metrics also incorporate contributions from irreparable realizations. Figure 4 depicts the range of values obtained for the probability of irreparable damage by considering uncertainty in input variables at each ground motion intensity level. The red dashed line represents the baseline estimates derived using the mean values from Table 1. The distributions of other outputs of interest, including the expected repair cost, expected downtime to re-occupancy, and expected downtime to functional recovery across all hazard levels, are provided in Electronic Supplement III.
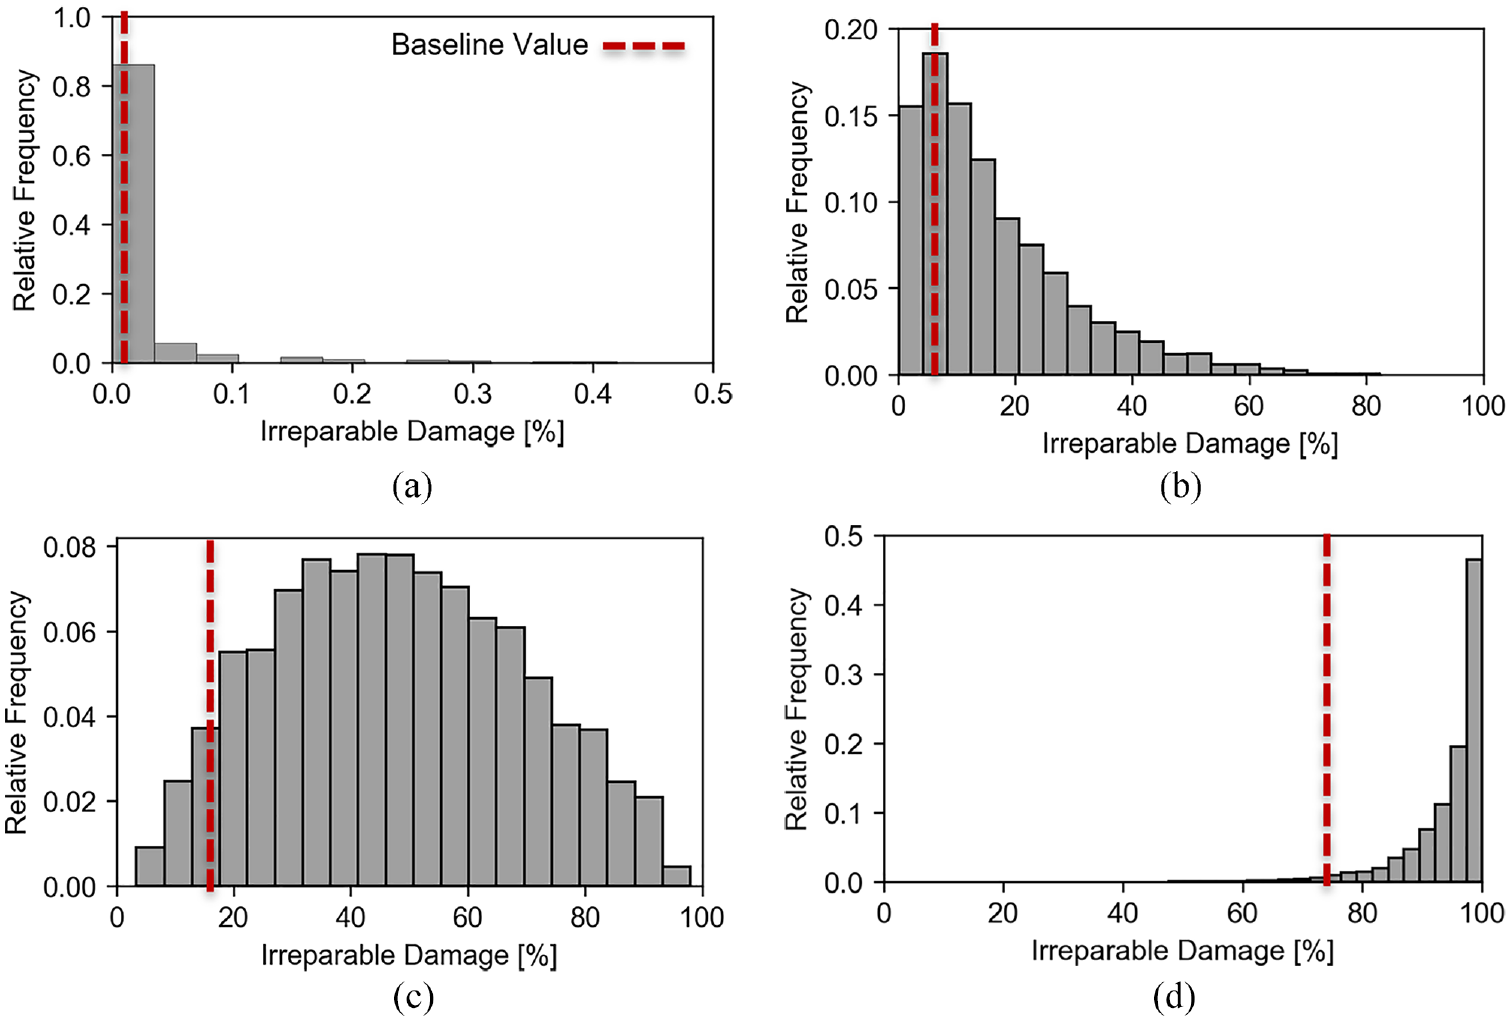
Distribution of the probability of irreparable damage across 40,000 simulations performed at four different ground shaking intensity levels: (a) 100, (b) 475, (c) 975, and (d) 2475 years.
Figure 4 highlights the significant uncertainty observed in the probability of irreparable damage when considering uncertain input variables. The probability of irreparable damage at the 100-year hazard level is negligible, that is, less than 0.1% of damage realizations are irreparable in 94% of the cases with different input parameters. With the increase in hazard level, the likelihood of building irreparability becomes more prominent. At the 2475-year intensity level, the probability of irreparable damage is more than 90% in approximately 85% of the cases. At the two intermediate return periods, the probability of irreparable damage is highly variable and ranges from approximately 0% to 70% and 10% to 90%, for 475- and 975-year intensity levels, respectively. Note that the results with the baseline value are far from the mean of the uncertain outputs, that is, using only the mean inputs does not even capture the mean outputs and leads to a biased understanding of building performance. These results confirm that the uncertainty in the input parameters listed in Table 1 can significantly affect the outputs of seismic performance assessment. The following sections identify which input variables contribute most to the uncertainty in each output measure.
Sensitivity analysis of loss estimates
This section focuses on evaluating importance measures in terms of Sobol indices for the building’s loss measures. To conduct the sensitivity analysis of the loss measures, we consider ten input variables (variables #1–#10 in Table 1), resulting in a total of 10,000 (N×np) Monte Carlo samples. The variance-based sensitivity analysis for the building’s irreparability highlights the impact of assumptions in the FEMA P-58 methodology on estimated irreparable damages caused by excessive residual drifts. Figure 5 shows the relative importance of the input variables expressed in terms of first-order Sobol indices for the probability of irreparable damage. The Sobol indices are not shown at the 100-year hazard level due to the extremely low number of irreparable cases observed. The figure indicates that with increasing hazard levels, the importance of θRF increases, accounting for ∼40% of the output variance at the highest intensity level, that is, 2475-year. On the contrary, Δy and βm, that is, additional uncertainty on demands, are the main contributors to the output variance at 475- and 975-year hazard levels and they become less important as the hazard level increases. At the 2475-year hazard level, due to high Δr, the building is most likely irreparable (refer back to Figure 4d). As stated previously, the Δr distribution is affected by input variables Δy and βm. Since the majority of demand realizations significantly exceed θRF, the results are not affected considerably by the change in the dispersion of the demand distribution at the 2475-year hazard level. However, changes in the variables corresponding to the repair fragility (θRF and σRF) can alter the median capacity and significantly influence the probability of the building’s irreparability. Note that Crep does not appear as an important parameter since it does not affect the calculation of irreparable damage.
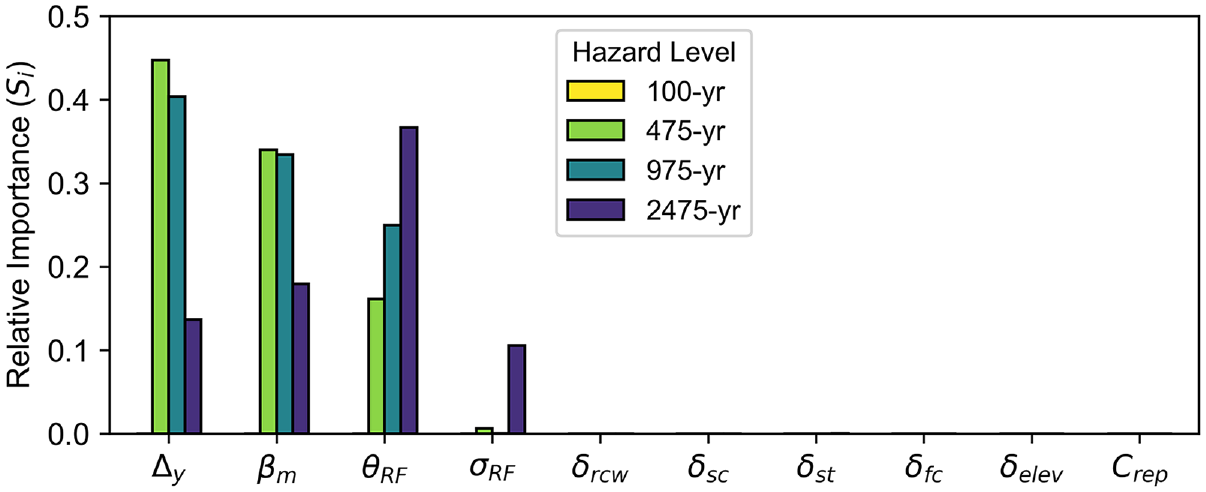
Influence of each input variable on the probability of irreparable damage at 100-, 475-, 975-, and 2475-year hazard levels.
The Sobol indices are also computed to evaluate the sensitivity of earthquake-induced repair costs to input variable assumptions. Figure 6 displays the first-order Sobol indices for the expected repair cost estimated at four ground motion shaking intensities. At the lowest intensity level, from the variables considered, the expected repair cost is largely controlled by βm and the rotation capacity of the slab–column connections (δSC). At the 475- and 975-year hazard levels, the impacts of θRF and ΔY (i.e. input variables associated with irreparable damage estimation) are important because of their substantial impact on the probability of irreparable damage (see Figure 4) and the significant contribution of losses associated with irreparable realizations to the expected repair cost. At the 2475-year hazard level, the variance in the expected repair cost can solely be attributed to the uncertainty in Crep, due to the high probability of irreparable damage, that is, it is highly probable that the building will be replaced regardless of what values are used for the other input variables.
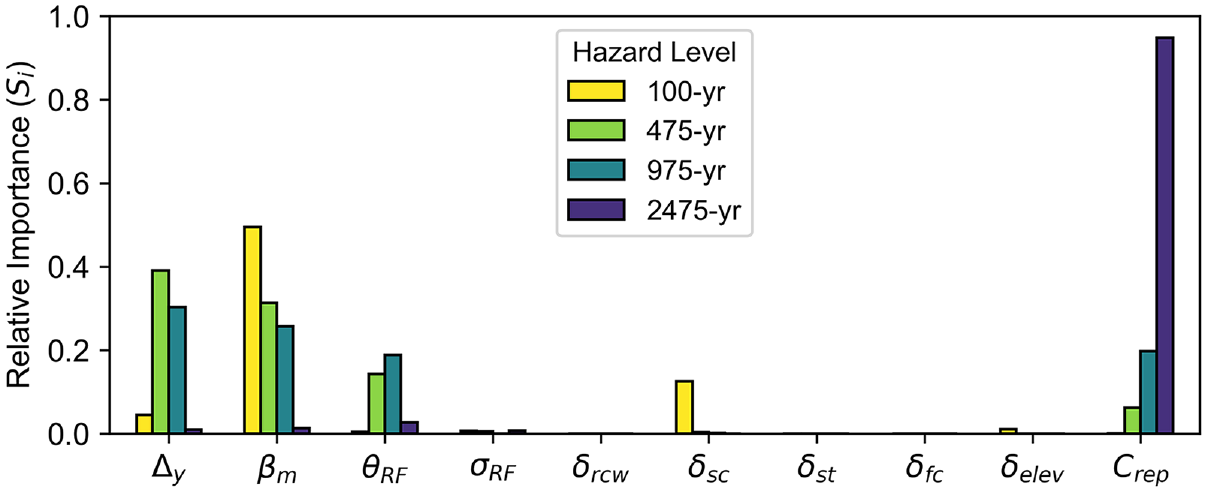
Influence of each input variable on the expected repair cost at 100-, 475-, 975-, and 2475-year hazard levels.
Sensitivity analysis of recovery time estimates
In the second sensitivity analysis, a set of 16 input variables (variables #6–#21 in Table 1) is considered in the sensitivity analysis of earthquake-induced downtime, from which the Sobol indices are derived. As discussed in the previous section, βm significantly influences demands and, consequently, loss estimates. Therefore, we excluded βm from the recovery time sensitivity analyses to ensure that the influence of the demand model does not obscure the contribution of other parameters. This exclusion allows for a clearer analysis of the importance of structural and nonstructural capacities, as well as the impact of various impeding factors on recovery time estimates. A total of 16,000 Monte Carlo samples (N = 1000, np = 16) are produced to compute first-order Sobol indices for the building’s downtime to re-occupancy and downtime to functional recovery. The input variables considered herein pertain to the estimation of repair time, delays caused by impeding factors, and the building’s reconstruction time. Figures 7 and 8 illustrate the first-order Sobol indices for the downtime to re-occupancy, and functional recovery, respectively. The figures showcase results for only the subset of impeding factor-related variables that contribute at least 2% to the total variance in the output variable (i.e. IFeng, IFCM3, IFCM4, and IFCM5 are excluded). Figure 7 indicates that the variance in downtime to re-occupancy is primarily associated with δSC, at all hazard levels but the 2475-year. For instance, at the 100-year hazard level, more than 80% of the variance in downtime to re-occupancy can be attributed to the uncertainty in δSC. This is due to two key factors. First, damage to slab–column connections in reinforced concrete shear wall buildings hinders re-occupancy. Second, each damage state of the slab–column connections is linked to distinct repair time consequence functions. Hence, δSC directly affects the time needed to be spent on repairing the slab–column connections by affecting their damage state after the earthquake. The repair time for these components is notably longer than other components that can hinder re-occupancy, such as δrcw, δst, δfc.
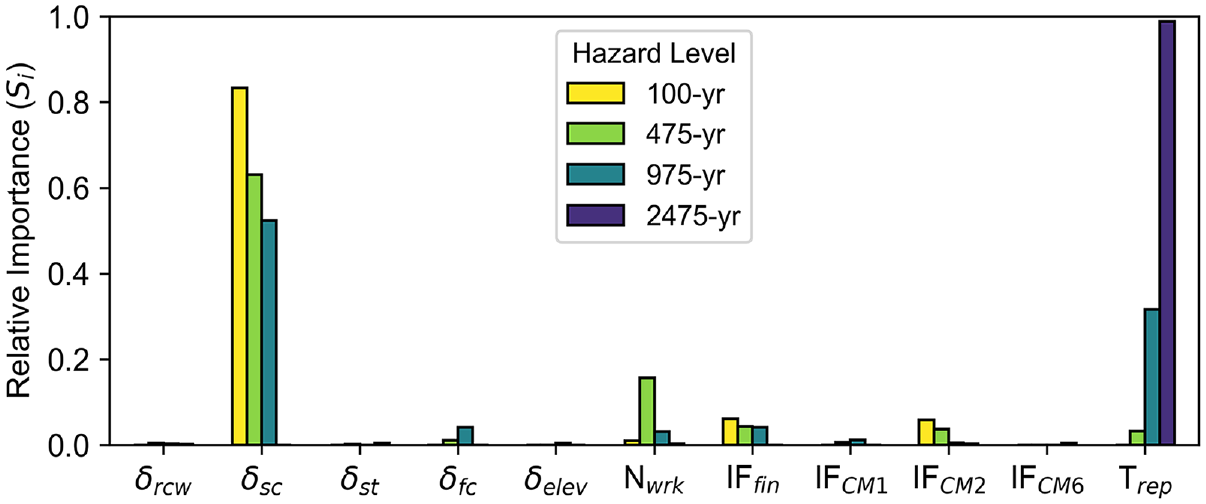
Influence of each input variable on the downtime to re-occupancy at 100-, 475-, 975-, and 2475-year hazard levels.
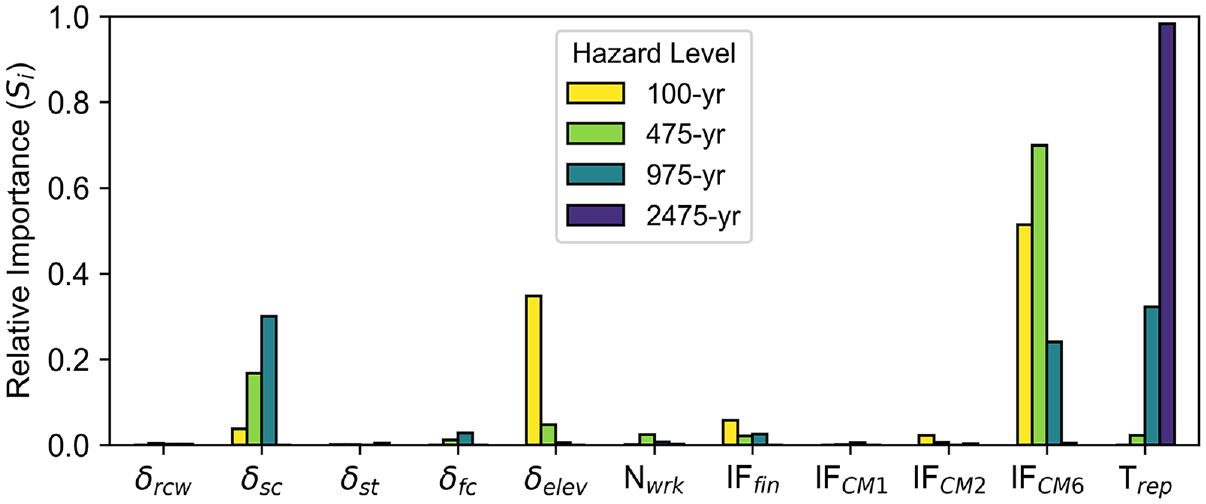
Influence of each input variable on the downtime to functional recovery at 100-, 475-, 975-, and 2475-year hazard levels.
Figure 8 suggests that the repair time and impeding factor delays associated with the elevator components significantly influence downtime to functional recovery estimates. A building’s functional recovery can only be achieved if the elevators are operational. At the 100- and 475-year hazard levels, the acceleration capacity of the elevators (δelev), and consequently the elevator damage states and corresponding repair times, as well as contractor mobilization delays for the elevator (IFCM6) have the highest impact on the downtime to functional recovery. The Sobol index for IFCM6 is negligible for the downtime to re-occupancy (Figure 7) since the repair of elevators does not impact that recovery state. At the 975-year hazard level, δSC and Trec gain importance due to high story drift demands, and the increased likelihood of irreparable damage. Analogous to the sensitivity analysis for loss measures, at the 2475-year hazard level, the variance in downtime estimates for both recovery states can primarily be linked to the uncertainty in Trec as it is highly likely that the building will need to be replaced.
Insights into higher-order sensitivity indices
When the sum of first-order indices is substantially less than one, further investigation is recommended to better understand the factors contributing to the overall variance in the output of interest. This may indicate interactions between input variables, for which total-effect (STi) and second-order Sobol (Sij) indices should be derived to investigate. If the combined impact of two input variables on the output cannot be expressed by adding their respective first-order Sobol indices, it indicates that they might interact with each other. In the following sections, we examine two illustrative examples from our case study wherein the sum of first-order indices is significantly less than one.
Probability of irreparable damage at the 2475-year hazard level
As stated previously, at the 2475-year hazard level, the variance in the probability of the building’s irreparable damage can be attributed to the uncertainties in input variables related to residual drift demands (Δy and βm) and the repair fragility (θRF and σRF). To better understand the interactions between these input variables, Figure 9 illustrates the Sobol indices calculated at the 2475-year hazard level for the input variables pertaining to the probability of the building’s irreparability, including first-order, second-order, and total-effect indices. In this case, the sum of first-order indices is 0.79, suggesting the presence of interactions among the input variables. The total amount of interactions, including second-order and higher-order, can be derived by comparing the first-order and total-effect indices. The figure demonstrates that the second-order interaction between Δy and βm, that is, the variables on the demand side, is significant and contributes to 10% of the total variance in the output. In other words, the simultaneous variation of these two variables produces an effect on the output that is not simply additive or independent of one another. In such cases, a particular combination of the variables on the demand side leads to extreme values in the probability of irreparable damage, and these extreme values cannot be sufficiently explained by solely considering the first-order effects. It is important to note that, when considering all input variables, the combined sum of first-order and second-order Sobol indices accounts for 95% of the total output variance. This highlights the insignificance of higher-order effects, as they account for only 5% of the variability observed in the output. Therefore, at high seismic hazard levels, where the probability of irreparable damage is substantial, it is essential to assess the impact of the joint behavior of input variables on the output—particularly those related to the demand, such as Δy and βm—to better understand the key factors contributing to the likelihood of irreparable damage.
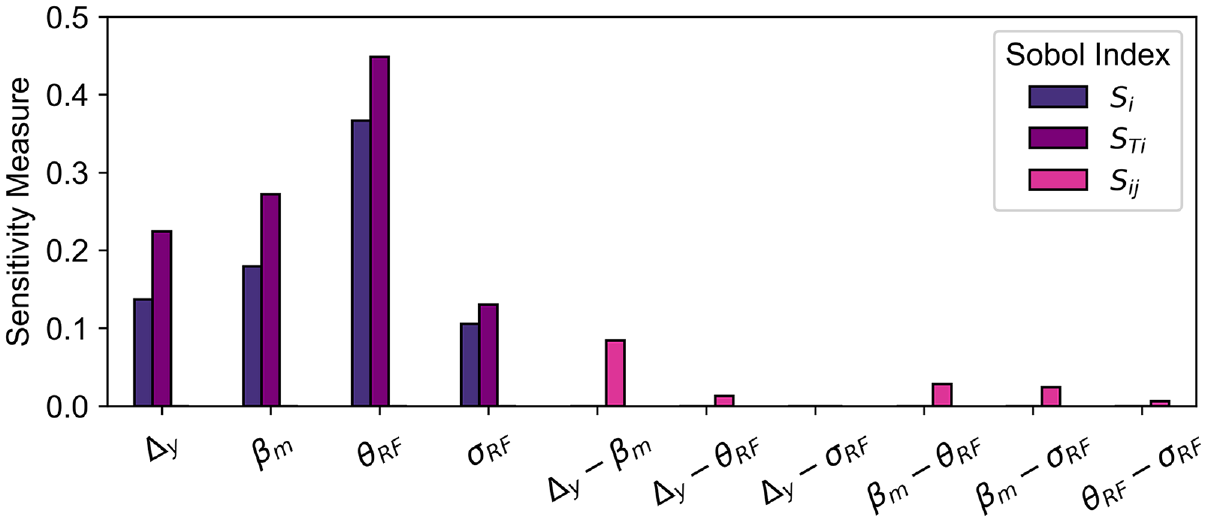
First-order (Si), second-order (Sij), and total-effect (STi) Sobol indices for the probability of irreparable damage at the 2475-year hazard level.
Expected repair cost at the 100-year hazard level
We investigate the higher-order Sobol indices for the expected repair cost under the 100-year hazard level. In this case, the sum of first-order Sobol indices is only 0.68, suggesting potential interactions between input variables lead to extreme values of the expected repair cost, as depicted in Figure 10a. The expected repair cost is calculated as a weighted average of the costs associated with repairable and irreparable damage realizations, where the repair cost for irreparable damage realizations is the same as Crep. The weights correspond to the likelihood of repairable and irreparable damage, respectively. At the 100-year hazard level, most realizations correspond to repairable damage with relatively low repair costs. Consequently, a few replacement realizations with orders of magnitude higher cost consequences can increase the expected repair cost substantially. To further examine our hypothesis regarding potential interactions and gain a deeper understanding of how extreme output values affect the Sobol indices, we artificially reduce the value of Crep. The mean of the reduced Crep is US$50/sq ft, which is still greater than the maximum repair costs obtained from repairable realizations. The upper and lower bounds of the distribution are adjusted proportionally to match the reduction ratio of the mean value, resulting in new values of US$70 and US$30/sq ft, respectively. Lowering Crep diminishes the impact of irreparable cases and, consequently, reduces the significance of the corresponding inputs. Figure 10b illustrates the βm with respect to the expected repair cost per building square footage when the reduced values are used for Crep.
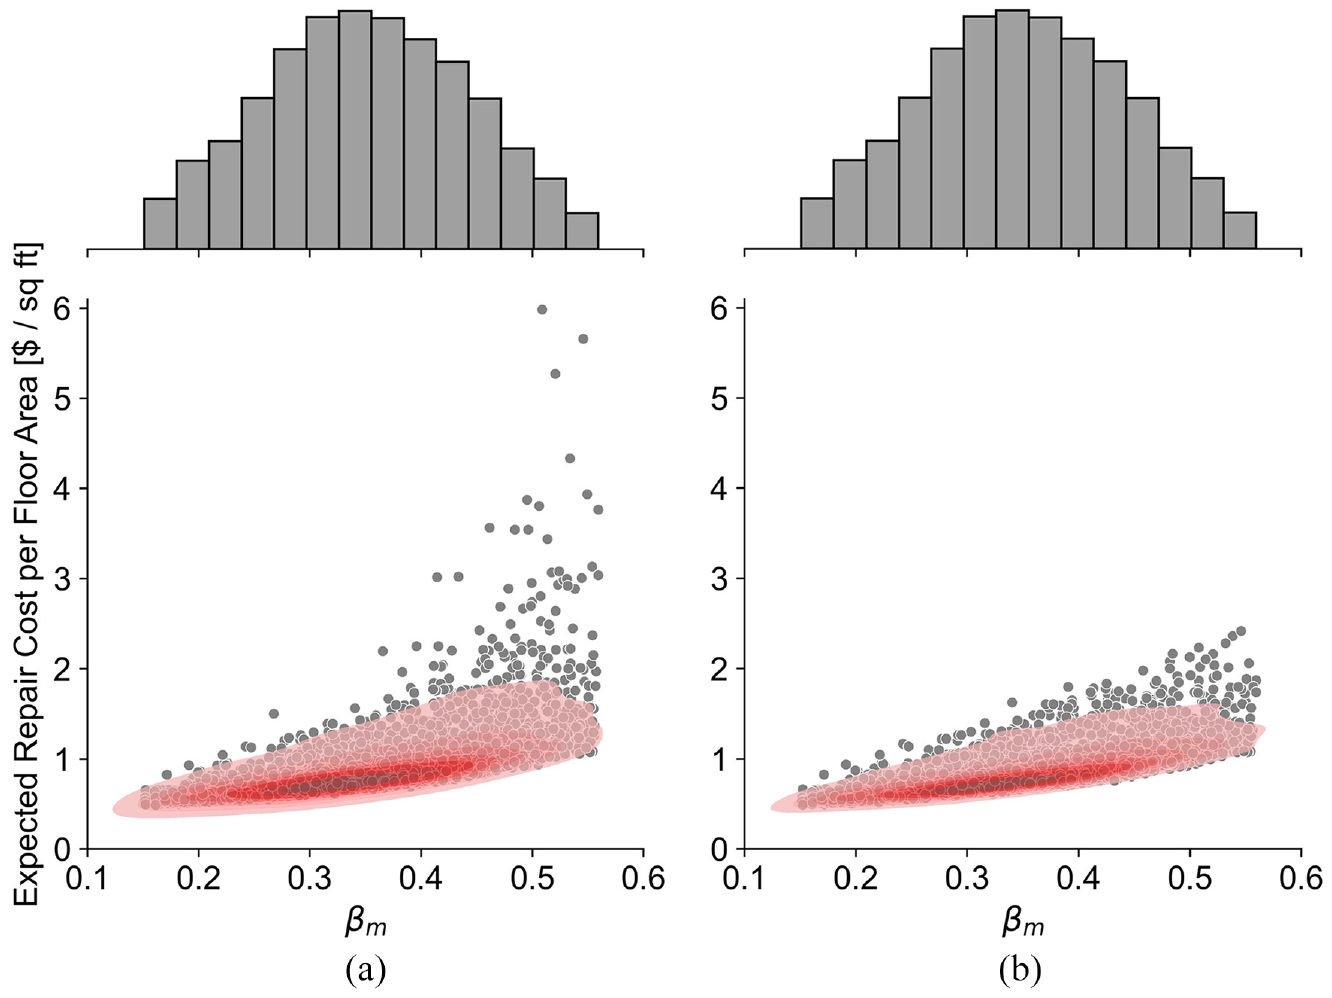
Distribution of the expected repair cost per square footage (output) against the modeling uncertainty (βm) (input) obtained across 1000 simulations using (a) the original replacement cost values and (b) reduced replacement cost values.
Figure 10 also demonstrates a KDE to visualize the joint distribution of the data in the input–output space. We use the Seaborn Python library (Waskom, 2021) to generate the approximate joint probability density contours, employing a Gaussian mixture model for the underlying distribution. A cross-section along either the x- or y-axis of the fitted KDE will yield a unique Gaussian mixture model-based probability density function. The primary purpose of utilizing a fitted KDE plot in this case is to identify potential clusters within the dataset and to detect outliers. As depicted in the figure, outlier values of the expected repair cost are evident in scenario (a) when the original Crep value is used. On the contrary, in the scenario with reduced Crep values (scenario (b)), extreme expected repair cost values are not observed. In scenario (b), the extreme data points are closer to the red contours that cover the same proportion of the joint probability mass in both subplots, while the joint distribution is highly irregular with more distant outliers in scenario (a), that is, the original scenario. After Crep was reduced in scenario (b), the sum of the first-order Sobol indices increased to 0.85. The sum of first-order indices closer to 1.0 indicates that, compared with scenario (a), first-order effects provide a better explanation of the variance in the output variable (i.e. the expected repair cost) This outcome is significantly affected by how closely the input–output joint distribution resembles a multivariate Gaussian, as illustrated in Figure 10. The difference between the two scenarios becomes more evident when βm values exceed ∼0.4, at which point extreme values are observed in the expected repair cost and these values are more exaggerated in scenario (a). βm values below 0.4 will have only a small influence on the variance in the expected repair cost, while βm values greater than 0.4 can lead to residual drift demands that trigger expensive replacement consequences and a substantial increase in expected repair costs. This influence is equally important for estimating the expected repair time.
As discussed previously, the expected repair cost at the 100-year hazard level is predominantly influenced by βm and δSC. Thus, in the next step, we specifically investigate the potential interaction of these two variables with the others that influence repair costs from irreparable damage. Figure 11 shows the first-order, and total-effect Sobol indices for the expected repair cost using the original and reduced Crep values, respectively (scenario (a) vs. scenario (b) in Figure 10). As seen in the figure, the difference between the first-order and total-effect indices is smaller when the reduced Crep (scenario (b)) value is employed. For instance, in scenario (a), the total-effect index for βm reaches 0.78, while the corresponding first-order index is 0.48, resulting in a difference of 0.3. On the contrary, in scenario (b), the total-effect and first-order Sobol indices are 0.68 and 0.58, respectively, with a difference of only 0.1. The extreme expected repair cost values discussed above introduce a large increase in the output variance when βm is above 0.4. This complex relationship between the input and output variables makes first-order sensitivity indices less effective in characterizing the sensitivity of the output to the βm input. The first-order Sobol index values for scenario (a) are smaller than those for scenario (b) because—on average—more uncertainty remains in the output when βm is a fixed value. This phenomenon can also be visually justified by referring back to Figure 10 and the definition of first-order Sobol indices. For example, in scenario (b), fixing βm across all possible input values from 0.15 to 0.55 leads to a greater expected reduction in output variance compared with scenario (a).

First-order (Si), second-order (Sij), and total-effect (STi) Sobol indices for the expected repair cost at the 100-year hazard level using the original (solid) and reduced (hatched) building replacement cost values.
Figure 11 also illustrates the second-order Sobol indices between βm and four other input variables that exhibit the highest levels of second-order interaction. As depicted in the figure, in both scenarios, the impact of input variable interactions on output variance is minimal, that is, Sij values are negligible. While, particularly in scenario (a), the considerable difference between the total-effect and first-order Sobol indices may imply an interaction between input variables, such interactions are not captured by higher-order Sobol indices. This behavior can be associated with the impact of the output distribution on Sobol indices, where the distribution contains clusters with extreme values that cannot be adequately captured by Gaussian models. This highlights the limitation of the variance-based sensitivity analysis method in such cases. Therefore, at low hazard levels, where the variation in the expected repair cost across simulations can be significant—due to a limited number of irreparable realizations compared to a majority of negligible loss realizations—conclusions about the key factors contributing to the variance in the expected repair cost cannot be drawn solely from first-order and higher-order Sobol indices and the underlying distribution of the output as well as its relationship to the inputs must also be examined.
Impact of elevator repair assumption on Sobol indices
As highlighted in the previous sections, elevator components play a pivotal role in estimating downtime to functional recovery. In this section, we delve deeper into how specific assumptions in the calculation methodology regarding elevator components significantly influence these estimates. We illustrate the potential impacts of modifying these assumptions, providing insights that can refine the models used for these components. We utilize two separate fragility functions for the traction elevator cabin and the elevator guide rail system. The first fragility function is conditioned on peak floor accelerations, whereas the second fragility function is conditioned on Δr. The fragility of the elevator guide rail system encompasses two damage states, which are associated with the realignment and replacement of rails. The original assumption is that the functional recovery of a building is hindered when either realignment or replacement of rails is necessary. To examine the influence of these crucial underlying assumptions on the input variables’ importance, we repeat the sensitivity analysis, assuming that functional recovery is not hindered when only the realignment of rails is required. No modifications are made to the fragility of the traction elevator cabin; the changes only affect IFCM6.
Figure 12 compares the first-order Sobol indices for the downtime to functional recovery considering the original and revised assumptions for elevator repair at 100- and 475-year hazard levels. The figure demonstrates that the relative importance of IFCM6 is drastically reduced at both hazard levels through the proposed modification to the elevator repair assumption. At the 100-year hazard level, the reduction in the importance of IFCM6 results in an increased importance of δelev. At the 475-year hazard level, due to increased damage to structural components, the reduction in importance of IFCM6 is approximately evenly distributed across Nwrk, δsc, and δelev. The distribution of the mean downtime to functional recovery, derived from TREADS simulations using input variable samples from the prescribed distribution (as shown in Table 1), at both hazard levels, with and without revised assumptions for elevator repair, is provided in Electronic Supplement IV.
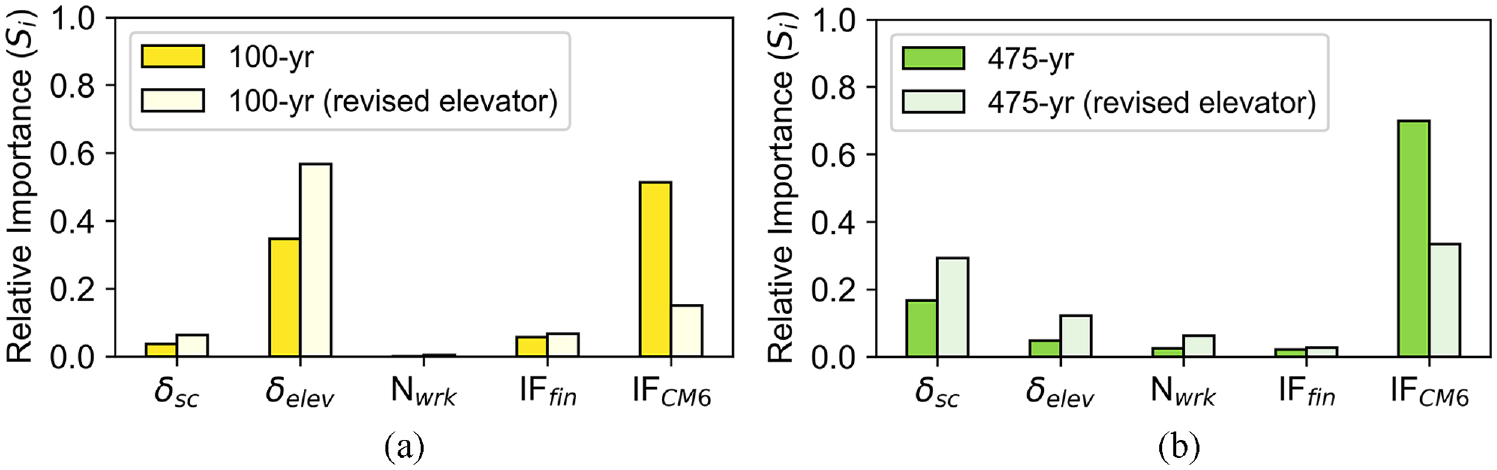
First-order Sobol indices for the downtime to functional recovery considering the original and revised elevator at the (a) 100- and (b) 475-year hazard levels.
Impact of building height on Sobol indices
We conduct sensitivity analyses on buildings with 8 and 16 stories and compare the results to those presented previously for the 12-story building to examine the impact of building height on the importance of input variables for the risk metrics considered in this study. The results are only presented for the 475-year hazard level here for brevity, but the observations remain consistent across other hazard levels. Figure 13 depicts the first-order Sobol indices for the seismic loss measures, that is, the probability of irreparable damage and expected repair cost, across building heights computed at the 475-year hazard level. The figure reveals a consistent trend in the first-order Sobol indices across different building heights, thereby leading to a similar conclusion regarding the ranking of the input variables.
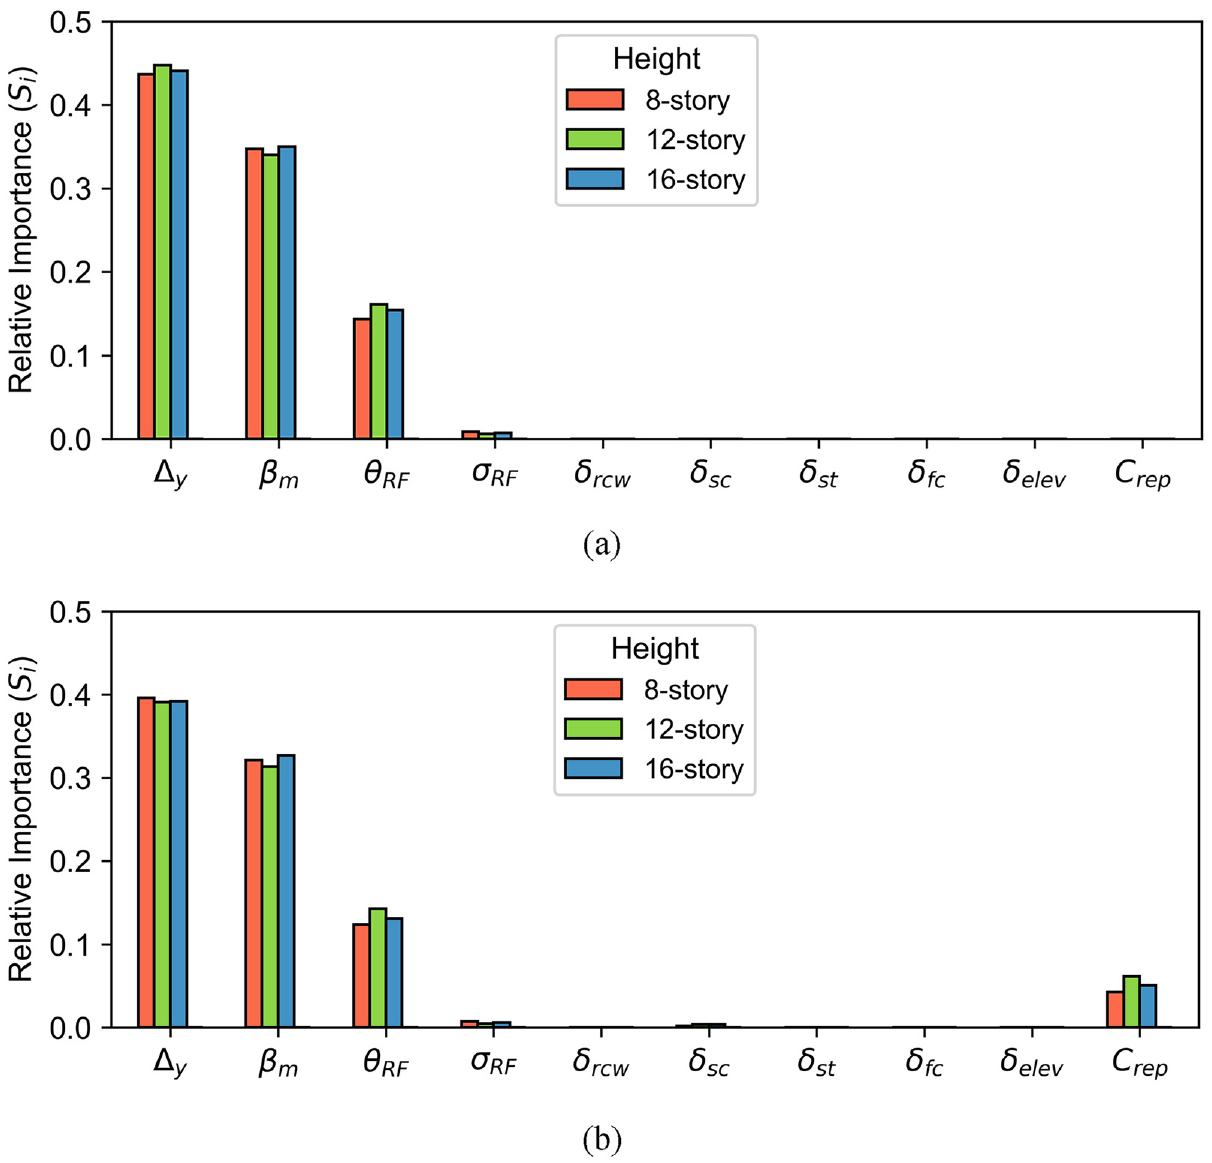
First-order Sobol indices for (a) the probability of irreparable damage and (b) The expected repair cost across building heights at the 475-year hazard level.
Figure 14 presents a comparison of first-order Sobol indices for the downtime to re-occupancy and downtime to functional recovery. While the overall trend remains similar across different heights, specific differences warrant further discussion, particularly for the downtime to functional recovery. Figure 14b shows a considerable reduction in the relative importance of IFCM6 and δelev for the 16-story archetype. The reduction in the importance of nonstructural component repairs, that is, elevators, increases the importance of structural repairs, that is, δsc and Nwrk. The primary cause of this phenomenon is the higher number of damaged structural components in the 16-story archetype compared with archetypes with lower heights. This increase in damaged units affects the number of workers involved in repairs, leading to longer repair time and, consequently, impacting the downtime to functional recovery. Due to the higher number of component units in the 16-story archetype, the first-order effects can only explain a part of the total variance in downtime estimates. The sum of first-order Sobol indices is 0.87 for the 16-story building and 0.99 for the other two archetypes. Interactions between variables generate the remaining 0.13 fraction of the total variance for the 16-story building. Such interactions can be investigated with higher-order Sobol indices. The increased influence of such interactions can partially explain the reduction in the relative importance of IFCM6 and δelev.
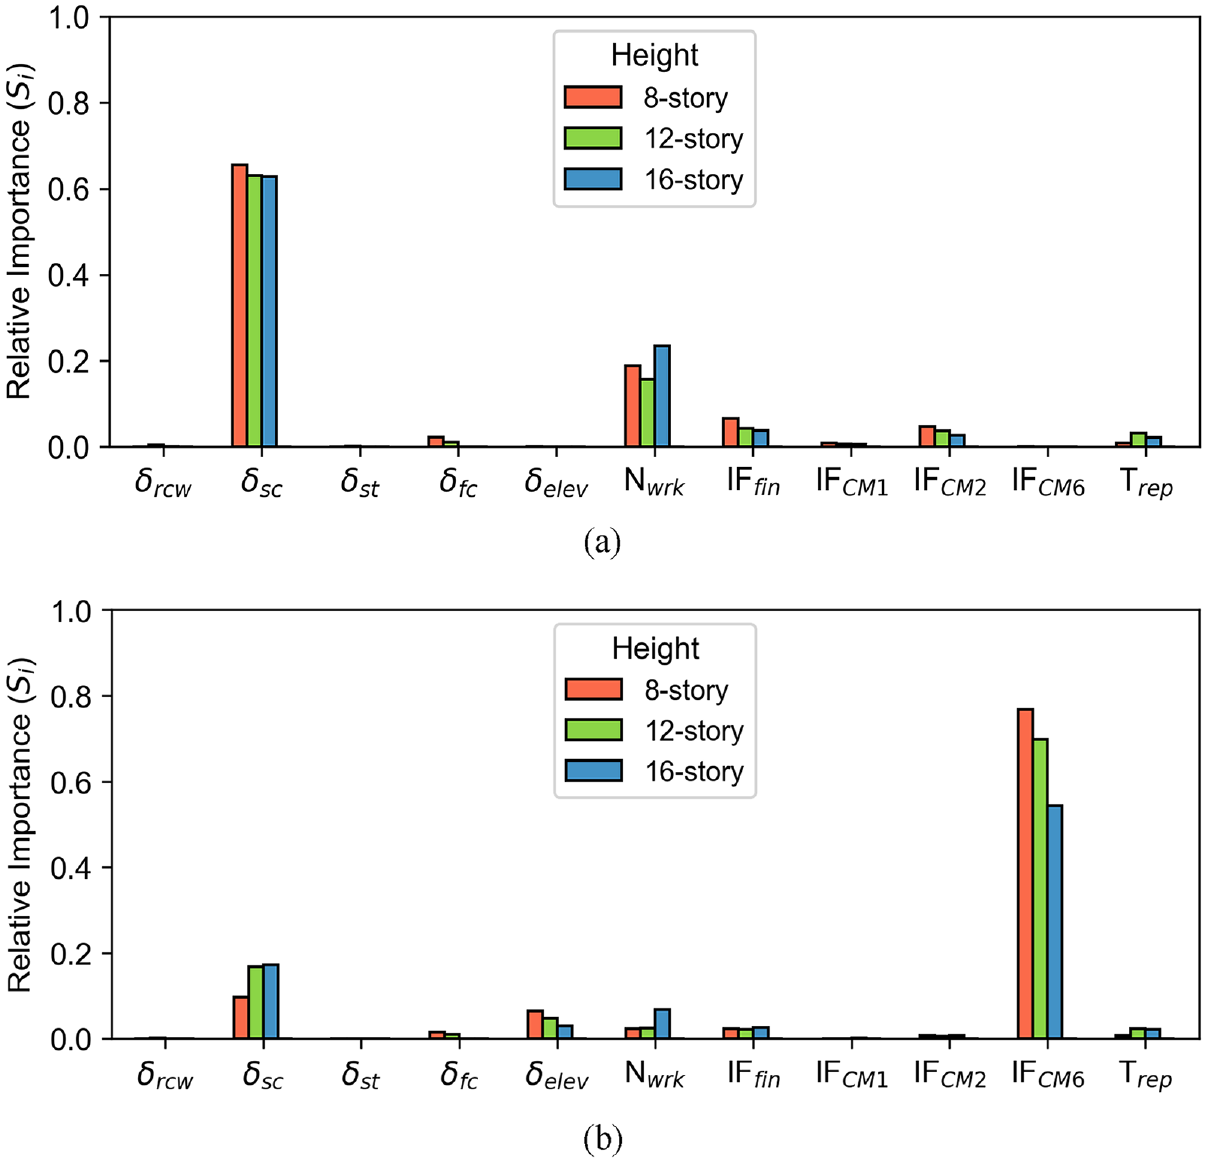
First-order Sobol indices for (a) downtime to re-occupancy and (b) downtime to functional recovery across building heights at the 475-year hazard level.
Conclusion and discussion
In this article, we introduce a methodological approach to evaluate the impact of uncertainties in input variables on estimates of earthquake-induced economic loss and recovery time within the performance-based earthquake engineering framework. The proposed methodology utilizes a variance-based sensitivity analysis, which incorporates uncertainties in assumptions related to the demand model, fragility functions, replacement consequences, and impeding factor delays. Per this methodology, first-order Sobol indices are derived to quantify the relative importance of input variables in contributing to the output variance. Total-effect and higher-order Sobol indices are computed to investigate potential interactions between input variables and identify all factors influencing the outputs. The output variables encompass four distinct risk metrics, namely, the probability of irreparable damage, the expected repair cost, downtime to re-occupancy, and downtime to functional recovery. For conducting sensitivity analyses, this study leverages a dataset of modern high-rise reinforced concrete shear wall buildings ranging from 8 to 16 stories in height in Seattle, WA subjected to earthquake ground motion records representing 100-, 475-, 975-, and 2475-year hazard levels consistent with the 2014 US National Seismic Hazard Model. The assessment results are presented individually for four hazard levels to highlight the influence of various assumptions on the outcomes across different levels of ground shaking.
The findings show that the variance in the probability of irreparable damage is primarily governed by the building’s yield drift ratio and the modeling uncertainty at all hazard levels except the 2475-year hazard level, where the median and dispersion of the repair fragility become significant. At this hazard level, the median of the repair fragility contributes to nearly 40% of the variance in the output. The variance in the expected repair cost is primarily influenced by the modeling uncertainty and the rotation capacity of the slab–column connections at the 100-year hazard level. However, at the 475- and 975-year hazard levels, the median of the repair fragility and yield drift ratio have notable impacts due to their significant influence on the probability of irreparable damage. The variance in downtime to re-occupancy and downtime to functional recovery is dominated by the uncertainty in the repair time of structural components, that is, slab–column connections, and nonstructural components, that is, elevators, respectively, at both 100- and 475-year hazard levels. Due to elevated structural damage levels observed at the 975-year hazard level, the variance in both recovery time estimates is governed by the uncertainty in the repair time of slab–column connections and the building’s reconstruction time. At the 2475-year hazard level, the variance in the expected repair cost and downtime estimates is solely impacted by the uncertainty in the building’s replacement consequences, that is, the replacement cost and time, due to the high probability of irreparable damage. A comparison of sensitivity analysis results across different building heights reveals that the trend between input variables’ importance remains similar except for the downtime to functional recovery. Regarding this recovery metric, the increased size and additional quantities of structural components in the 16-story archetype result in the increased importance of variables related to structural components’ damage, particularly slab–column connections. This also amplifies the importance of potential interactions between the input variables.
It is essential to further investigate the various factors contributing to the variance in the output of interest when the sum of first-order indices is substantially less than one. In such cases, to gain a more comprehensive understanding, higher-order Sobol indices, along with the underlying distribution of the output and its relationship to the inputs, should be carefully examined. For instance, for the probability of irreparable damage at the 2475-year hazard level, the second-order interaction between the input variables constitutes a significant proportion of the total variance in the output. Input variables on the demand side, that is, the yield drift ratio and the modeling uncertainty, are found to have a particularly strong influence on those results. On the contrary, at the 100-year hazard level, there is no significant contribution from the interaction between input variables to the variance in the expected repair cost. However, the strongly non-Gaussian distribution of the output leads to a misleading indication of interaction between inputs, highlighting the limitation of the variance-based sensitivity analysis method in certain scenarios.
This study offers valuable insights regarding the parameters that warrant greater attention when estimating earthquake-induced economic loss and downtime. Depending on a ground motion intensity level, an engineer or a risk modeler may conduct an in-depth examination of critical assumptions related to the pivotal parameters influencing loss and recovery time. This process facilitates the refinement of their models and enables a deeper investigation into the fundamental assumptions that underlie them. The results presented herein are contingent on the selection of specific input parameters, which may not encompass all the parameters influencing loss and downtime estimates. The findings of this study should not be regarded as absolute, but rather as a roadmap for further investigation into the underlying key assumptions of seismic risk assessments. Although this study has focused on modern residential reinforced concrete shear wall buildings, the methodology employed is generic and can be extended to buildings with various structural systems, and occupancy types. In such cases, it is anticipated that other critical structural and nonstructural components will emerge as governing factors in estimating various seismic risk metrics. Finally, it is important to note that the specific outcomes of this study on recovery measures are exclusively based on the use of the TREADS framework. Different recovery assessment frameworks, with their unique underlying assumptions, may lead to different findings.
Footnotes
Acknowledgements
The authors thank Nasser Marafi (Moody’s) for sharing the structural analysis results of the case study building used in this article.
Declaration of conflicting interests
The author(s) declared no potential conflicts of interest with respect to the research, authorship, and/or publication of this article.
Funding
The author(s) disclosed receipt of the following financial support for the research, authorship, and/or publication of this article: This research was funded by Canada’s Natural Sciences and Engineering Research Council under Discovery Grant No. RGPIN- 2019-04599. Contributions by Adam Zsarnóczay were supported by the National Science Foundation under Grant Nos 1621843 and No. 2131111. Any opinions, findings, conclusions, or recommendations expressed in this material are those of the authors and do not necessarily reflect the views of the collaborators or sponsoring agencies.
Data and resources
The electronic supplement compiled as a companion to this paper can be found in the following DesignSafe repository at ![]() . The electronic supplement includes the following:
. The electronic supplement includes the following:
(I): Sobol indices calculation procedure
(II): Input variable sampling distributions
(III): Distribution of outputs of interest
(IV): Distribution of downtime to functional recovery with and without revised elevator repair assumption
Supplemental material
Supplemental material for this article is available online.